
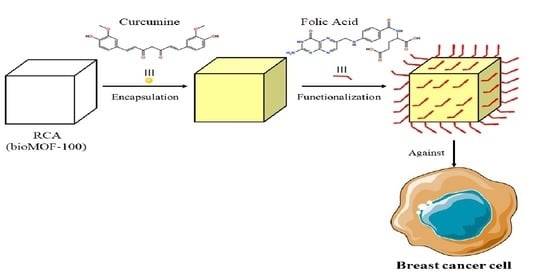
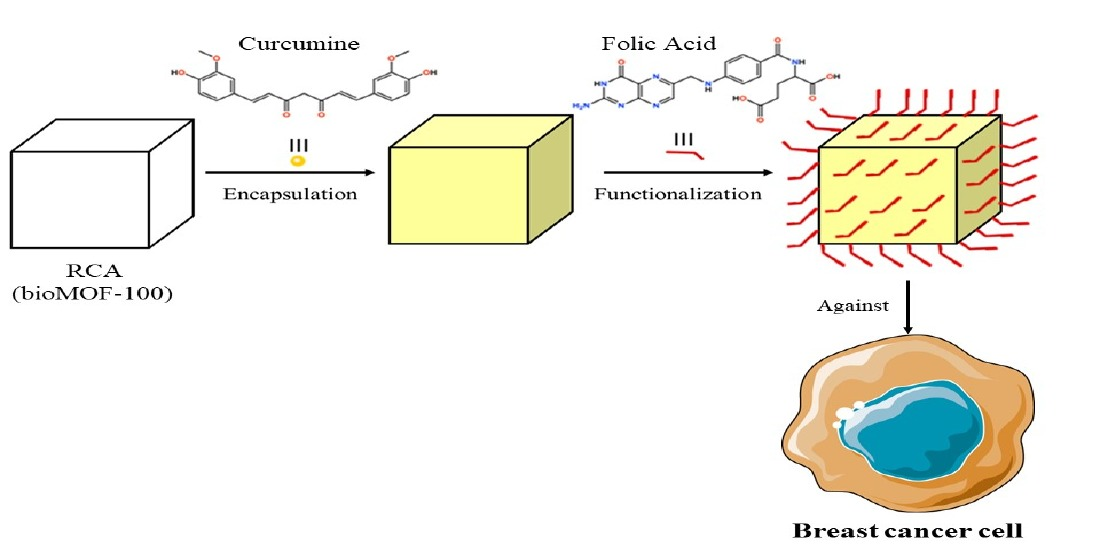
Fabrication of Functional bioMOF-100 Prototype as Drug Delivery System for Breast Cancer Therapy
 ,
,  , and
, and
Abstract
:
1. Introduction
2. Materials and Methods
2.1. Materials and Physical Techniques
2.2. Synthesis of RCA
2.3. Computational Methodology
2.3.1. Analysis In Silico and Polymorphs
2.3.2. Molecular Docking
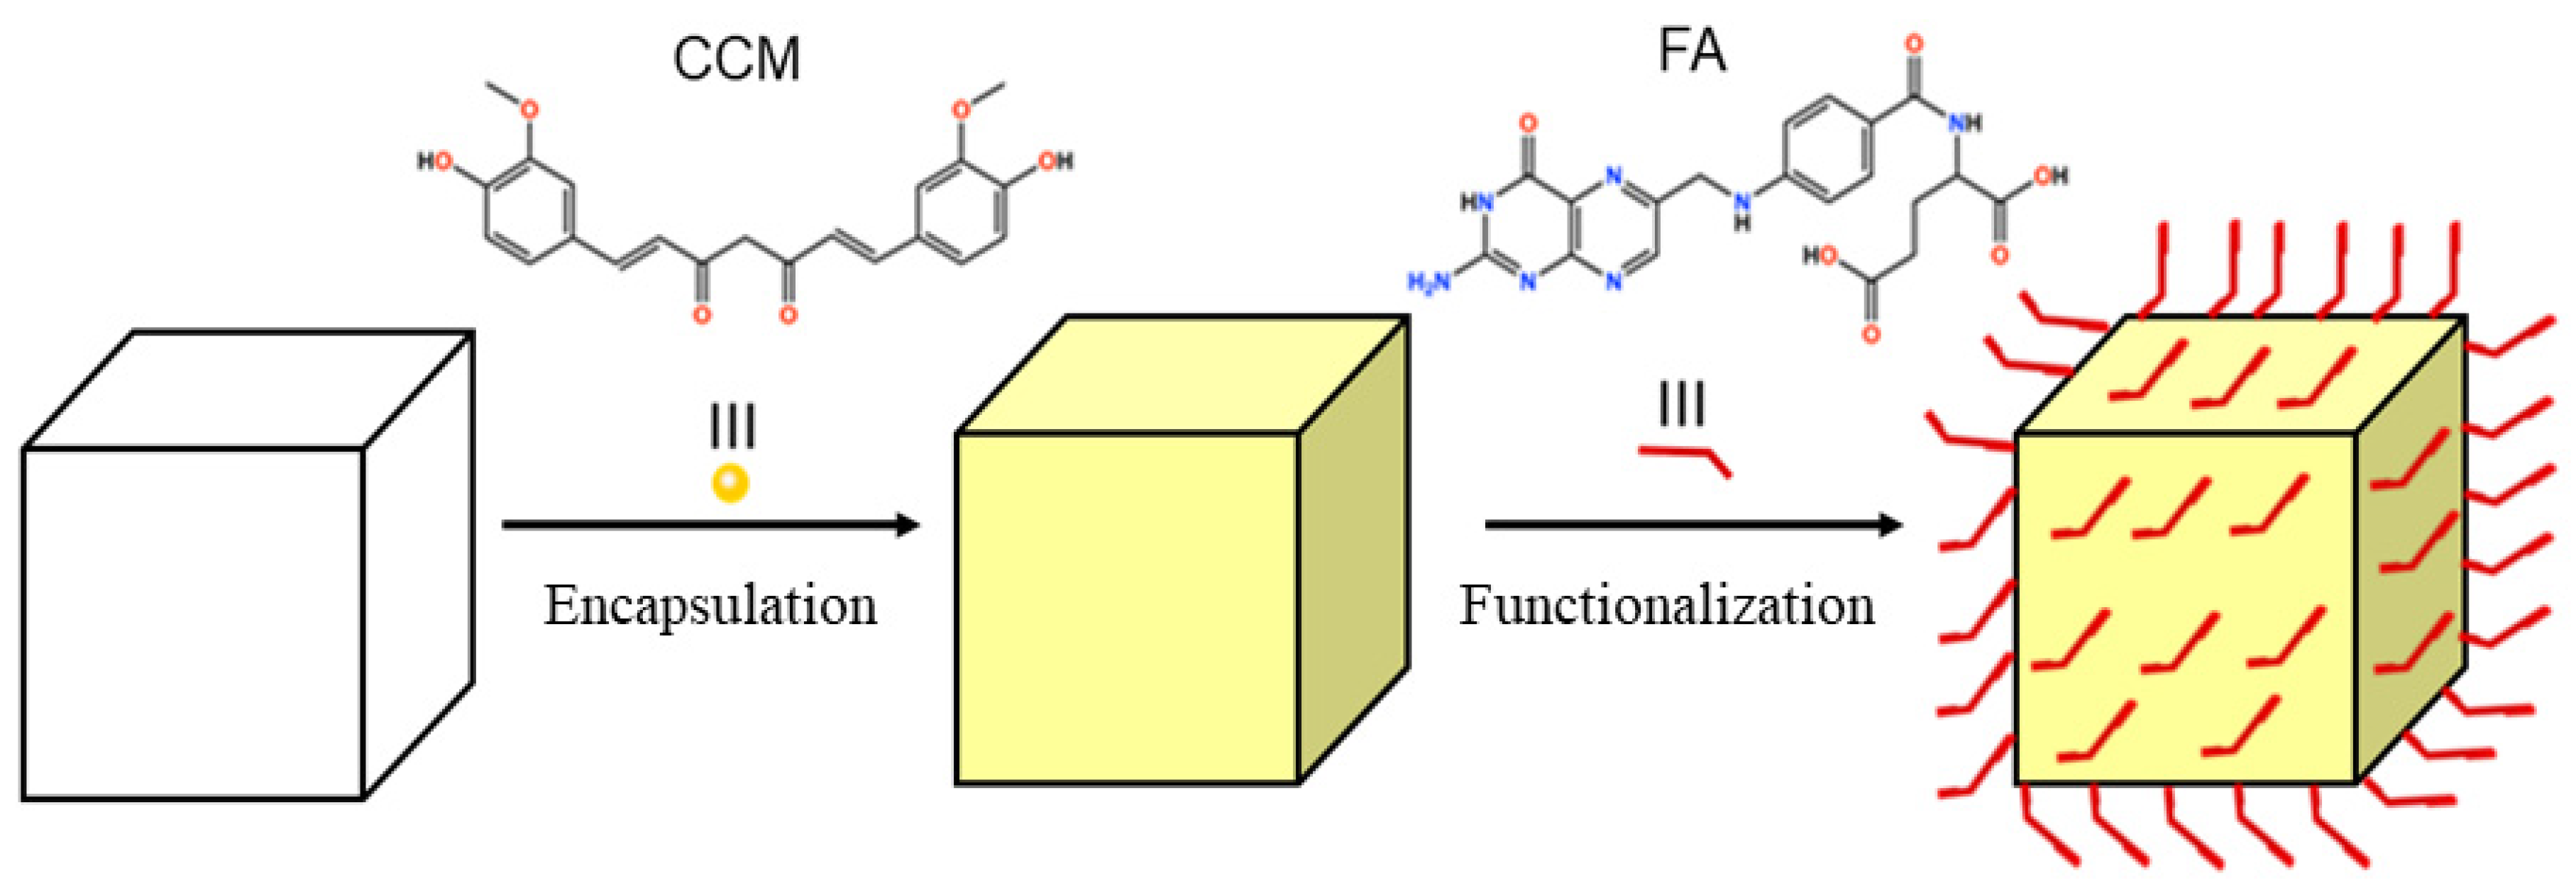
2.4. Incorporation of Curcumin into RCA
2.5. Estimation of Drug Loading
2.6. Post-Synthetic Modification with Folic Acid
2.7. In Vitro Release Studies at pH-Controlled Conditions
2.8. Cell Line and Culture Maintenance
2.9. Cell Viability Assay
2.10. Type of Cell Death Evaluated by Flow Cytometer
3. Results and Discussion
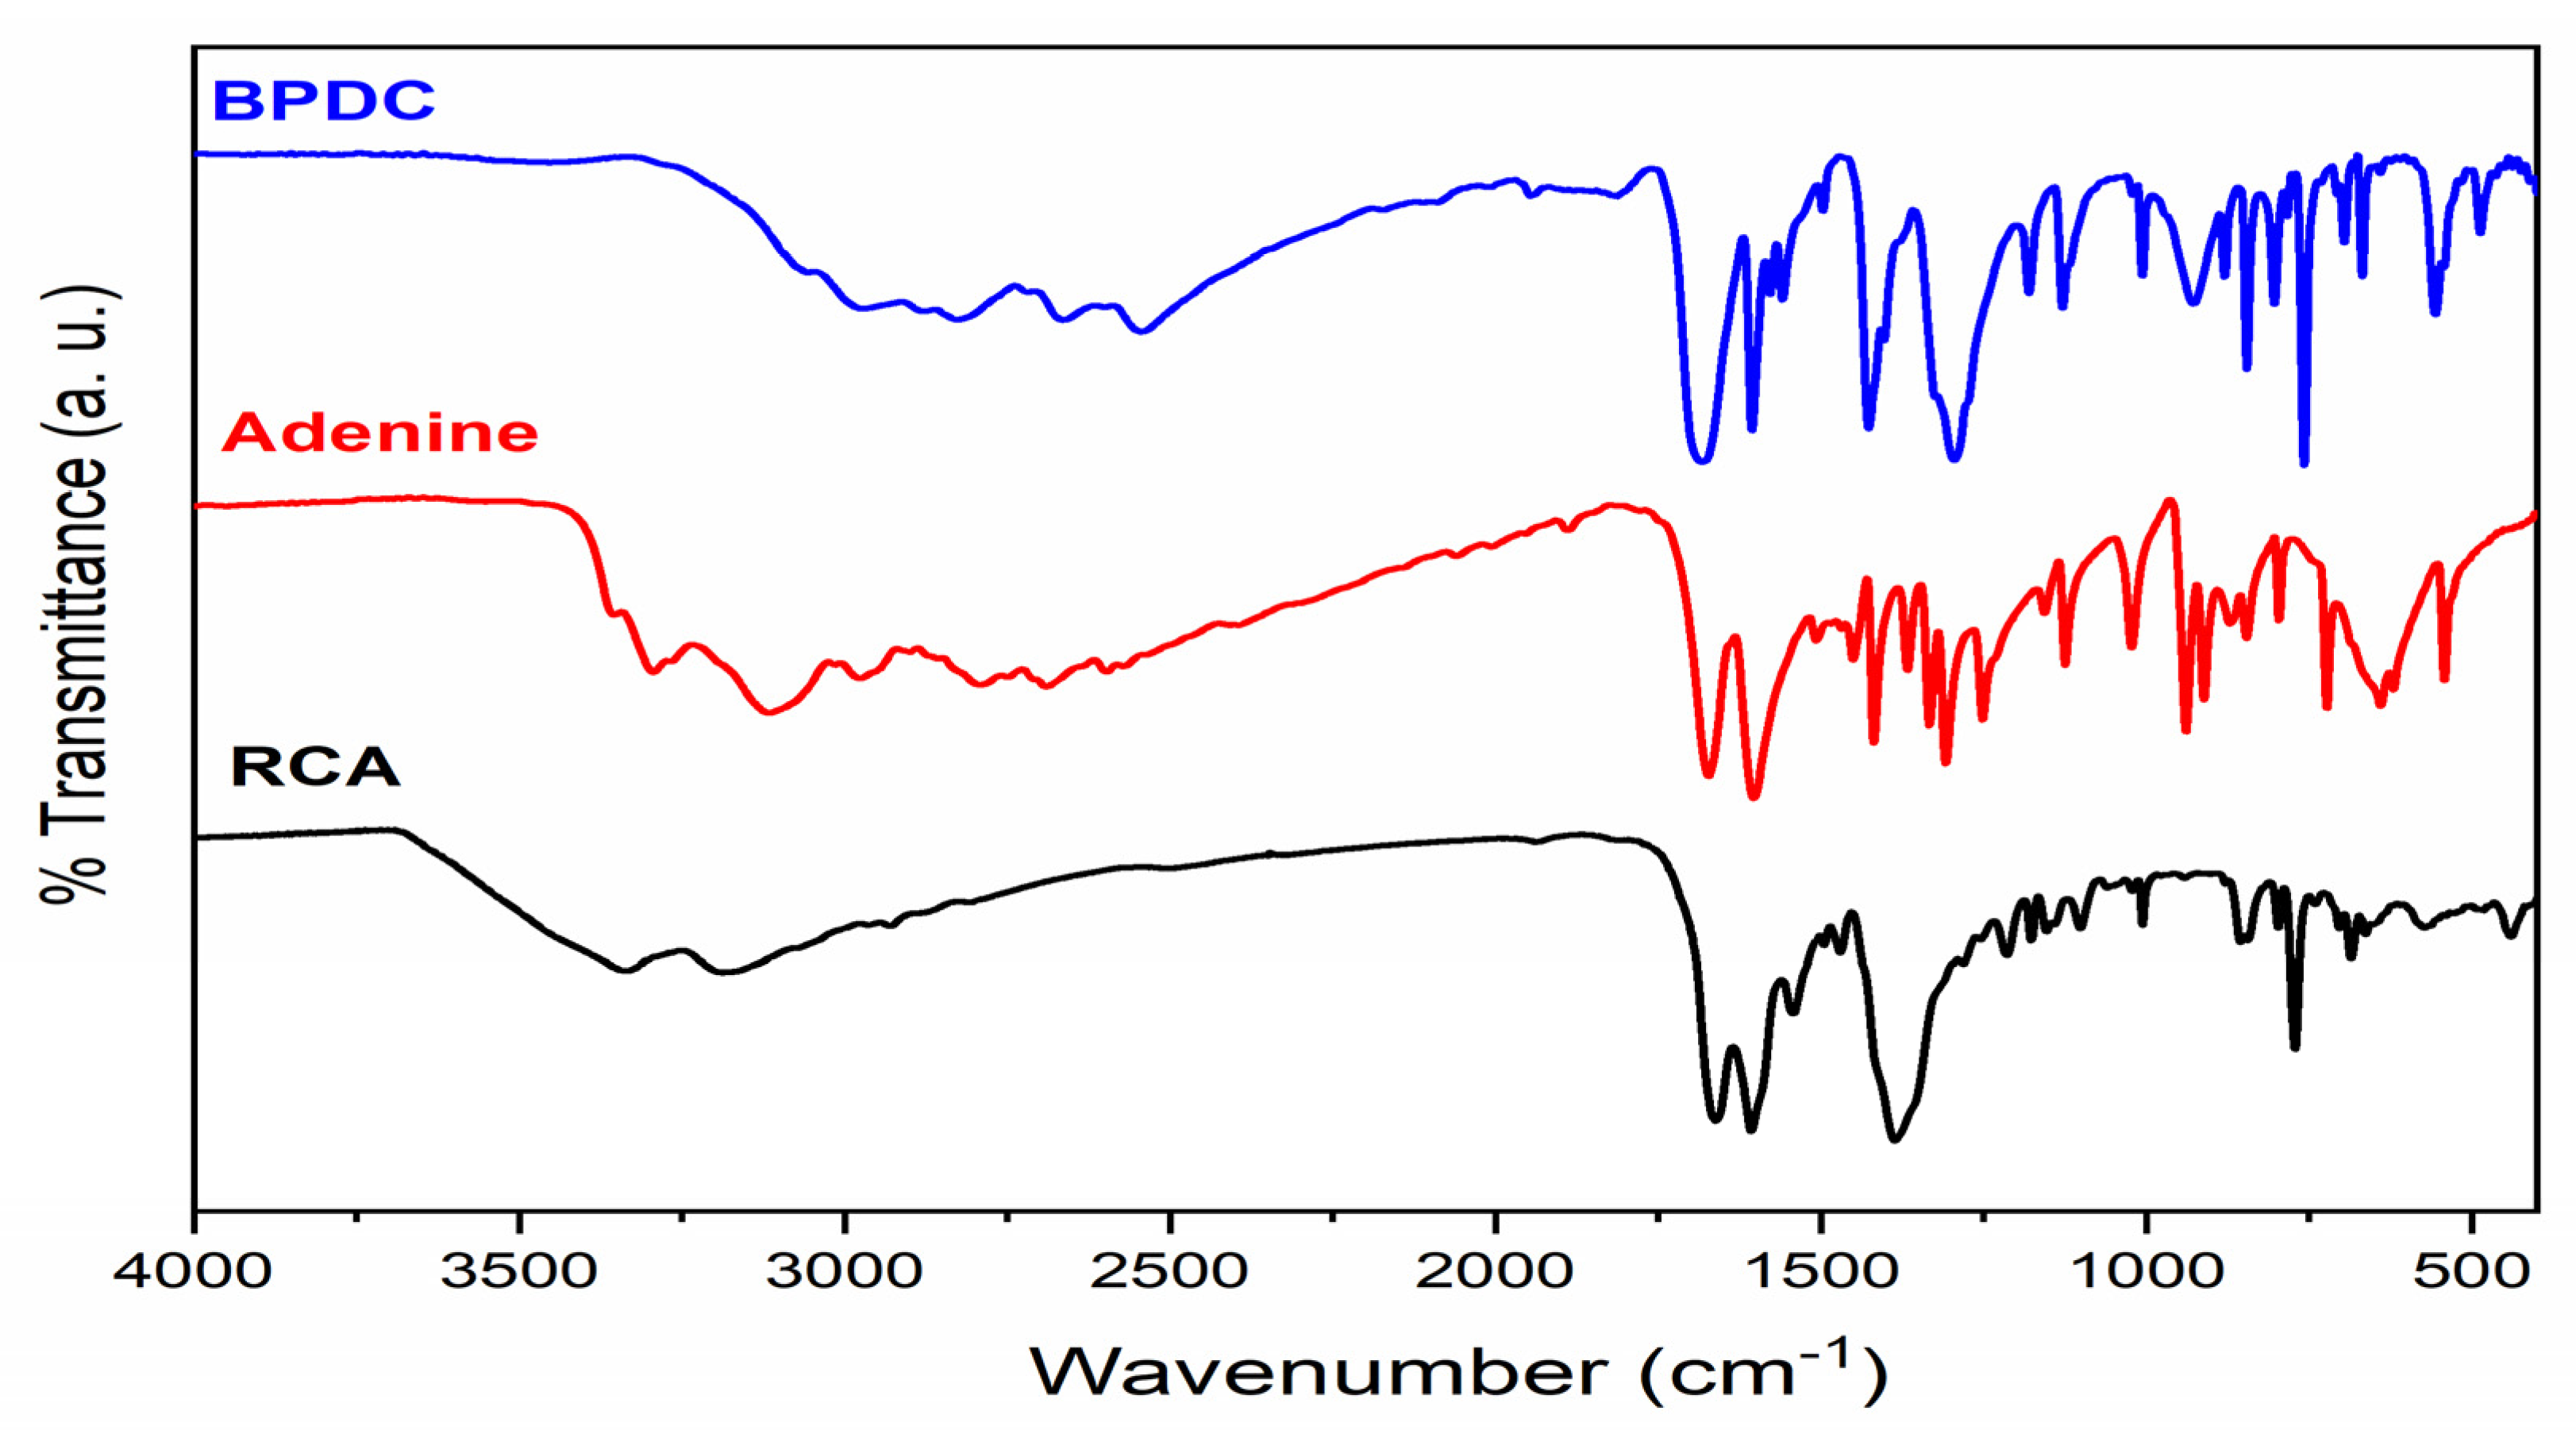
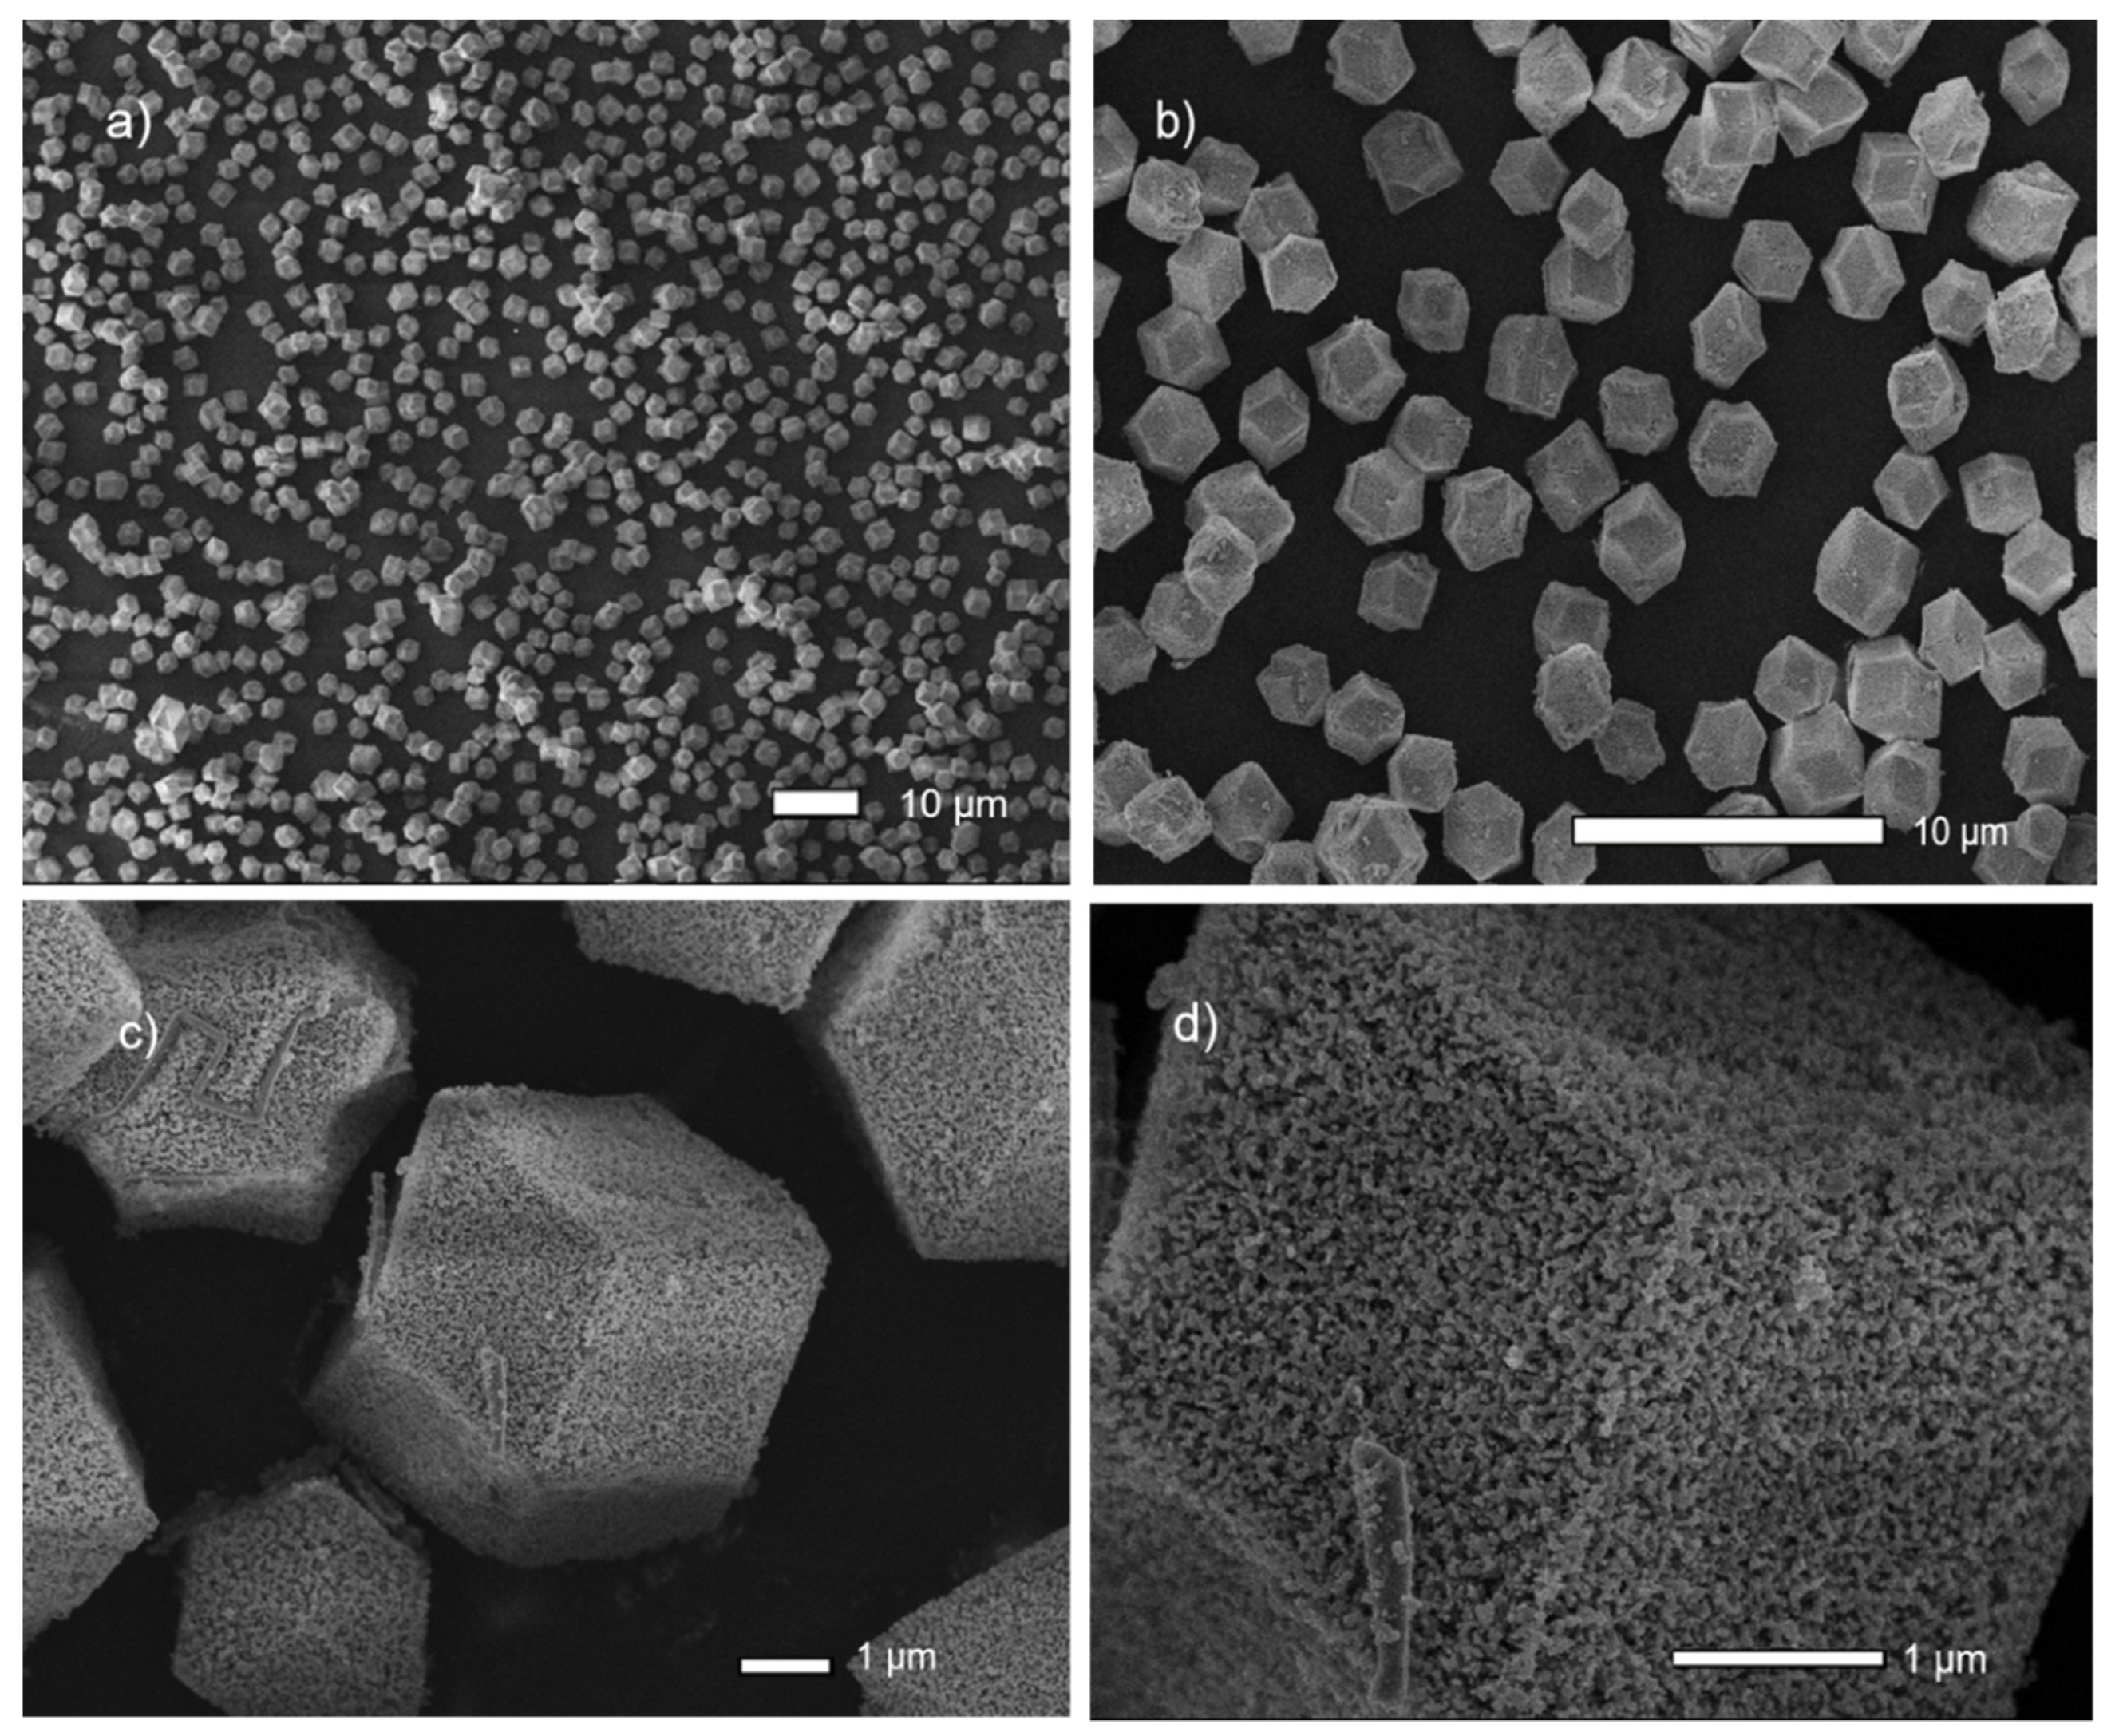
3.1. RCA Compound Characterization
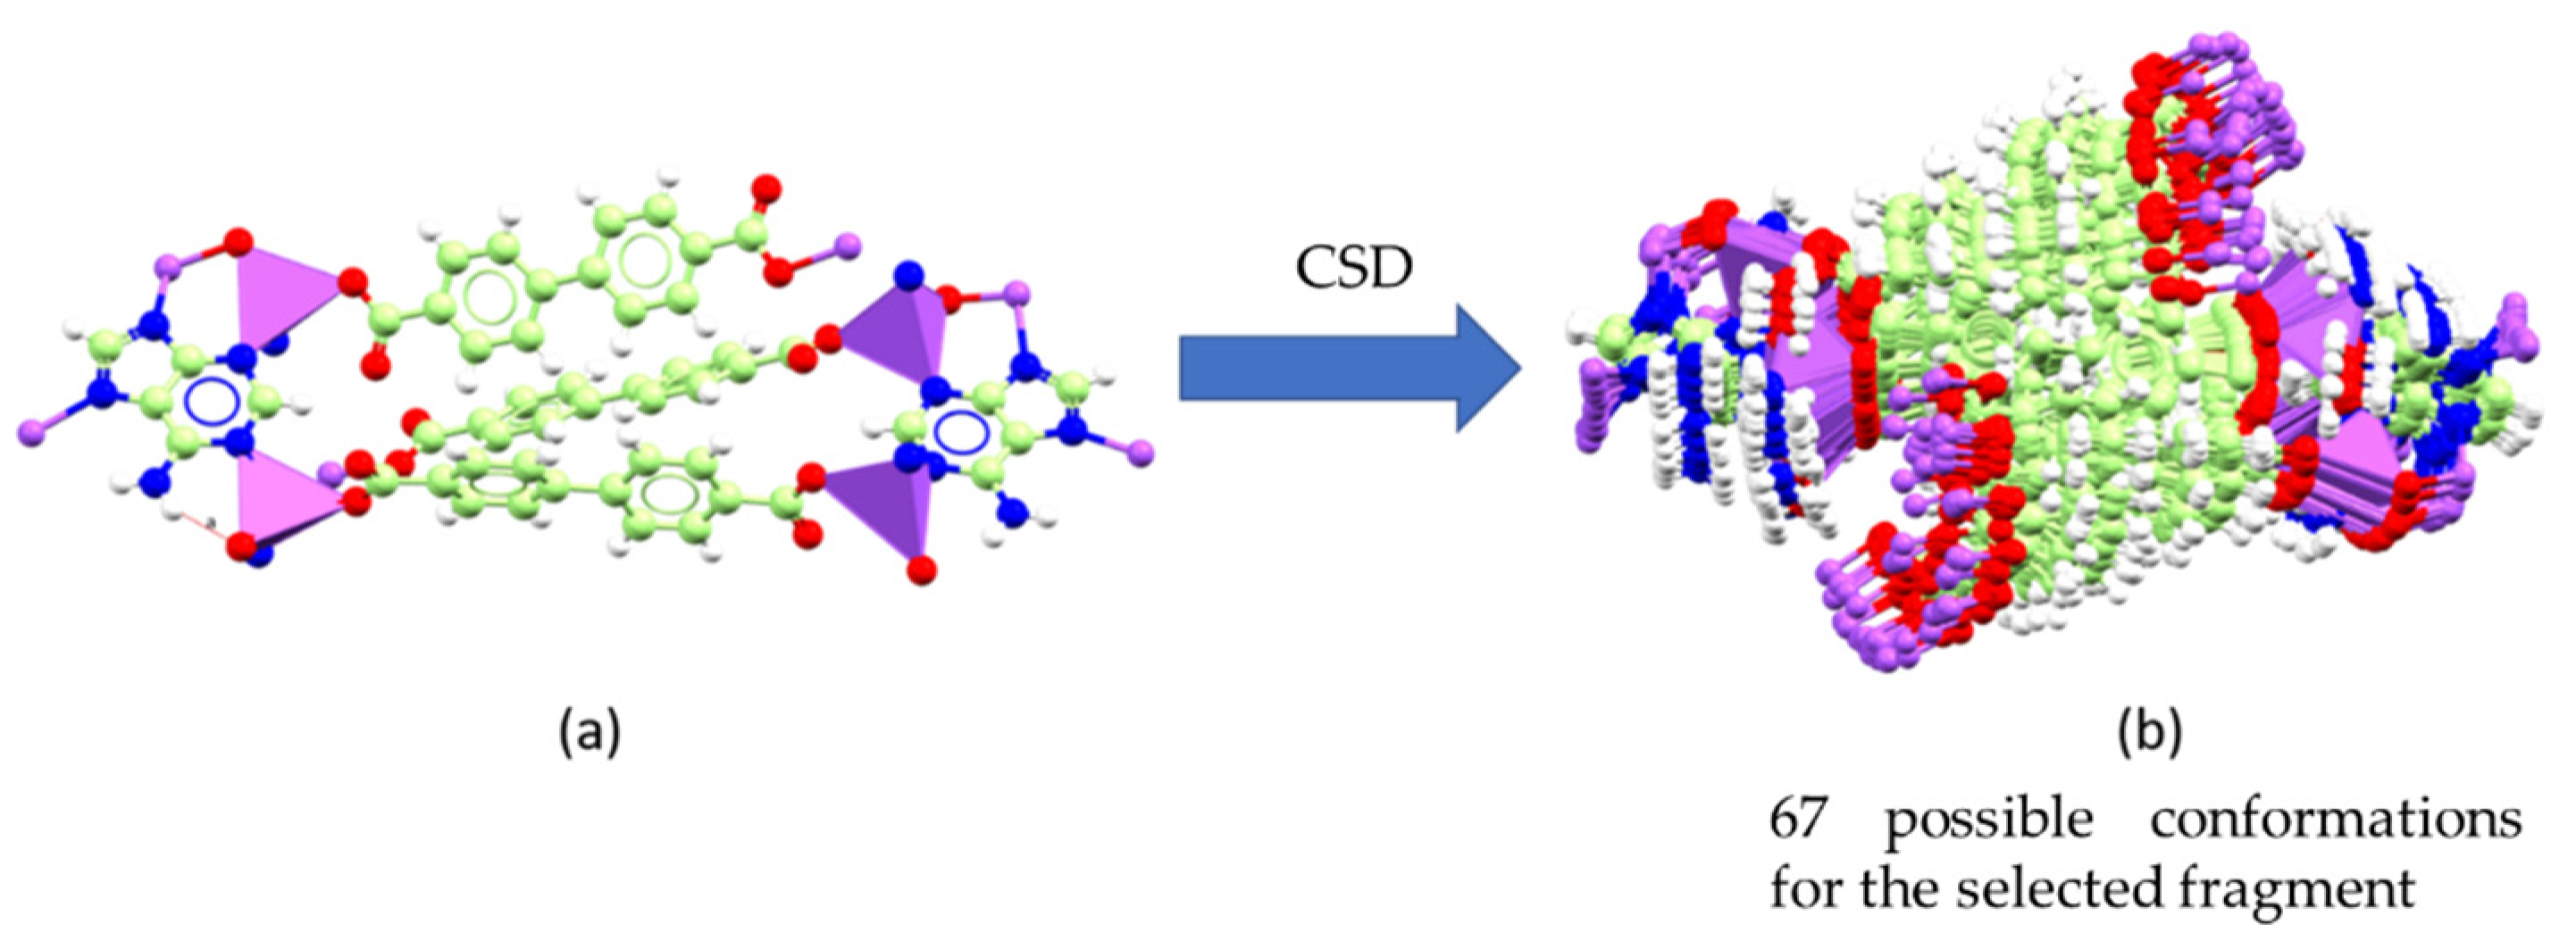
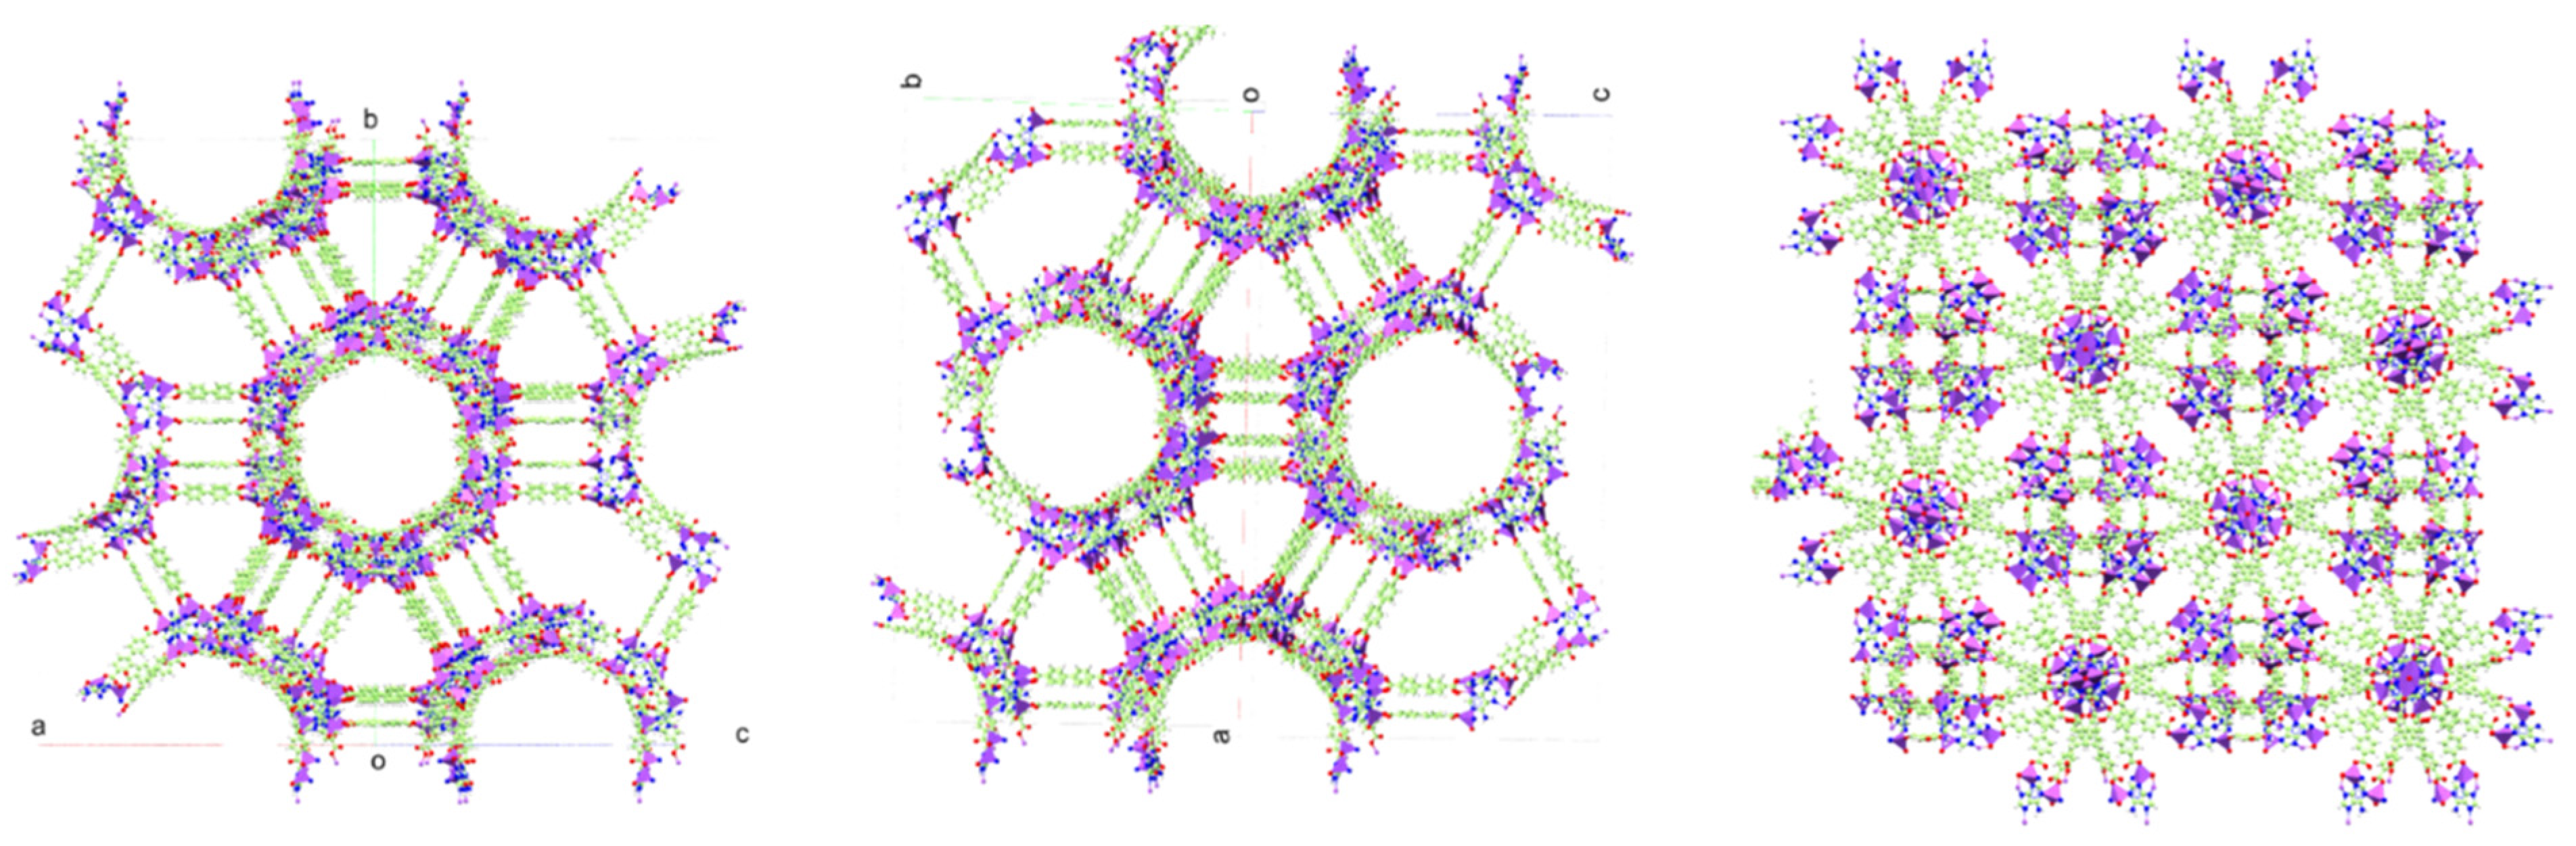
3.2. The Structural Proposition of RCA Using the Computational Method
3.2.1. Polymorphs Prediction for the bioMOF-100
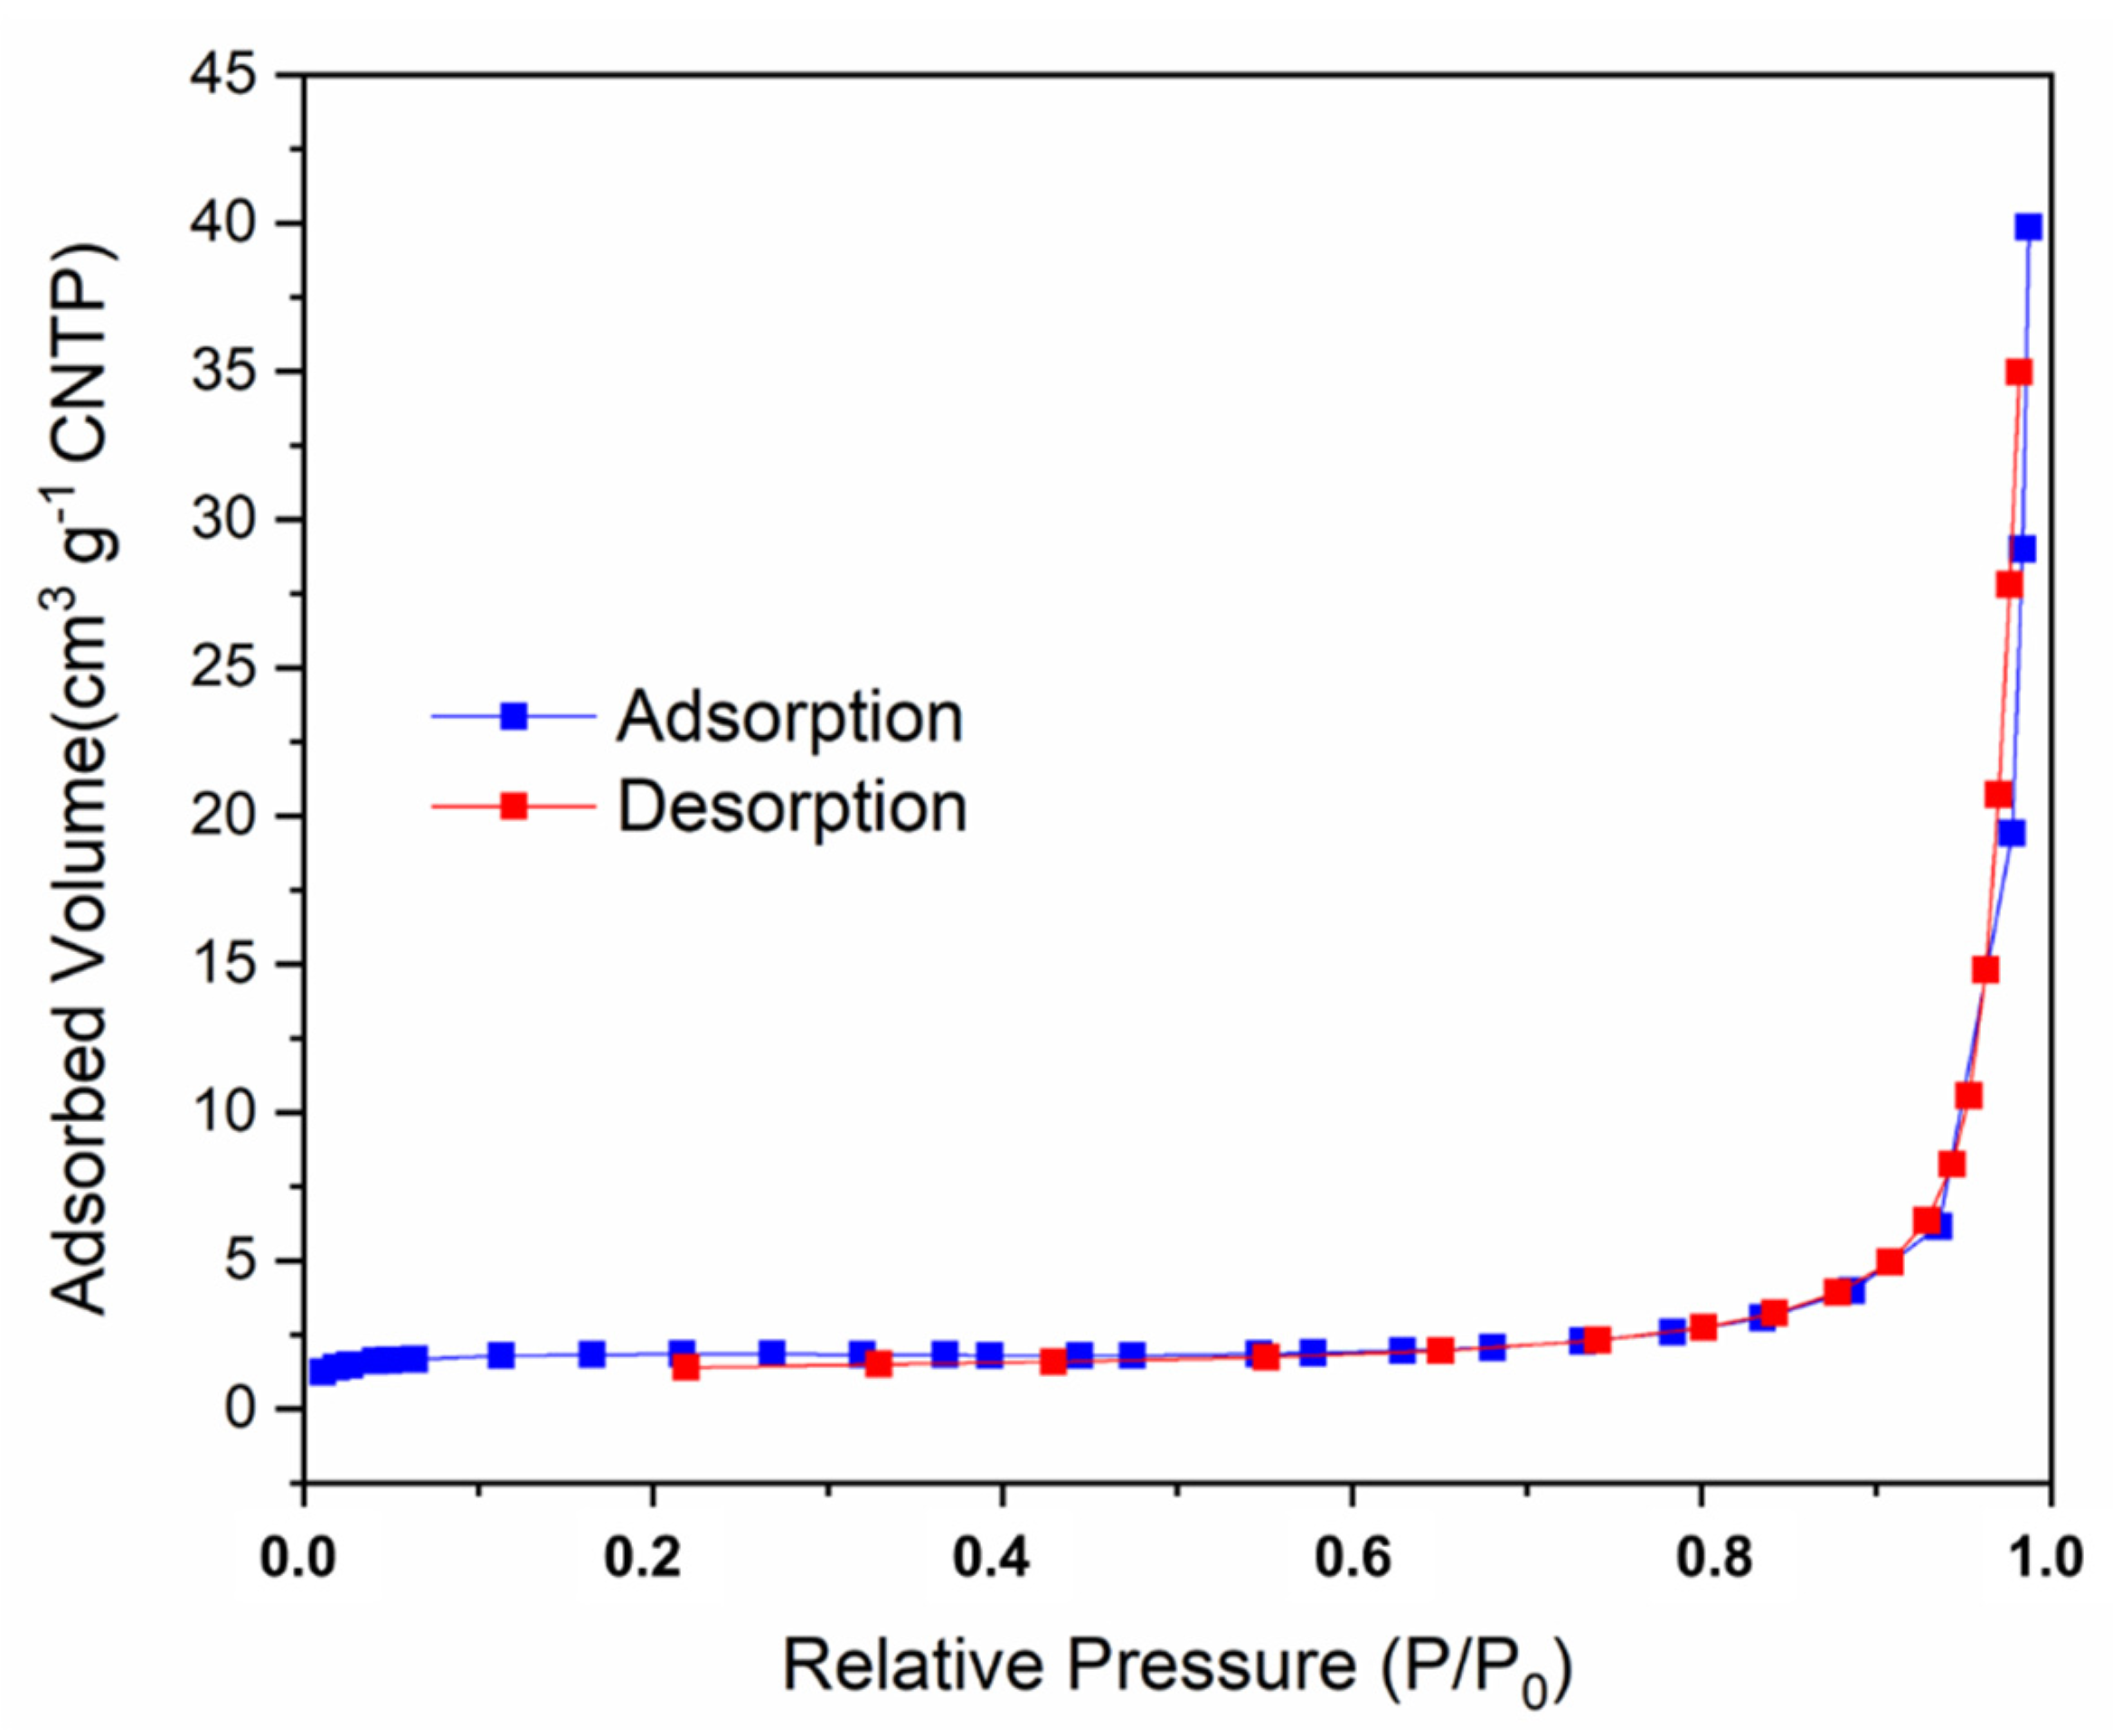
3.2.2. Void Analysis
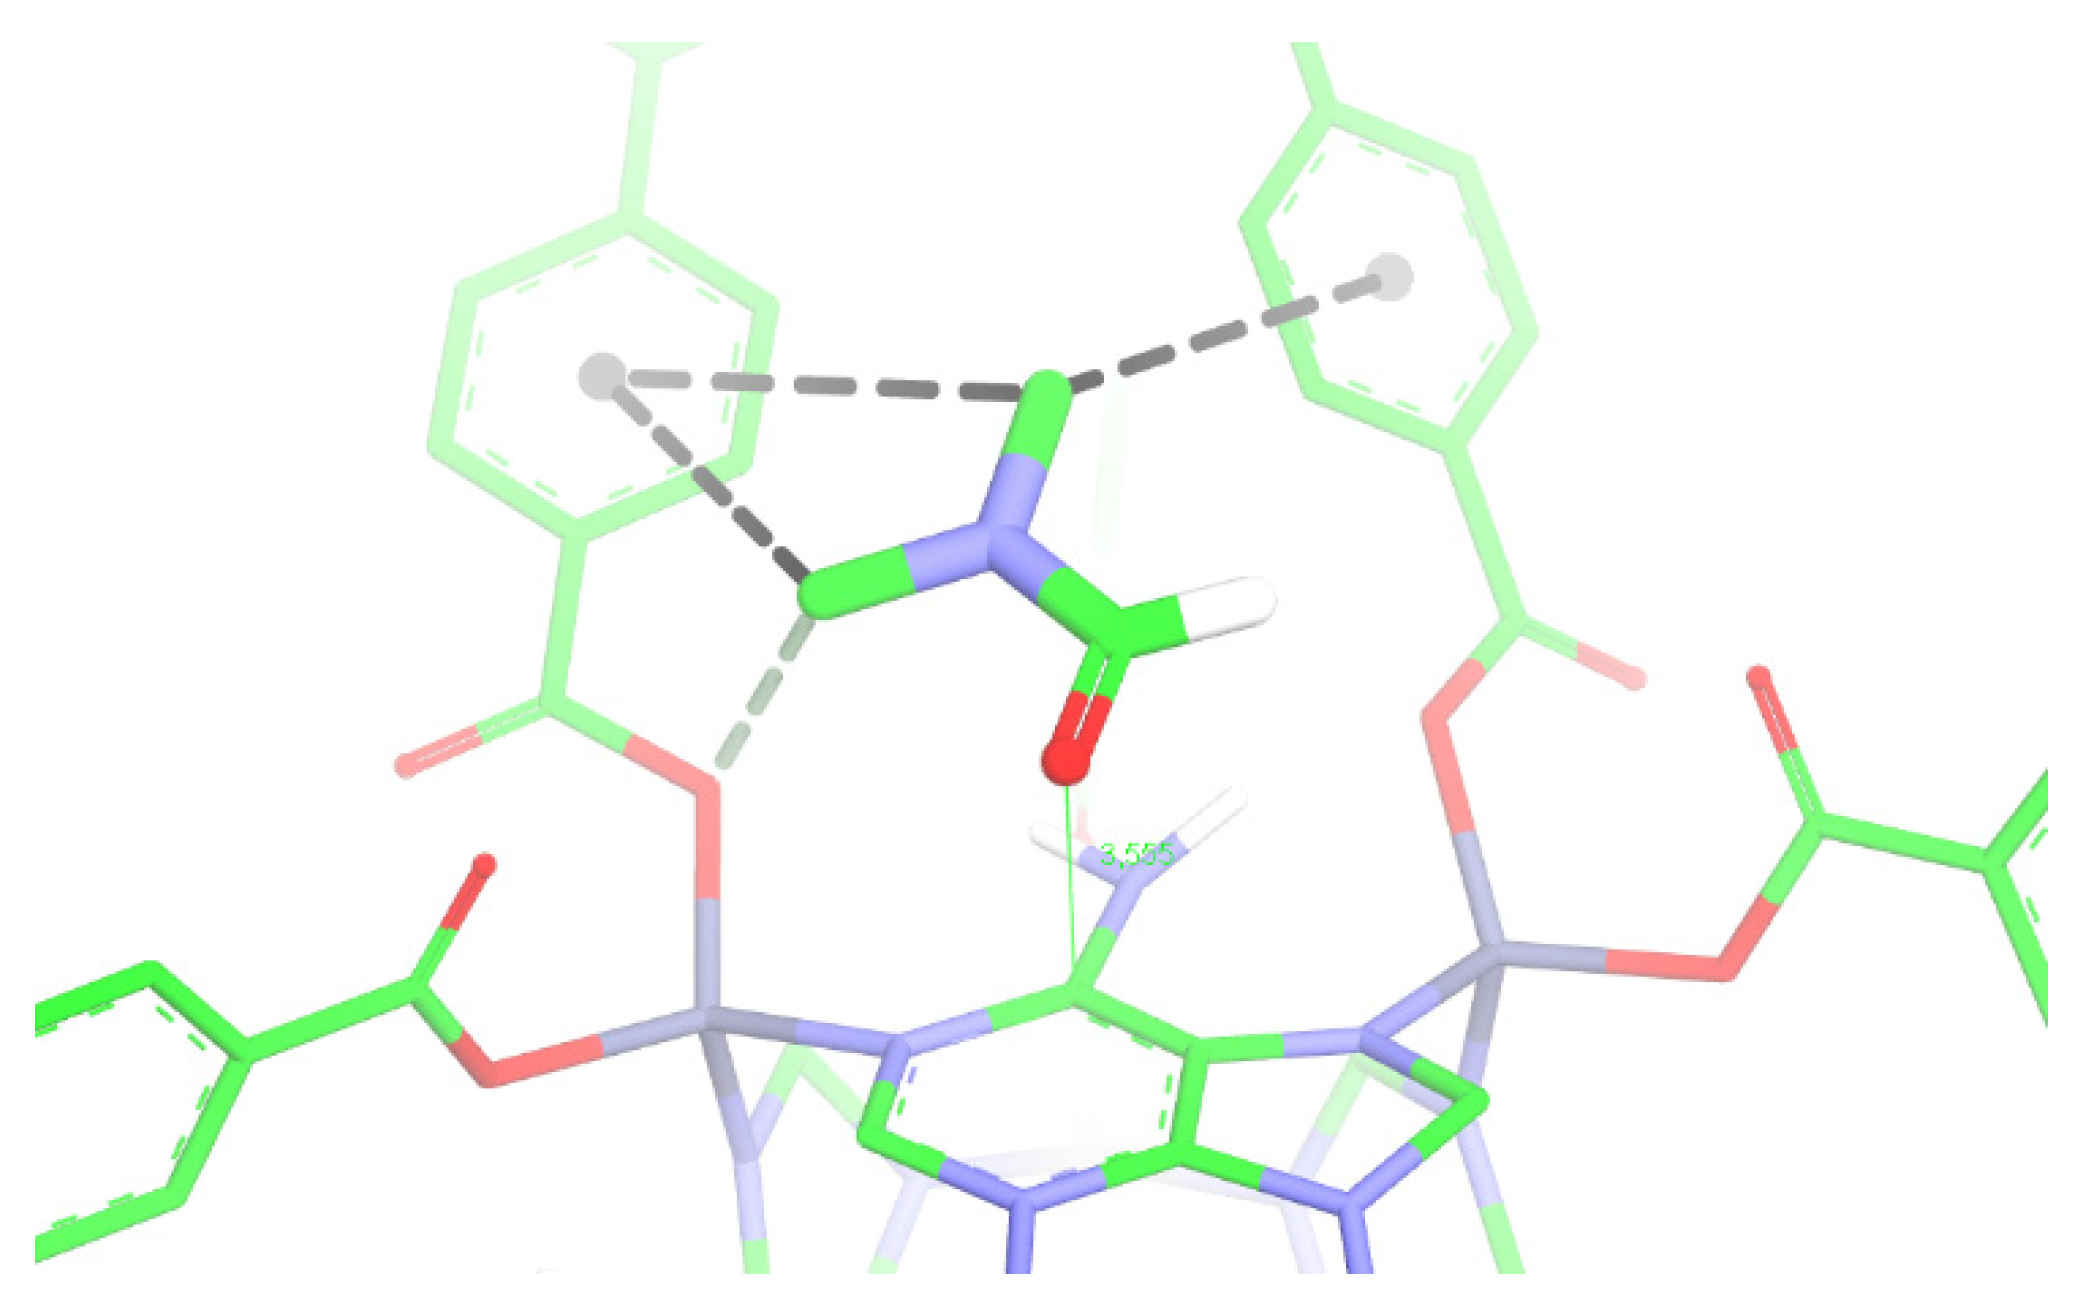
3.2.3. Host–Guest Molecular Docking
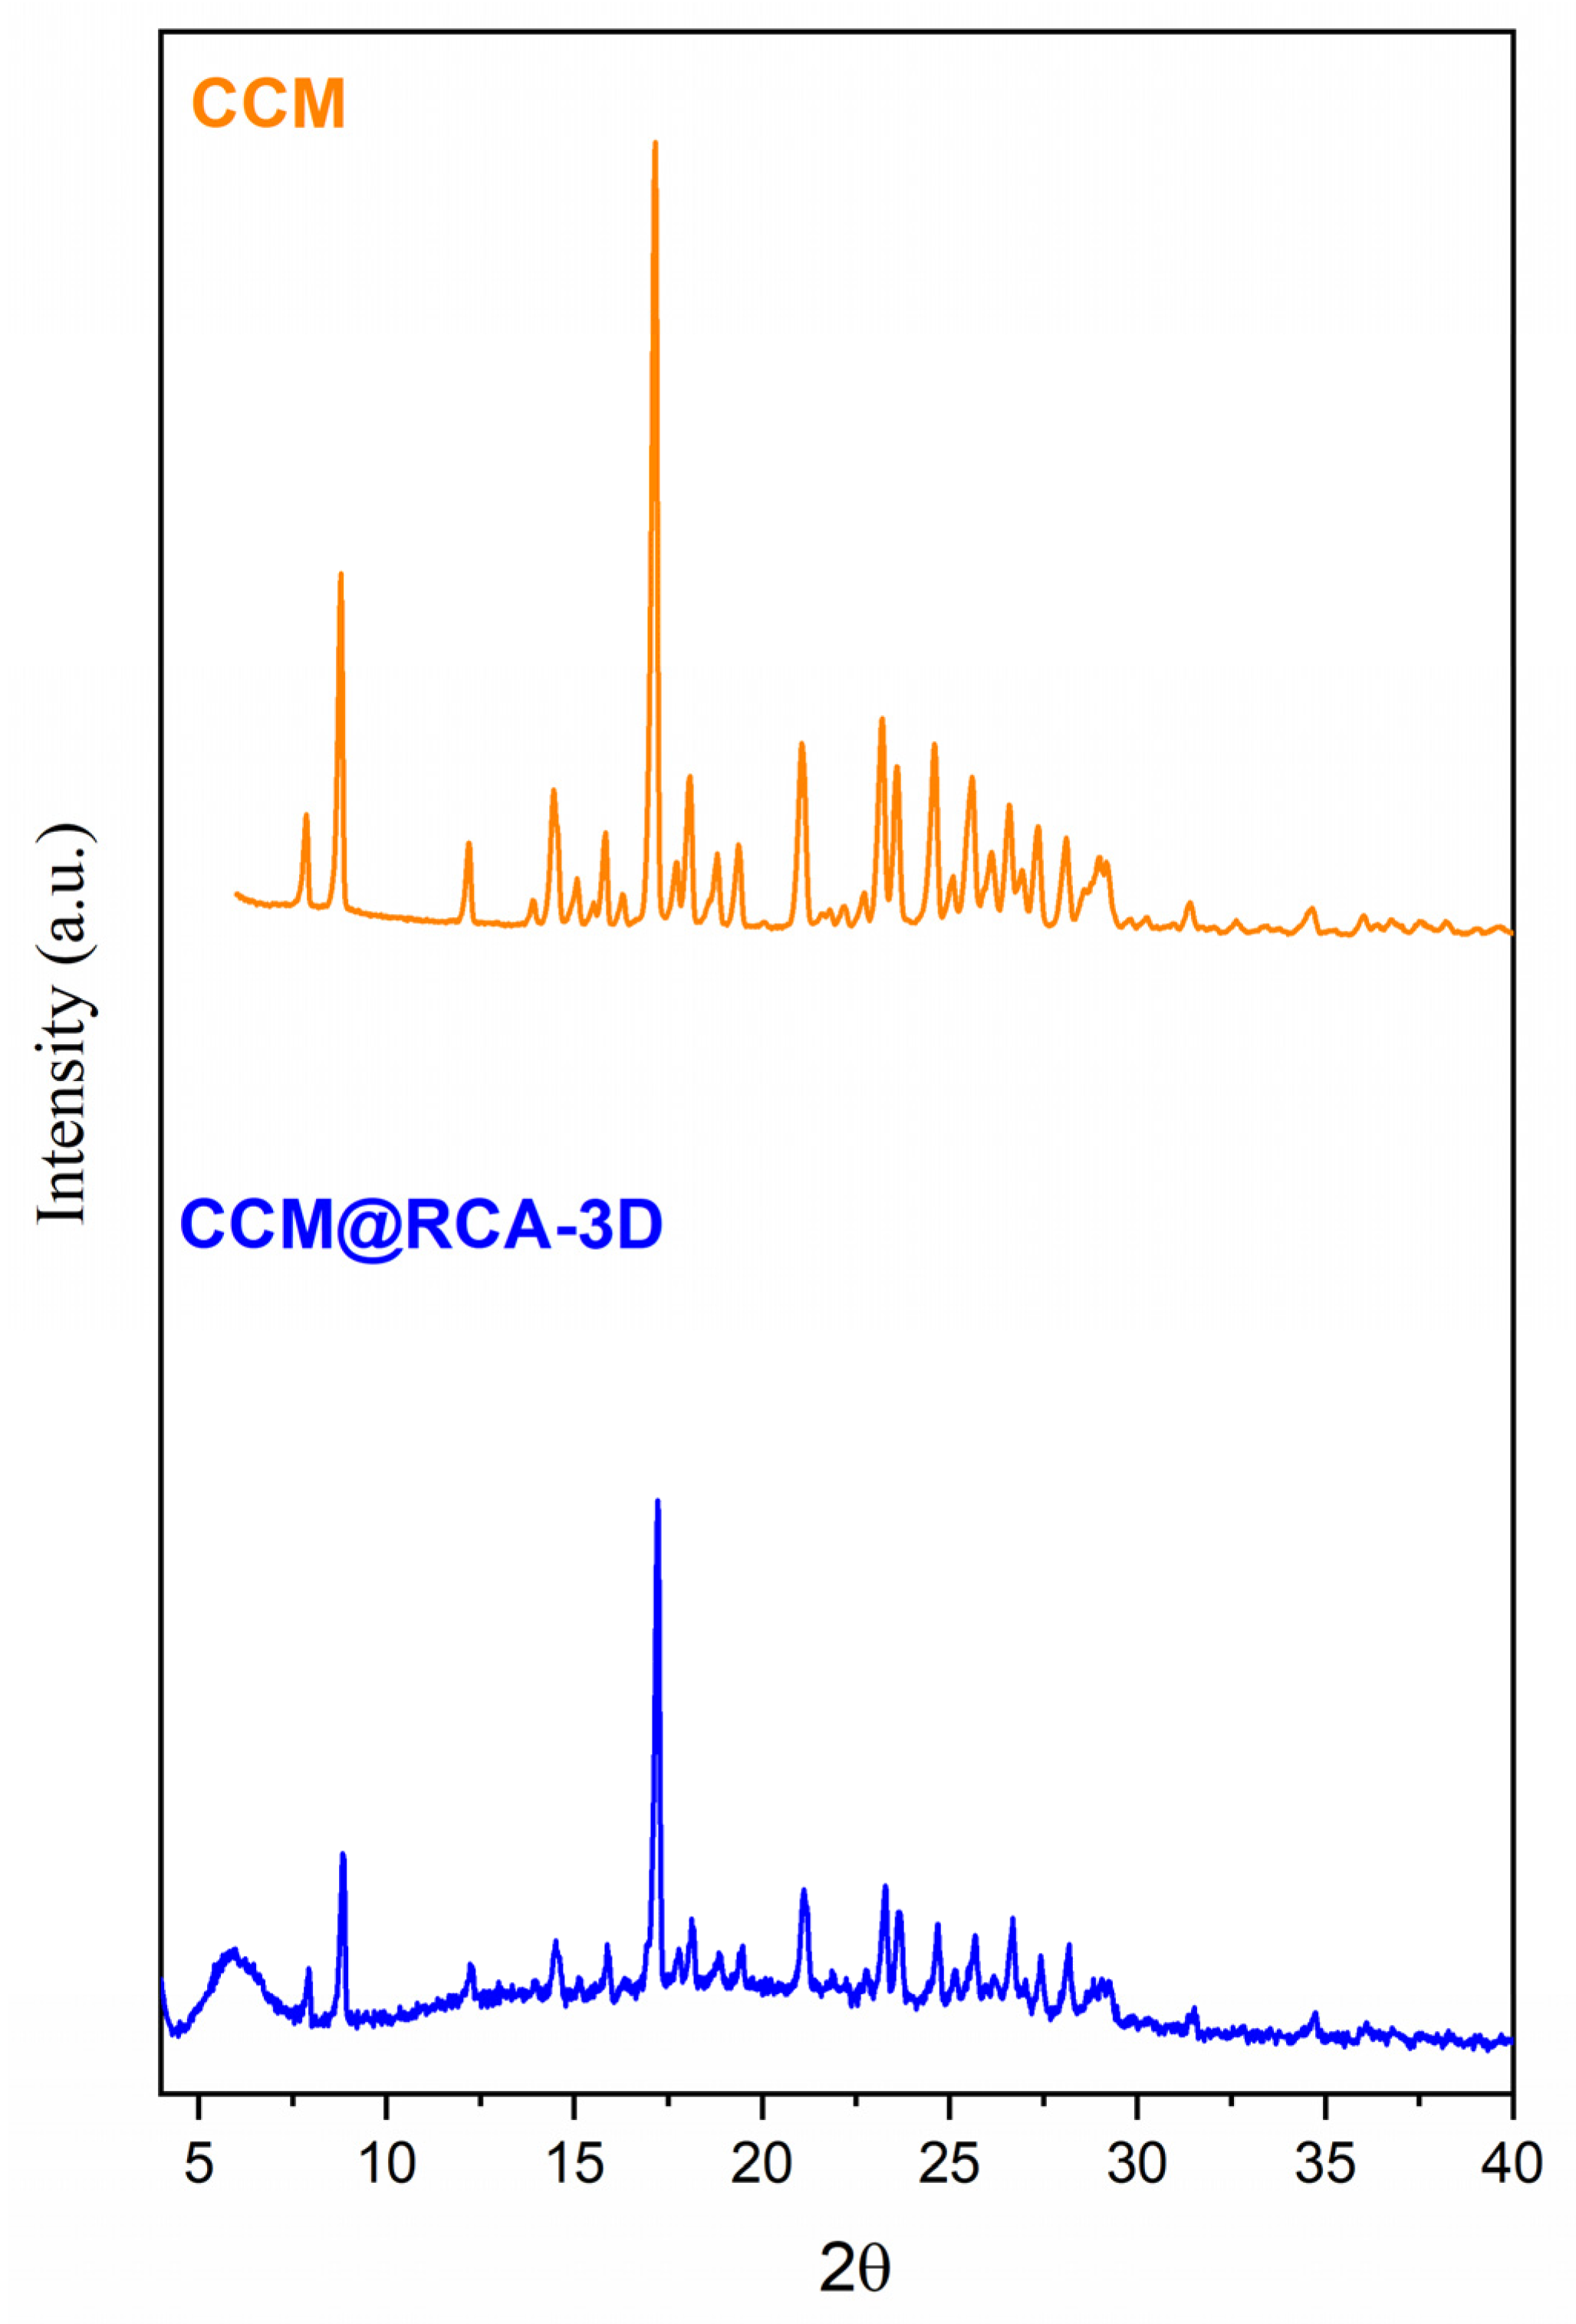
3.3. Characterizations of RCA Compound after Encapsulation Test
3.4. Functionalization of the Compound with Folic Acid
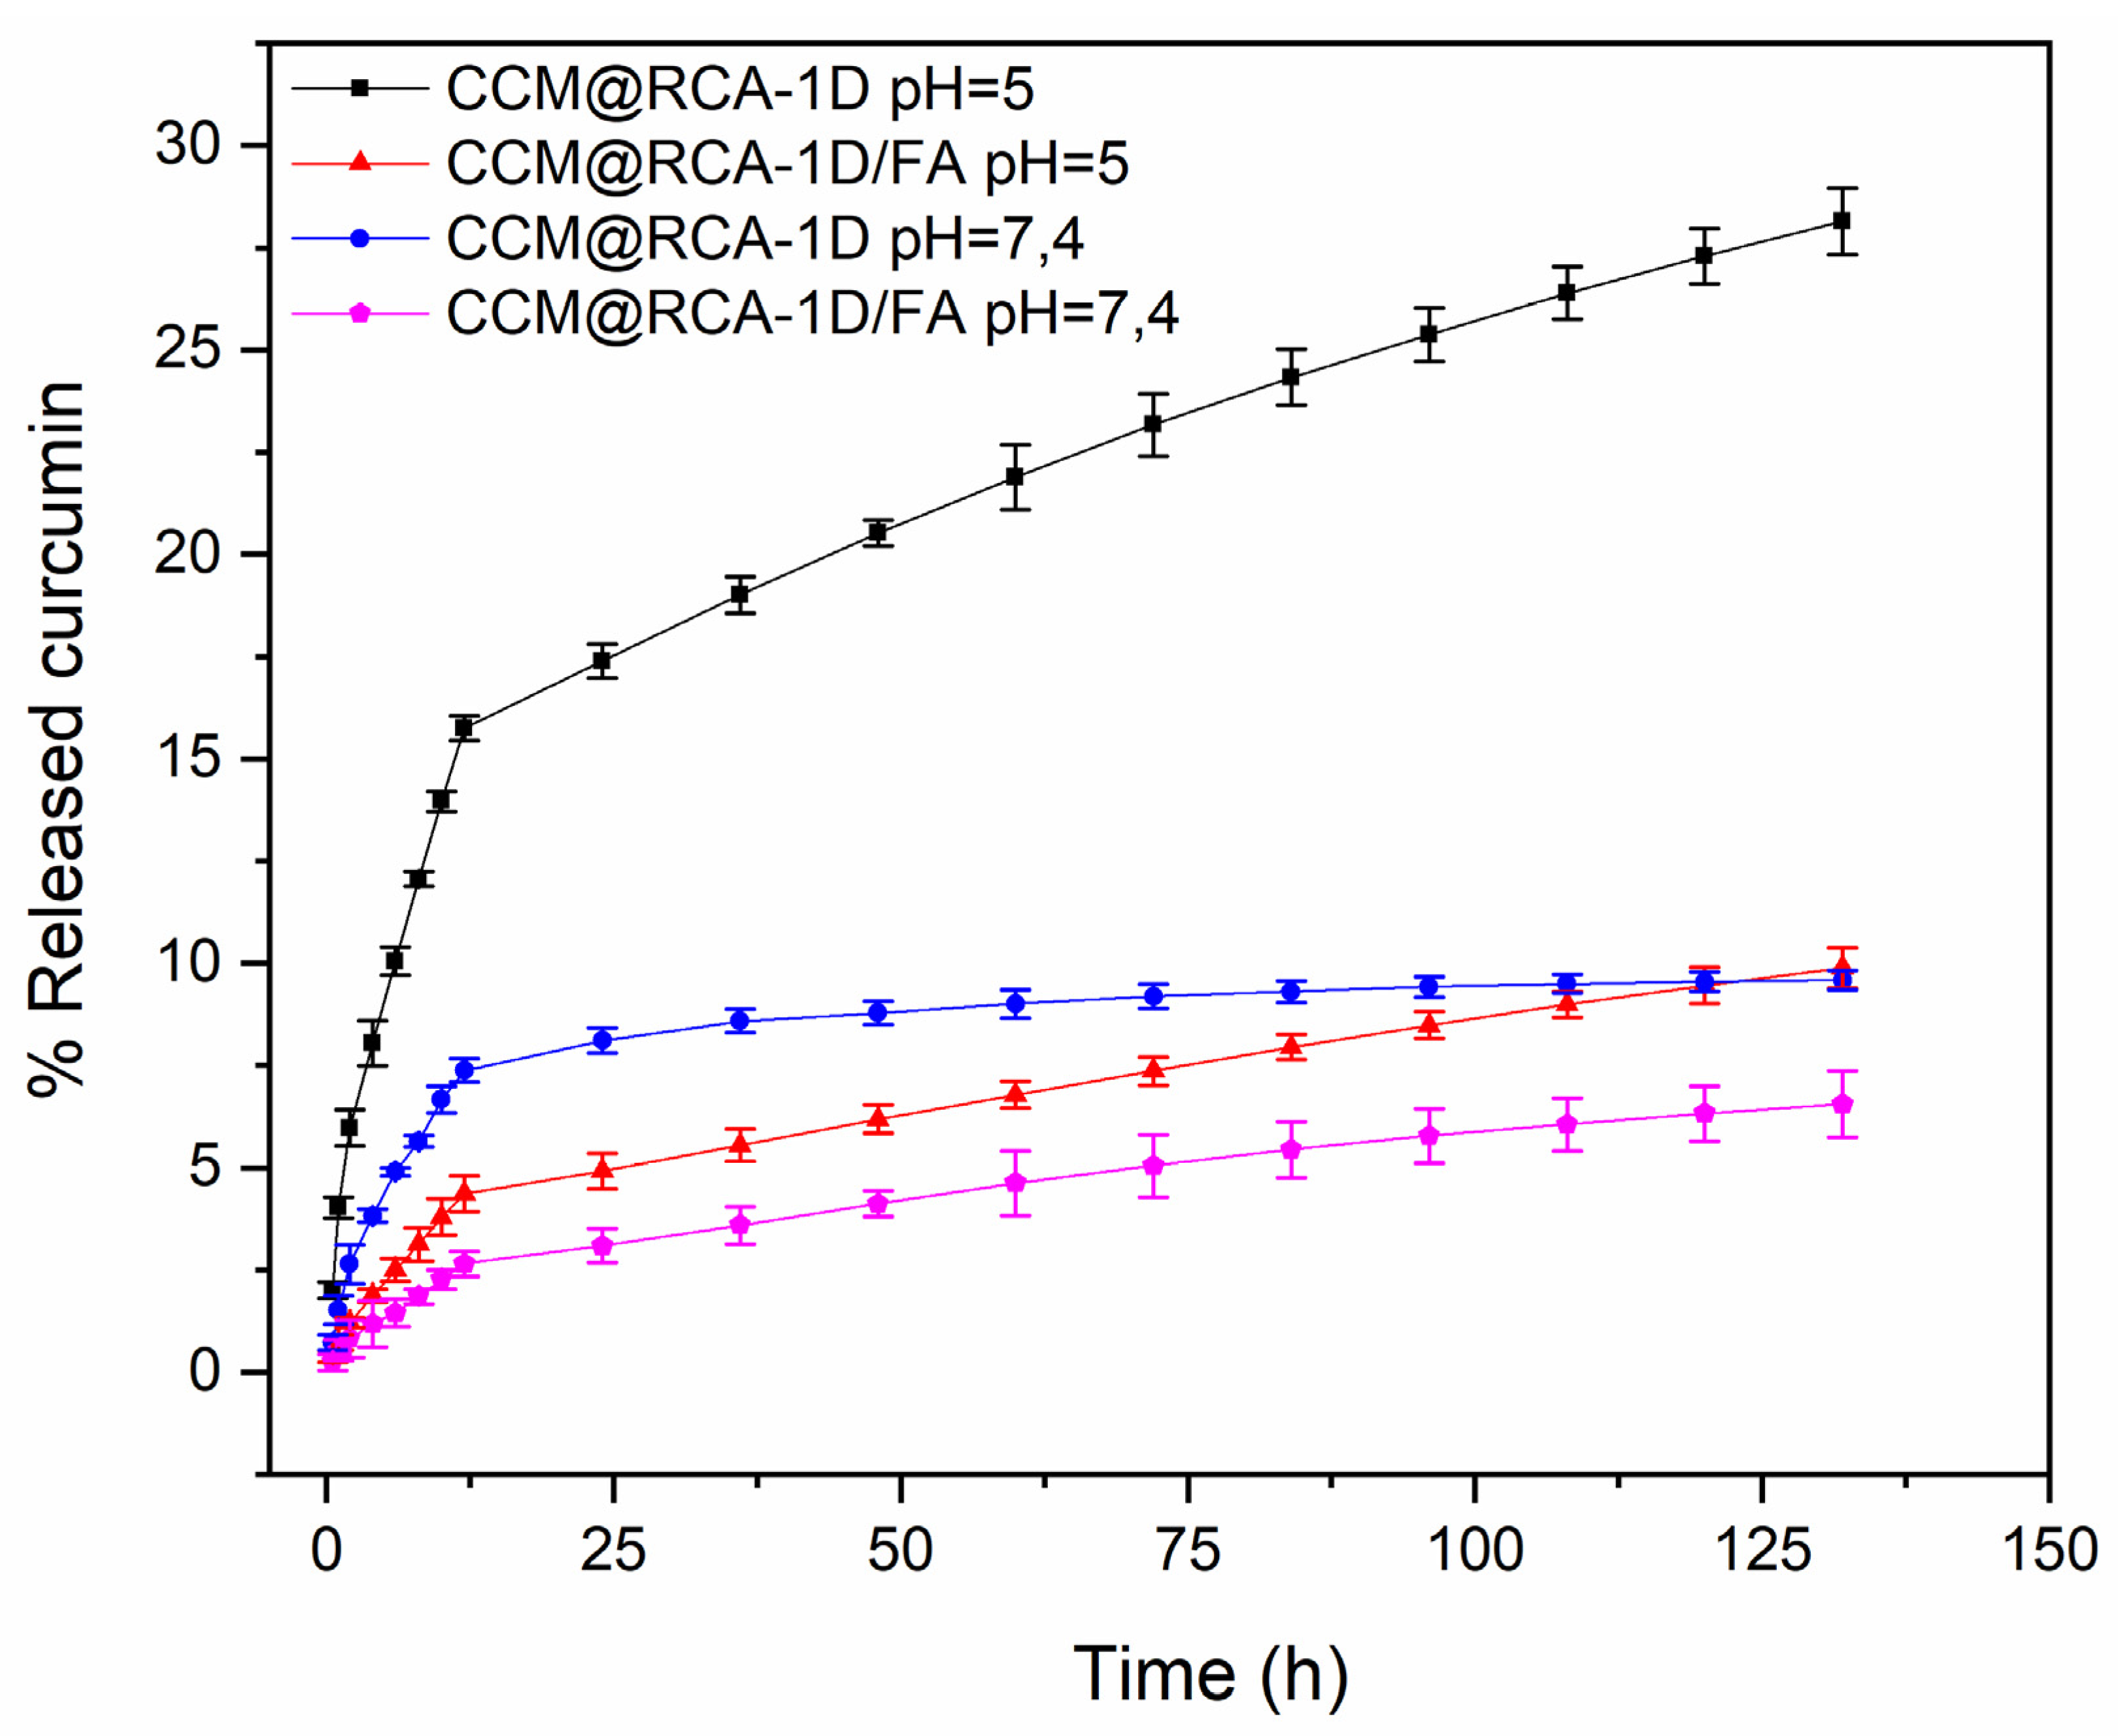
3.5. In Vitro Drug Release Assay
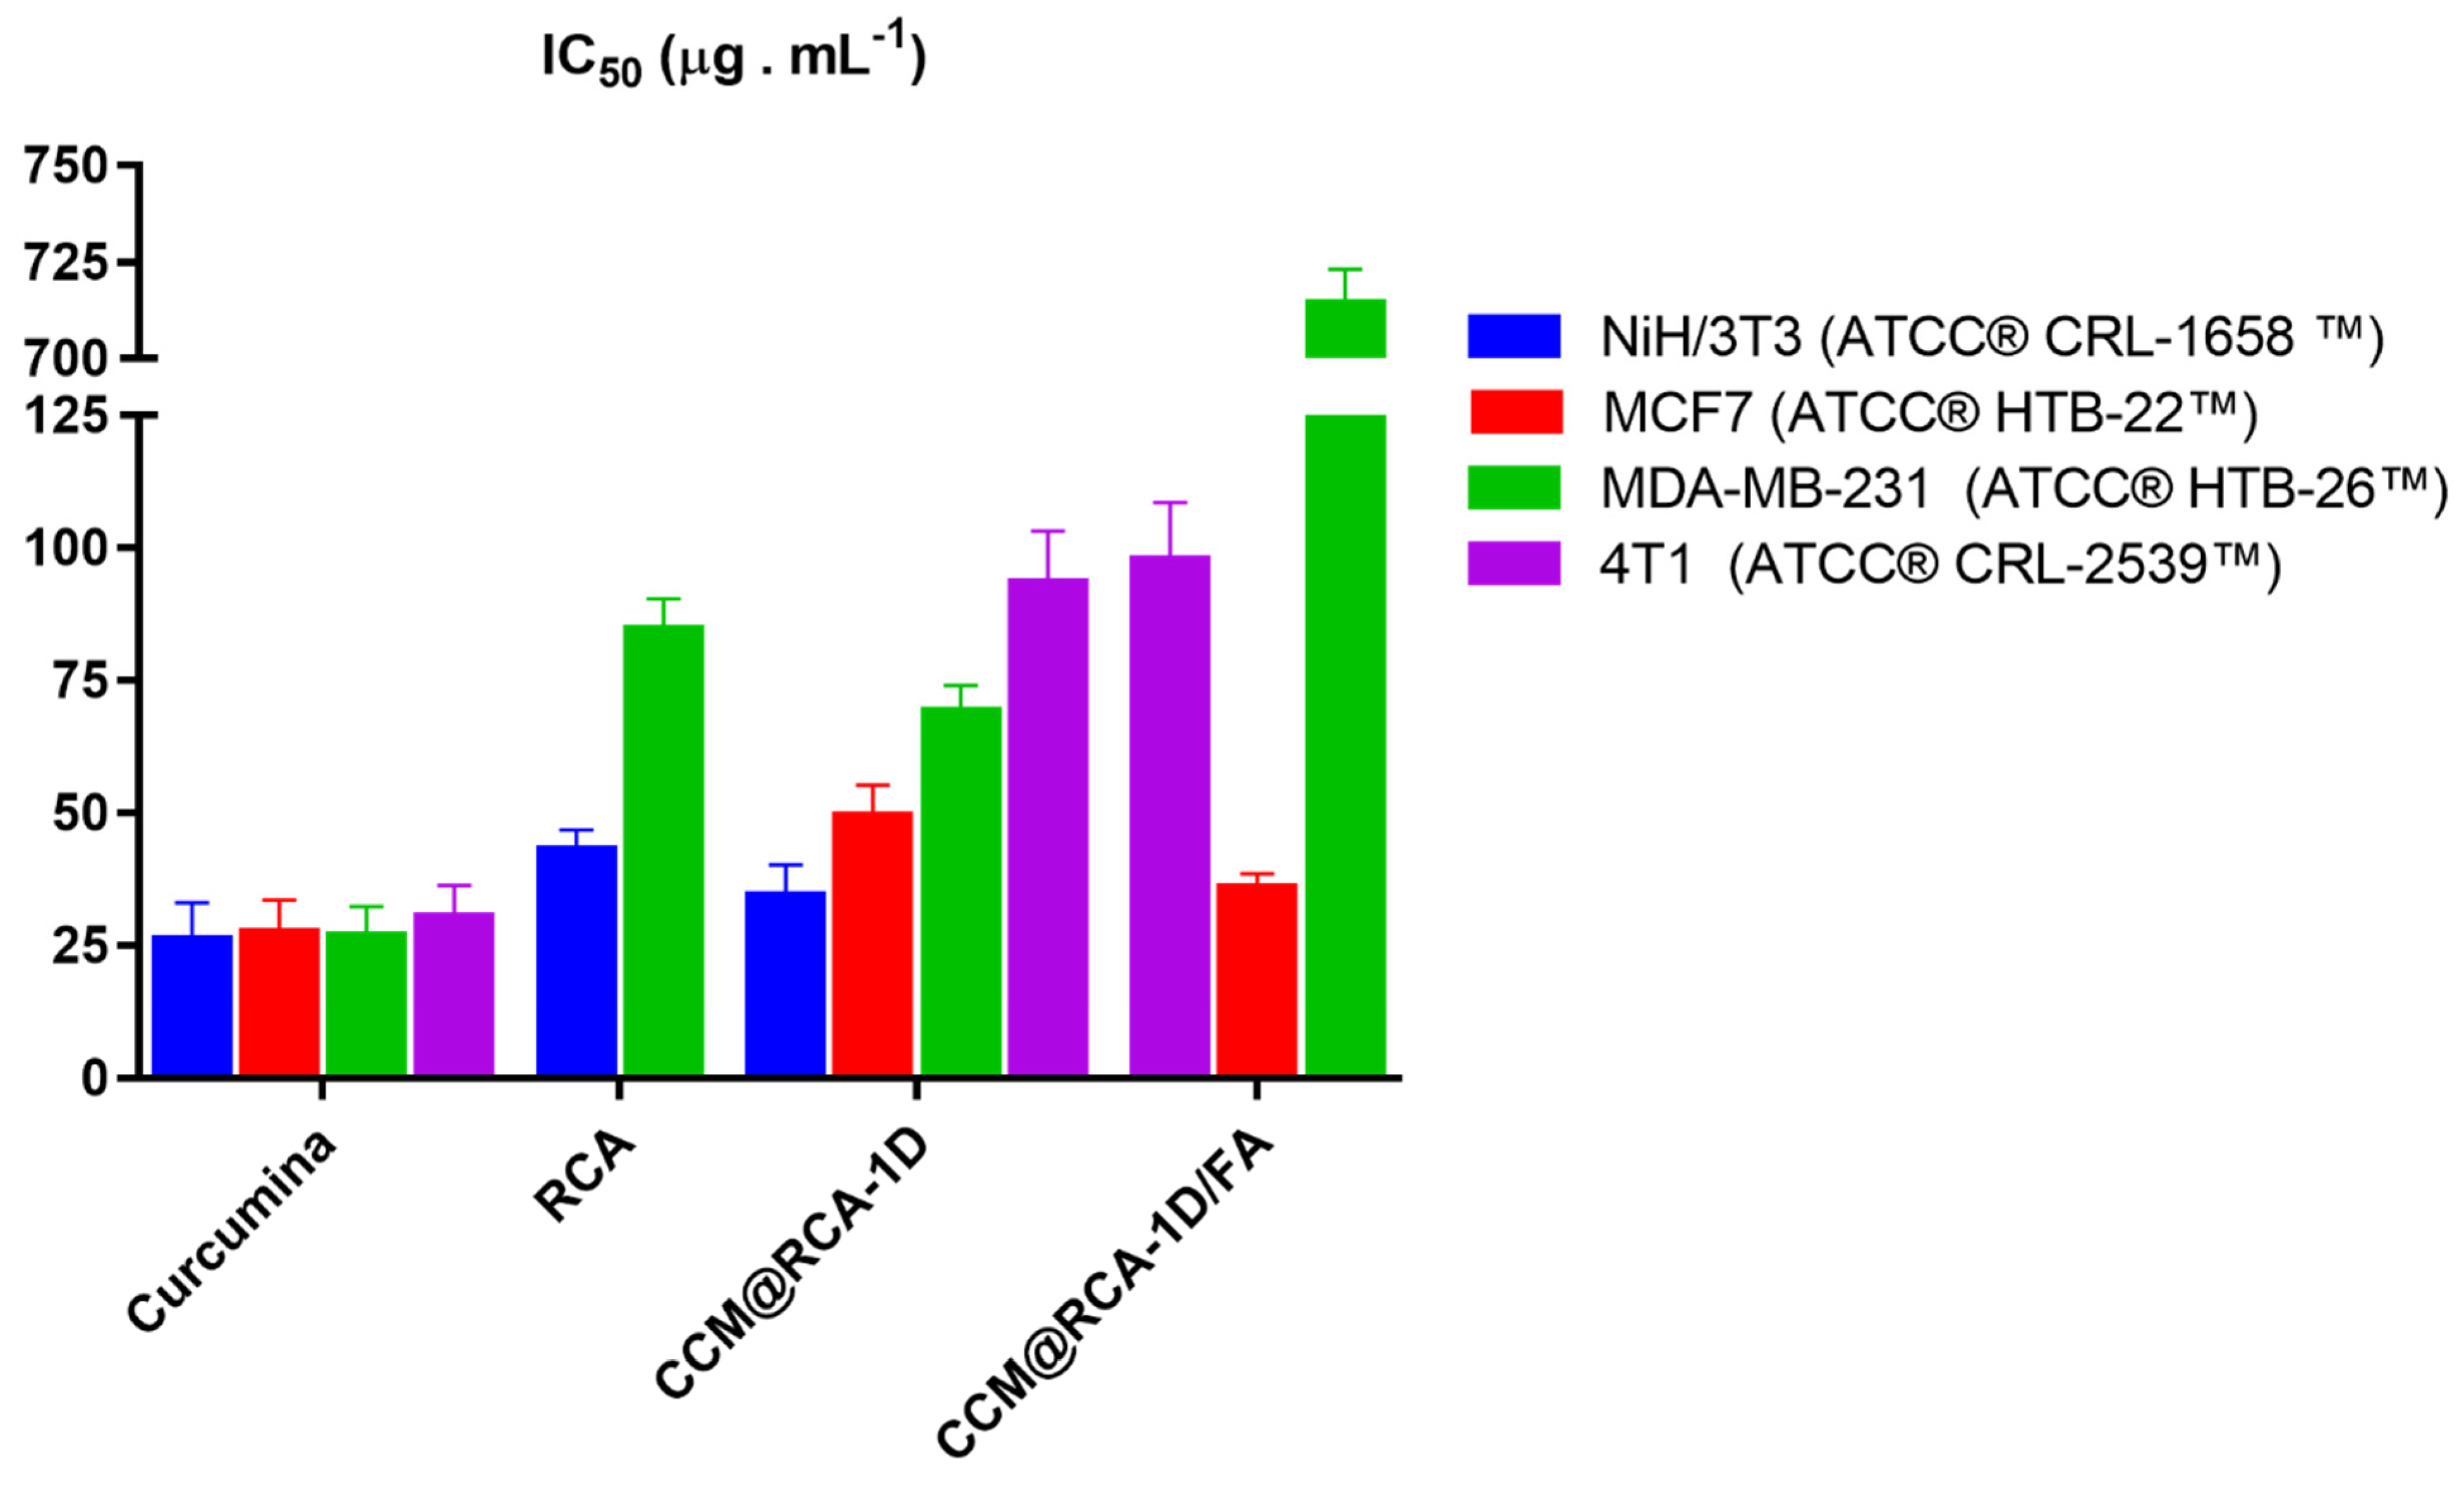
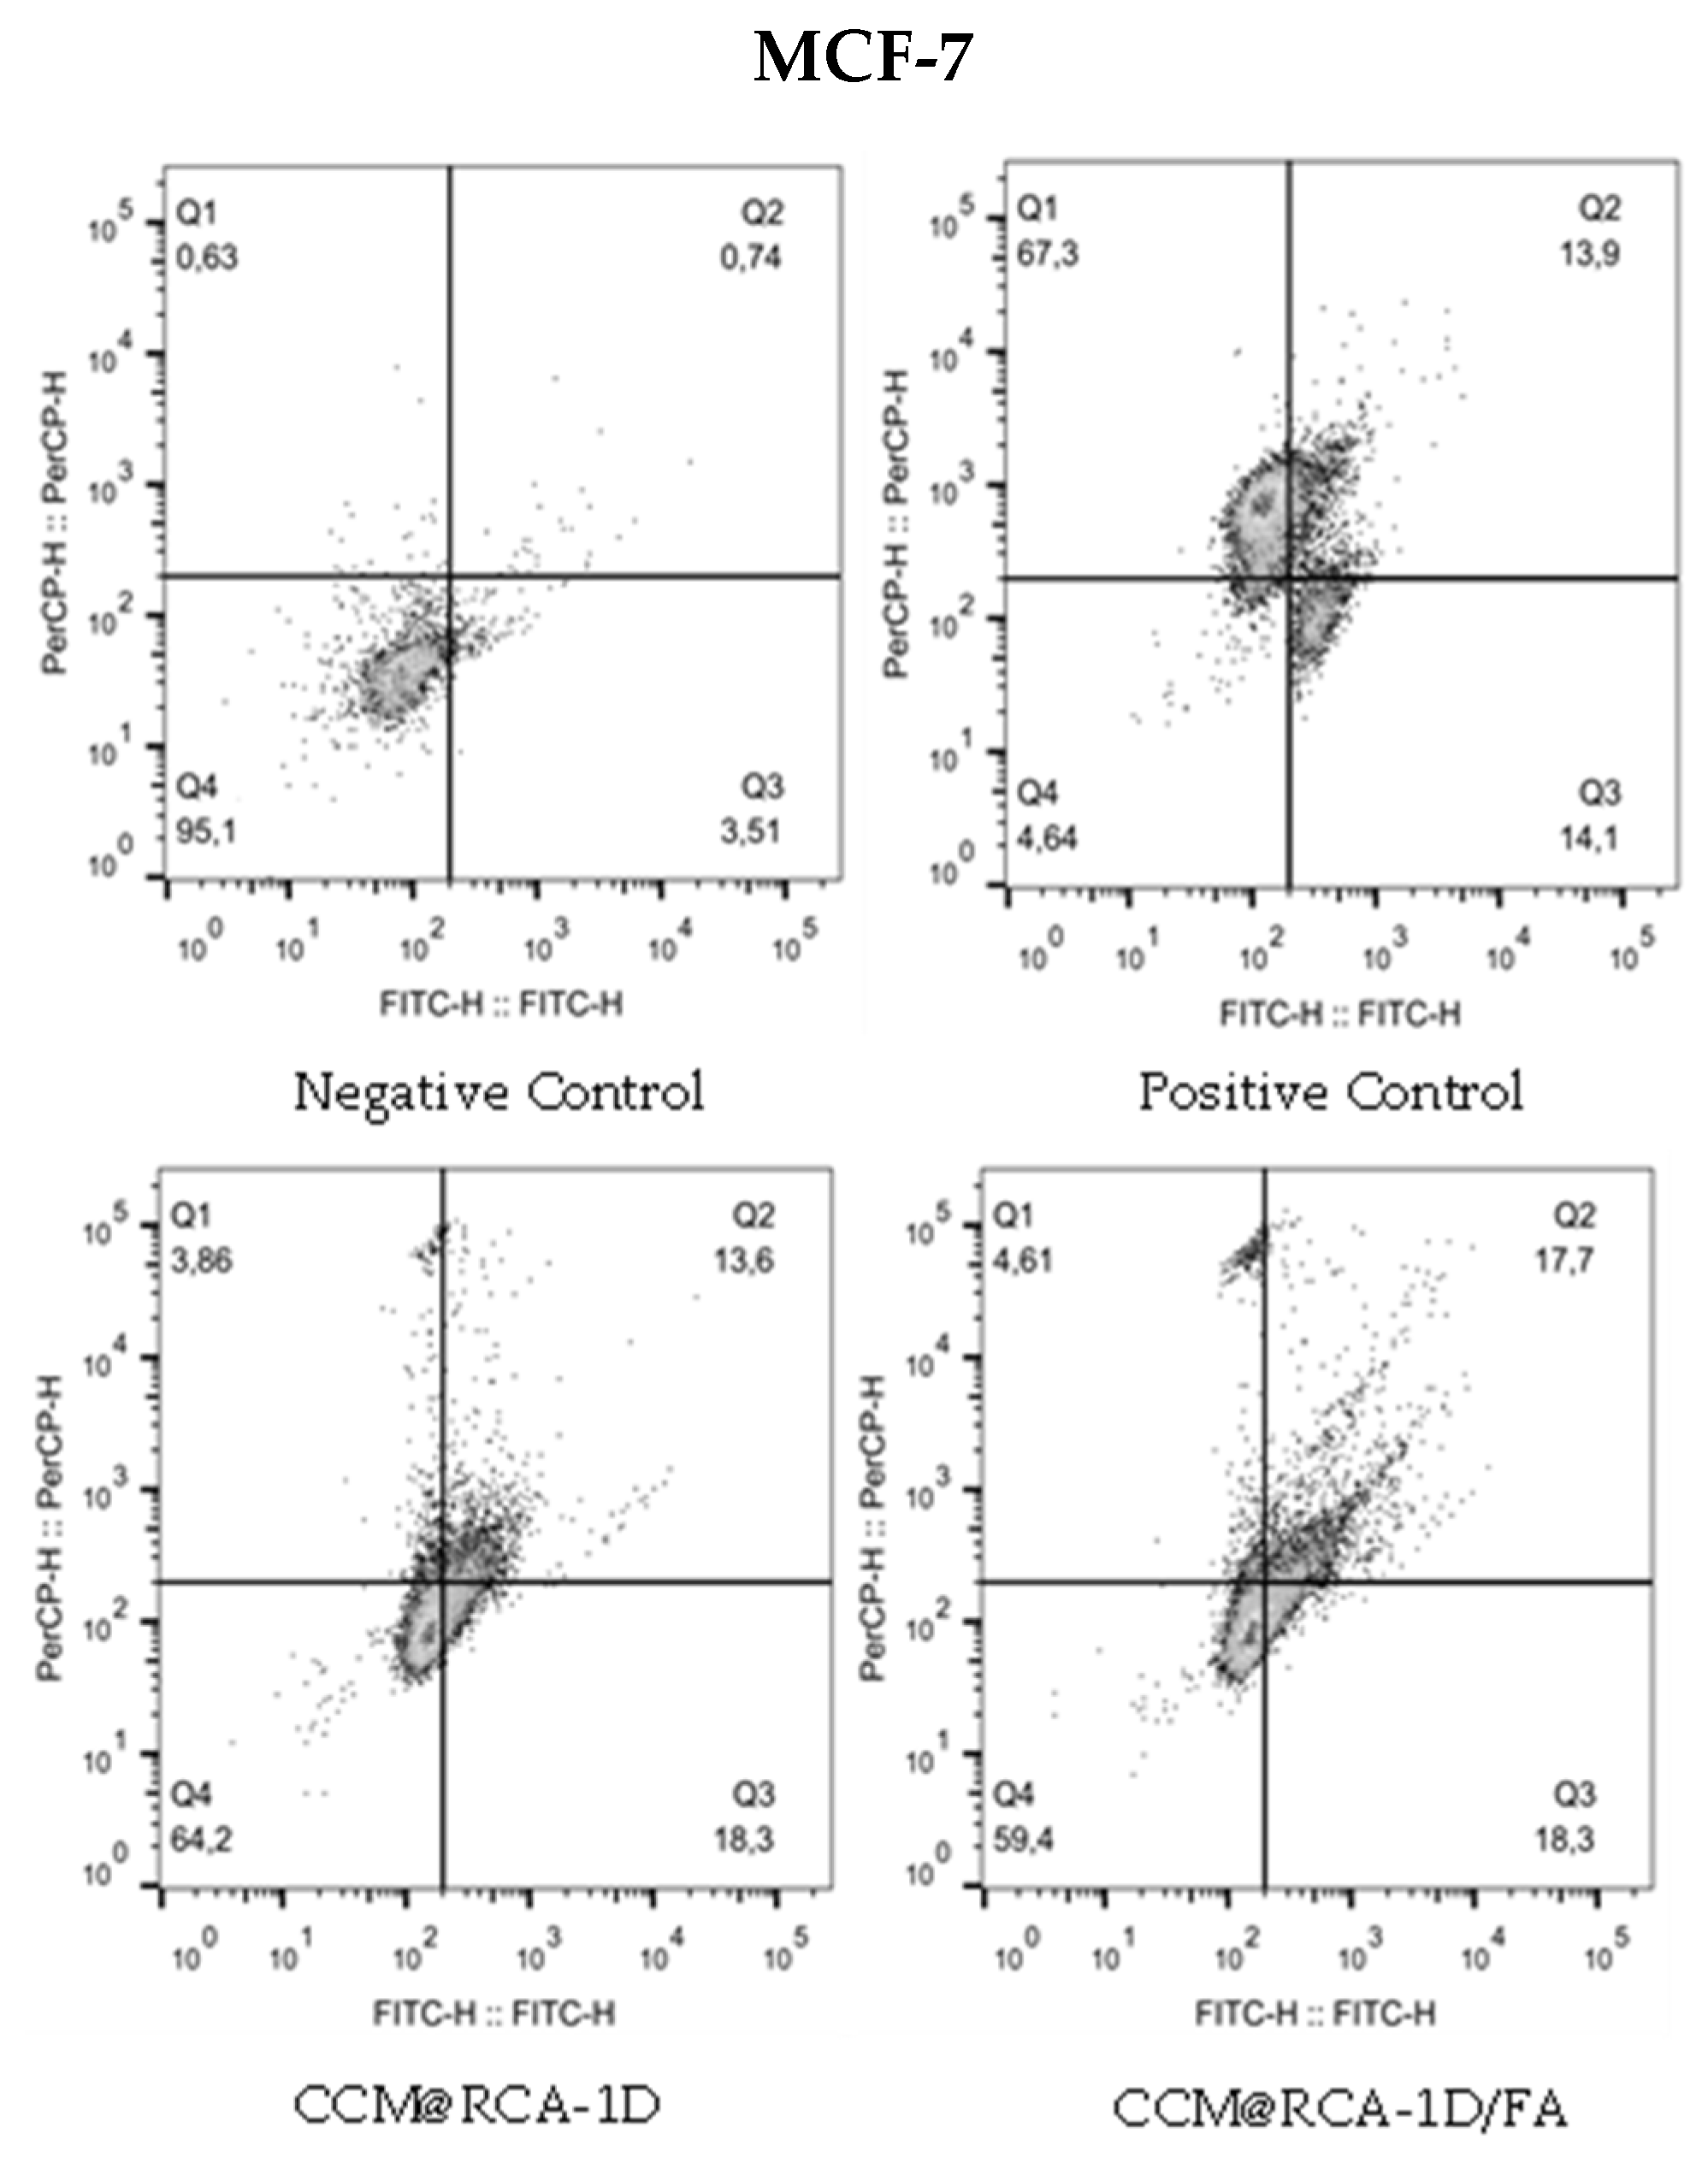
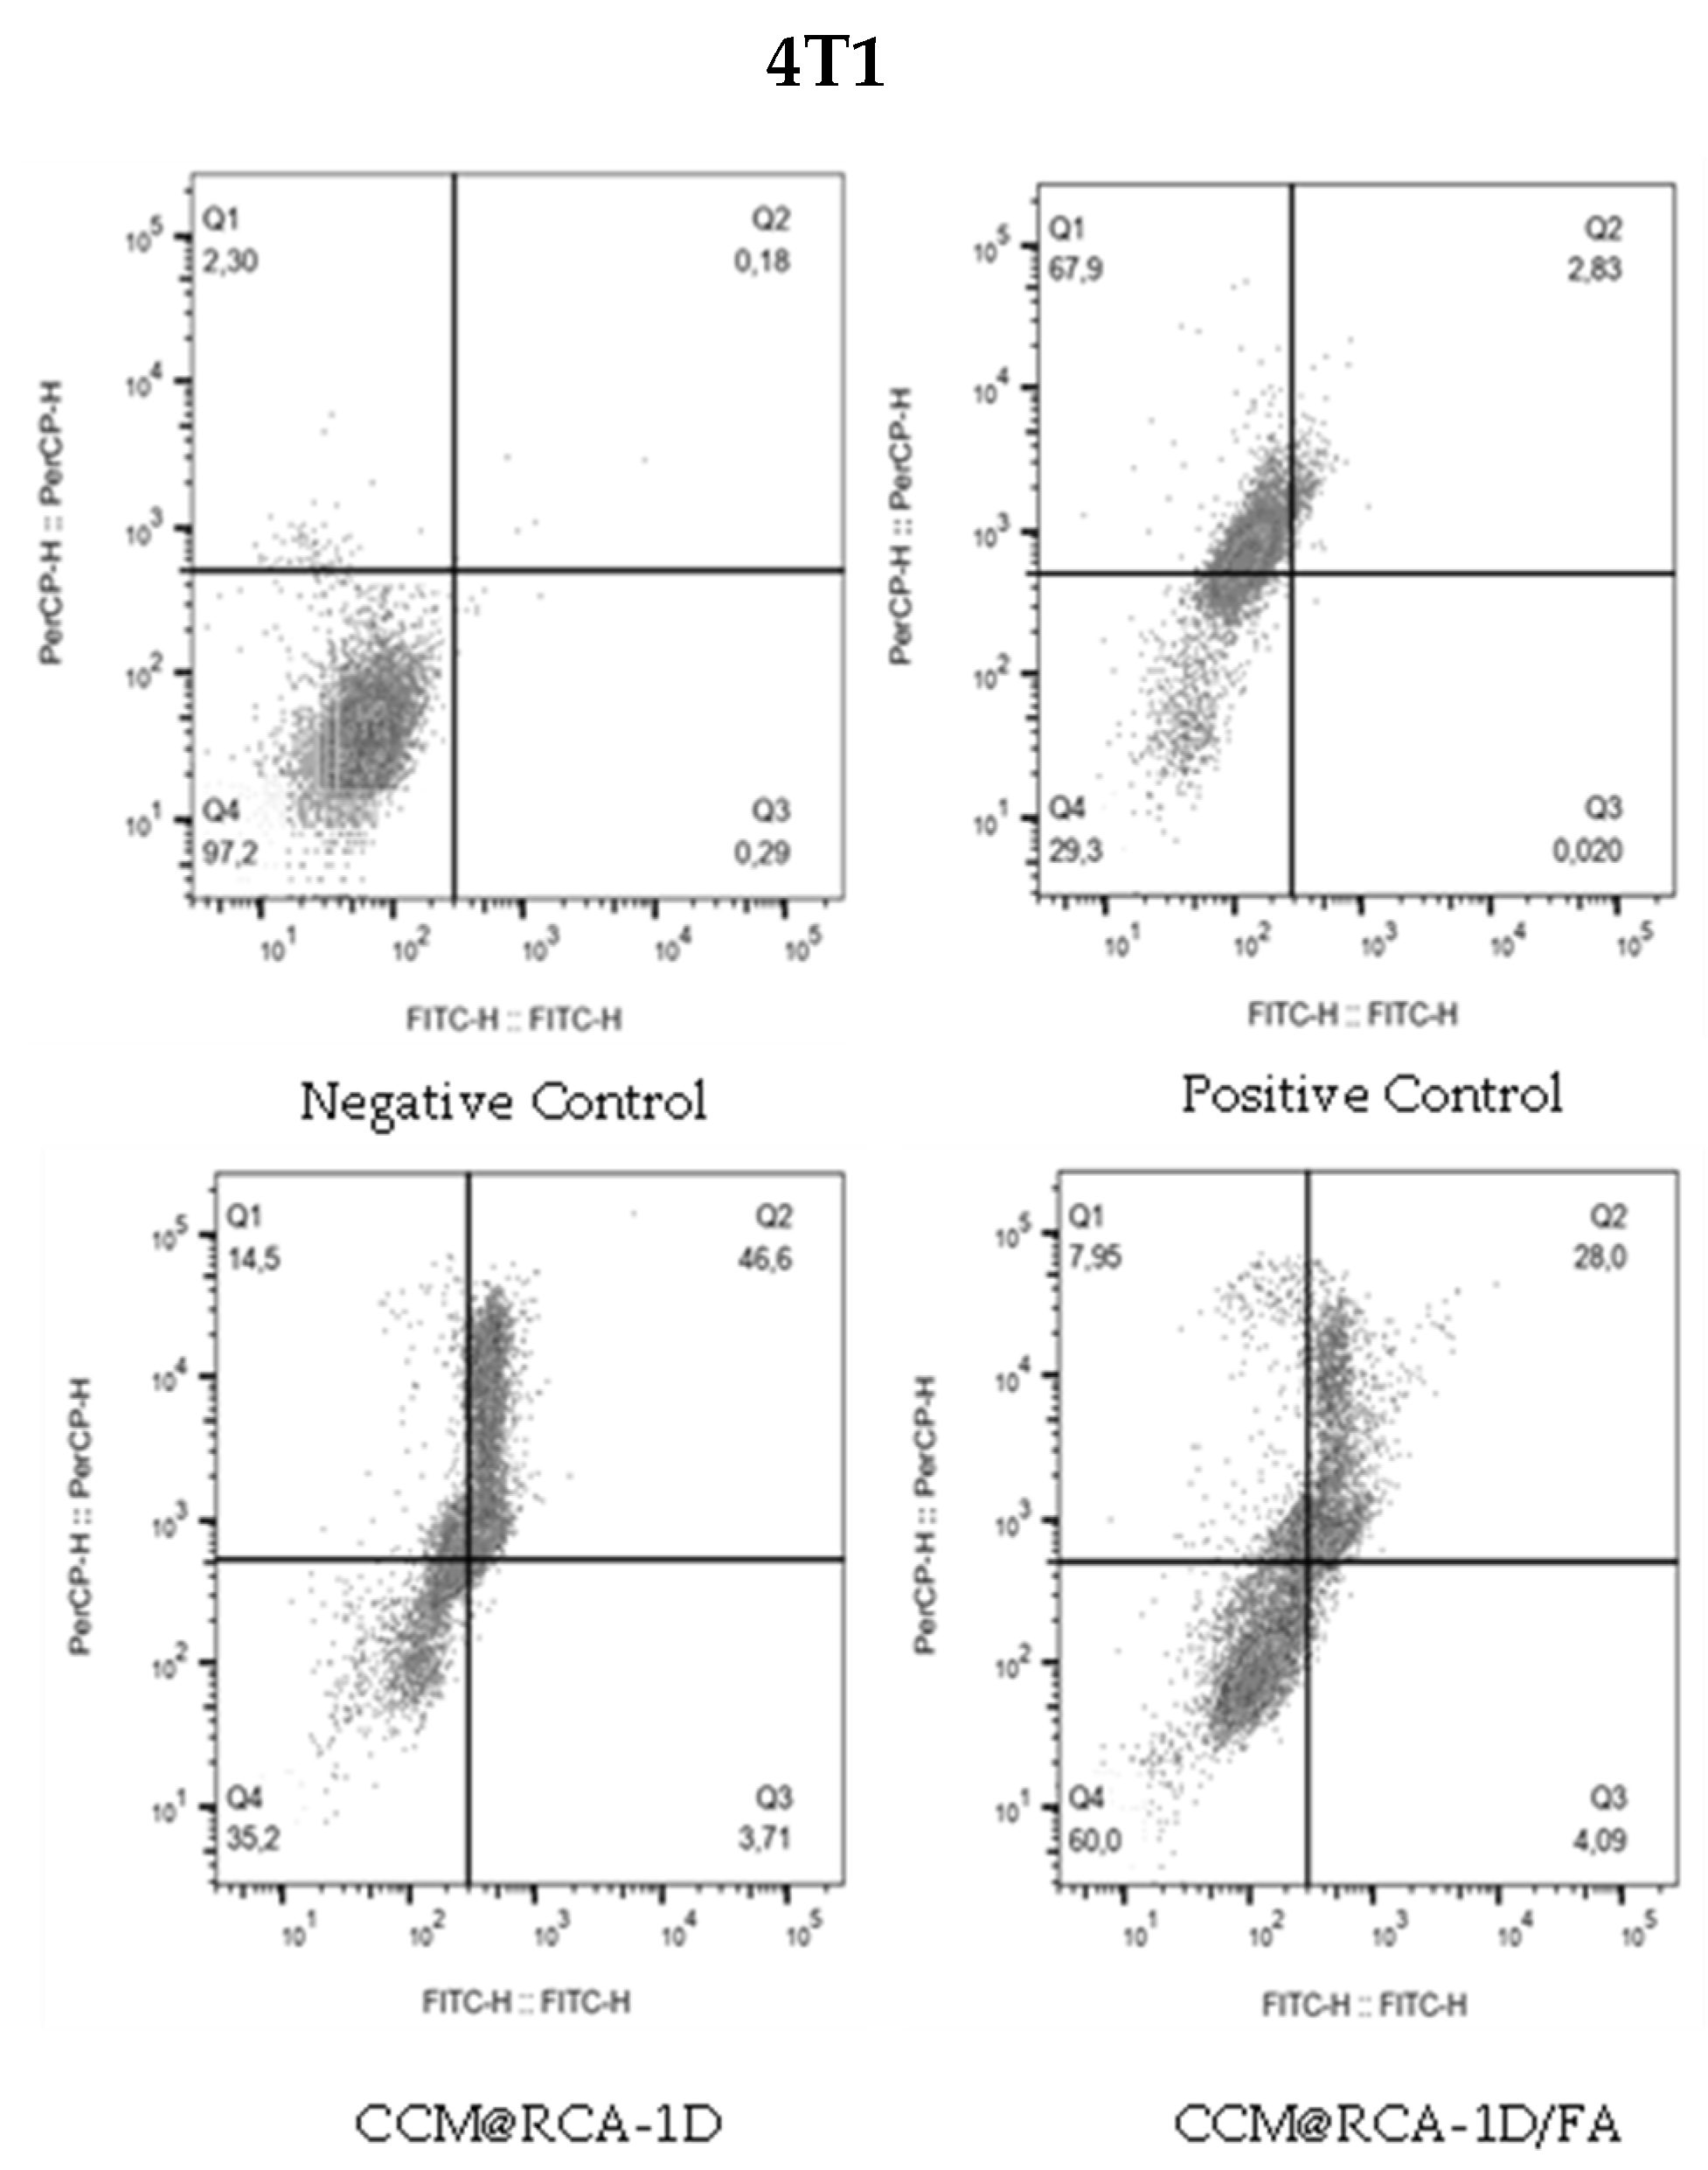
3.6. Anticancer Activity
4. Conclusions
Supplementary Materials
Author Contributions
Funding
Institutional Review Board Statement
Informed Consent Statement
Data Availability Statement
Acknowledgments
Conflicts of Interest
References
- Global Burden of Disease Collaborative Network. Global Burden of Disease Study 2016 (GBD 2016) Results; Institute for Health Metrics and Evaluation (IHME): Seattle, WA, USA, 2017. [Google Scholar]
- Harbeck, N.; Penault-Llorca, F.; Cortes, J.; Gnant, M.; Houssami, N.; Poortmans, P.; Ruddy, K.; Tsang, J.; Cardoso, F. Breast cancer. Nat. Rev. Dis. Prim. 2019, 5, 66. [Google Scholar] [CrossRef] [PubMed]
- De, D.; Das, C.K.; Mandal, D.; Mandal, M.; Pawar, N.; Chandra, A.; Gupta, A.N. Curcumin Complexed with Graphene Derivative for Breast Cancer Therapy. ACS Appl. Bio Mater. 2020, 3, 6284–6296. [Google Scholar] [CrossRef] [PubMed]
- Carolina Alves, R.; Perosa Fernandes, R.; Fonseca-Santos, B.; Damiani Victorelli, F.; Chorilli, M. A Critical Review of the Properties and Analytical Methods for the Determination of Curcumin in Biological and Pharmaceutical Matrices. Crit. Rev. Anal. Chem. 2019, 49, 138–149. [Google Scholar] [CrossRef] [PubMed]
- Al-Kinani, M.A.; Haider, A.J.; Al-Musawi, S. Design, Construction and Characterization of Intelligence Polymer Coated Core–Shell Nanocarrier for Curcumin Drug Encapsulation and Delivery in Lung Cancer Therapy Purposes. J. Inorg. Organomet. Polym. Mater. 2021, 31, 70–79. [Google Scholar] [CrossRef]
- Pricci, M.; Girardi, B.; Giorgio, F.; Losurdo, G.; Ierardi, E.; Di Leo, A. Curcumin and Colorectal Cancer: From Basic to Clinical Evidences. Int. J. Mol. Sci. 2020, 21, 2364. [Google Scholar] [CrossRef] [PubMed] [Green Version]
- Barati, N.; Momtazi-Borojeni, A.A.; Majeed, M.; Sahebkar, A. Potential therapeutic effects of curcumin in gastric cancer. J. Cell. Physiol. 2019, 234, 2317–2328. [Google Scholar] [CrossRef] [PubMed]
- Harini, L.; Srivastava, S.; Gnanakumar, G.P.; Karthikeyan, B.; Ross, C.; Krishnakumar, V.; Kannan, V.R.; Sundar, K.; Kathiresan, T. An ingenious non-spherical mesoporous silica nanoparticle cargo with curcumin induces mitochondria-mediated apoptosis in breast cancer (MCF-7) cells. Oncotarget 2019, 10, 1193–1208. [Google Scholar] [CrossRef] [Green Version]
- Wang, J.; Liu, Q.; Yang, L.; Xia, X.; Zhu, R.; Chen, S.; Wang, M.; Cheng, L.; Wu, X.; Wang, S. Curcumin-Loaded TPGS/F127/P123 Mixed Polymeric Micelles for Cervical Cancer Therapy: Formulation, Characterization, and In Vitro and In Vivo Evaluation. J. Biomed. Nanotechnol. 2017, 13, 1631–1646. [Google Scholar] [CrossRef]
- Pourhanifeh, M.H.; Darvish, M.; Tabatabaeian, J.; Fard, M.R.; Mottaghi, R.; Azadchehr, M.J.; Jahanshahi, M.; Sahebkar, A.; Mirzaei, H. Therapeutic role of curcumin and its novel formulations in gynecological cancers. J. Ovarian Res. 2020, 13, 130. [Google Scholar] [CrossRef]
- Yallapu, M.M.; Maher, D.M.; Sundram, V.; Bell, M.C.; Jaggi, M.; Chauhan, S.C. Curcumin induces chemo/radio-sensitization in ovarian cancer cells and curcumin nanoparticles inhibit ovarian cancer cell growth. J. Ovarian Res. 2010, 3, 11. [Google Scholar] [CrossRef]
- Xu, C.; Wang, M.; Guo, W.; Sun, W.; Liu, Y. Curcumin in Osteosarcoma Therapy: Combining With Immunotherapy, Chemotherapeutics, Bone Tissue Engineering Materials and Potential Synergism with Photodynamic Therapy. Front. Oncol. 2021, 11, 1748. [Google Scholar] [CrossRef] [PubMed]
- Bansal, S.S.; Goel, M.; Aqil, F.; Vadhanam, M.V.; Gupta, R.C. Advanced Drug Delivery Systems of Curcumin for Cancer Chemoprevention. Cancer Prev. Res. 2011, 4, 1158–1171. [Google Scholar] [CrossRef] [PubMed] [Green Version]
- Sethiya, A.; Agarwal, D.K.; Agarwal, S. Current Trends in Drug Delivery System of Curcumin and its Therapeutic Applications. Mini-Rev. Med. Chem. 2020, 20, 1190–1232. [Google Scholar] [CrossRef] [PubMed]
- Sun, Y.; Zheng, L.; Yang, Y.; Qian, X.; Fu, T.; Li, X.; Yang, Z.; Yan, H.; Cui, C.; Tan, W. Metal–Organic Framework Nanocarriers for Drug Delivery in Biomedical Applications. Nano-Micro Lett. 2020, 12, 103. [Google Scholar] [CrossRef] [PubMed]
- Cao, J.; Li, X.; Tian, H. Metal-Organic Framework (MOF)-Based Drug Delivery. Curr. Med. Chem. 2020, 27, 5949–5969. [Google Scholar] [CrossRef] [PubMed]
- Nabipour, H.; Mozafari, M.; Hu, Y. BioMOFs. In Metal-Organic Frameworks for Biomedical Applications; Elsevier: Amsterdam, The Netherlands, 2020; pp. 321–345. [Google Scholar]
- Samadian, H.; Hosseini-Nami, S.; Kamrava, S.K.; Ghaznavi, H.; Shakeri-Zadeh, A. Folate-conjugated gold nanoparticle as a new nanoplatform for targeted cancer therapy. J. Cancer Res. Clin. Oncol. 2016, 142, 2217–2229. [Google Scholar] [CrossRef]
- Martin, L.P.; Konner, J.A.; Moore, K.N.; Seward, S.M.; Matulonis, U.A.; Perez, R.P.; Su, Y.; Berkenblit, A.; Ruiz-Soto, R.; Birrer, M.J. Characterization of folate receptor alpha (FRα) expression in archival tumor and biopsy samples from relapsed epithelial ovarian cancer patients: A phase I expansion study of the FRα-targeting antibody-drug conjugate mirvetuximab soravtansine. Gynecol. Oncol. 2017, 147, 402–407. [Google Scholar] [CrossRef] [Green Version]
- Alves, R.C.; Schulte, Z.M.; Luiz, M.T.; Bento da Silva, P.; Frem, R.C.G.; Rosi, N.L.; Chorilli, M. Breast Cancer Targeting of a Drug Delivery System through Postsynthetic Modification of Curcumin@N 3 -bio-MOF-100 via Click Chemistry. Inorg. Chem. 2021, 60, 11739–11744. [Google Scholar] [CrossRef]
- An, J.; Farha, O.K.; Hupp, J.T.; Pohl, E.; Yeh, J.I.; Rosi, N.L. Metal-adeninate vertices for the construction of an exceptionally porous metal-organic framework. Nat. Commun. 2012, 3, 604. [Google Scholar] [CrossRef] [Green Version]
- MacRae, C.F.; Sovago, I.; Cottrell, S.J.; Galek, P.T.A.; McCabe, P.; Pidcock, E.; Platings, M.; Shields, G.P.; Stevens, J.S.; Towler, M.; et al. Mercury 4.0: From visualization to analysis, design and prediction. J. Appl. Crystallogr. 2020, 53, 226–235. [Google Scholar] [CrossRef]
- Stewart, J.J.P. Optimization of parameters for semiempirical methods VI: More modifications to the NDDO approximations and re-optimization of parameters. J. Mol. Model. 2013, 19, 1–32. [Google Scholar] [CrossRef] [PubMed] [Green Version]
- Stewart, J.J.P. Optimization of parameters for semiempirical methods V: Modification of NDDO approximations and application to 70 elements. J. Mol. Model. 2007, 13, 1173–1213. [Google Scholar] [CrossRef] [PubMed] [Green Version]
- Free Download: BIOVIA Discovery Studio Visualizer. Dassault Systèmes. Available online: https://discover.3ds.com/discovery-studio-visualizer-download (accessed on 21 August 2022).
- Schneidman-Duhovny, D.; Inbar, Y.; Nussinov, R.; Wolfson, H.J. PatchDock and SymmDock: Servers for rigid and symmetric docking. Nucleic Acids Res. 2005, 33, W363–W367. [Google Scholar] [CrossRef] [PubMed] [Green Version]
- AL Haydar, M.; Abid, H.; Sunderland, B.; Wang, S. Metal organic frameworks as a drug delivery system for flurbiprofen. Drug Des. Devel. Ther. 2017, 11, 2685–2695. [Google Scholar] [CrossRef] [PubMed] [Green Version]
- Ray Chowdhuri, A.; Bhattacharya, D.; Sahu, S.K. Magnetic nanoscale metal organic frameworks for potential targeted anticancer drug delivery, imaging and as an MRI contrast agent. Dalt. Trans. 2016, 45, 2963–2973. [Google Scholar] [CrossRef] [PubMed]
- Tiwari, A.; Singh, A.; Garg, N.; Randhawa, J.K. Curcumin encapsulated zeolitic imidazolate frameworks as stimuli responsive drug delivery system and their interaction with biomimetic environment. Sci. Rep. 2017, 7, 12598. [Google Scholar] [CrossRef] [Green Version]
- Spek, A.L. PLATON SQUEEZE: A tool for the calculation of the disordered solvent contribution to the calculated structure factors. Acta Crystallogr. Sect. C, Struct. Chem. 2015, 71, 9–18. [Google Scholar] [CrossRef] [PubMed] [Green Version]
- Braga, D.; Giaffreda, S.L.; Grepioni, F.; Maini, L.; Polito, M. Design, synthesis, characterization and utilization of hydrogen bonded networks based on functionalized organometallic sandwich compounds and the occurrence of crystal polymorphism. Coord. Chem. Rev. 2006, 250, 1267–1285. [Google Scholar] [CrossRef]
- Cole, J.C.; Groom, C.R.; Read, M.G.; Giangreco, I.; McCabe, P.; Reilly, A.M.; Shields, G.P. Generation of crystal structures using known crystal structures as analogues. Acta Crystallogr. Sect. B Struct. Sci. Cryst. Eng. Mater. 2016, 72, 530–541. [Google Scholar] [CrossRef] [Green Version]
- Rawat, S.; Chaturvedi, S. Effect of temperature on the evolution dynamics of voids in dynamic fracture of single crystal iron: A molecular dynamics study. Philos. Mag. 2020, 101, 657–672. [Google Scholar] [CrossRef]
- Rösel, S.; Quanz, H.; Logemann, C.; Becker, J.; Mossou, E.; Cañadillas-Delgado, L.; Caldeweyher, E.; Grimme, S.; Schreiner, P.R. London Dispersion Enables the Shortest Intermolecular Hydrocarbon H···H Contact. J. Am. Chem. Soc. 2017, 139, 7428–7431. [Google Scholar] [CrossRef] [PubMed]
- Rowland, R.S.; Taylor, R. Intermolecular nonbonded contact distances in organic crystal structures: Comparison with distances expected from van der Waals radii. J. Phys. Chem. 1996, 100, 7384–7391. [Google Scholar] [CrossRef]
- Vasconcelos, I.B.; Da Silva, T.G.; Militão, G.C.G.; Soares, T.A.; Rodrigues, N.M.; Rodrigues, M.O.; Da Costa, N.B.; Freire, R.O.; Junior, S.A. Cytotoxicity and slow release of the anti-cancer drug doxorubicin from ZIF-8. RSC Adv. 2012, 2, 9437–9442. [Google Scholar] [CrossRef]
- Zhang, Z.; Wang, J.; Tacha, D.E.; Li, P.; Bremer, R.E.; Chen, H.; Wei, B.; Xiao, X.; Da, J.; Skinner, K.; et al. Folate Receptor α Associated With Triple-Negative Breast Cancer and Poor Prognosis. Arch. Pathol. Lab. Med. 2014, 138, 890–895. [Google Scholar] [CrossRef]
- Song, D.-G.; Ye, Q.; Poussin, M.; Chacon, J.A.; Figini, M.; Powell, D.J. Effective adoptive immunotherapy of triple-negative breast cancer by folate receptor-alpha redirected CAR T cells is influenced by surface antigen expression level. J. Hematol. Oncol. 2016, 9, 56. [Google Scholar] [CrossRef] [Green Version]
- Tacha, B.; Bremer, R. Folate Receptor Alpha Is Frequently Expressed in Triple Negative Breast Cancers; Biocare Medical: Concord, CA, USA; Modern Pathology: Berlim, Germany, 2013; p. 71A. [Google Scholar]
- Chen, Y.; Wu, Q.; Zhang, Z.; Yuan, L.; Liu, X.; Zhou, L. Preparation of Curcumin-Loaded Liposomes and Evaluation of Their Skin Permeation and Pharmacodynamics. Molecules 2012, 17, 5972–5987. [Google Scholar] [CrossRef]


| Assignment | Wavenumber/cm−1 | |
|---|---|---|
| bioMOF-100 | RCA | |
| νasNH | 3341 br | 3335 br |
| νsNH | 3185 br | 3184 br |
| νCHaliphatic | 2929 w | 2927 w |
| νC=O + δNH2 | 1669 s | 1665 s |
| νO-C=O + νC=N + νC=C | 1607 s | 1607 s |
| δC-NH | 1547 w | 1543 m |
| δnpOH + δN=CH | 1467 w | 1467 w |
| yC-H | 1386 s | 1384 s |
| νC-O | 1255 w | 1255 w |
| νC-NH2 | 1212 m | 1215 m |
| δnpCAr-H + δC-N=C + νC-N=C | 1176 w | 1171 w |
| δnpCAr-H + δC-N=C + νC-N=C | 1152 m | 1153 w |
| δnpCAr-H + δC-N-C | 1097 m | 1099 m |
| νNC + yNH2 | 856 m | 857 m |
| νNC + yNH2 | 843 m | 843 m |
| δfpCAr-CAr-CAr | 773 s | 774 s |
| Results | % of Elements | ||||
|---|---|---|---|---|---|
| C | H | N | O | Zn | |
| RCA | 46.78 | 4.08 | 11.90 | 21.57 | 15.67 |
| bioMOF-100 | 45.43 | 7.51 | 14.84 | 24.59 | 7.63 |
| Ratio RCA:CCM | Contact Time (Days) | EE (%) |
|---|---|---|
| 1:1 | 1 | 32.80 |
| 1:3 | 1 | 32.75 |
| 1:3 | 2 | 38.82 |
| 1:3 | 3 | 44.00 |
| 1:3 | 4 | 41.06 |
| 1:3 | 7 | 17.66 |
| 1:4 | 4 | 12.19 |
| 1:4 | 7 | 23.65 |
| 1:2 | 7 | 25.13 |
| 2:1 | 7 | 23.67 |
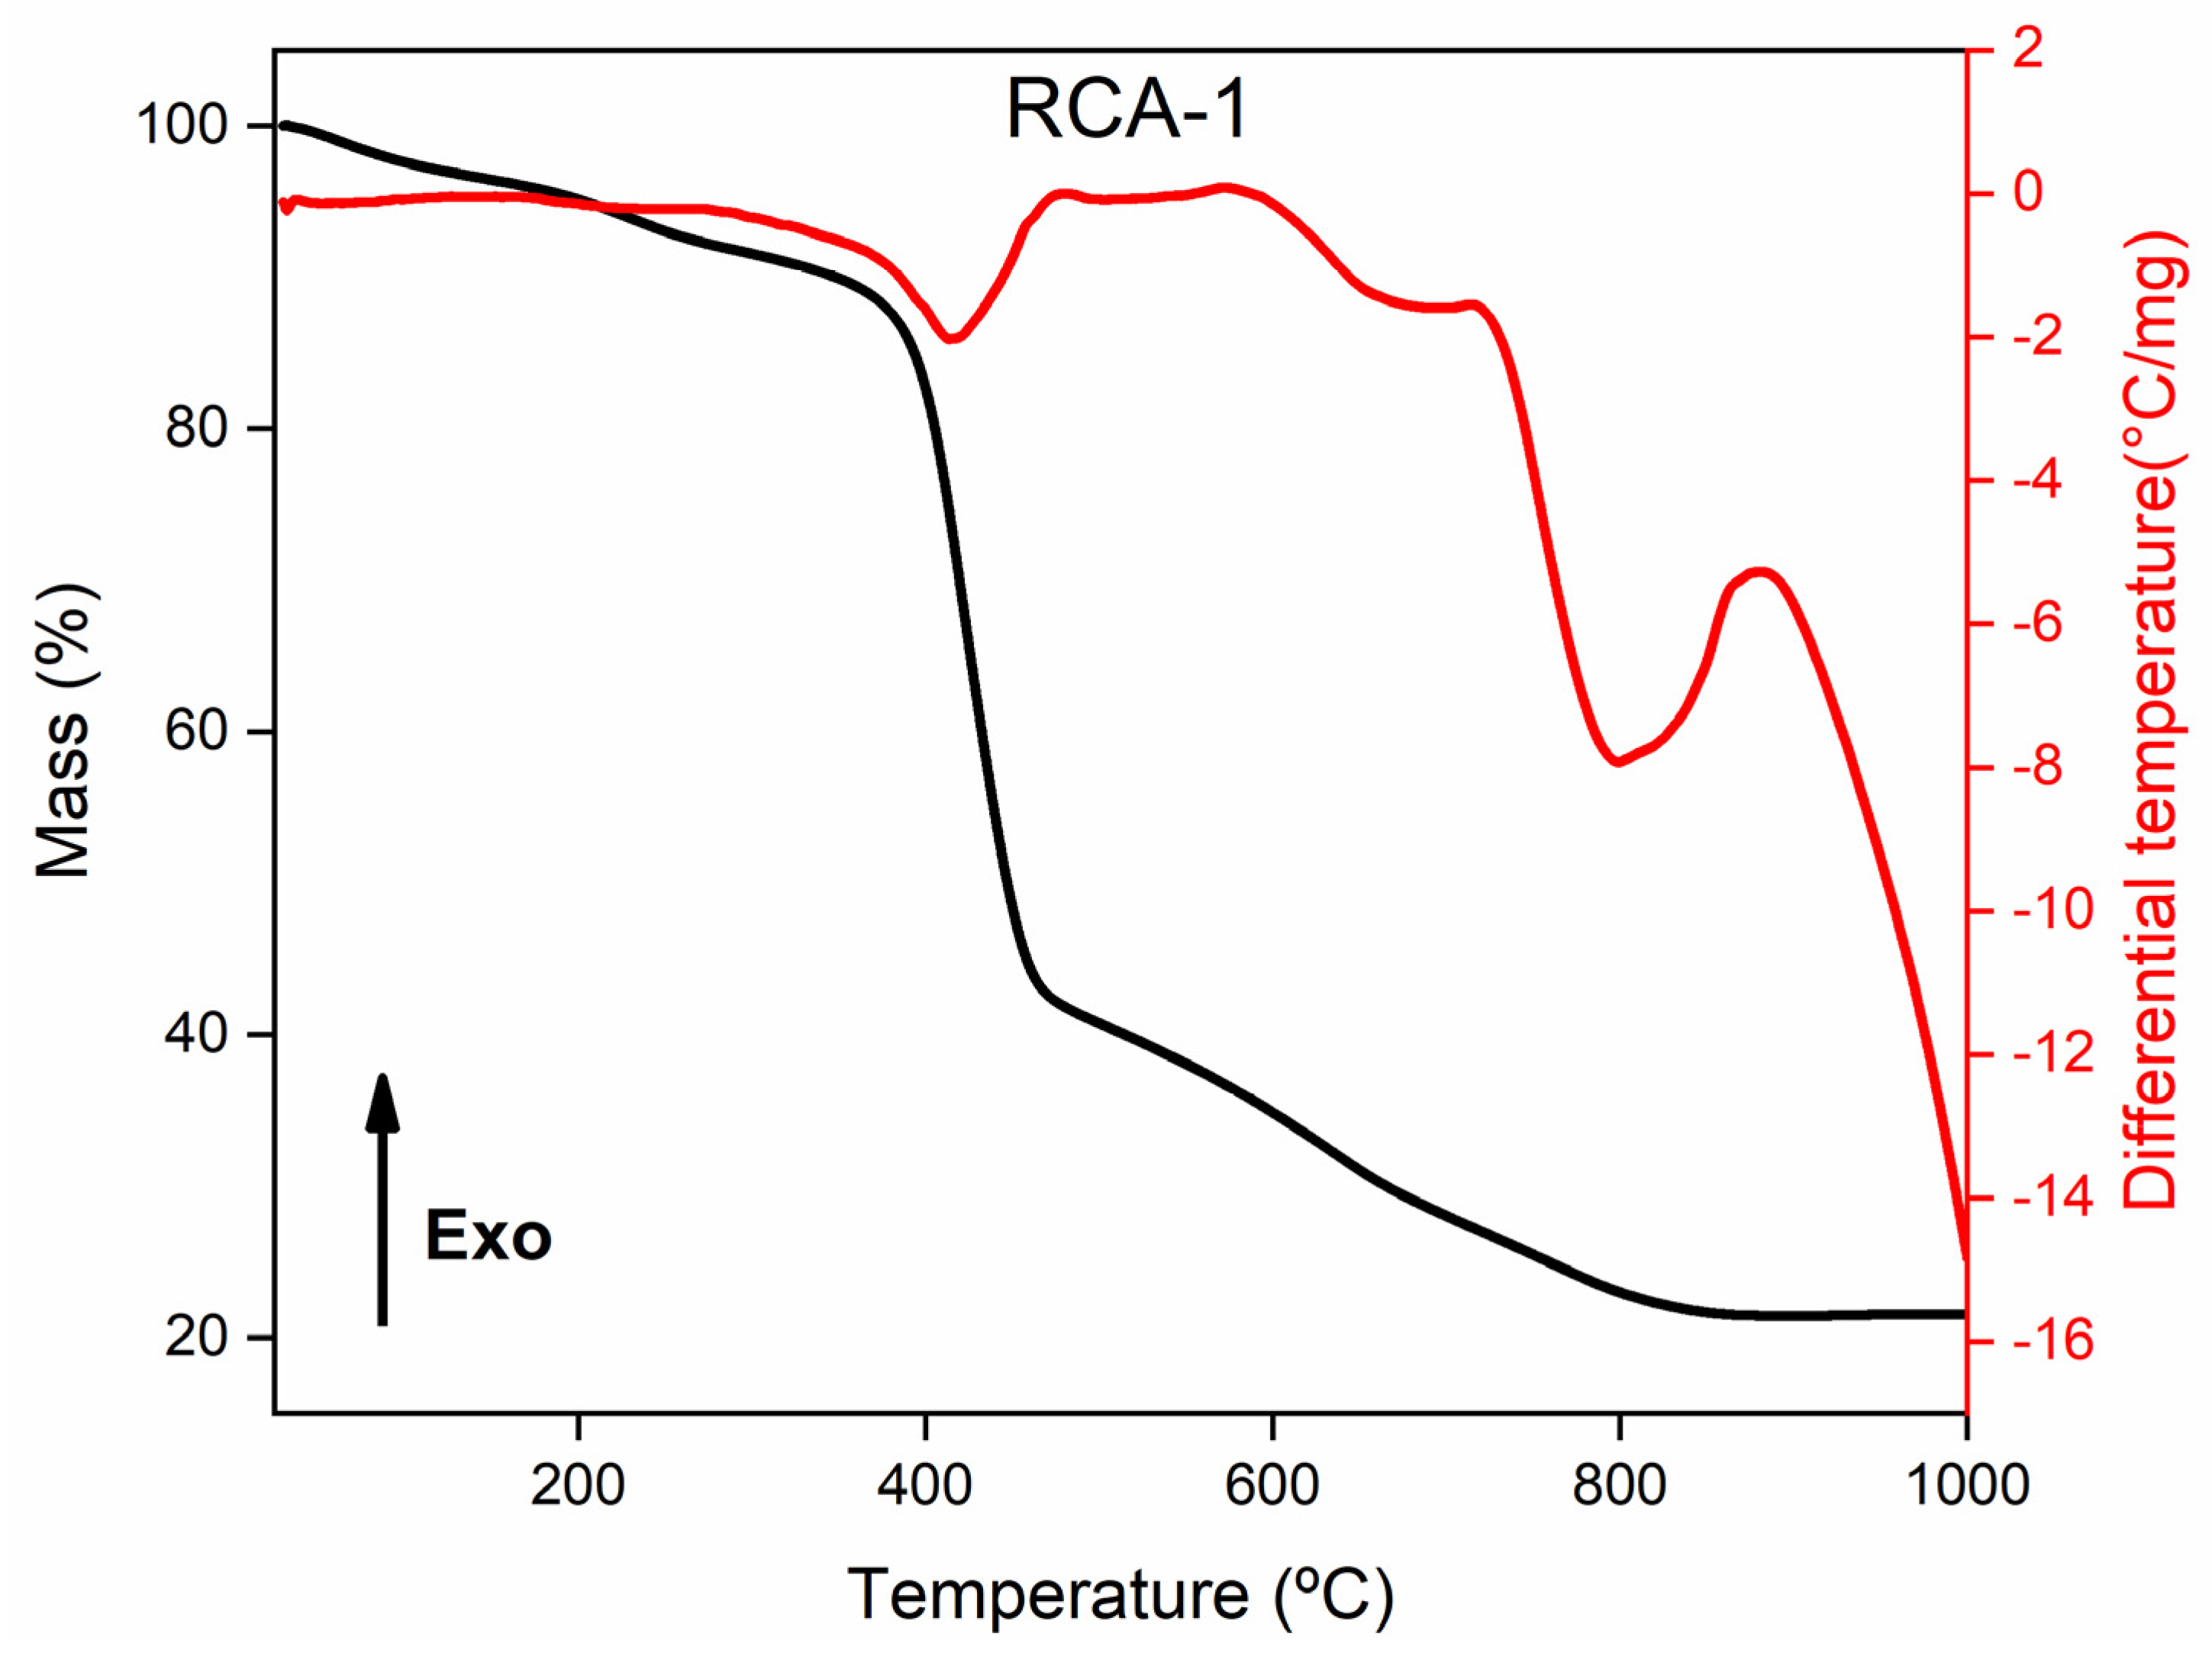
| Compound | Attribution | Temperature (°C) | Weight Loss (%) |
|---|---|---|---|
| RCA-1 | Solvents | Tamb-55 | 10.65 |
| Elimination of organic matter | 355–840 | 68.51 | |
| Residue | 840–1000 | 20.84 | |
| CCM@RCA-1D | Dehydration | Tam-110 | 5.77 |
| Solvent + CCM | 110–355 | 6.07 | |
| Elimination of organic matter | 355–790 | 63.06 | |
| Residue | 790–1000 | 24.71 |
Publisher’s Note: MDPI stays neutral with regard to jurisdictional claims in published maps and institutional affiliations. |
© 2022 by the authors. Licensee MDPI, Basel, Switzerland. This article is an open access article distributed under the terms and conditions of the Creative Commons Attribution (CC BY) license (https://creativecommons.org/licenses/by/4.0/).
Share and Cite
Alves, R.C.; Perosa Fernandes, R.; Lira de Farias, R.; da Silva, P.B.; Santos Faria, R.; Quijia, C.R.; Galvão Frem, R.C.; Azevedo, R.B.; Chorilli, M. Fabrication of Functional bioMOF-100 Prototype as Drug Delivery System for Breast Cancer Therapy. Pharmaceutics 2022, 14, 2458. https://doi.org/10.3390/pharmaceutics14112458
Alves RC, Perosa Fernandes R, Lira de Farias R, da Silva PB, Santos Faria R, Quijia CR, Galvão Frem RC, Azevedo RB, Chorilli M. Fabrication of Functional bioMOF-100 Prototype as Drug Delivery System for Breast Cancer Therapy. Pharmaceutics. 2022; 14(11):2458. https://doi.org/10.3390/pharmaceutics14112458
Chicago/Turabian StyleAlves, Renata Carolina, Richard Perosa Fernandes, Renan Lira de Farias, Patricia Bento da Silva, Raquel Santos Faria, Christian Rafael Quijia, Regina Célia Galvão Frem, Ricardo Bentes Azevedo, and Marlus Chorilli. 2022. "Fabrication of Functional bioMOF-100 Prototype as Drug Delivery System for Breast Cancer Therapy" Pharmaceutics 14, no. 11: 2458. https://doi.org/10.3390/pharmaceutics14112458