1. Introduction
Frequently touched objects in the hospital environment can be a dangerous source of bacterial infections, mainly of the skin, to healthcare professionals, patients, and visitors [
1].
Skin and soft tissue infections (SSTIs) [
2] or acute bacterial skin and skin structure infections (ABSSSIs) [
3] are diseases of the skin and associated soft tissues (such as loose connective tissue and mucous membranes) caused by bacterial species, which require treatment with antibiotics.
Until 2008, two categories of skin infections were recognized consisting of complicated SSSIs (cSSSIs) and uncomplicated SSSIs (uSSSIs) [
4], which had different regulatory approval requirements [
3]. In particular, uSSSIs included simple abscesses, impetiginous lesions, furuncles, and cellulitis [
3], while cSSSIs included infections involving deeper soft tissue or requiring significant surgery, such as infected ulcers, burns, and major abscesses or a significant underlying disease state that complicates the response to treatment [
3]. However, when localized to particular anatomical sites, such as the rectal area, where the risk of involvement of anaerobic or Gram-negative pathogens is greater, superficial infections or abscesses have also been considered complicated infections [
3]. uSSSIs are most often caused by
Staphylococcus aureus and
Streptococcus pyogenes, while cSSSIs can also be caused by a number of other pathogens [
3]. Concerning the diagnosis of SSSIs it has been observed that physicians are generally not used to culture methods for identifying the pathogen [
5]. Moreover, common treatments are often empirical, consisting in the choice of antibiotics based on the symptoms reported by patients and the location of the infection. Furthermore, treatment strategies are often designed based on trial and previous errors [
5]. Unfortunately, to treat SSSIs, physicians often prescribe broad-spectrum antibiotics, a questionable practice that contributes to the increasing emergence of antibiotic resistance, a trend linked to the widespread and unjustified use of these drugs. The increased prevalence of antibiotic resistance is evident for methicillin-resistant
Staphylococcus aureus (MRSA), commonly involved in SSSIs, whose prognosis is worsened, and treatment options limited, by its presence. For less severe infections, microbiological assessment of tissue culture has been shown to be of great use in guiding management decisions [
5]. There is no evidence to support or disagree with the use of Chinese herbal medicines in the treatment of SSTIs [
6]. Concerning the armamentarium currently available for the treatment of skin infections, linezolid is an antibiotic used in the hospital setting for infections caused by multidrug-resistant (MDR) Gram-positive bacteria [
7,
8], including streptococci, vancomycin-resistant enterococci (VRE), and MRSA [
7,
9]. Although it can be used for a variety of other infections, including drug-resistant tuberculosis, linezolid is primarily used to treat skin infections and pneumonia [
8,
10]. It can be administered both intravenously and orally [
8]. When given for short periods, linezolid is a relatively safe antibiotic [
11], but used for longer periods it may cause nerve damage, including optic nerve damage, which may be irreversible [
12]. Unfortunately, although bacterial resistance to linezolid remained low until 2014 [
13], many clinical isolates have been found resistant to linezolid in the last decade. Furthermore, linezolid has been shown to be clinically ineffective against most Gram-negative bacteria, including those of the genus
Pseudomonas and
Enterobacteriaceae [
14].
Tedizolid (formerly torezolid, trade name Sivextro) [
15] is an antibiotic of the oxazolidinone class, usually administered as a prodrug of phosphate esters, 4 to 16 times more potent than linezolid against staphylococci and enterococci [
16]. It is clinically approved for the treatment of cSSSIs [
17] caused by MRSA and methicillin-sensitive strains (MSSAs),
S. pyogenes, S. agalactiae,
S. anginosus,
S. intermedius,
S. constellatus, and
Enterococcus faecalis [
18,
19,
20,
21]. Although the most common side effects are generally of mild or moderate severity, including nausea (feeling sick), headache, diarrhea, and vomiting [
22], the use of this drug to treat ABSSSIs is recommended only in adults [
22].
Due to this scenario that shows limited resources to treat severe skin infections, and especially those sustained by Gram-negative MDR pathogens, new effective antibacterial agents are urgently needed. Furthermore, concerning the possible formulation of new bactericidal/antibacterial compounds in potentially clinically applicable dosage forms, their conversion into hydrogels could effectively satisfy the urgent demand for new and effective antibacterial formulations suitable for topical administration [
23]. Hydrogels are 3D polymer networks generally crosslinked by either physical interactions or covalent bonds [
24]. Currently, hydrogels with an antibacterial function are of great interest in biomedical research. Many advanced antibacterial hydrogels have been and are being developed, each one with unique qualities, such as a high-water swelling ability, high oxygen permeability, improved biocompatibility, ease of drug loading and release, and structural diversity [
25]. In this regard, Andrèn et al. recently developed a non-toxic and hydrolytically rapidly degradable antibacterial hydrogel for the preventive treatment of surgical site infections during the first crucial 24 h period without relying on conventional antibiotics [
26]. Moreover, hydrogels consisting of cationic polymer chains obtainable either by physical or chemical crosslinking have been extensively studied as an alternative material for antibacterial applications [
25]. In this context, aiming to develop new bactericidal formulations for topical use, we recently developed a Bingham pseudoplastic hydrogel (CP_1.1-Hgel). Interestingly, it was achieved simply by dispersing in water a non-crosslinked cationic styrene-based copolymer (CP1) endowed with potent bactericidal effects and unexpectedly capable of self-forming gels, without the use of gelling agents or other additives. Although more in-depth investigations are currently underway to evaluate its effective use for the treatment of skin infections, the first studies carried out on CP_1.1-Hgel and the absence of additives (potentially incompatible with the skin or capable of interfering with the bioactivity of CP1) supported its further development. Here, to expand our research in the field, we have reported the development of a new two-component hydrogel, which, due to its physicochemical characteristics, and the biological profiles of its ingredients, could hold promise for the treatment of bacterial-borne skin infections sustained by bacteria with a difficult resistance profile, or for improving infected chronic wounds.
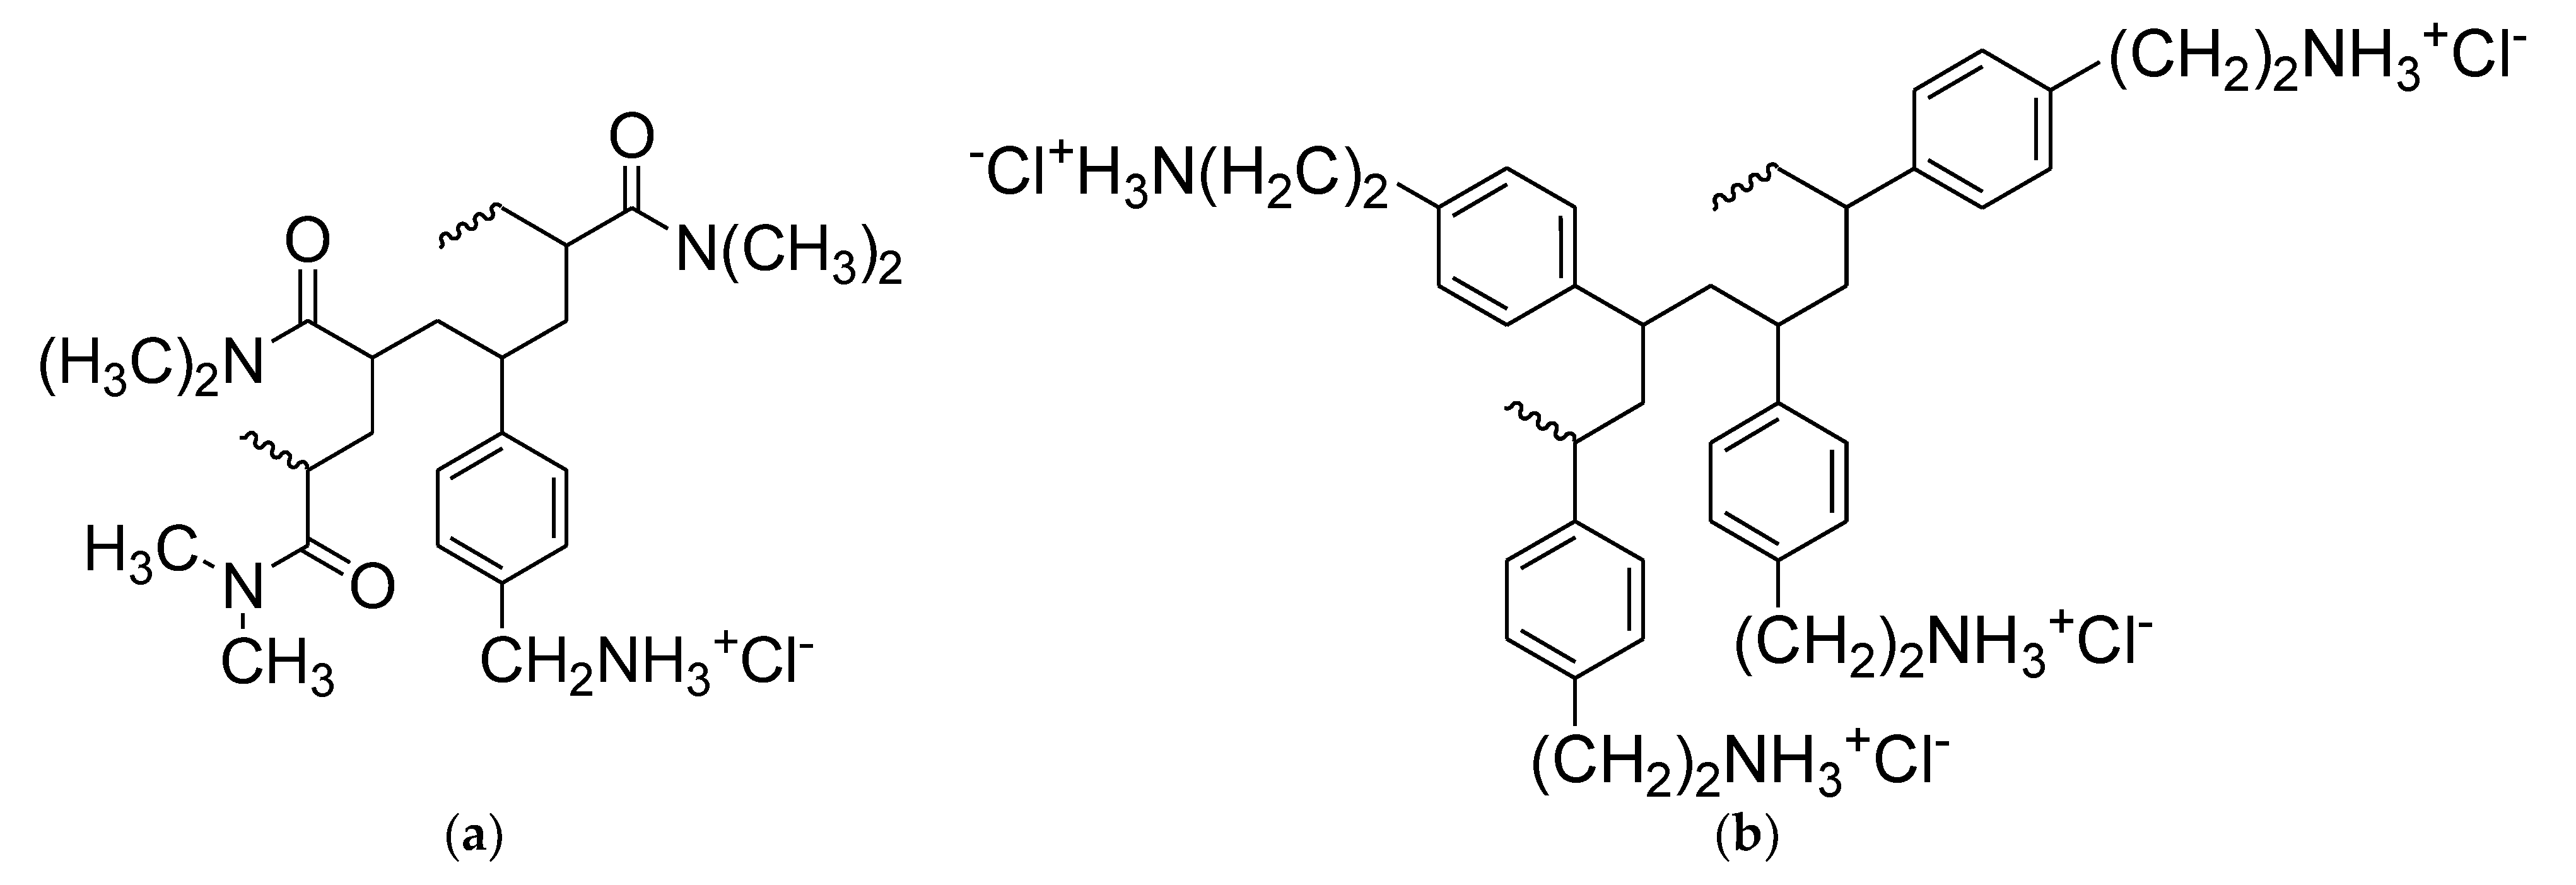
In particular, to prepare the new gel, we used two recently reported styrene-based polymers (namely CP1 and OP2,
Figure 1) endowed with rapid bactericidal effects and very low minimum inhibitory concentrations (MICs) (0.1–0.8 µM for CP1 and 0.35–2.9 µM for OP2) [
27] against several MDR clinical isolates, including those mostly found in hospital settings and that are responsible for severe skin infections. The new two-component hydrogel based on both CP1 and OP2, different to our first experience with CP1, proved to have different rheological properties, showing a dilatant shear thickening behavior. Moreover, it was characterized by a very high porosity and swelling ability. Interestingly, even if not cross-linked, copolymer CP1 (
Figure 1a) takes part in the gel formulation both as a bioactive ingredient like homopolymer OP2 (
Figure 1b), and, due to its capability of self-forming gels, also as a thickening agent for gelling OP2.
Practically, the CP1OP2-Hgel developed here was obtained upon simple dispersion of the two polymers in water, without the need of gelling agents or other additives, thus limiting possible skin incompatibilities in future topical administrations or undesired interactions between components, as well as an unexpected reduction in the antibacterial effects of CP1 and/or OP2. Therefore, CP1OP2-Hgel may possibly merge the antibacterial characteristics of the two ingredients, thus enlarging the spectrum of action of single components. Biological experiments to evaluate possible enhancements or reductions in the antibacterial effects of CP1 and OP2 by their formulation in gel, as well as to assess the antibiofilm efficacy of CP1OP2-Hgel, are currently being undertaken. However, before preparing the formulation, we checked whether it was worth using CP1 and OP2 as bioactive ingredients of a new hydrogel hypothesized for a future skin use, by carrying out dose-dependent cytotoxicity studies with CP1 and OP2 on human fibroblasts at 24 h of exposure. Following results that confirmed the rationale for their formulation as a gel, CP1OP2-Hgel was prepared and characterized by ATR-FTIR spectroscopy and scanning electron microscopy (SEM) to investigate its chemical structure and morphology. Its rheological properties were studied by determining its dynamic viscosity and processing data by proper mathematical models; the water loss profile over time, the equilibrium swelling ratio percentage, and the maximum swelling capacity and porosity were obtained by carrying out the appropriate experimental tests, as described in the work. Finally, although the NH
2 content in CP1 and OP2 as isolated polymers had already been evaluated [
27], CP1OP2-Hgel was titrated here potentiometrically to determine the NH
2 equivalents per gram of gel.
3. Results and Discussion
As reported in our previous work, both CP1 and OP2 demonstrated strong bactericidal properties against several MDR clinical isolates of different species of Gram-positive and Gram-negative pathogens, regardless of their complex profiles of resistance (MICs = 0.1–0.8 µM (CP1) and 0.34–2.8 µM (OP2)) [
27]. Importantly, when tested with time–kill experiments on different clinically relevant isolates of the Gram-positive and Gram-negative species, such as MRSA,
E. coli, and
P. aeruginosa strains, both cationic polymers, and especially OP2, demonstrated powerful and rapid bactericidal effects at 4 x MICs, regardless of the resistance profiles of the bacteria tested [
27]. We also observed that, in some cases, their antibacterial effects were complementary. For example, while OP2 was remarkably active on the three most relevant species of non-fermenting Gram-negative bacteria, such as
A. baumannii,
S. malthophilia, and
P. aeruginosa, CP1, although with lower MICs, was also active on
P. aeruginosa, while it was ineffective on
A. baumannii and
S. malthophilia. Interestingly, we observed that CP1 self-formed gels by its simple dispersion in water without the use of gelling agents or other additives. On these findings, we have recently prepared and completely characterized a CP1-based self-formed hydrogel (CP1_1.1-Hgel), obtained by the simple dispersion in water of CP1 at 1.1% wt/wt. Following the characterization results and the biological behavior of its unique ingredient (CP1) on bacteria [
27] and on human fibroblasts at 4 h of exposure (
Figures S2 and S3 in Supplementary Materials), this first gel developed by us appears interesting for the development of a new antibacterial gel formulation topically applicable to treat skin infections. In this study, it was speculated that CP1 could be used as a gelling agent to formulate OP2 in a new two-component hydrogel that, thanks to the bactericidal properties of the two ingredients, could have a broader spectrum of action. However, before going ahead with the formulation, we assessed first the cytotoxic behavior of OP2 on human fibroblasts, as previously done for CP1, exposing cells to the polymer for 4 h. Then, to obtain data more compatible with MICs, which were determined at 24 h of exposure, as recommended in microbiology, we evaluated the cytotoxic behavior of both CP1 and OP2 on fibroblasts after 24 h of exposure.
3.1. Dose-Dependent Cytotoxicity Experiments
Assuming a possible cutaneous use of the CP1OP2-based gel as an antibacterial agent, due to the potent bactericidal effects of its ingredients, dose-dependent cytotoxicity studies were first carried out with OP2 on human fibroblasts (MAIL-2) at 4 h of exposure, as already done for CP1 (
Figures S2 and S3 in Supplementary Materials). Subsequently, we performed the same experiments exposing the MAIL-2 cells to both CP1 and OP2 for 24 h.
Figure S4 in the Supplementary Materials shows the bar graph of the cells’ viability percentage vs. OP2 concentration after 4 h of exposure. Here,
Figure 2 and
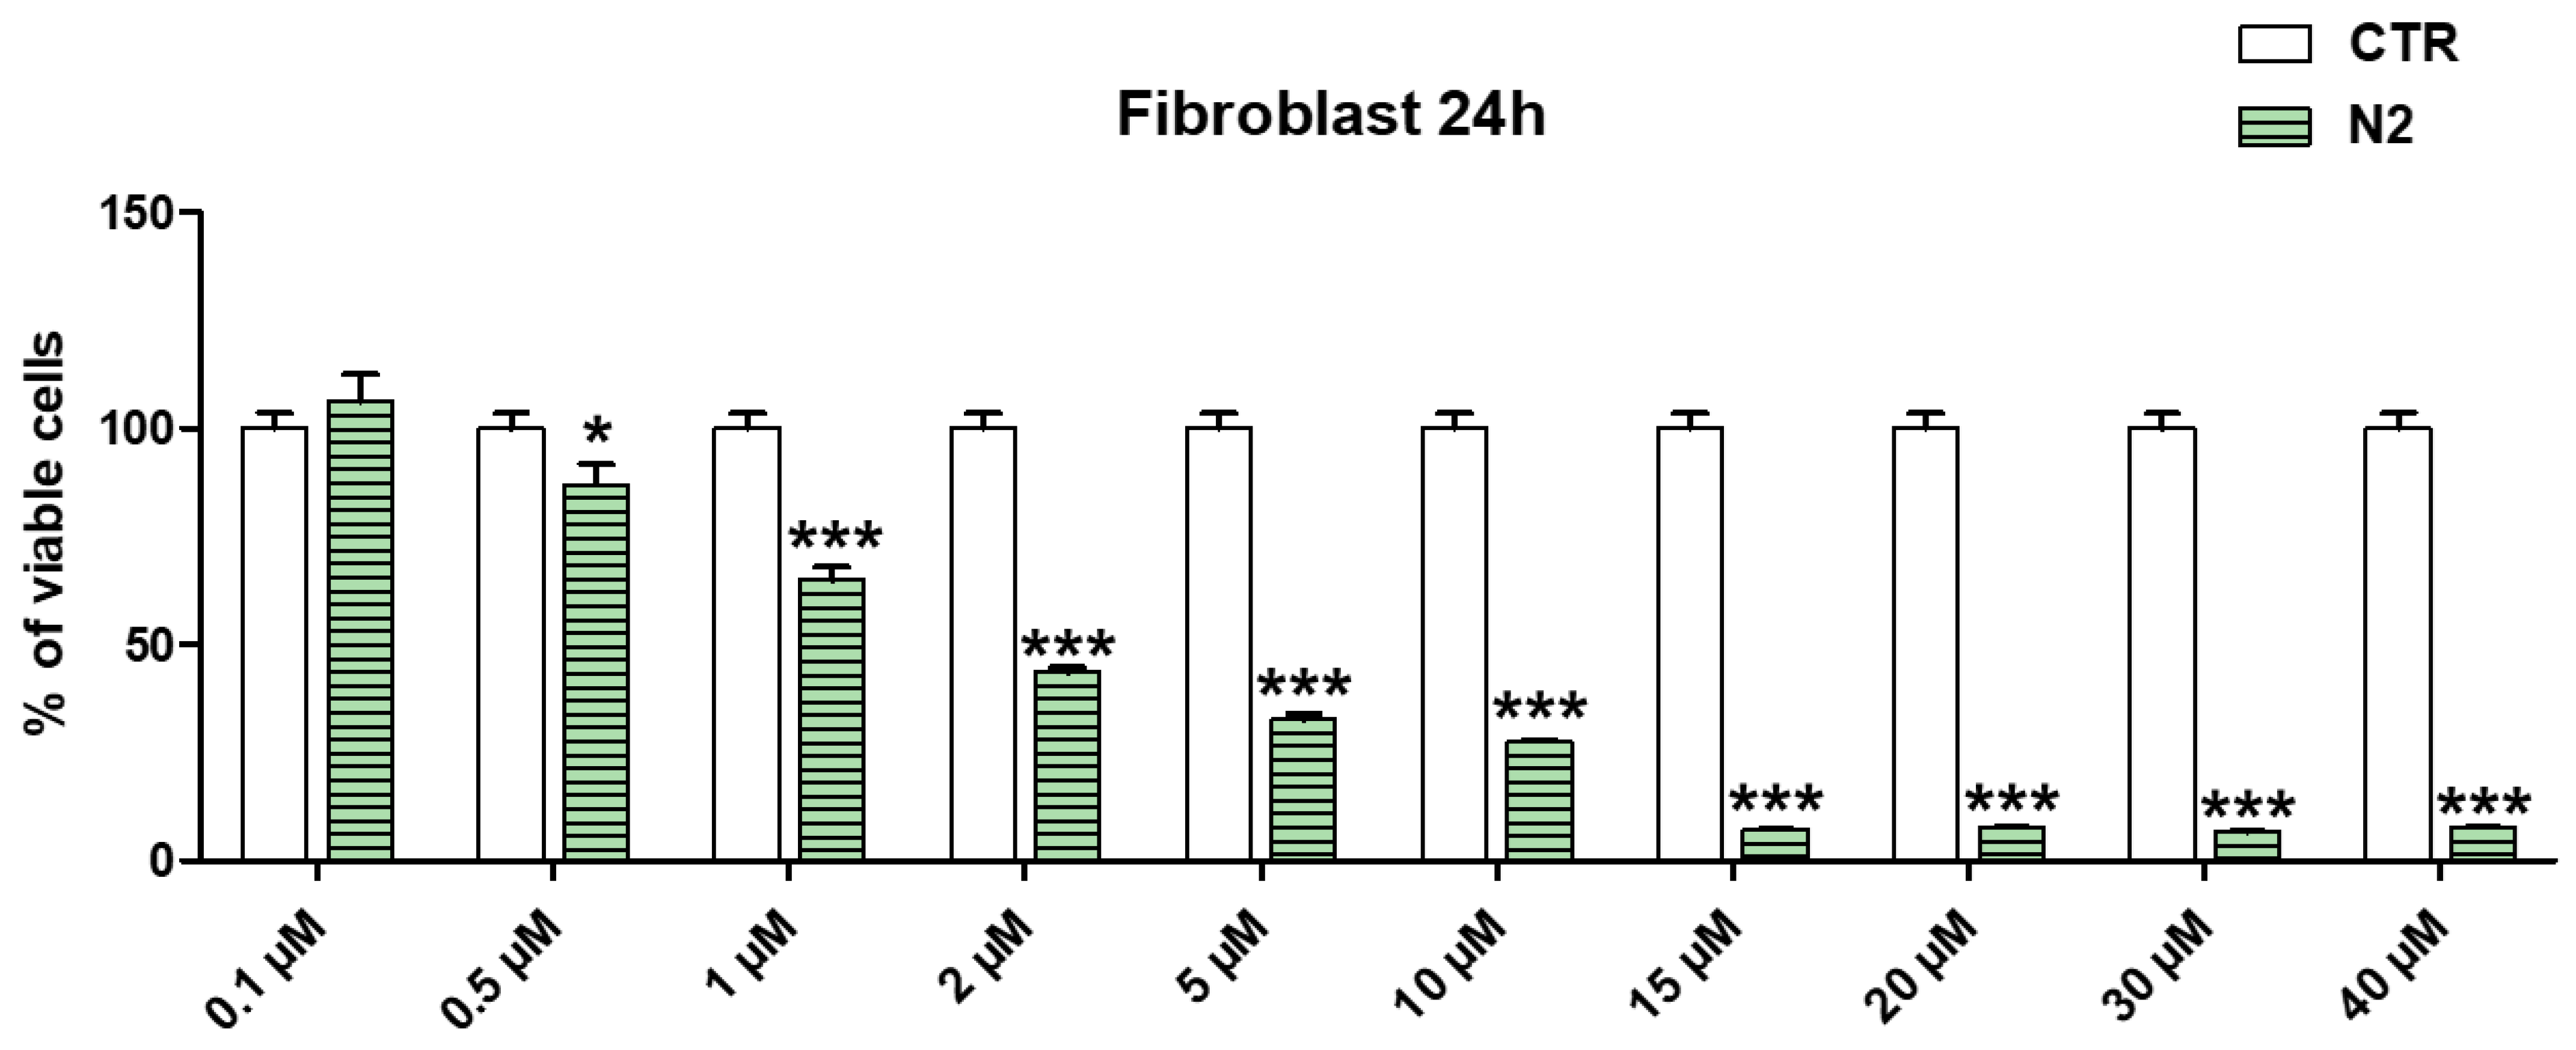
Figure 3 show the same bar graphs obtained by the dose-dependent cytotoxicity experiments carried out for 24 h of exposure of MAIL-2 cells to CP1 and OP2, respectively.
Human fibroblasts were selected for cytotoxicity experiments because they are widely used for the evaluation of the cytotoxicity of compounds intended for topical administration as cosmetic formulations [
29,
30]. The cytotoxicity of OP2 and CP1 was first evaluated at four hours of exposition because CP1 and OP2 displayed bactericidal activity at 4 and 2 h of exposure, respectively [
27]. The cytotoxicity of both CP1 and OP2 was also assessed up to 24 h, to obtain their LD
50 values at 24 h, which were necessary to calculate the values of the selectivity indices according to Equation (1), using MICs, which were determined at 24 h of exposure as well.
Considering the cytotoxicity of both CP1 and OP2 after 24 h of exposure, CP1 was not cytotoxic for concentrations < 1 μM; cell viability significantly higher than 50% was observed for 1μM CP1 concentrations, whereas CP1 was highly cytotoxic at concentrations ≥ 2 μM (
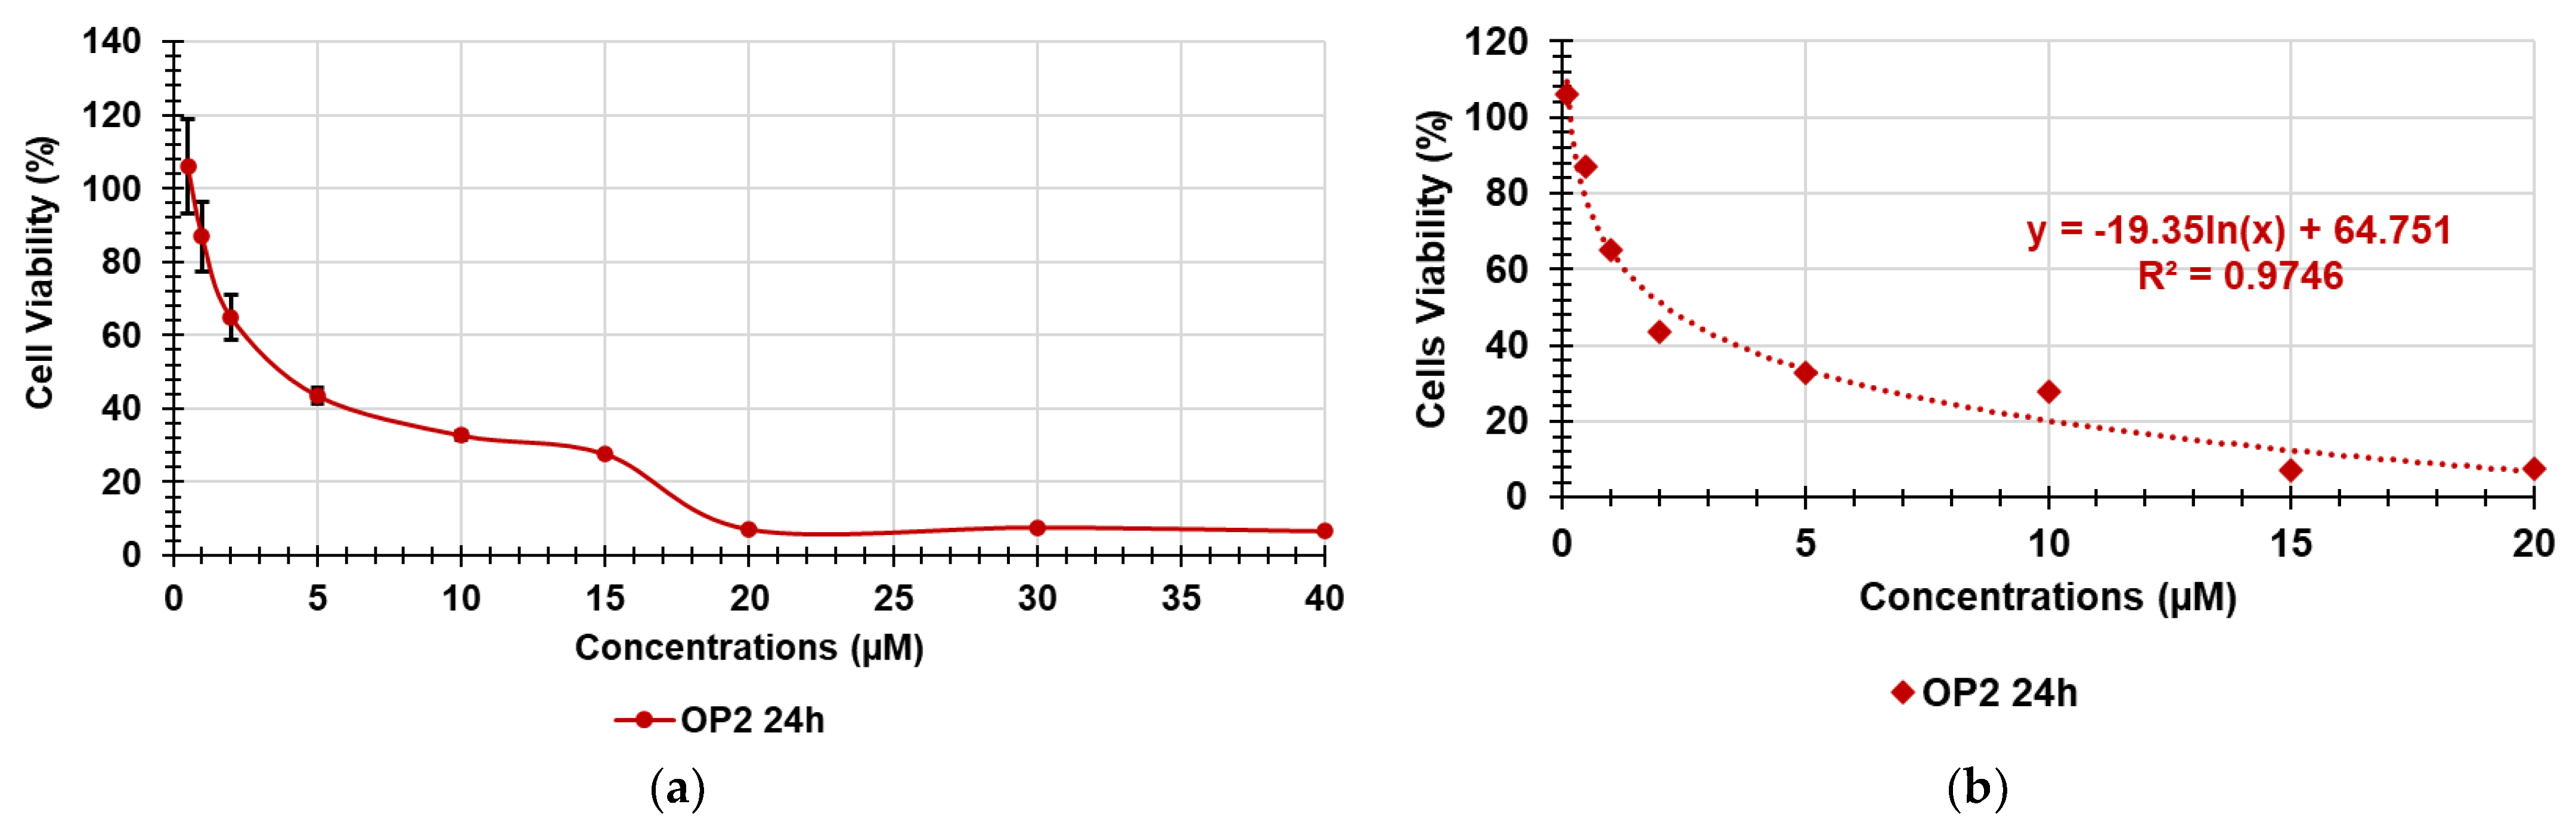
Figure 2). OP2 was less cytotoxic than CP1, since cell viability significantly higher than 50% was observed for OP2 concentrations < 2 μM. Cells viability was of 50% for 2 μM OP2 concentrations, while it was highly cytotoxic at concentration over 2 μM. By a comparison between the cytotoxic profiles of CP1 and OP2 obtained at 4 h and those obtained at 24 h, it can be asserted that no significant difference in the cell viability was observed, thus establishing that the cytotoxicity of both polymers is only dose-dependent, and it is not dependent on time of exposure. To obtain more representative information on the feasibility of using CP1 and OP2 in a gel formulation that is possibly applicable to the skin, we determined their SIs against several clinically relevant MDR pathogens, including strains responsible for severe skin infections. Note that SI values are important in deciding the therapeutic applicability of a new antibacterial agent because they measure its capability to selectively inhibit the bacterial cell without damaging the eukaryotic one. To calculate the desired SI values, we first reported the data of cell viability % vs. the concentrations of CP1 and OP2, obtaining the curves shown in
Figure 4a and
Figure 5a, respectively.
The cell viability (%) reported in the graphs for each concentration point was the average of the results obtained from four independent determinations. Using the points of the curve in
Figure 4a up to a concentration of 5 μM and of those of the curve in
Figure 5a up to a concentration of 20 μM, the correspondent dispersion graphs were obtained, and the best fitting tendency lines were reached using the tool provided by Microsoft Excel software. We used only the described concentrations, because over such concentrations, cell viability remained unchanged, and viable cells were insignificant. The tendency line was polynomial for CP1 and logarithmic for OP2. Their good fitting with the dispersion graphs was assured by the very high values of the coefficients of correlation (R
2). The equations of the tendency lines were used to determine the desired LD
50.
Figure 4b and
Figure 5b show the used dispersion graphs, the best fitting tendency lines, and the related equations used to compute the LD
50 of CP1 and OP2. The obtained equations, the R
2 values, the computed values of LD
50, and the range of SIs obtained for CP1 and OP2 calculated according to Equation (1) are reported in
Table 1.
The SI values of CP1 and OP2 calculated for each isolate used in the previous study to determine the MICs of CP1 and OP2 [
27] are instead reported in
Table 2.
According to
Table 1, the LD
50 of CP1 was slightly >1 µM, while that of OP2 was >2 µM, but being the concentration of CP1 necessary to inhibit all Gram-positive and Gram-negative MDR clinical isolates < 1 µM (
Table 2), the relative SI values were all >1 up to values of 12. Similarly, with the exception of
K. pneumoniae 509, for which the OP2 concentration required to inhibit all Gram-positive and Gram-negative MDR clinical isolates was <2 µM (
Table 2), their SI values were all >1, as for CP1, and up to values of 6. In particular, the SI range for CP1 and OP2 was 1.5–12 and 1.5–6, respectively, against isolates of Gram-positive species and 1.5–3.0 and 0.75–3.0, respectively, against Gram-negative strains. Since these values are considered acceptable for a hypothetical, clinically applicable, new antibacterial agent [
31,
32,
33,
34], we continued to use CP1 and OP2 as ingredients to develop a new bactericidal gel with potential for topical administration.
3.2. CP1OP2-HGel Preparation
The potent antibacterial effects observed for both CP1 and OP2 against several alarming MDR clinical isolates responsible for severe nosocomial infections that are nearly untreatable inspired us to formulate them in a new antibacterial dosage form possibly suitable for cutaneous use. Since CP1 was shown to self-form hydrogels [
27] and was successful in providing a single-component hydrogel with excellent physicochemical characteristics, which will soon be published, we thought to formulate them in a new bicomponent hydrogel by exploiting CP1 both as a bactericidal ingredient and as a gelling agent. This strategy would have allowed us to avoid the use of additional additives, which could cause unwanted side reactions both in the preparation phase and in future, when applied to skin. Hydrogels consist of three-dimensional network structures obtained from synthetic and/or natural polymers capable of absorbing and retaining significant amounts of water [
35]. Hydrogels obtained from several polymers have been produced and employed in tissue engineering, pharmaceutical, and biomedical fields [
36]. Therefore, also supported by the favorable selectivity index values determined for CP1 and OP2, according to the procedure described in
Section 2.4, we prepared a CP1OP-Hgel containing the maximum amount of water which the equimolar combination of CP1 and OP2 was capable of absorbing.
Table 3 collects the experimental data of CP1OP2-Hgel preparation, as well as details about CP1 and OP2 concentrations in the prepared hydrogel.
An image is available in the
Supplementary Materials (Figure S5) that shows the very viscous hydrogel obtained, whose volume and weight corresponded to those of the gel at its maximum swelling capability.
Using Equations (2a), (2b), (3a), and (3b), the maximum swelling capability percentages and porosity percentages by volume and by weight were calculated and are reported in
Table 3 (last two columns). The porosity of CP1OP2-Hgel by volume and by weight was similar and very high (85% by volume and 91% by weight), while the maximum swelling capability percentages were 583% and 1033%, respectively. In particular, the porosity was 1.2-fold higher than that of the CP1-based gel, while the maximum swelling capability was 1.9–3.4-fold higher. According to what has been reported, the high porosity and remarkable capacity to absorb water should give CP1OP2-Hgel a high potentiality to function also as a wound-healing hydrogel [
37,
38]. Obviously, further experiments are necessary to confirm this early hypothesis.
3.3. ATR-FTIR Spectra
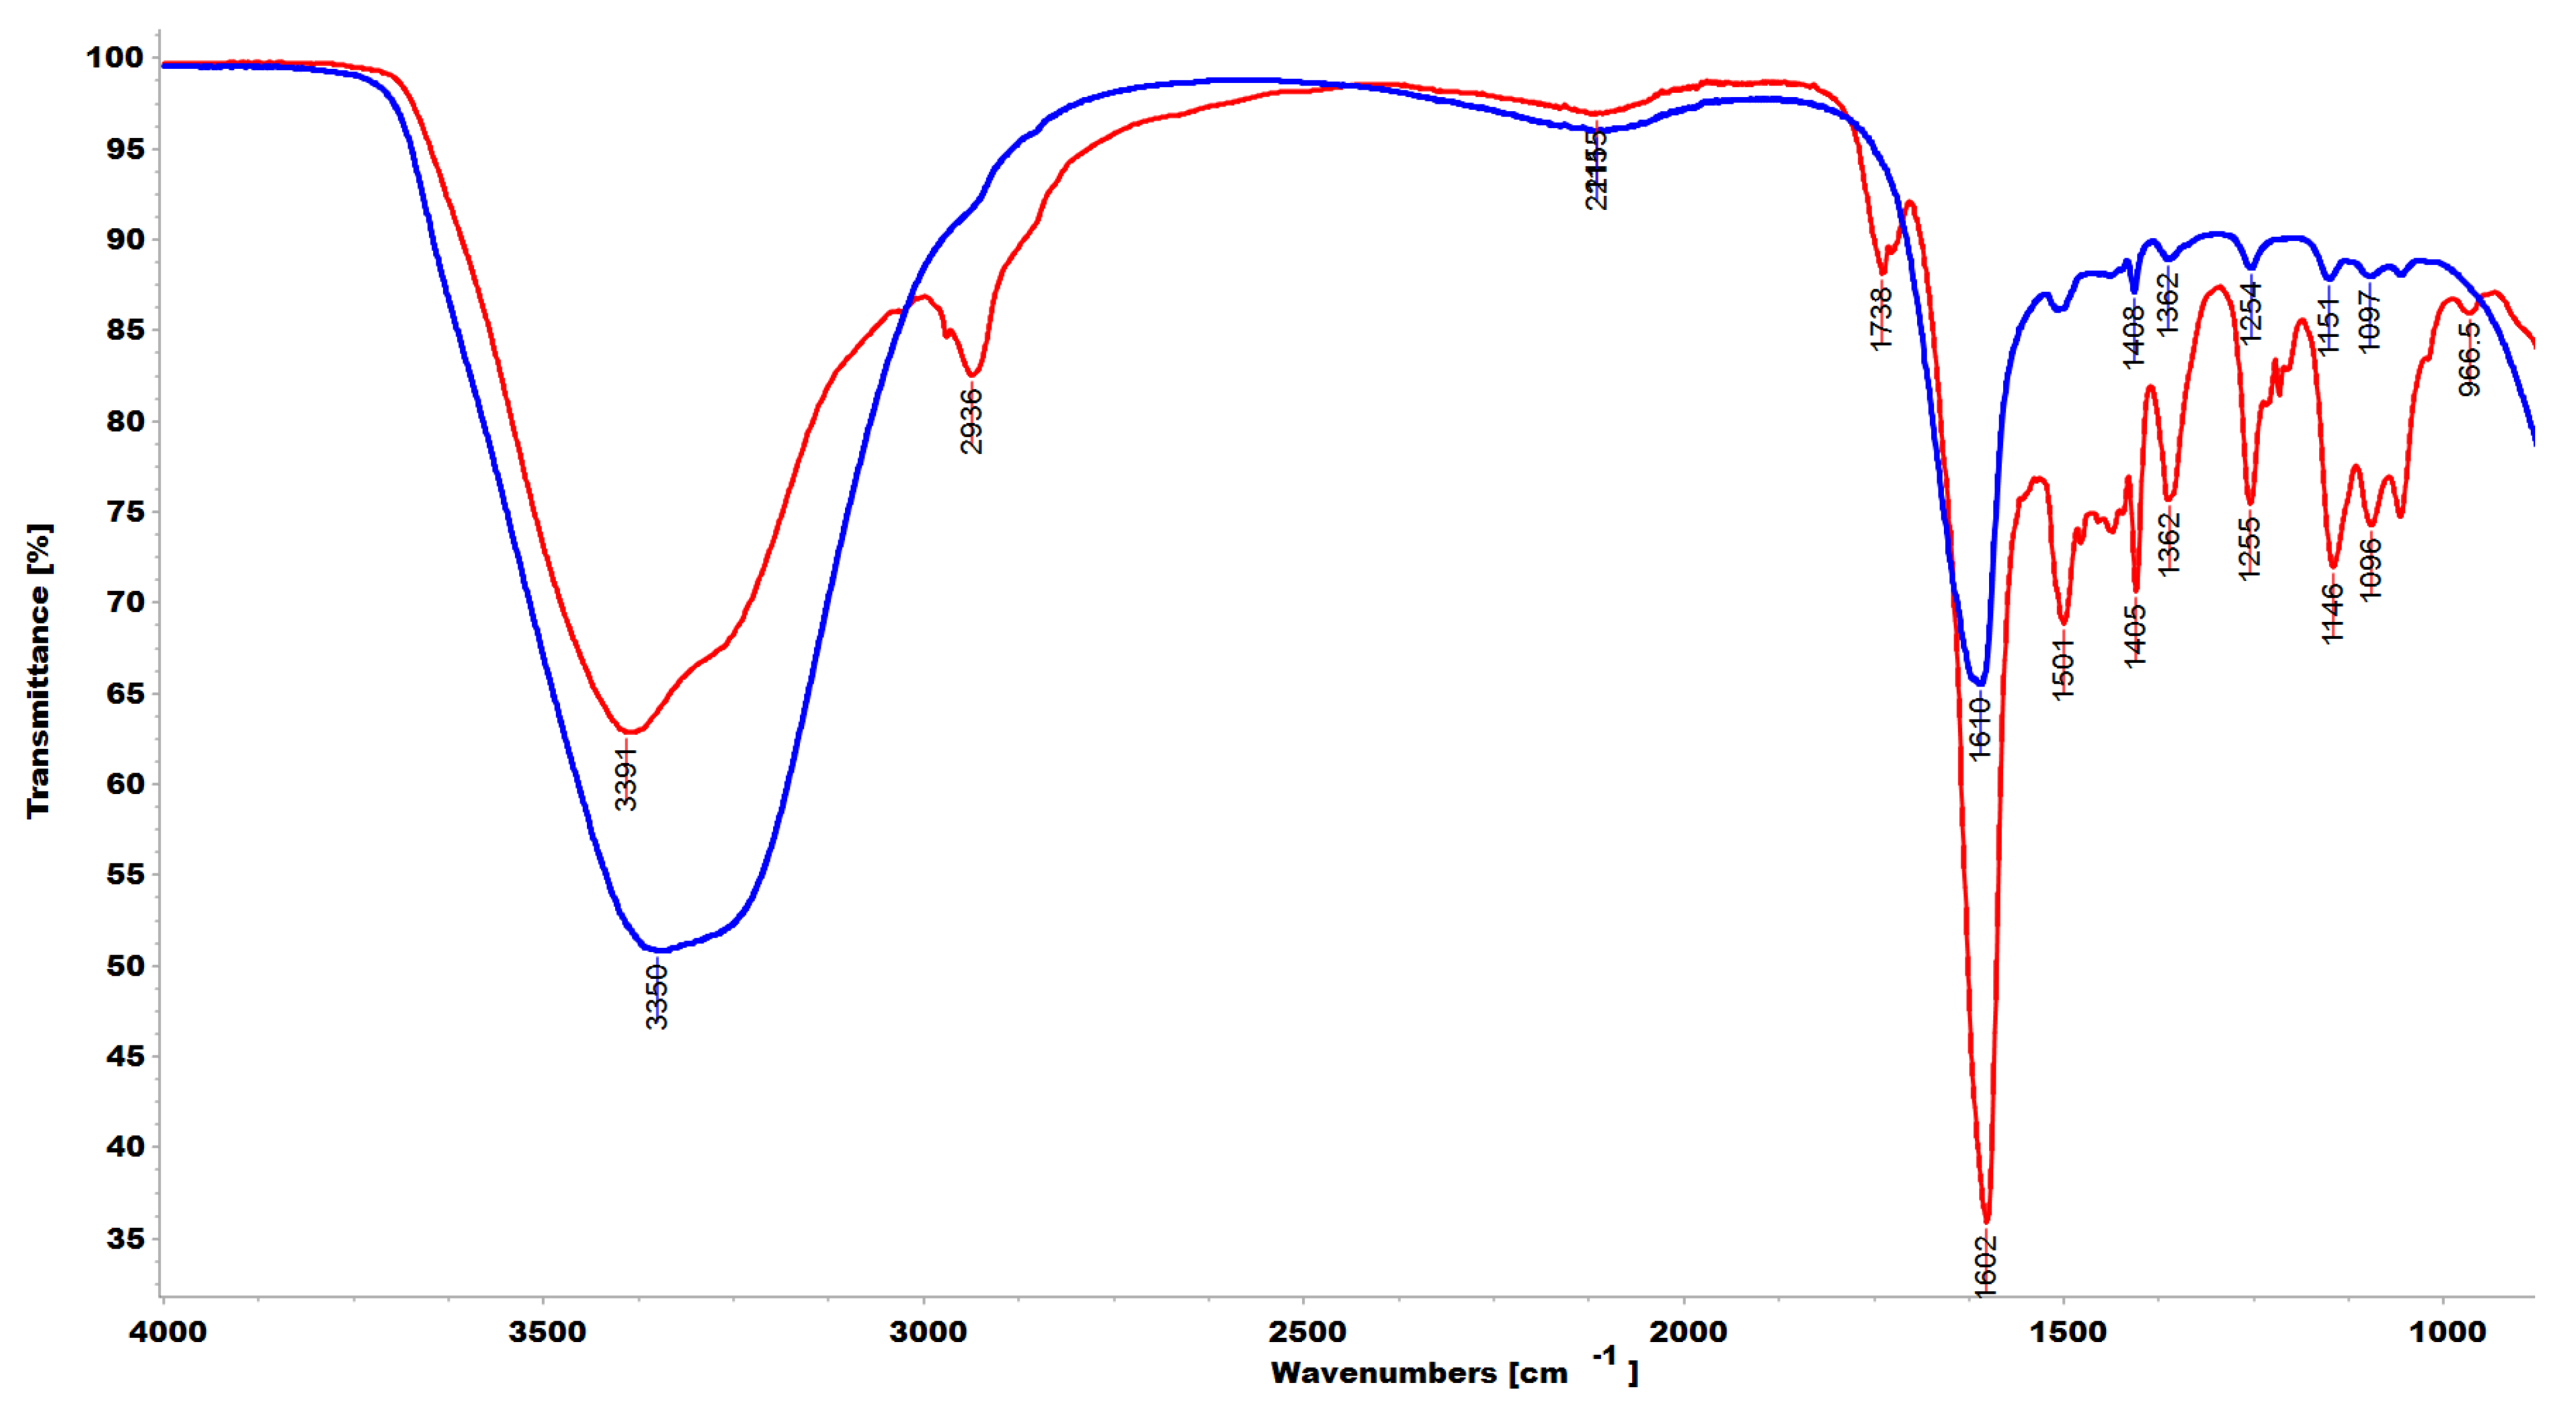
ATR-FTIR analyses were performed directly on samples of the soaked gel and of the rubbery solid obtained by depositing the gel on a glass slide and heating it to dryness. Spectra were acquired in triplicate and those reported in
Figure 6 are representative images.
As expected, although very small bands indicating the presence of the two polymers were detectable at 1509, 1408, 1254, and 1152 cm
−1 (aromatic C=C and C-N stretching bands), the ATR-FTIR spectrum of the soaked gel (blue line) showed mainly the typical bands of water that are present at about 91.2% wt. with respect to CP1 and OP2, whose combination in the gel represents 8.8% of weight. On the contrary, the spectrum of the dried sample, obtained by heating the soaked gel until a rubbery solid (red line) was obtained, showed mainly the typical bands observable in the spectra of copolymer CP1 and homopolymer OP2 [
27], thus establishing that the interactions occurred during the gel formation are reversible, as previously observed for CP1_1.1-Hgel. We assumed an impurity caused the small band at 1739 cm
−1, probably due to the glass slide used or to residual solvents on the acquisition site, generally indicating the presence of C=O groups of the ester type and not compatible with the structure of ingredients in CP1OP2-Hgel.
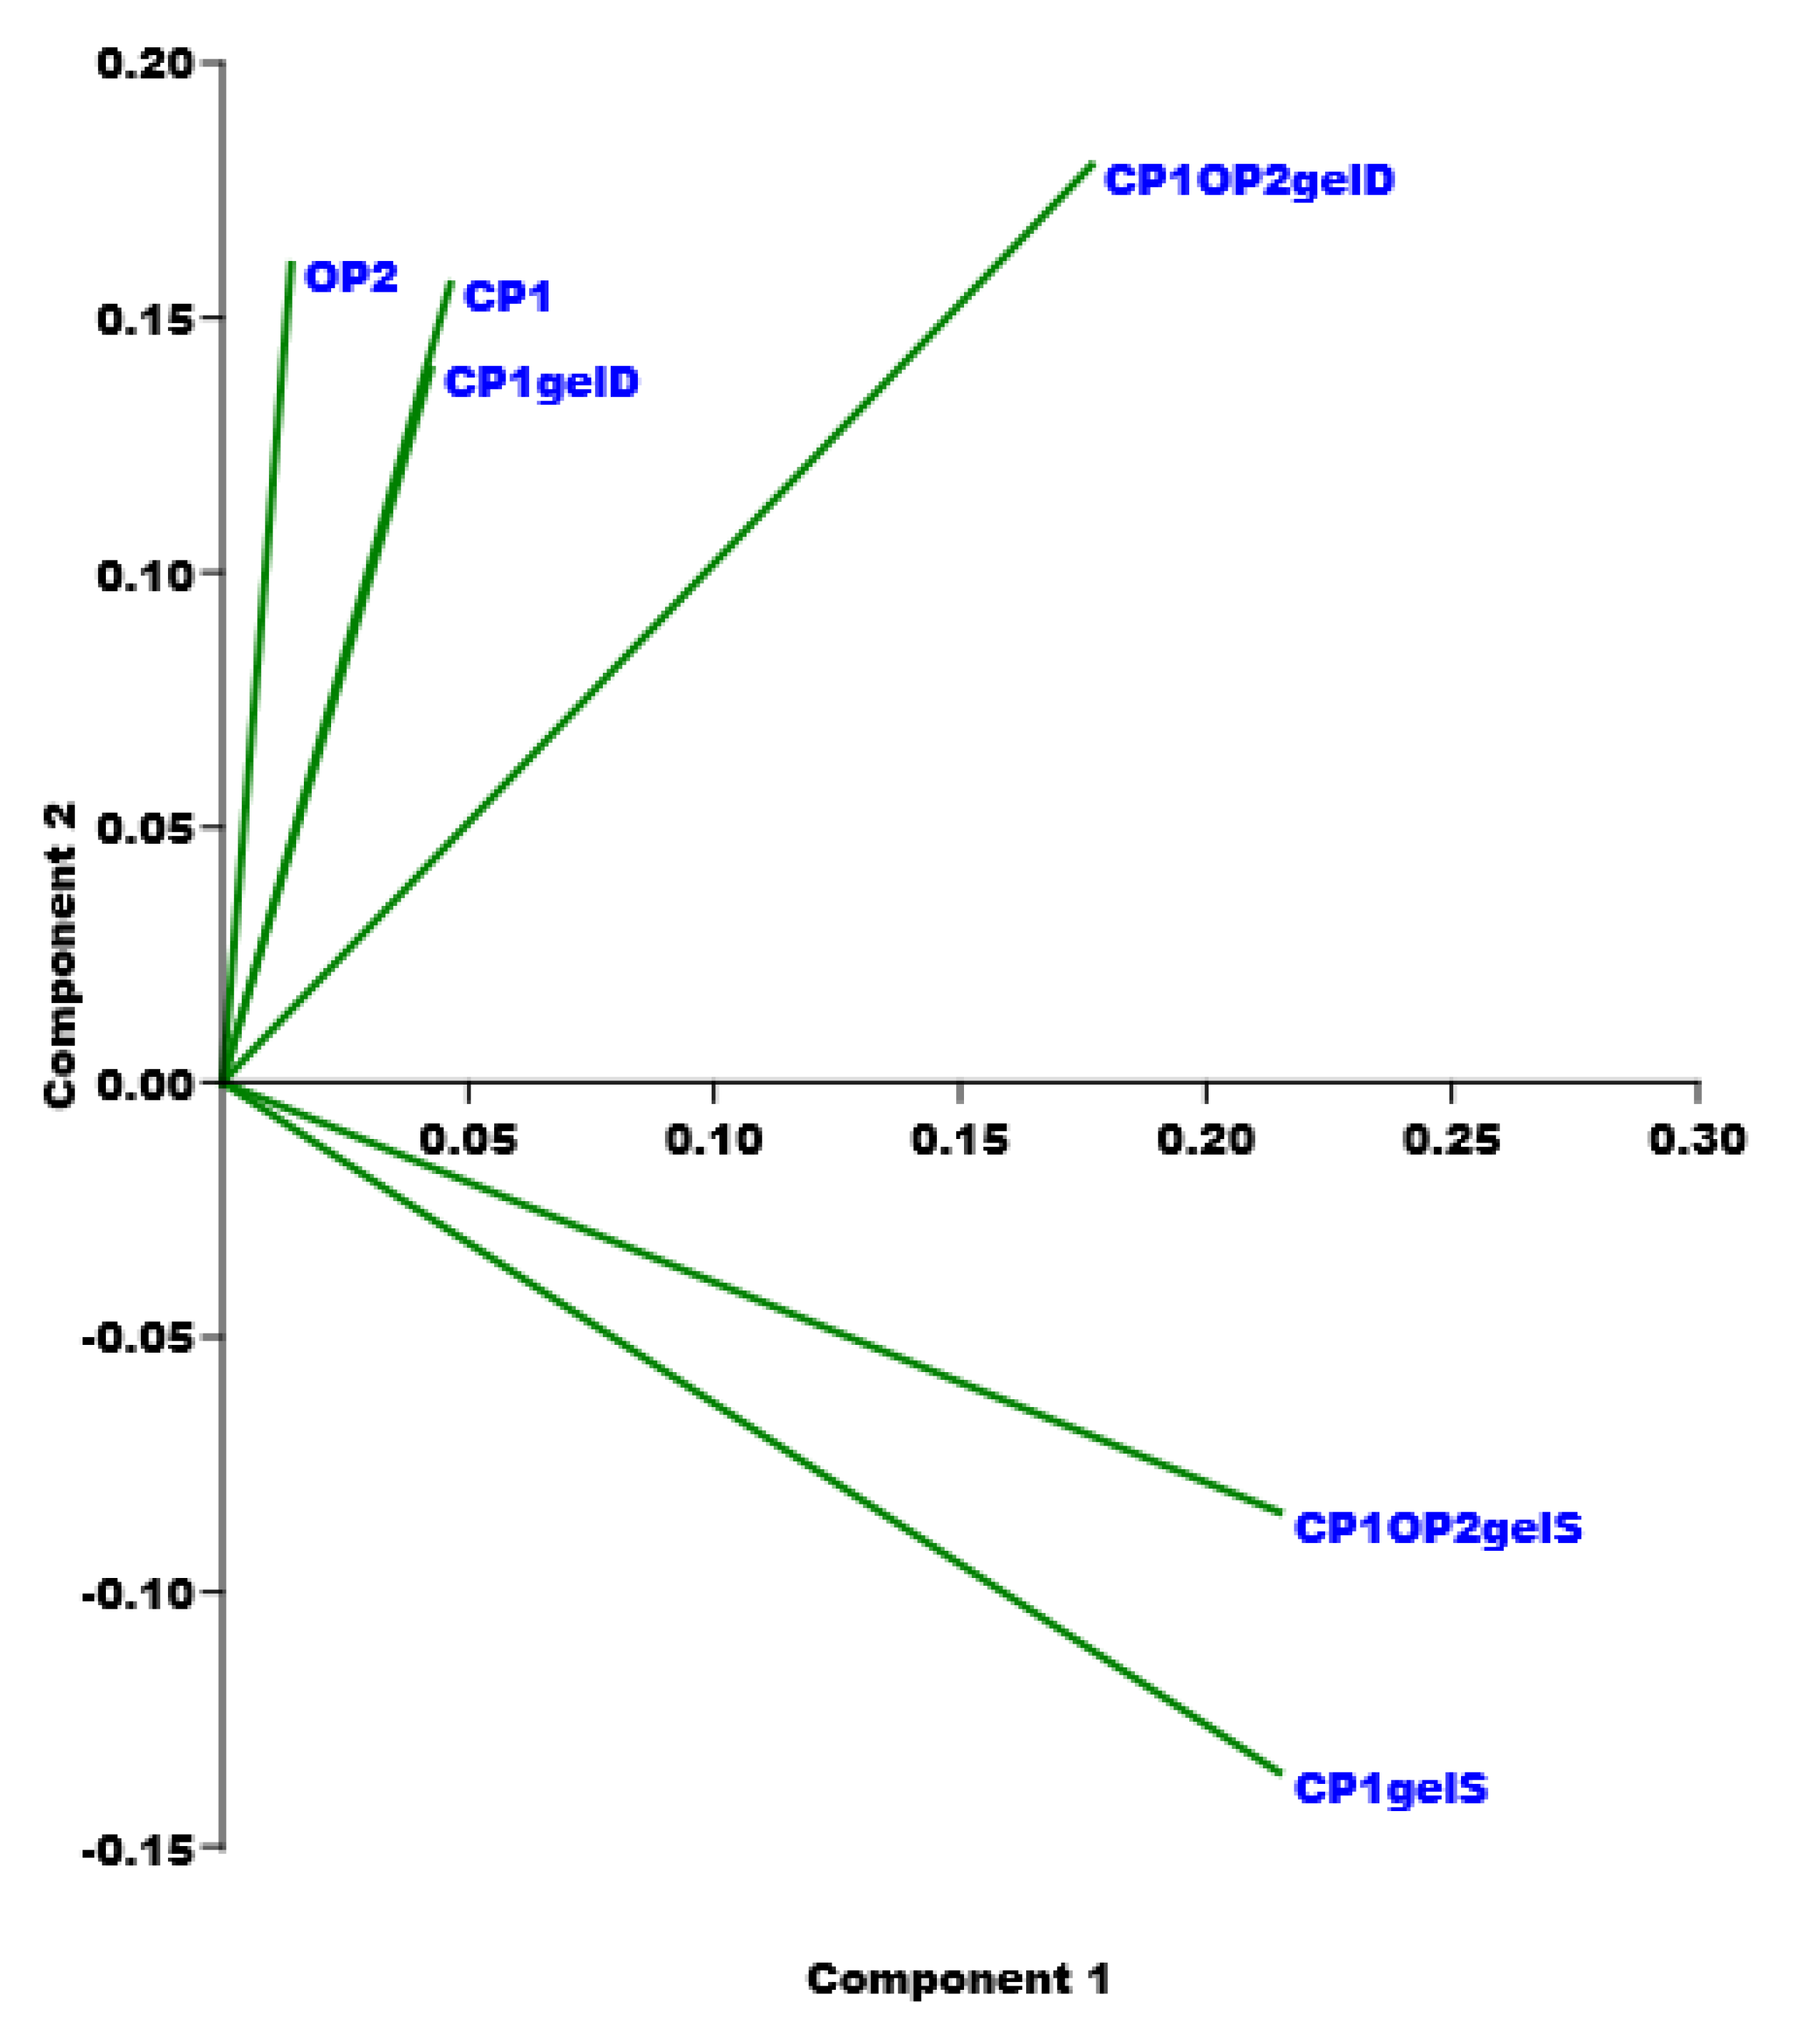
Principal Component Analysis (PCA) of ATR-FTIR Data
A matrix of over 20,000 variables was constructed collecting the spectral data (wavenumbers) of CP1, OP2, the swollen and dry CP1-based gel, as well as of the swollen and dry CP1OP2-based gel developed here. Then, the resulting dataset was first pretreated by autoscaling and then processed using the PCA, which is an intriguing chemometric tool capable of extracting the essential information from an intricate and enormous set of variables [
39,
40,
41,
42,
43]. In the present case, the PCA allowed us to visualize the reciprocal positions that the six samples occupied in the scores plots of PC1 vs. PC2 (
Figure 7), depending on the presence of similarities or differences in their chemical composition.
As observed, while on PC2 the two types of swollen gels were located at negative scores and close to each other, dried samples and original CP1 and OP2 were positioned at positive values. Both the dried samples (CP1gelD and CP1OP2gelD), as well as CP1 and OP2, were all distant from the swollen gels (CP1gelS and CP1OP2gelS), thus showing the very different composition of the latter with respect to the other four compounds, due to the presence of a high concentration of water (99% in the CP1-based gel and 91% in the CP1OP2-based gel). The minor distance of the CP1OP2gelS from the dried samples confirmed the higher concentration of CP1 and OP2 and the lower content of water with respect to those of CP1gelS. Moreover, the CP1 copolymer and CP1gelD were practically overlapped, thus showing an identical composition and that, upon heating, all water was removed and the original CP1 was reobtained. On the other hand, CP1OP2gelD was located at lower scores and closer to the swollen samples, indicating that, during heating to dryness, a certain percentage of water was maintained. Finally, the position of CP1OP2-based gels closer to CP1 than to OP2 indicated the higher concentration in weight of CP1 with respect to OP2.
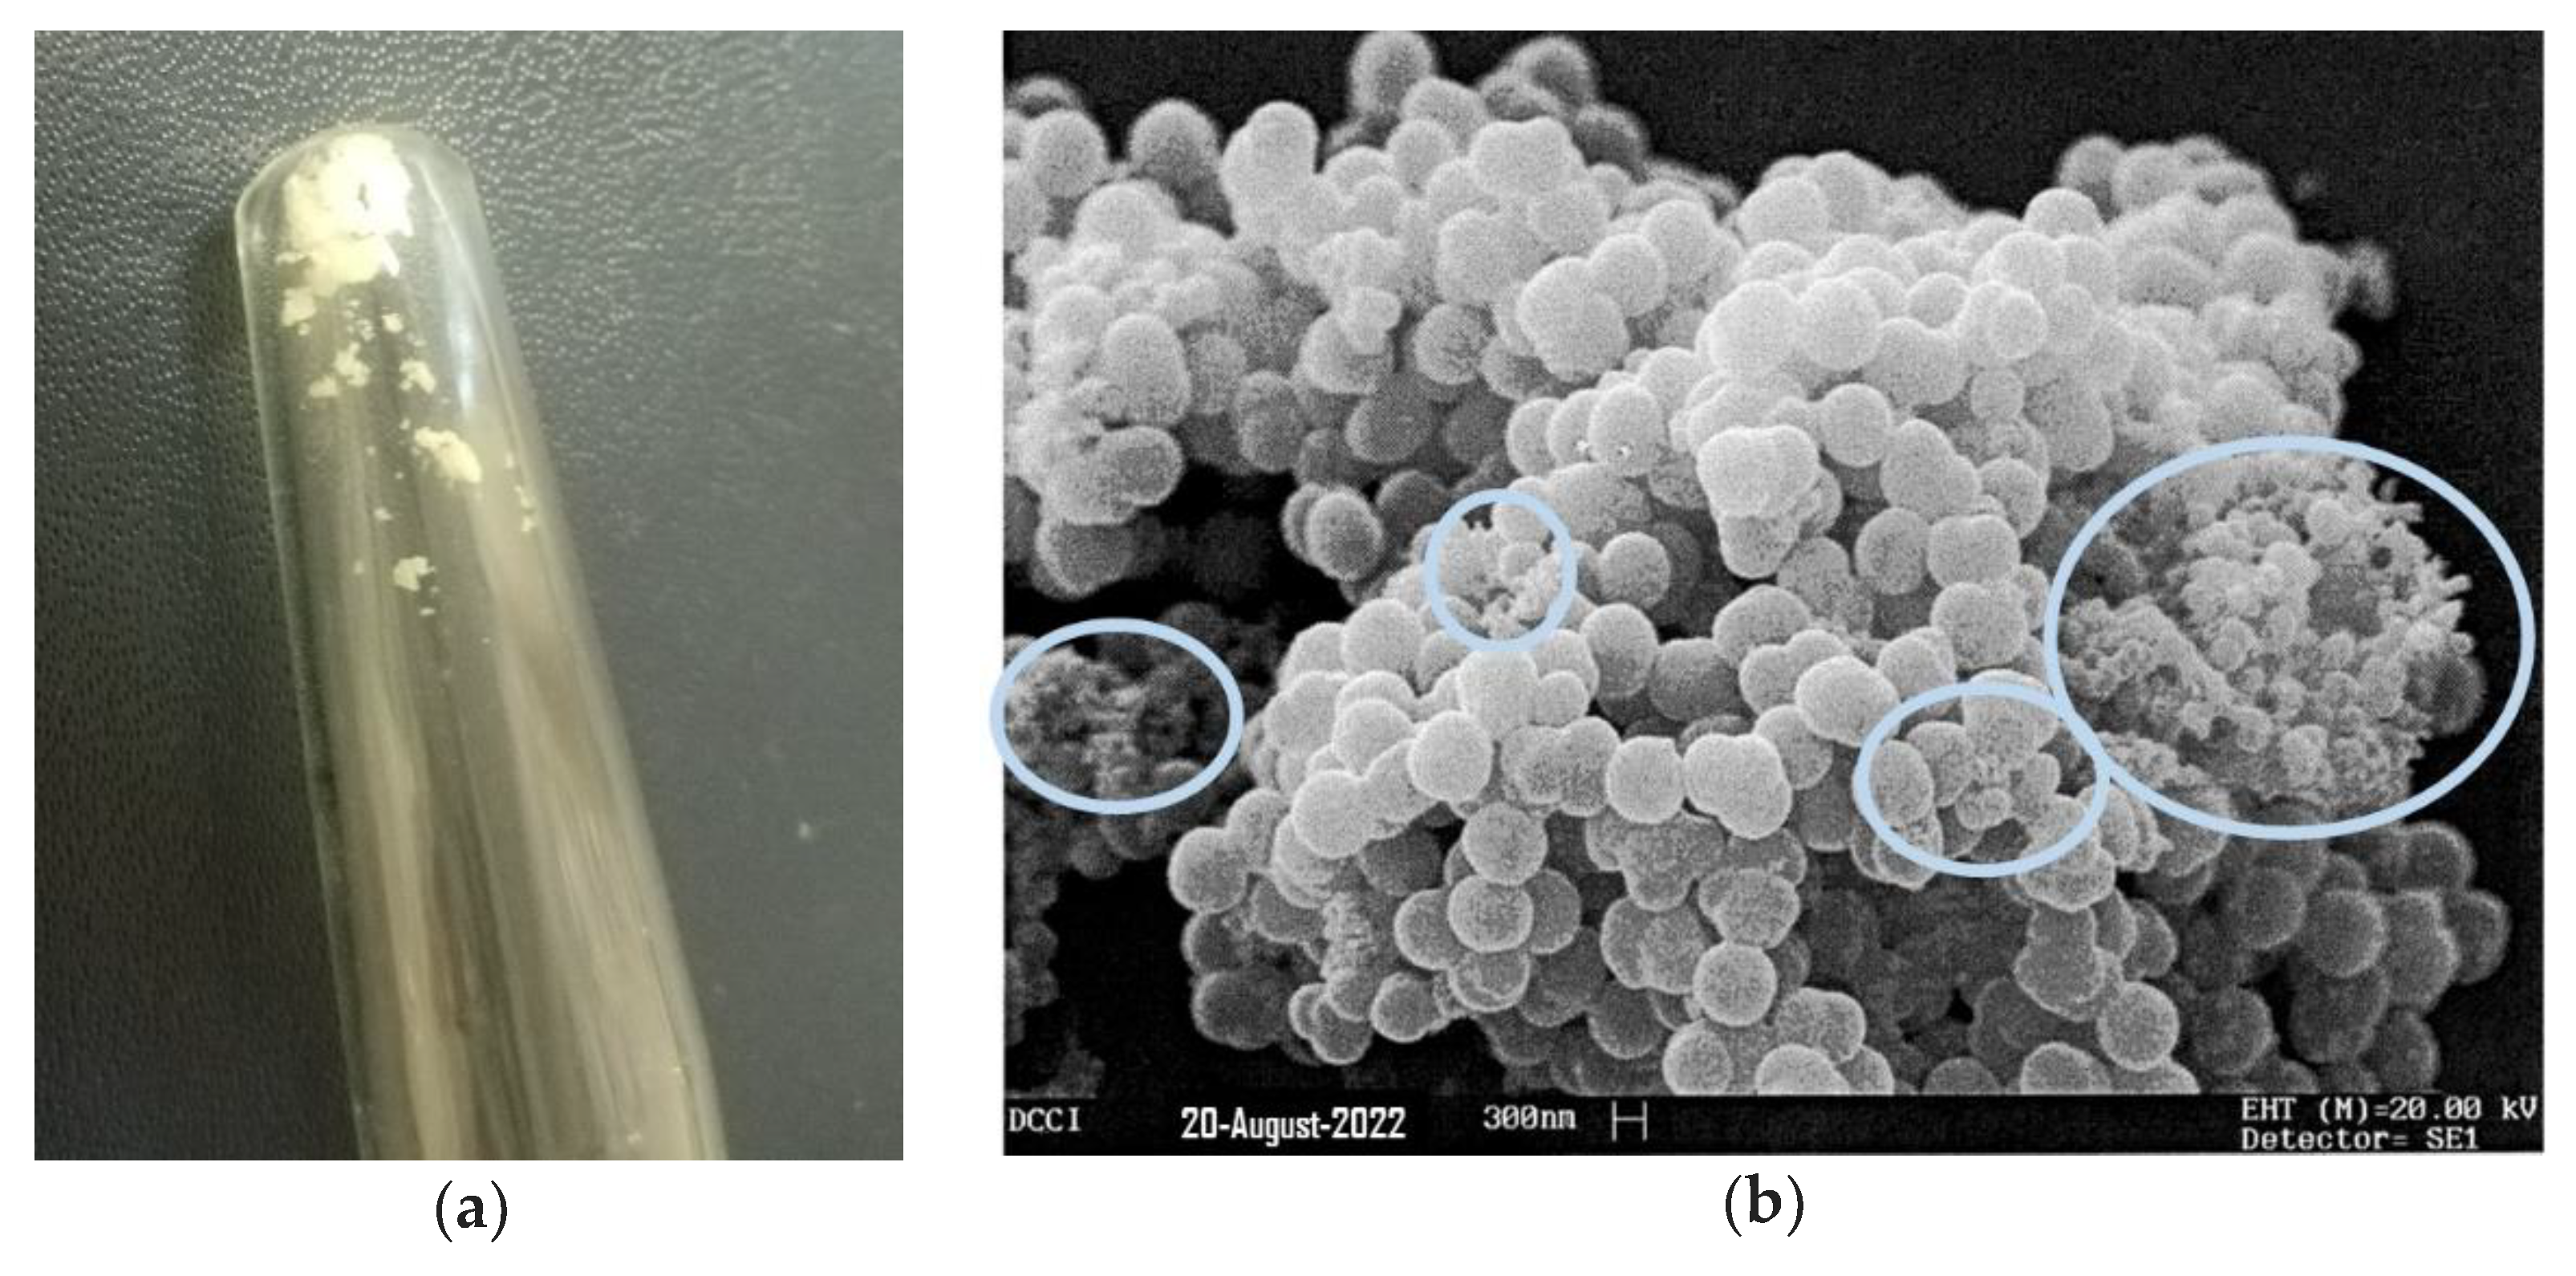
3.4. Scanning Electron Microscopy (SEM)
The microstructure of the lyophilized hydrogel was investigated by SEM analysis. The appearance of the lyophilized hydrogel is shown in
Figure 8a, while a representative SEM micrograph is shown in
Figure 8b. SEM images of the lyophilized cationic CP1OP2-Hgel revealed sticky-like particles with spheroidal morphology, high polydispersity, and very different sizes, as expected, since polymers that have particles with very different sizes were used to produce the gel. The most represented size was of about 1 micron, a slightly larger size than that previously determined for CP1 by dynamic light scattering analyses [
27], but very small particles with dimensions around 100 nm were observed in the rounded areas of the micrograph.
3.5. Weight Loss (Water Loss)
In the
Supplementary Materials,
Figure S6 shows the appearance of CP1OP2-Hgel at time t
0 of the experiments carried out to monitor water loss over time (
Figure S6a) and its appearance when fully dried (
Figure S6b).
Table S1 instead collects the data of the experiments, including the weights of the gel at times T
0-T
10 and the computed cumulative weight loss ratio percentages.
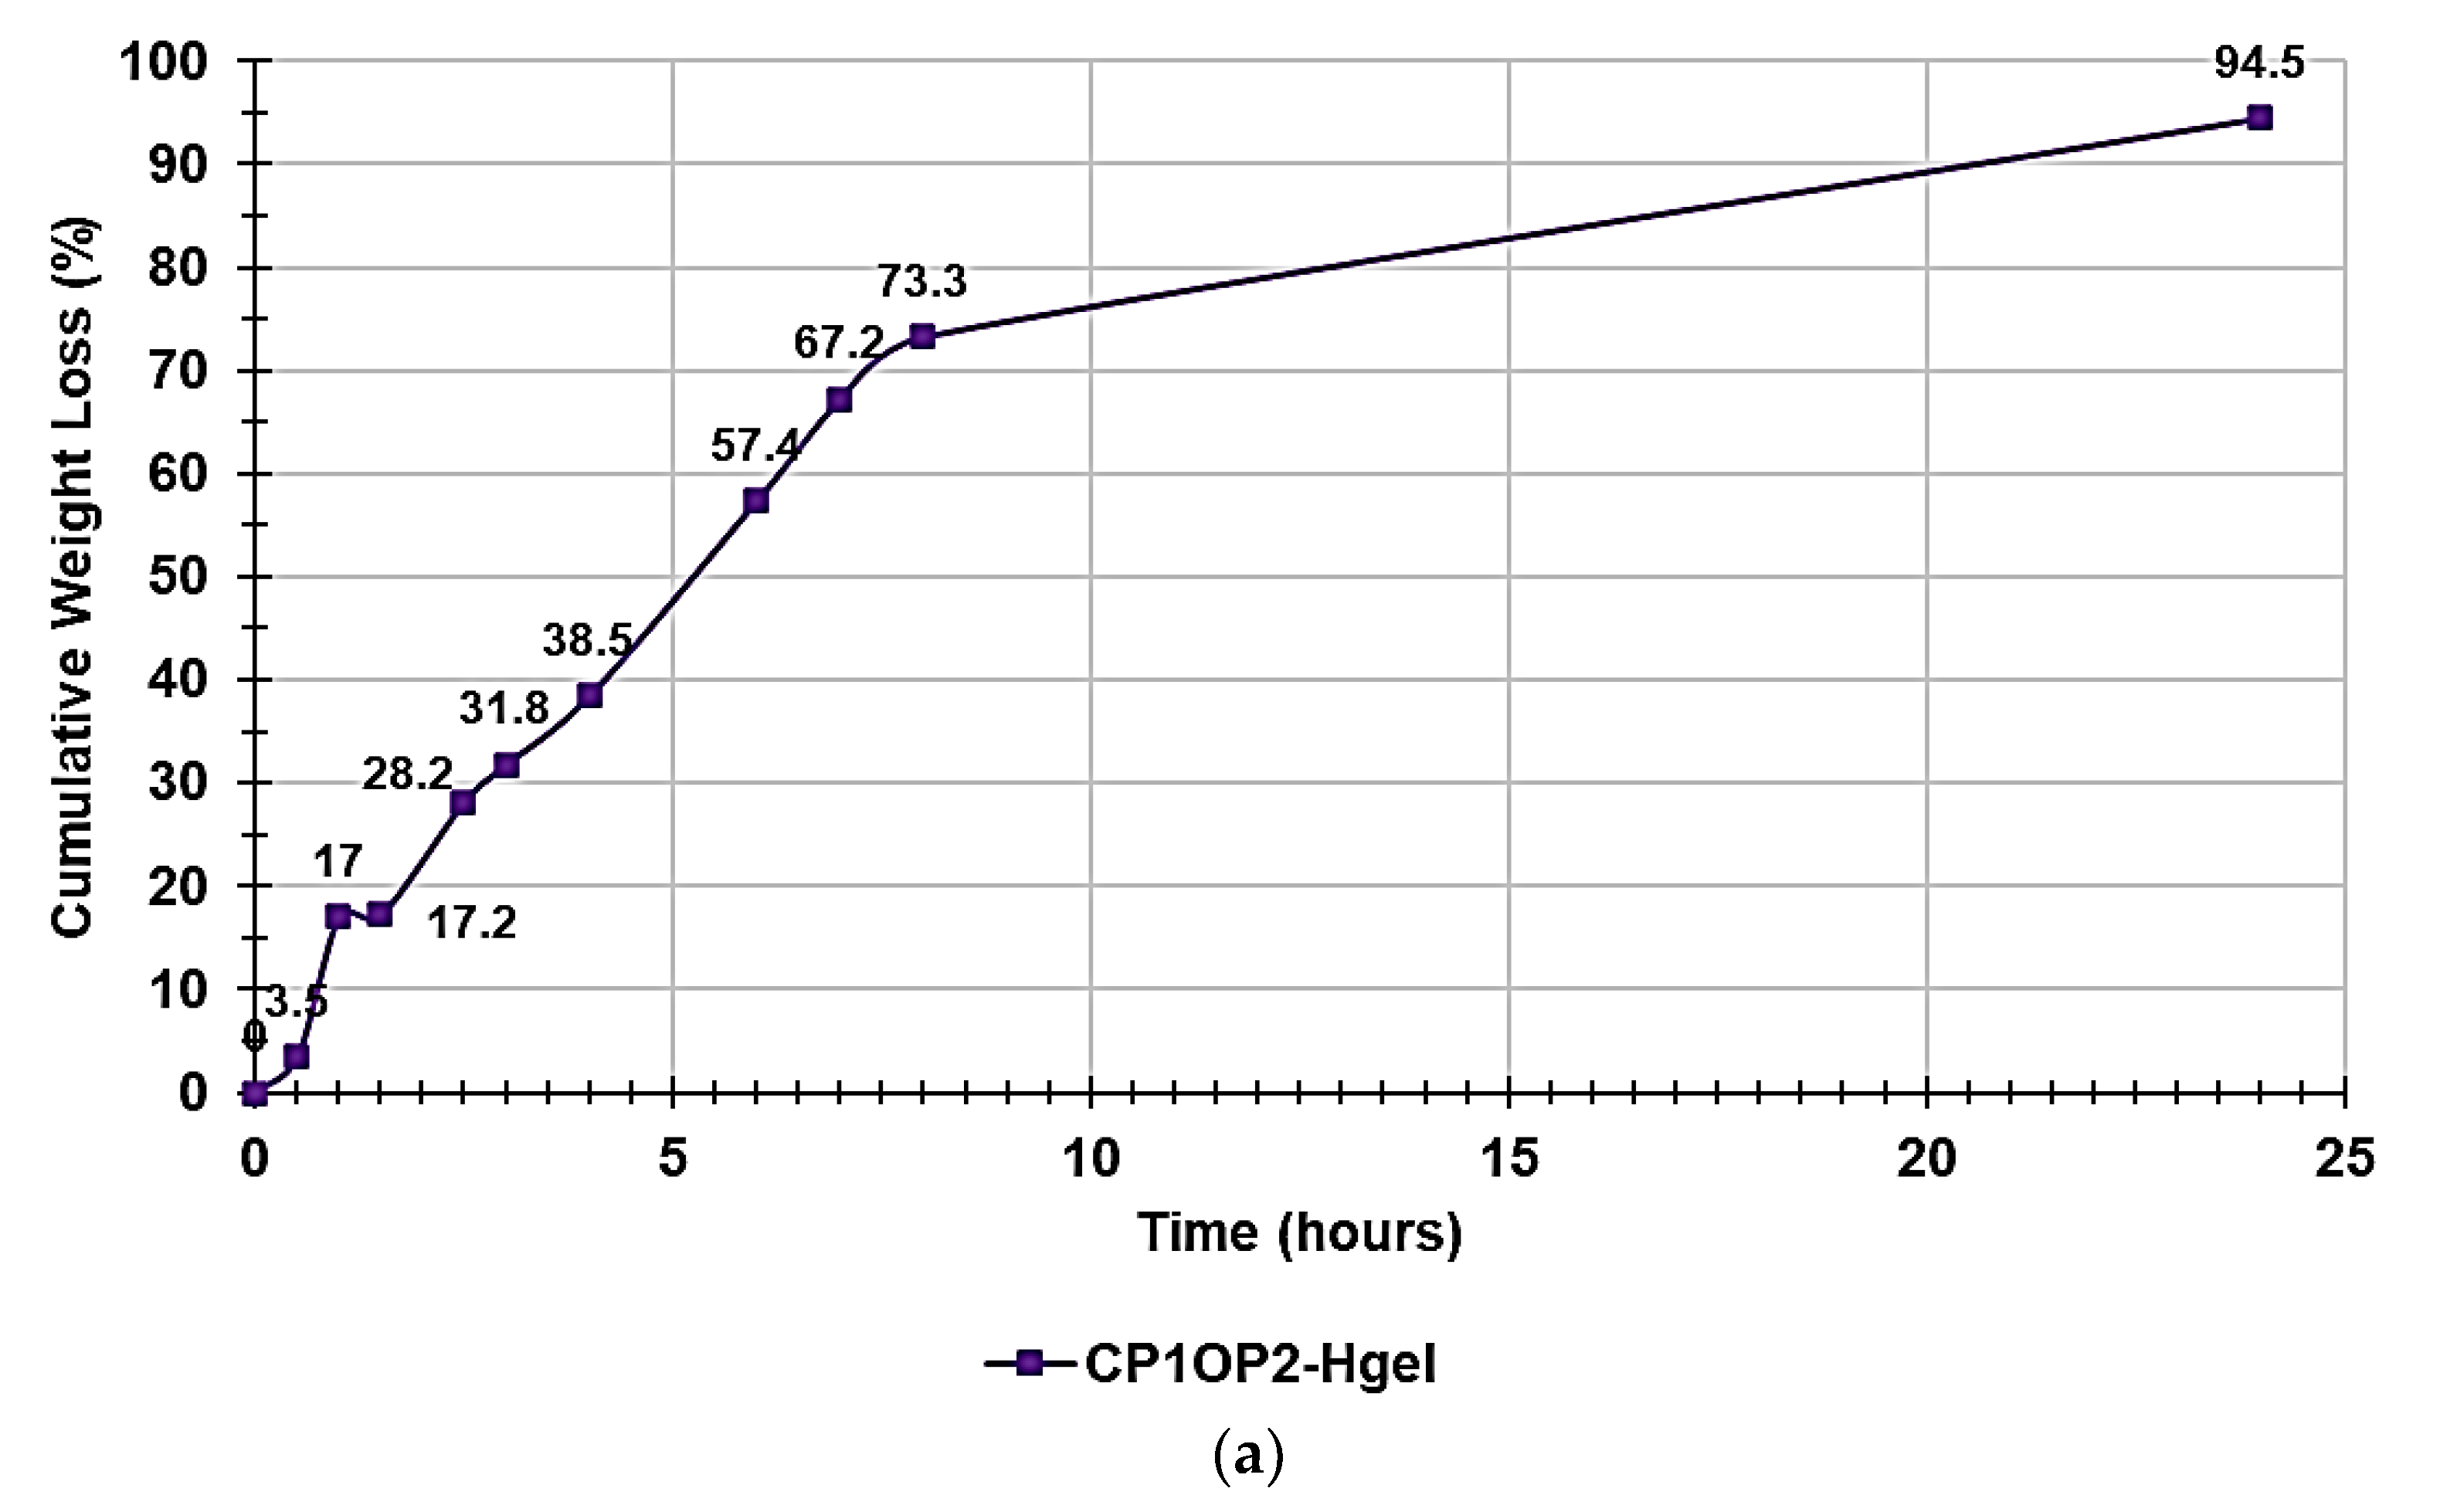
Figure 9a shows the curve obtained when graphing the cumulative weight loss percentages vs. times, while
Figure 9b shows the first order kinetic model that, among other mathematical kinetic models, best fit the data of the cumulative weight loss curve.
The water loss from the CP1OP2-Hgel was slightly inferior but much slower than that observed for the gel previously prepared with CP1 only (98.3% at 6 h vs. 94.5% at 24 h). Probably, due to the much higher concentration of the cationic macromolecules in the gel, more hydrogen bonds between the water and heteroatoms present in the copolymer structure were possible, thus causing a higher retention of water. To exactly know the main mechanisms that govern the loss of water from the CP1OP2-Hgel, the data of the curve in
Figure 9a were fit with several mathematical kinetic models as reported in other published studies [
44,
45,
46,
47], obtaining the related dispersion graphs. The mathematical model which provided the graph, whose linear tendency line (supplied by Microsoft Excel software using the least-squares method) had the highest value of the coefficient of determination (R
2) was selected as that which best fit the water release data. The mathematical models were tested, and the obtained R
2 values are reported in
Table 4. Accordingly, it was established that the water loss for the CP1OP2-Hgel best fit the first-order kinetic model (
Figure 9b), thus establishing a further difference with respect to the CP1-based gel, which fit the Korsmeyer–Peppas kinetic model, as shown in
Figure S7b and Table S2 in the Supplementary Materials.
As reported in the literature, first-order release kinetics state that the change in concentration with respect to the change over time is dependent only on the residual concentration of the compound released. In the present case, the release of water and weight loss over time depended only on the residual concentration of water after the heating periods [
46]. The first-order kinetics are described by Equation (6).
where
Qt is the amount of water released on time
t,
Qo is the initial amount (%) of water in the gel, and
K is the first-order constant. Accordingly, in our case,
K/2.303 corresponded to the slope of the equation of the linear regression of our first-order mathematical model shown in
Figure 9b, while
LogQ0 was its intercept. Consequently, the first-order constant was negative and equal to −0.1237 and the original percentage content of water in the weighted CP1OP2-Hgel was 94%.
3.6. Cumulative Swelling Ratio Percentages
As described in
Section 2.8, swelling measurements were made at times T
0–T
4 (0–60 min), until the weight of the swollen gels was approximately constant.
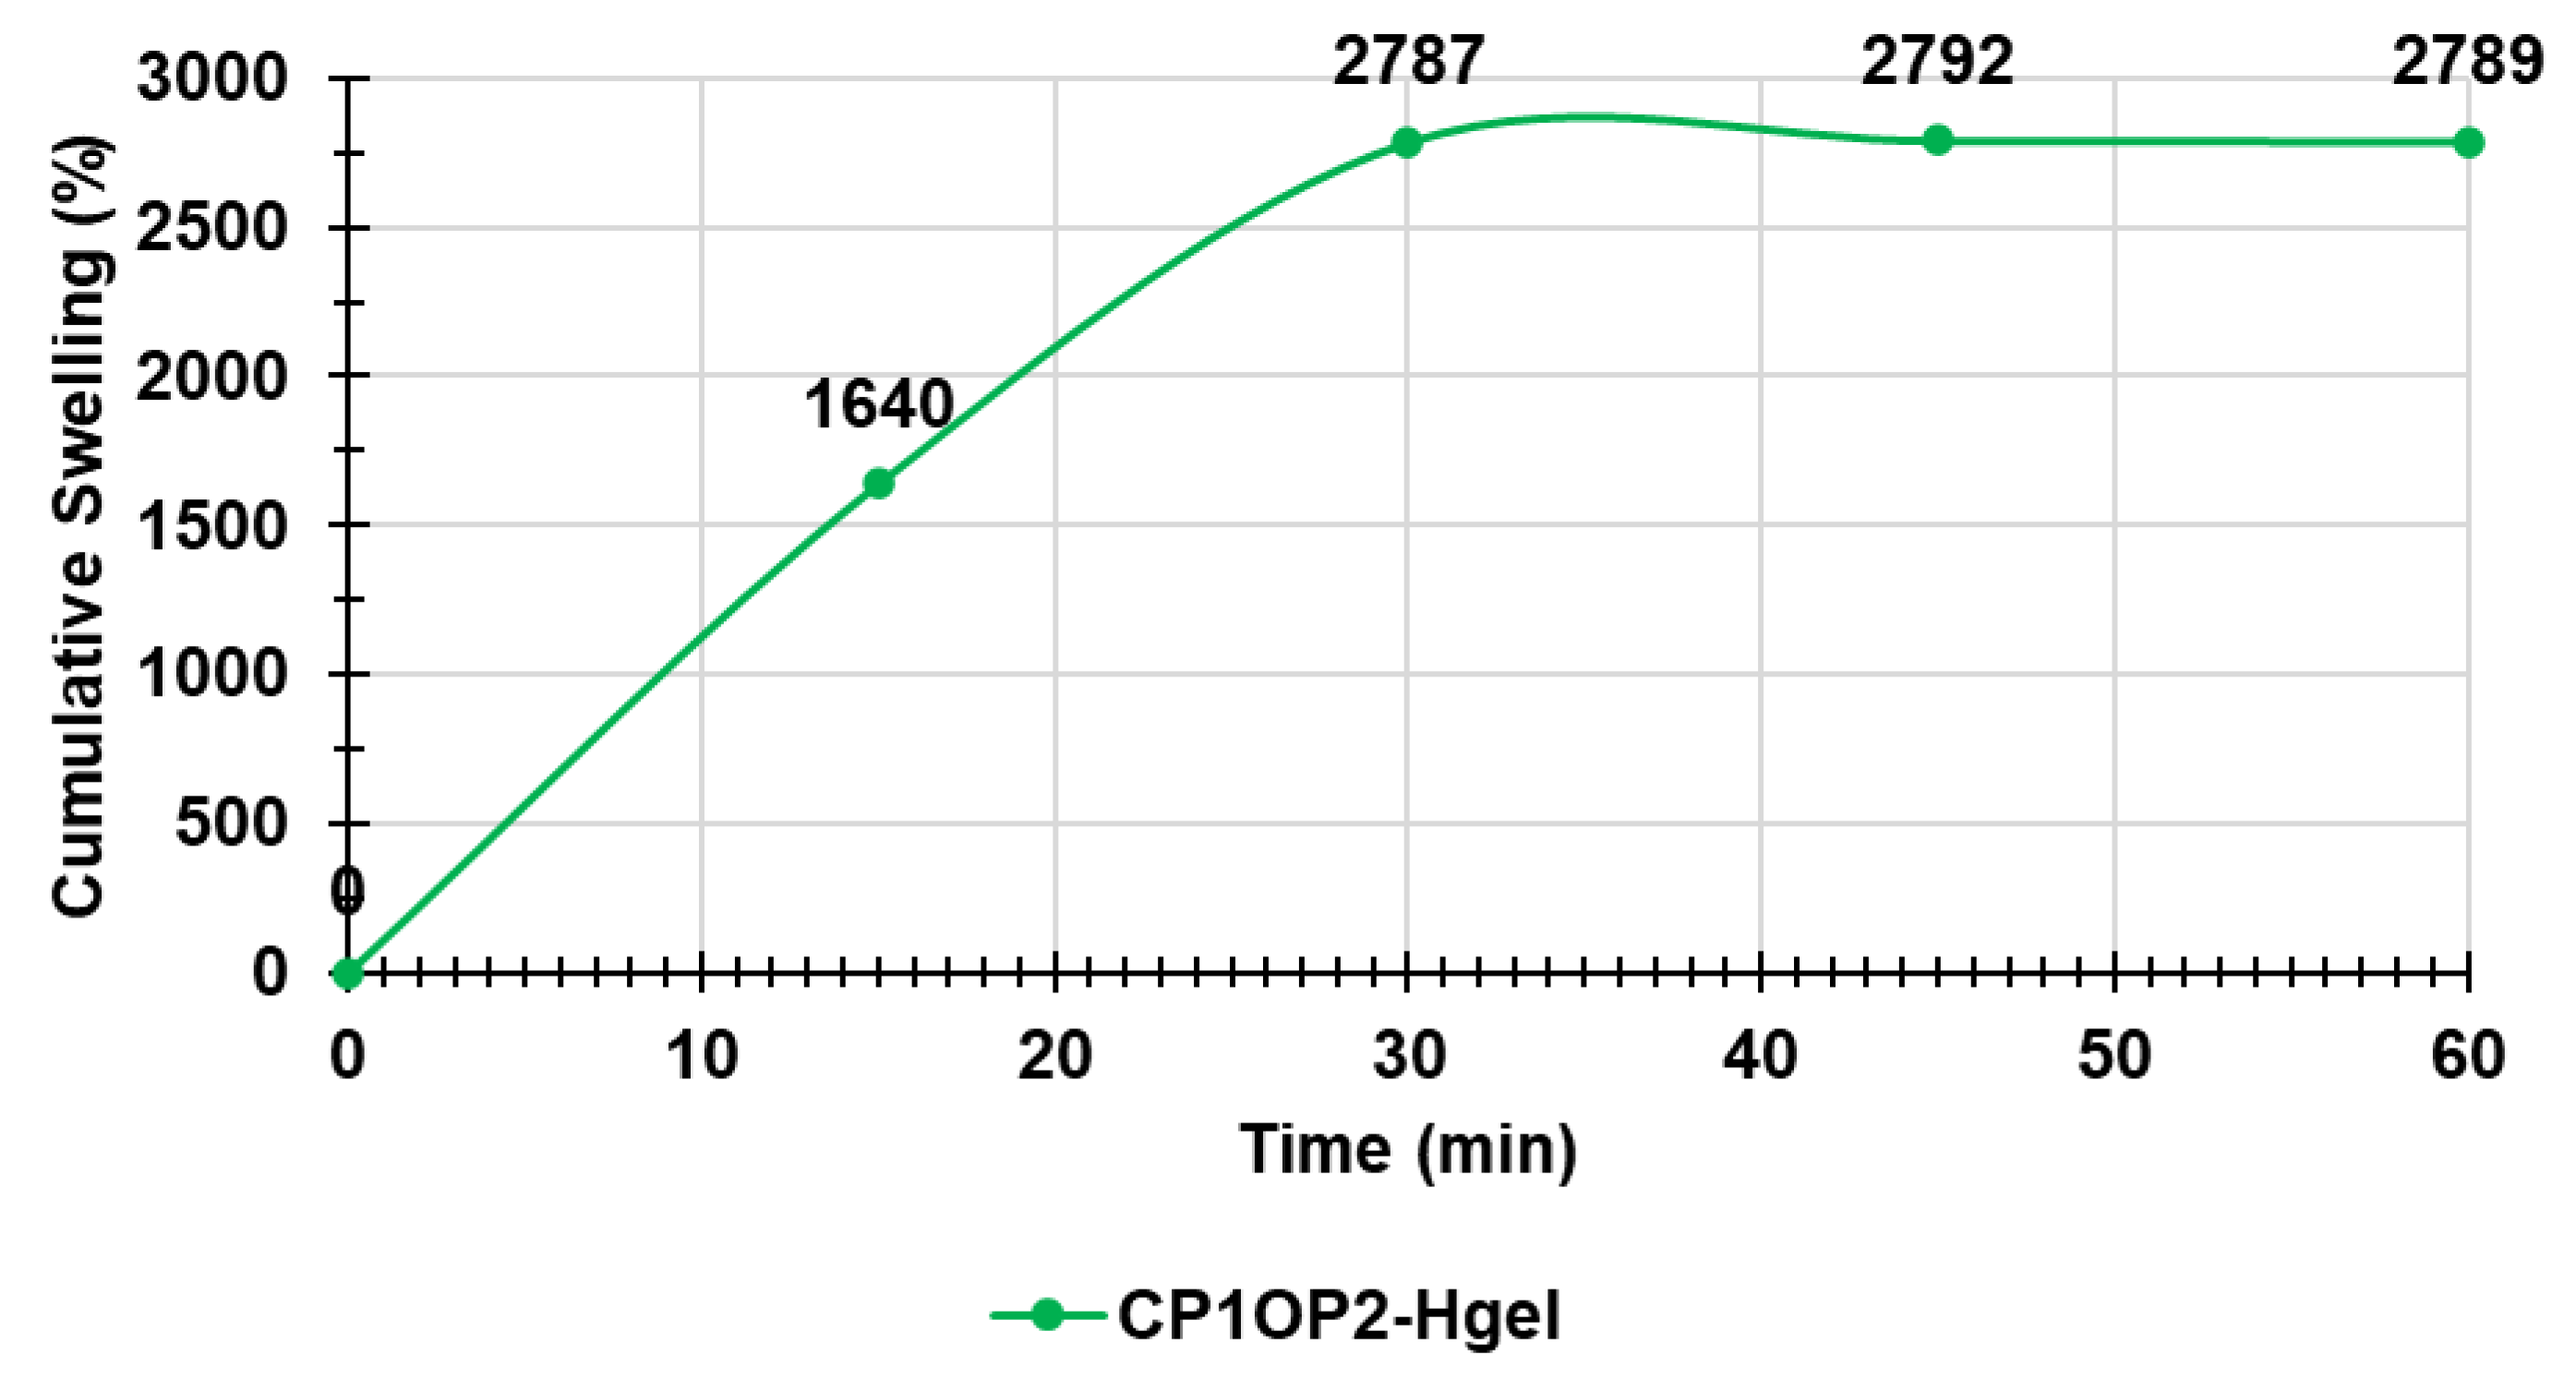
Figure 10 shows the cumulative swelling ratio percentages as a function of time.
The equilibrium swelling ratio (Qequil), which was determined at the point where the hydrated gels reached a constant weight, was 2789.3 ± 2.05% (value obtained making the mean of values obtained at times T2–T4) and was reached immediately after 30 min of hydration. Curiously, the maximum swelling capability (%) of the dried mixture of CP1 and OP2 obtained by heating the prepared gel (24 h, 37 °C) and corresponding to the maximum quantity of water that the dried gel was capable to absorb, was 2.7-fold higher than that absorbed for the original mixture of CP1 and OP2 used to prepare the gel (2789% vs. 1033%).
3.7. Potentiometric Titration of CP1OP2-Hgel
Potentiometric titrations of the gel were performed to ensure that the protonation profile of the two ingredients previously observed (which confirmed that at skin pH they will be mainly protonated and in the cationic form) was maintained [
27]. It should be remembered that a cationic character is essential for antibacterial effects because it allows electrostatic interactions with the surface of bacteria with consequent irreversible damage of membranes up to their disruption, translating in bacteria death [
48,
49]. Additionally, the potentiometric titrations of CP1OP2-Hgel included the titration of the NH
2 groups of the gel, thus allowing us to determine its NH
2 content. Potentiometric titrations of CP1OP2-Hgel were carried out as previously described [
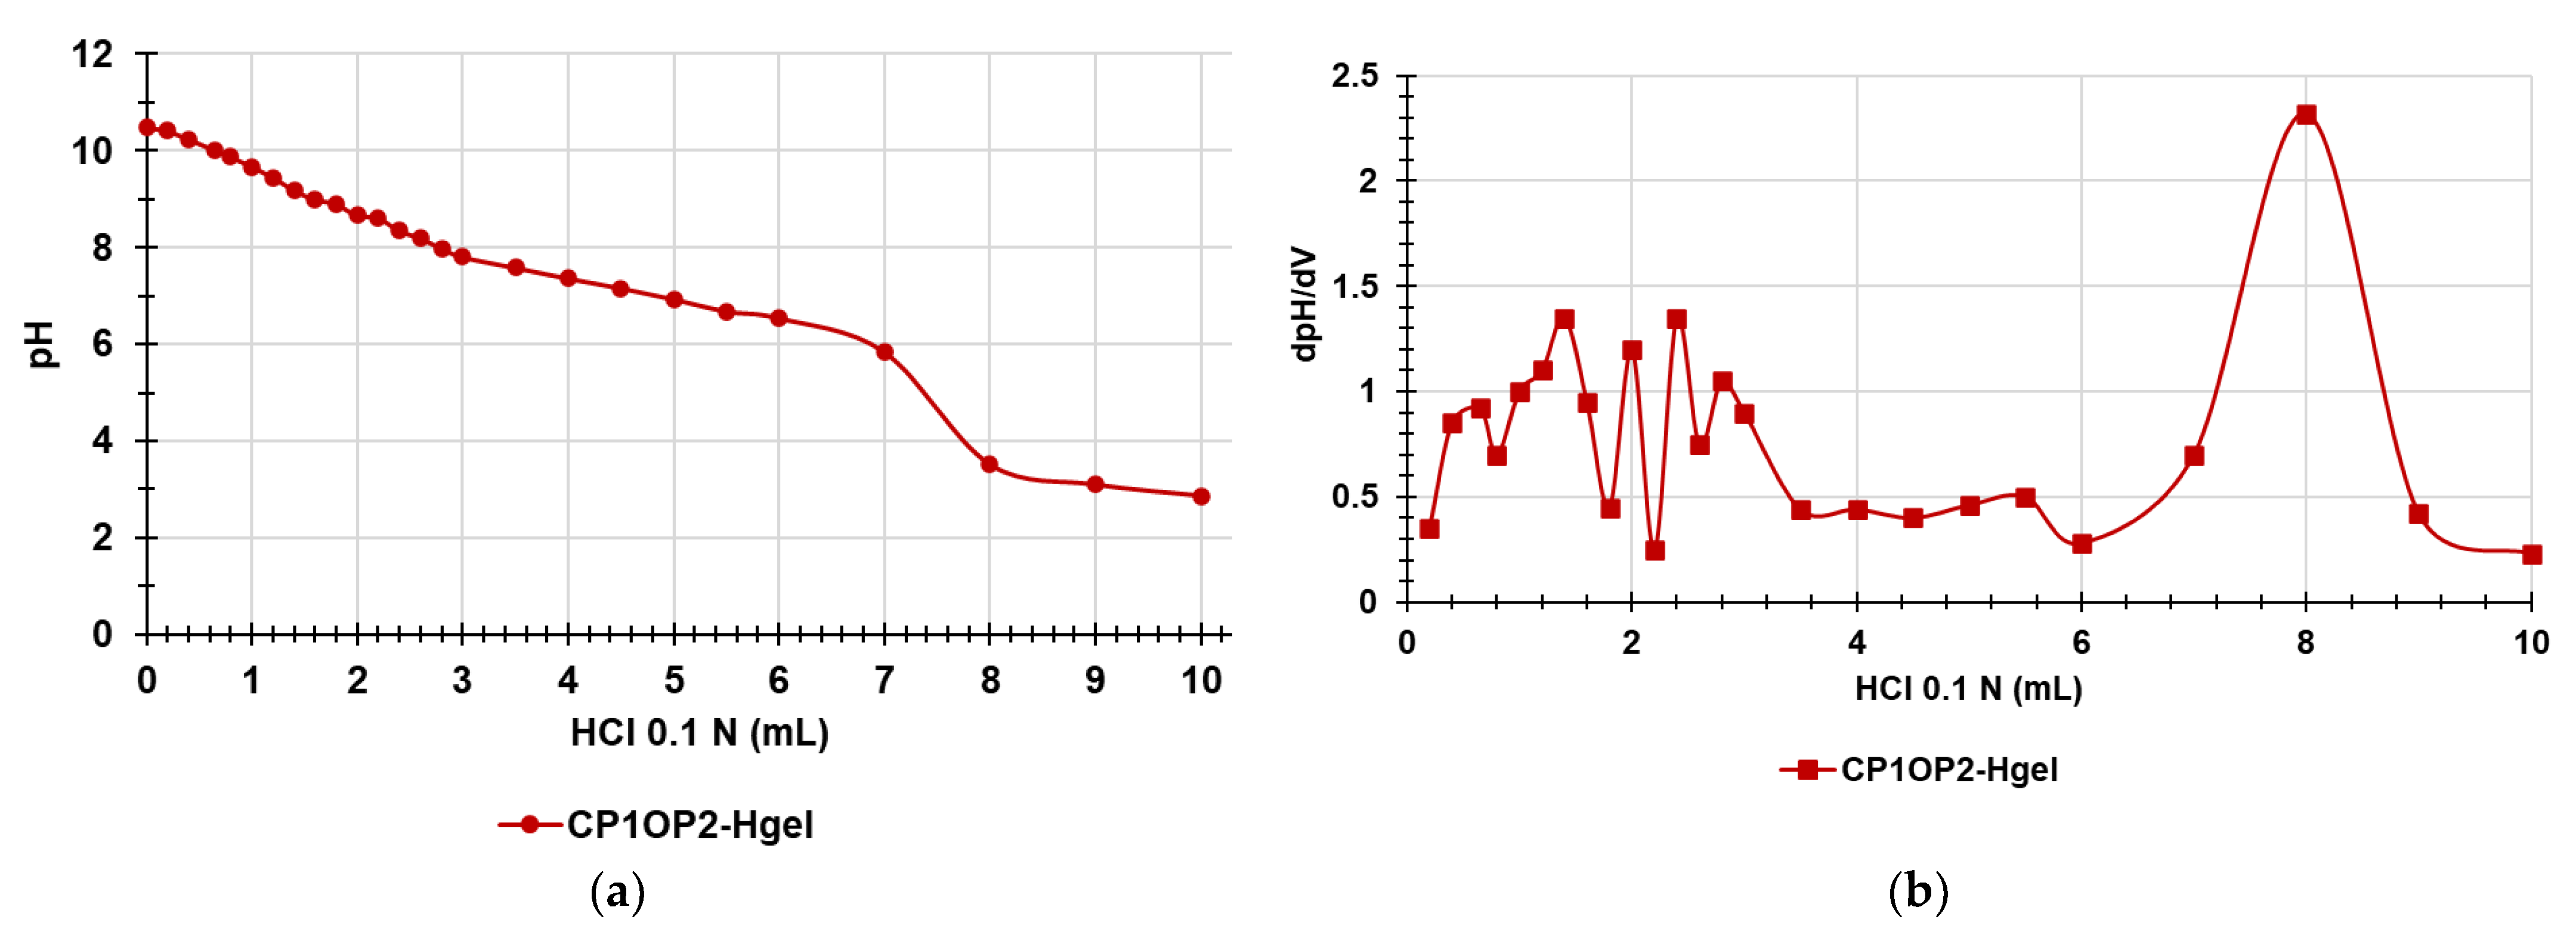
50]. The titration curves were obtained by graphing the measured pH values vs. the aliquots of HCl 0.1 N added (
Figure 11a). Subsequently, from the titration data, the first derivative curve was obtaining by computing the dpH/dV values and graphing them vs. those of the corresponding volumes of HCl 0.1N (
Figure 11b).
Similar to what was observed previously for copolymer CP1 [
27], the titration curve of the gel composed at 6.9% wt/wt of CP1 and 1.9% wt/wt of OP2, except for some slight differences around 2 mL of HCl added, showed a very high buffer capacity up to the addition of 6–7 mL HCl 0.1 N, while the so-called jump-in pH (titration point) was visible when 8 mL of 0.1 N HCl were added (
Figure 11a).
Figure 11b evidences that a partial protonation started at pH values of 7–9, but complete protonation was reached at pH values of 3.52 due to the addition of 8 mL HCl 0.1 N. These results establish that the CP1OP2-Hgel at the pH of skin should be sufficiently protonated to electrostatically interact with the negatively charged surface of bacteria and boost the antibacterial effects.
Table 5 collects the results concerning the content of NH
2 groups in the gel.
3.8. Rheological Studies
Rheological studies are a fundamental step in the preparation of a gel formulation for skin application. Therefore, by performing rheological studies on the prepared hydrogel, the values of dynamic viscosity (η [Pa*s]) as a function of the applied shear rate (γ. [s
−1]) were obtained. By graphing η vs. γ, we achieved the curve in
Figure 12.
In
Figure 12, it was observed that η decreases dramatically for a small increases in γ up to values of γ < 20, while for values of γ > 20, η was practically constant, and did not change significantly, even for great increases in γ. Collectively, the CP1OP2-Hgel is a non-Newtonian fluid. It means that the CP1OP2-Hgel does not follow the Newton’s law of viscosity given by Equation (7), where viscosity (η) is constant and independent of the shear stress (τ), and whose graphical representation is line with the constant slope (η) intercept zero [
51].
Non-Newtonian fluids may be Bingham plastic fluids, whose viscosity is constant, graph is linear, but intercept is >0, Bingham pseudoplastic fluids, which are modellable using the Herschel–Bulkley viscosity model and have a shear thinning behavior, or dilatant fluids, which have a shear thickening behavior [
52].
To find what type of fluid the CP1OP2-Hgel was and what its behavior was when subjected to an increasing shear rate, the Cross rheological model, which is expressed by Equation (8), was fit to the data of viscosity vs. shear rate. R
2, as well as the flow index (n) and the consistency index (α), were also determined (
Figure 13,
Table 6).
where γ is the shear rate, μ
o is the viscosity when the shear rate is close to zero, n is the flow behavior index, which indicates the tendency of a fluid to shear thin or thick, and α is the consistency index, which serves as the viscosity indexes of the systems. According to the literature [
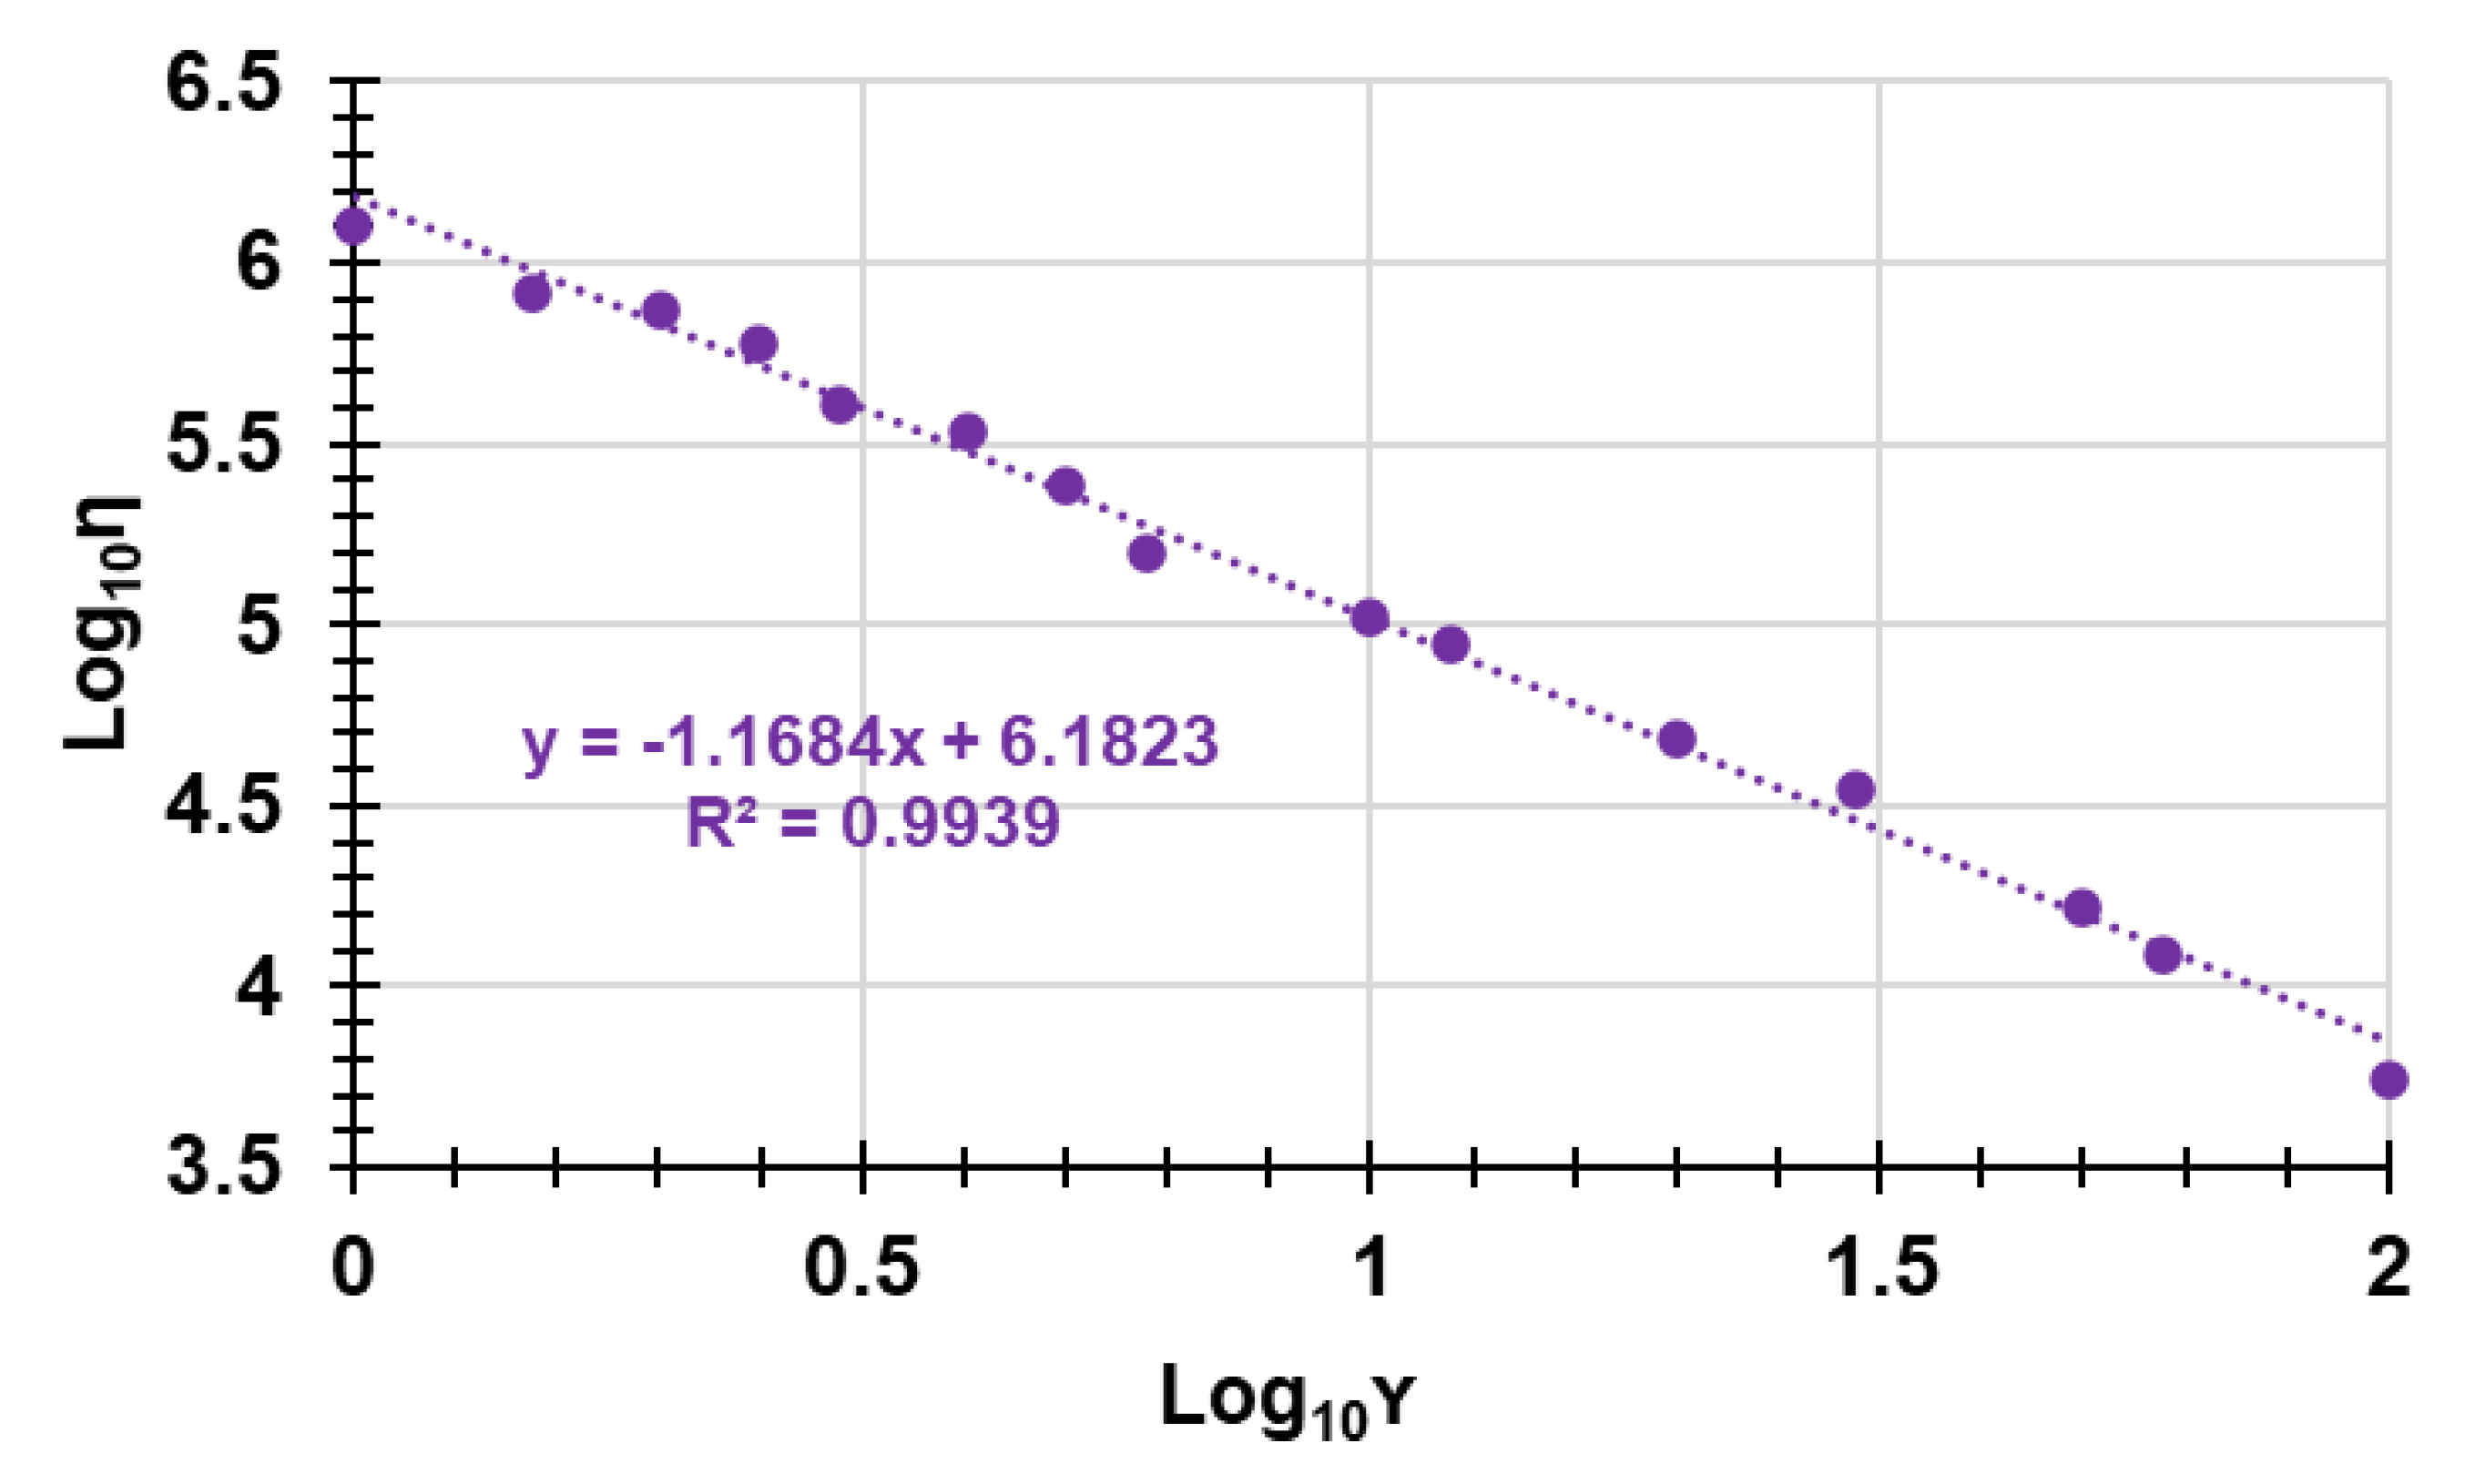
52], the Cross model is obtained by graphically reporting the Log η vs. Log γ [
52] (
Figure 13).
In the equation of the linear tendency line of the Cross model, the intercept was Log (ηo/α), while the n value was the slope.
The equation of the linear regression obtained for the Cross mathematical model, the related correlation coefficient (R
2), and the value of the slope and intercept are reported in
Table 6, together with the computed value of α.
In particular, when n < 1 (absolute value), the fluid is shear-thinning (pseudoplastic fluid), when n = 1, the fluid is Newtonian, and when n > 1, the fluid is shear-thickening (dilating hydrogels). According to
Figure 13, the linear regression of the Cross model, which fit the rheological data well, since the R
2 value was very high (R
2 > 0.99) provided n > 1, thus asserting the CP1OP2-Hgel is a shear-thickening, dilating hydrogel. In fact, typically, pseudoplastic fluids are relatively mobile fluids, such as weak gels and low-viscosity dispersions, while the CP1OP2-Hgel is highly viscous.
PCA on Rheological Data
Since it was the first time that we obtained a dilating gel, we decided to compare the rheological data of the CP1OP2-Hgel with those of some Bingham pseudoplastic gels with shear thinning behavior, previously reported in [
53,
54], by processing them using PCA. To this end, we collected data from rheological experiments carried out on the CP1OP2-Hgel and on the recently prepared Bingham pseudoplastic CP1-based hydrogel, made of CP1 and water, in a matrix. Then, the viscosity data of other five previously reported Bingham pseudoplastic blank hydrogels, namely PEC-D and PEC-K (the former made of pectin and Dermasoft and the latter of pectin and potassium polysorbate), CMC (made of carboxymethyl cellulose), HEC (made of hydroxy ethyl cellulose), and MC (made of methyl cellulose), were included, achieving a matrix (7 × 15) of 105 variables. The obtained matrix was then processed by PCA using PAST statistical software (paleontological statistics software package for education and data analysis, freely downloadable online at:
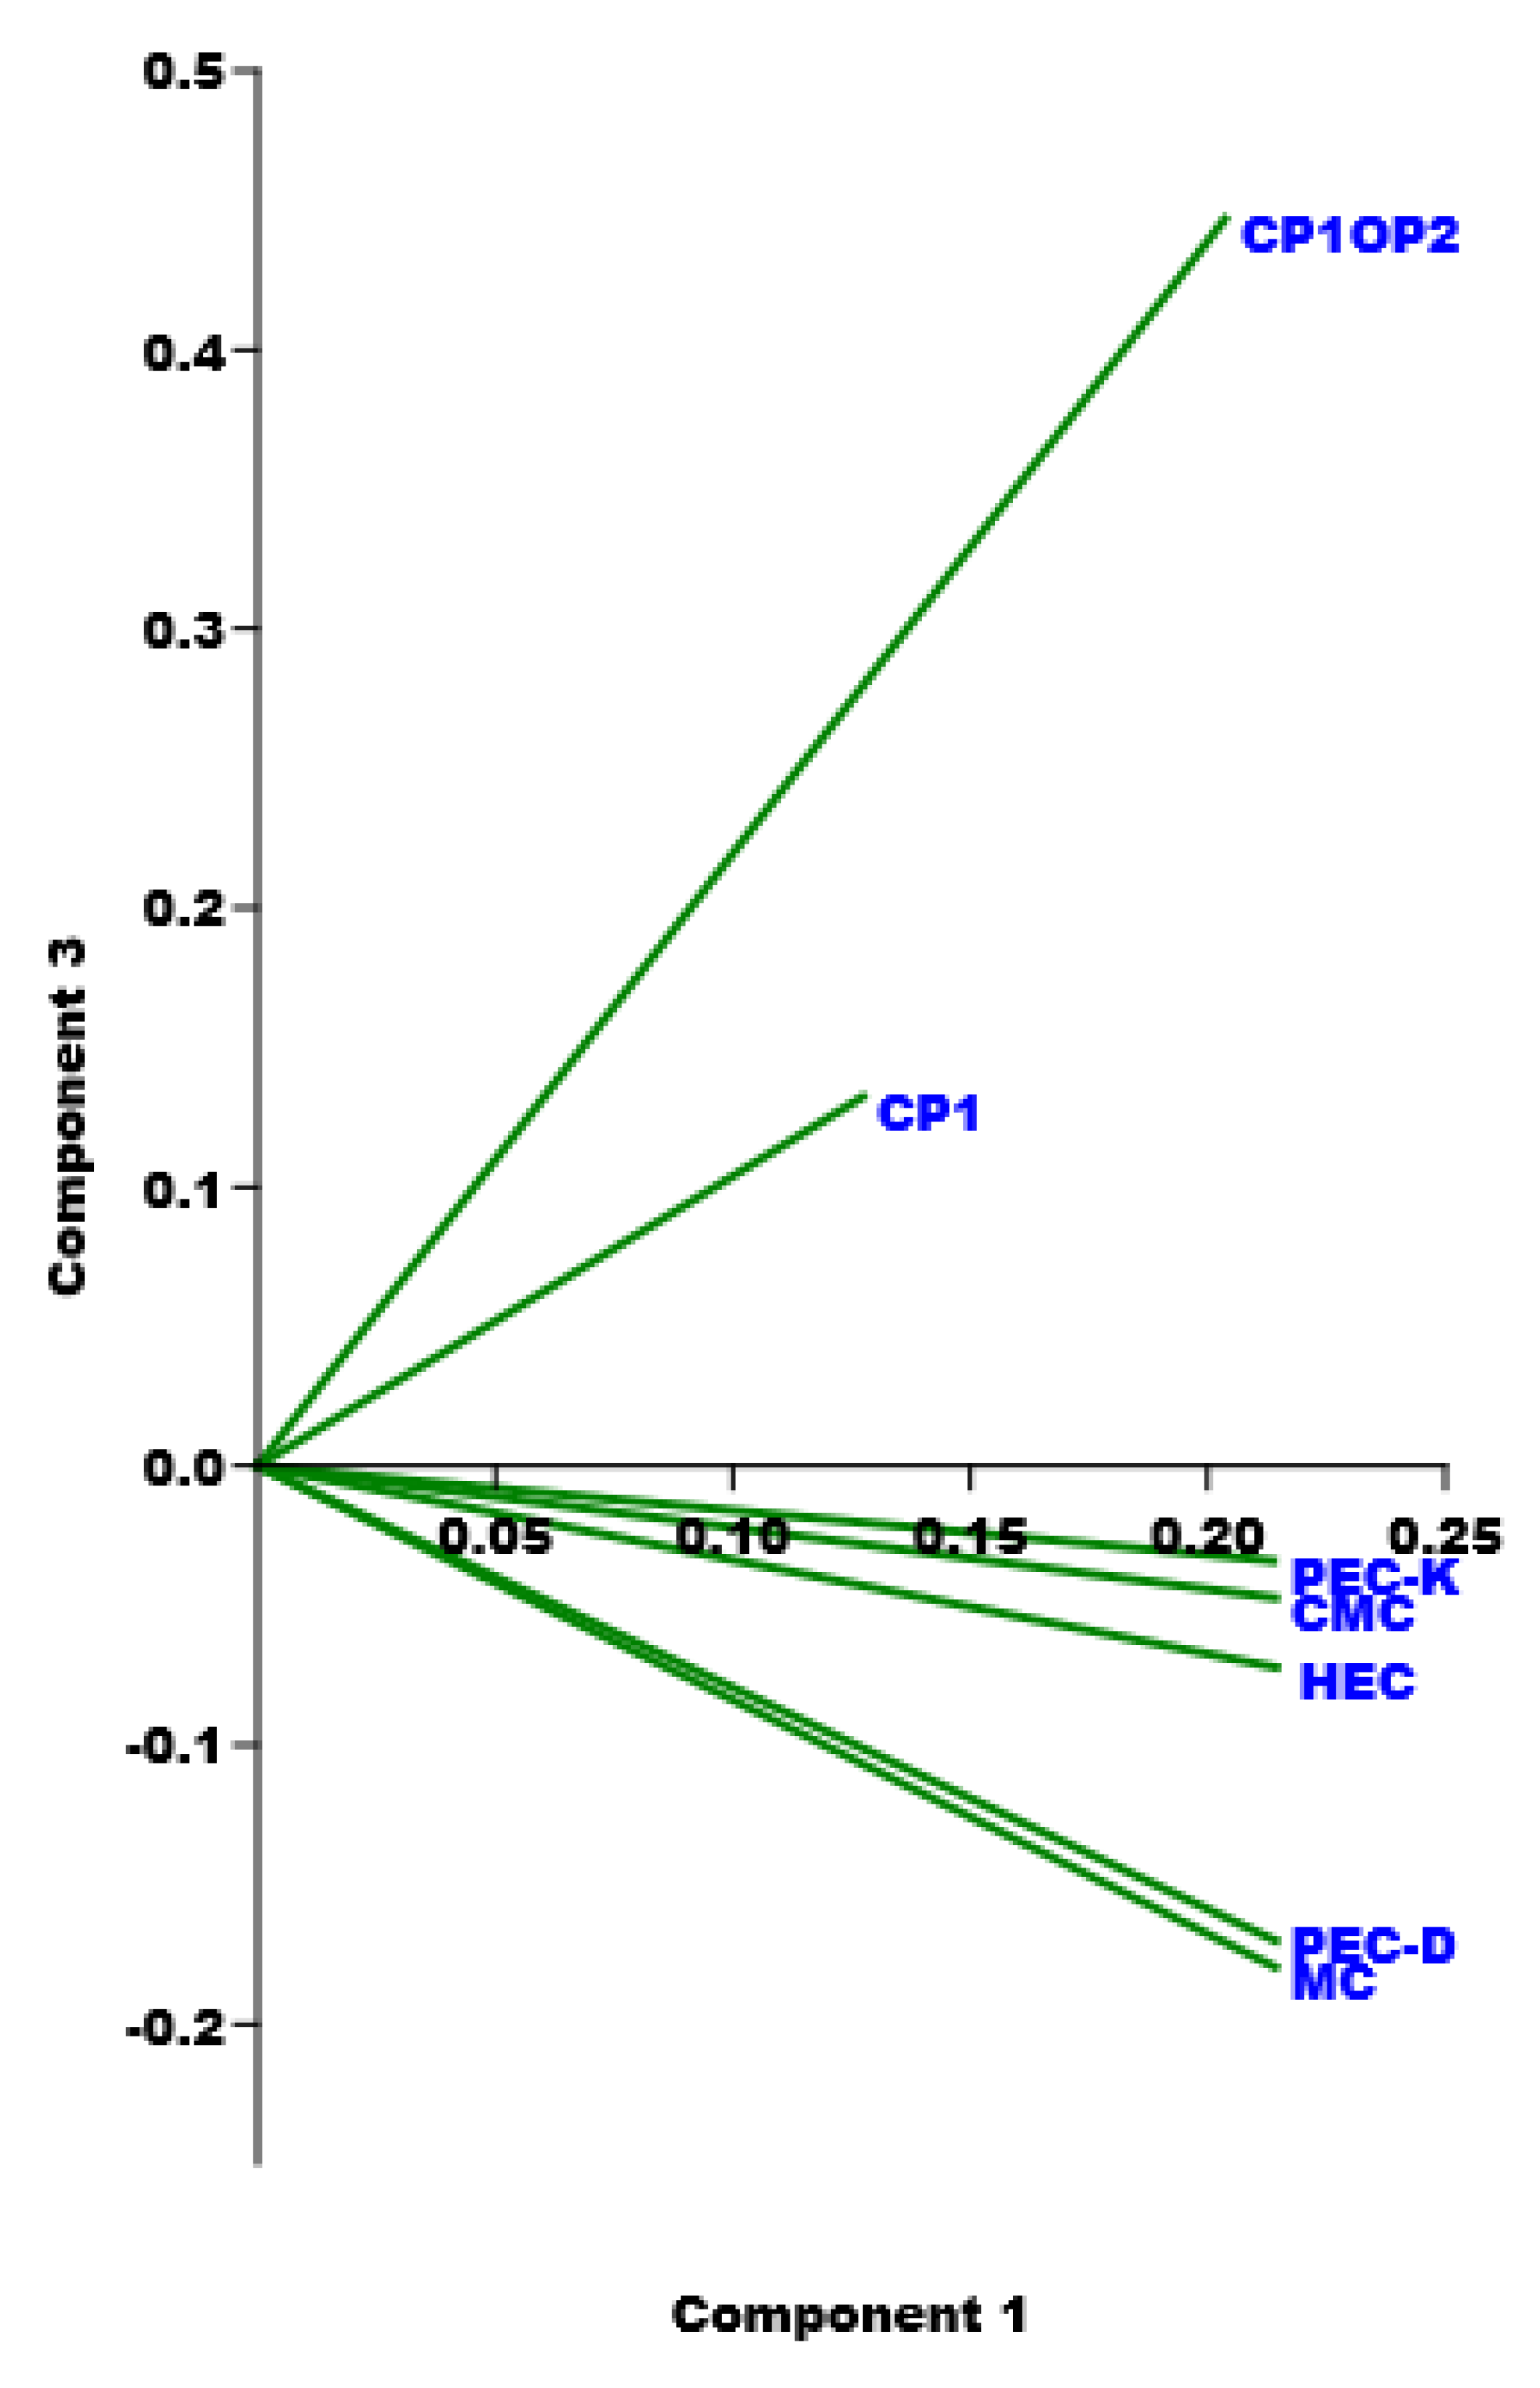
https://past.en.lo4d.com/windows; accessed on 6 September 2022). PCA allowed us to visualize the reciprocal positions that the seven gels occupied in the scores plots of PC1 vs. PC3 (
Figure 14), depending on the presence of similarities or differences in their rheological characteristics, which are included in
Table 7.
Significant information was provided by PC3 on which gels appeared well separated and/or grouped in accordance mainly with their values of dynamic viscosity as a function of shear rate, of their flow behavior indices (n), and of their consistency indices (α), surely influenced by the structural and physicochemical characteristics of the gels’ components. In particular, all carbohydrate-based gels were located at negative scores on PC3, while styrene-based gels were positioned at positive scores. Additionally, the CP1OP2-Hgel was positioned at very high scores and very distant from all other samples, including CP1, thus evidencing that the CP1OP2-Hgel has different rheological behavior to those of all other gels. In fact, while CP1OP2-Hgel, characterized by values of α < 1 and n > 1 of the linear regressions obtained by fitting the rheological data to the Cross mathematical model, demonstrated a dilating, shear thickening behavior, all other gels shared a pseudoplastic shear thinning behavior characterized by values of n < 1. Additionally, all gels were not differentiated on PC1 (very similar scores), except for CP1, which was segregated at a positive score lower than other gels. We attributed this finding to the values of its consistency index (α), which was higher than those of all other gels. Within the family of carbohydrate-based gels, additional differentiations were found on PC3 on the base of the n values. In particular, PEC-D and MC with the lowest n were positioned close each other at the highest negative score and separate from PEC-K, CMC, and HEC, which formed a cluster at lower negative scores.
4. Conclusions
In this study, which aimed to develop a new broad-spectrum antibacterial formulation for topical administration, possibly intended for the treatment of severe skin infections caused by MDR bacteria, we reported the synthesis and physicochemical characterization of a two-component hydrogel using two previously reported bactericidal cationic polymers (CP1 and OP2) as ingredients. In this regard, to make our research more robust and relevant, we first investigated the cytotoxic behavior of CP1 and OP2 against human fibroblasts (MAIL-2). The values of the selectivity indices (SIs) obtained (up to 12) for several clinical isolates supported the progression of the study reported here. In particular, the styrene-based bactericidal copolymer CP1 was used as a bactericidal ingredient and as a thickening agent, to formulate the water-soluble bactericidal homopolymer OP2 in gel. OP2 was used equimolar with CP1. The project was based on the powerful antibacterial and bactericidal effects of the two polymers. Notably, while the antibacterial activity of CP1 and OP2 was very similar on Gram-positive MDR strains of the genus Staphylococcus and Enterococcus (with CP1 more active than OP2), it was complementary on some clinical isolates of non-fermenting Gram-negative species such as A. baumannii and S. maltophylia, with OP2 more active than CP1. Therefore, we hypothesized that a formulation holding both compounds should combine the antibacterial effects of the individual components, thus providing an antibacterial agent with a very broad spectrum of action. Our idea also derived from the physicochemical characteristic of CP1, which showed the ability to self-form gel and was successful when was used it to form a one-component Bingham pseudoplastic gel composed only of CP1 and water. This gel had a high swelling capacity, high porosity, and spreadability. No additives (such as gelling agents) or physicochemical techniques were employed to obtain the 3D gel network based on CP1 and OP2, but only water was used to disperse the two components. As a result, the CP1OP2-Hgel developed here was obtained with a low-cost procedure, accessible to the operator, and without other ingredients that could affect the biological properties of CP1 and OP2 or make the gel dangerous or incompatible with the skin for a future topical application. The chemical structure and morphology of the prepared CP1OP2-Hgel were evaluated by ATR-FTIR spectroscopy and SEM, while rheological experiments also processed by PCA established that it fits the Cross rheological model well and behaves as a shear-thickening dilating fluid. The weight loss profile over time, the equilibrium swelling ratio percentage, and the maximum swelling and porosity capacity were obtained by carrying out the necessary experiments. Weight loss experiments showed that the release of the water contained in the gel was very slow, but a quantitative release was achieved after 24 h of heating at 37°C. The release of water followed first-order kinetics, which means that it depended on the residual concentration of water in the gel. Experiments to find the equilibrium swelling ratio percentage on dry gel samples demonstrated that dried samples reform the hydrogel, swelling by 2789% in 30 min, while the porosity and maximum swelling capacity were 85–91% and 583–1033%, highlighting that the CP1OP2-Hgel, in addition to being advisable for the topical therapy of skin infections, could also promote wound healing. Finally, although the NH2 content in CP1 and OP2 as isolated polymers had previously been assessed, the CP1OP2-Hgel was titrated potentiometrically to determine the NH2 equivalents per gram of gel. Overall, due to the potent bactericidal effects of CP1 and OP2 and their favorable selectivity indices against the most common pathogens present on nosocomial objects and transmissible to humans, the CP1OP2-Hgel could become a new weapon for disinfecting the skin and for the treatment of severe skin infections.


 ,
, 


