
Anabolic Peptide-Enriched Stealth Nanoliposomes for Effective Anti-Osteoporotic Therapy


Abstract
:
1. Introduction
2. Materials and Methods
2.1. QbD Approach in Formulation Development
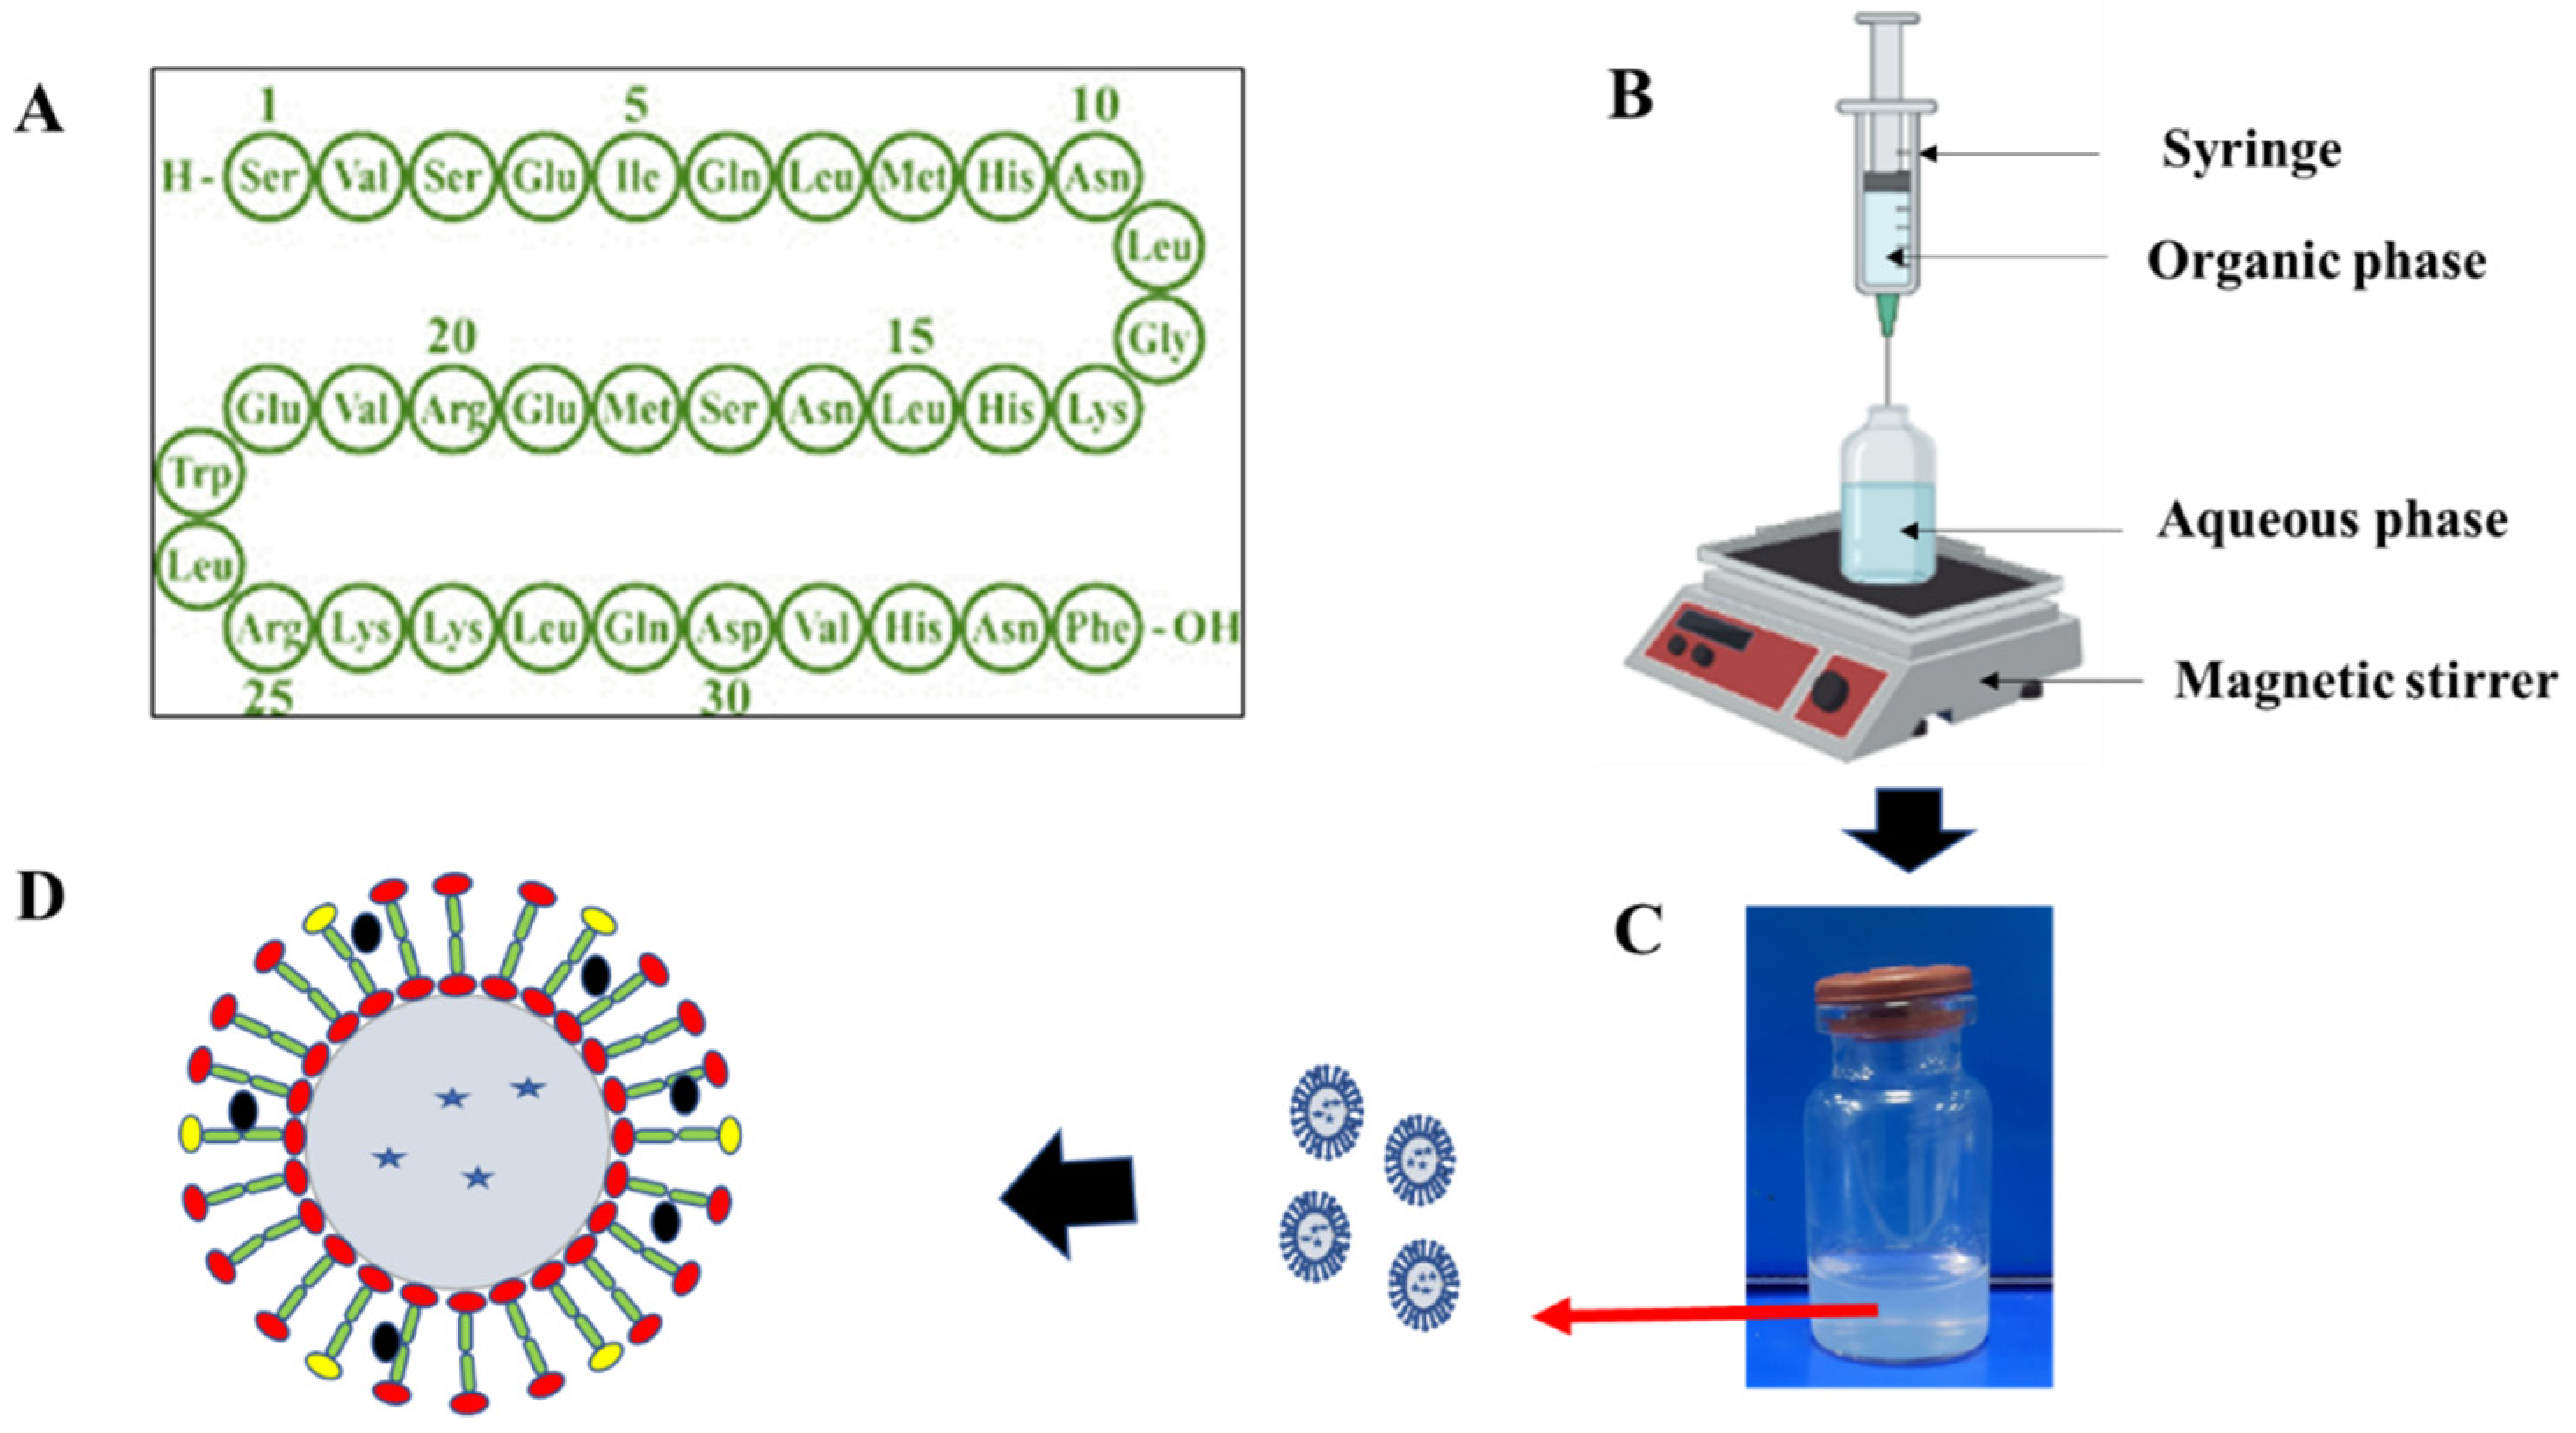
2.2. Development of PTH-LPs
2.3. Evaluation of PTH-LPs
2.3.1. Particle Size and Zeta Potential Determination of PTH-LPs
2.3.2. Determination of %EE
2.3.3. Cryogenic Field Emission Scanning Electron Microscopy (Cryo FE-SEM)
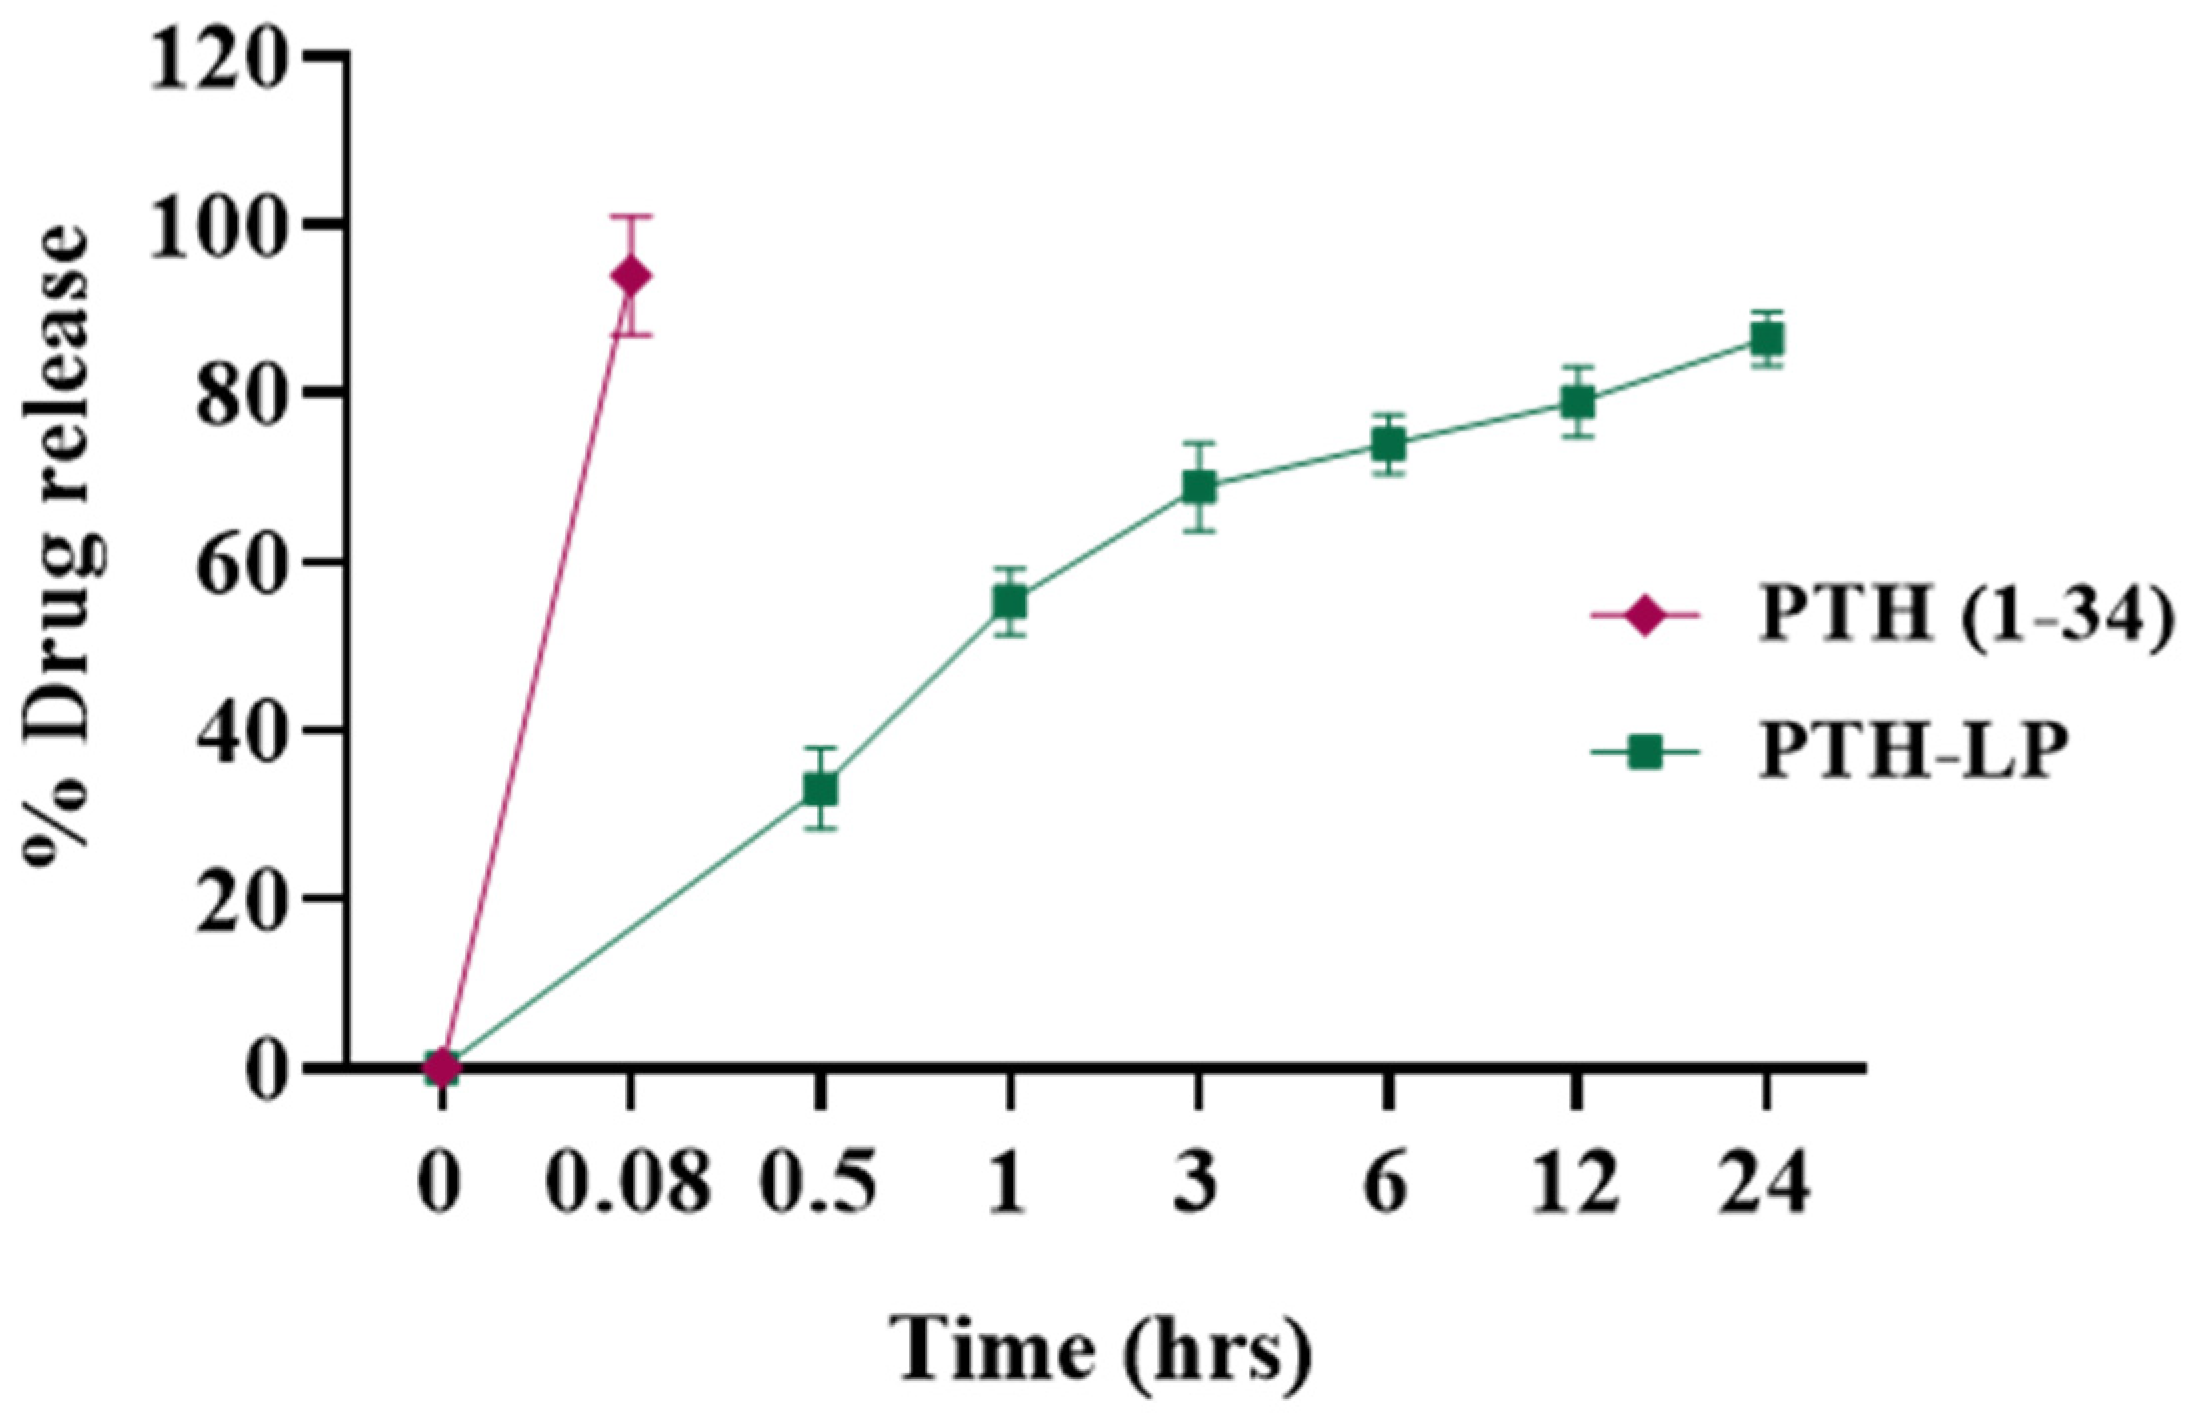
2.3.4. In Vitro Drug Release
2.3.5. Cell Culture
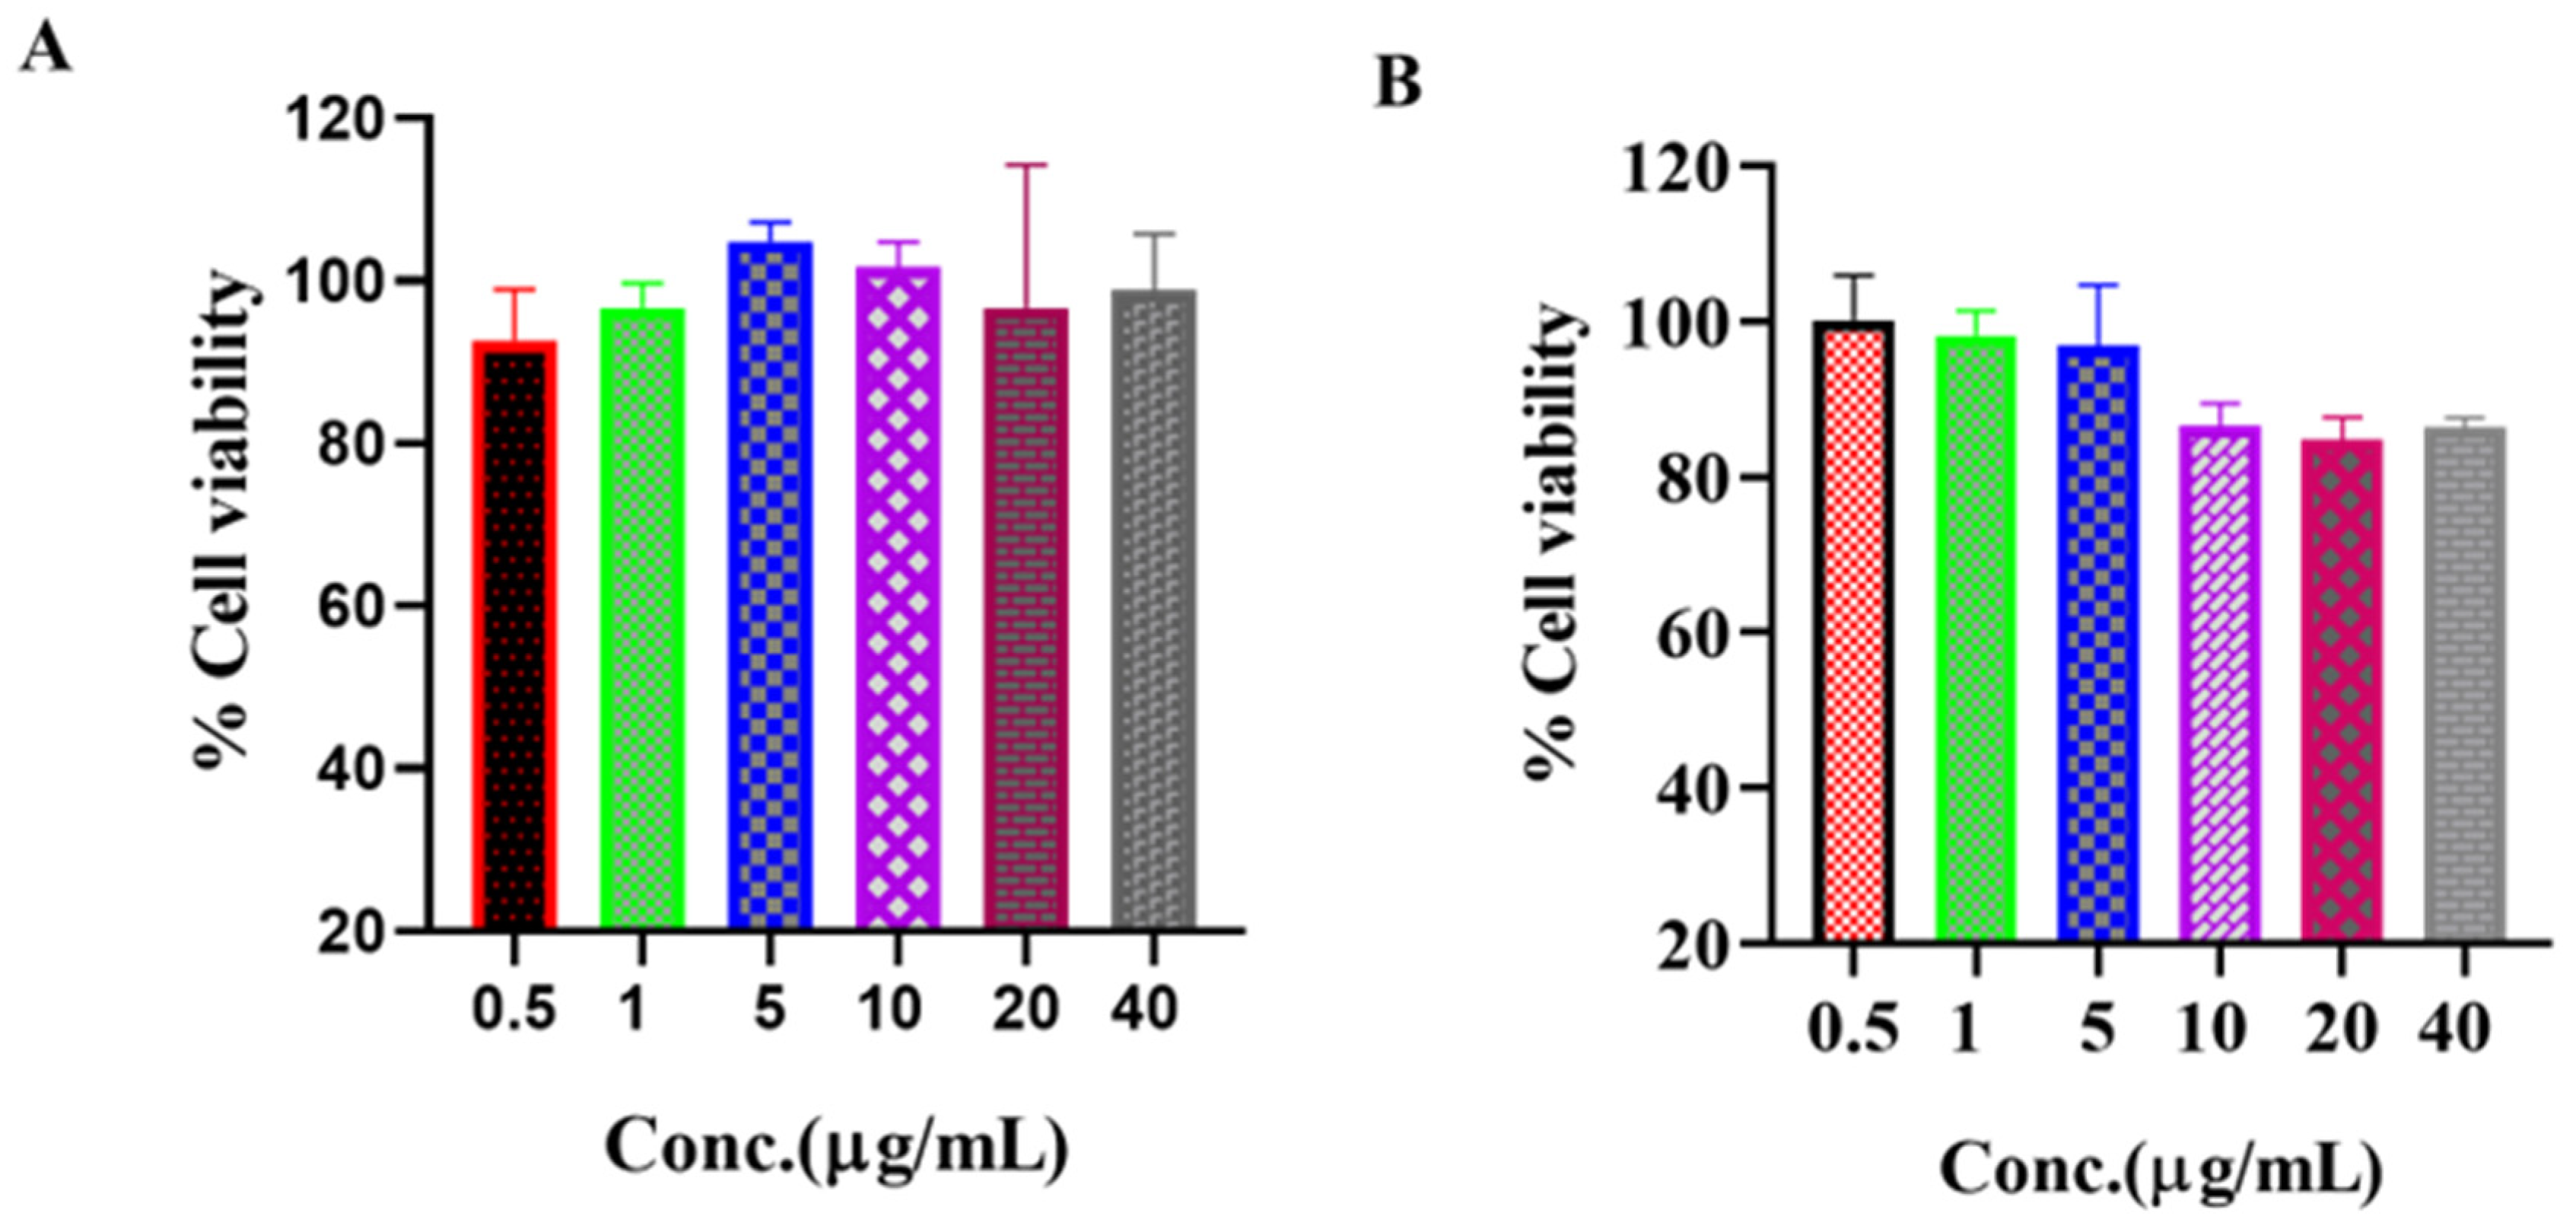
Cytotoxicity Assay
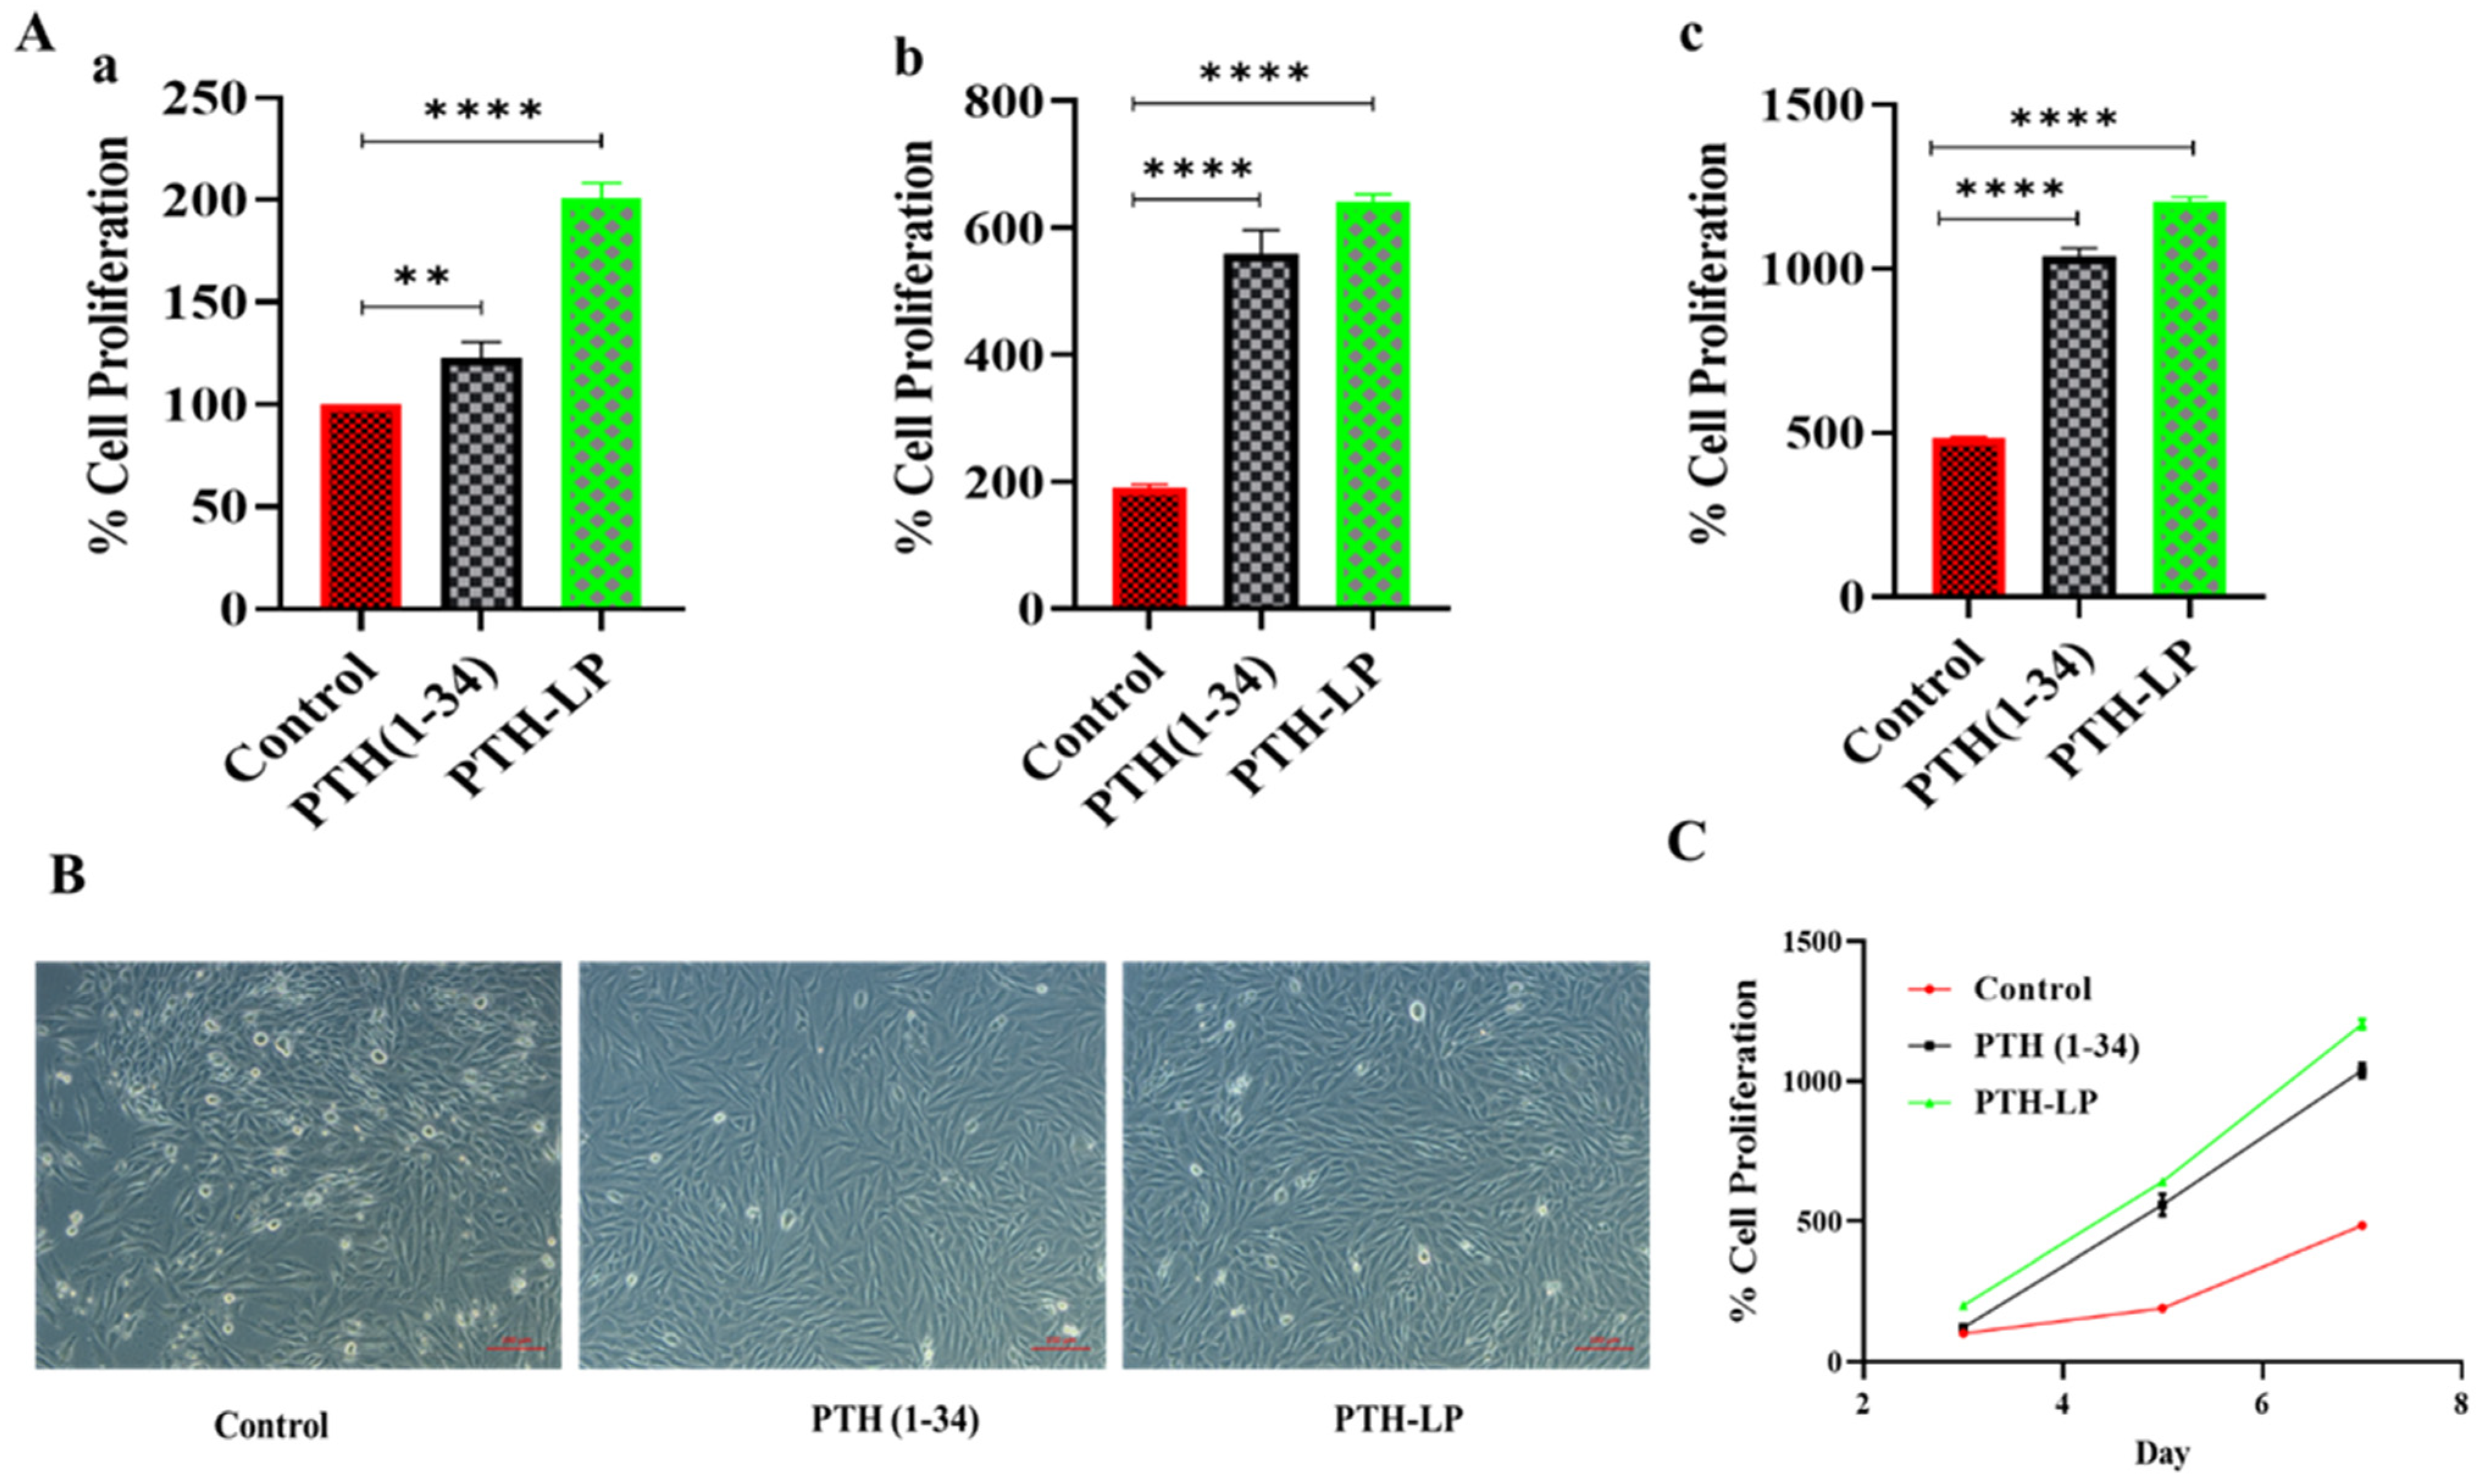
Cell Proliferation Assay
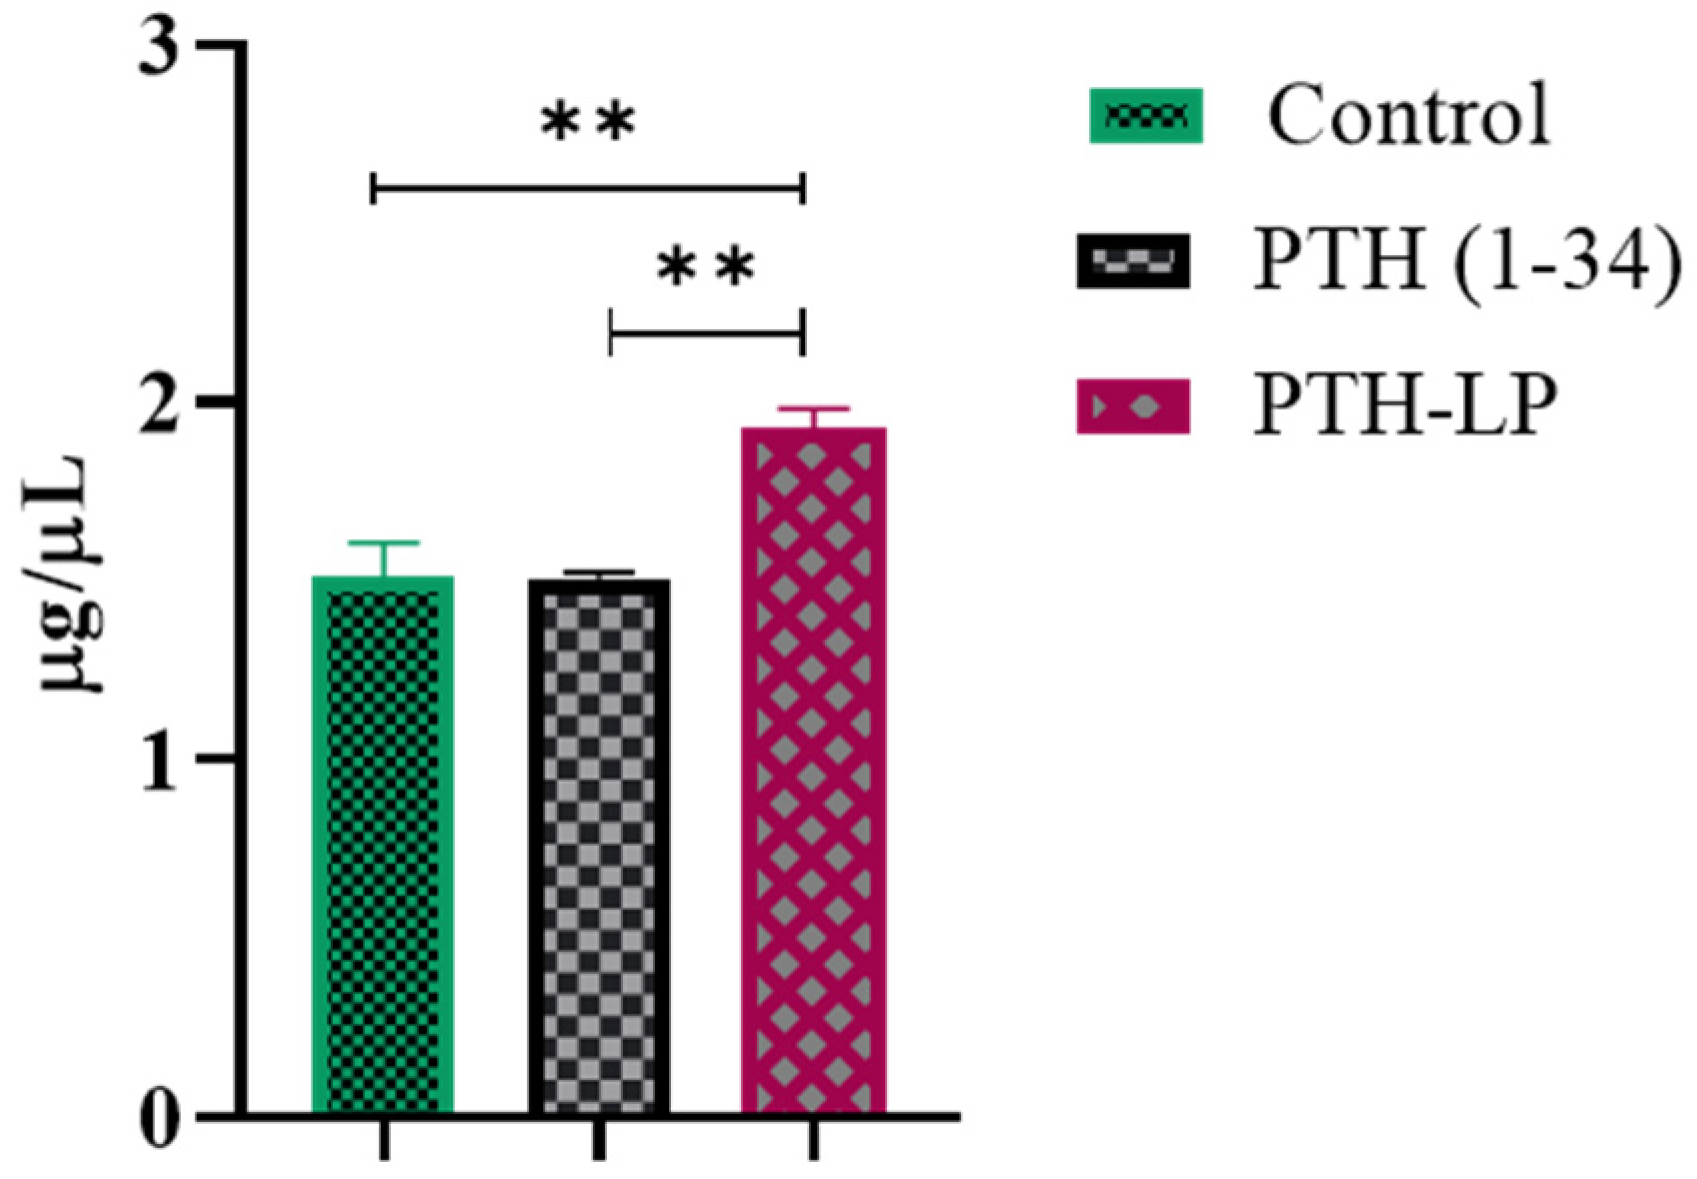
Calcium Calorimetric Assay
Mineralized Nodule Formation
Cellular Uptake Study
2.4. Statistical Analysis
3. Results and Discussion
3.1. QbD Approach: SETTING of QTPP, Identification of CQAs, and Risk Assessment
3.2. Box Behnken Design
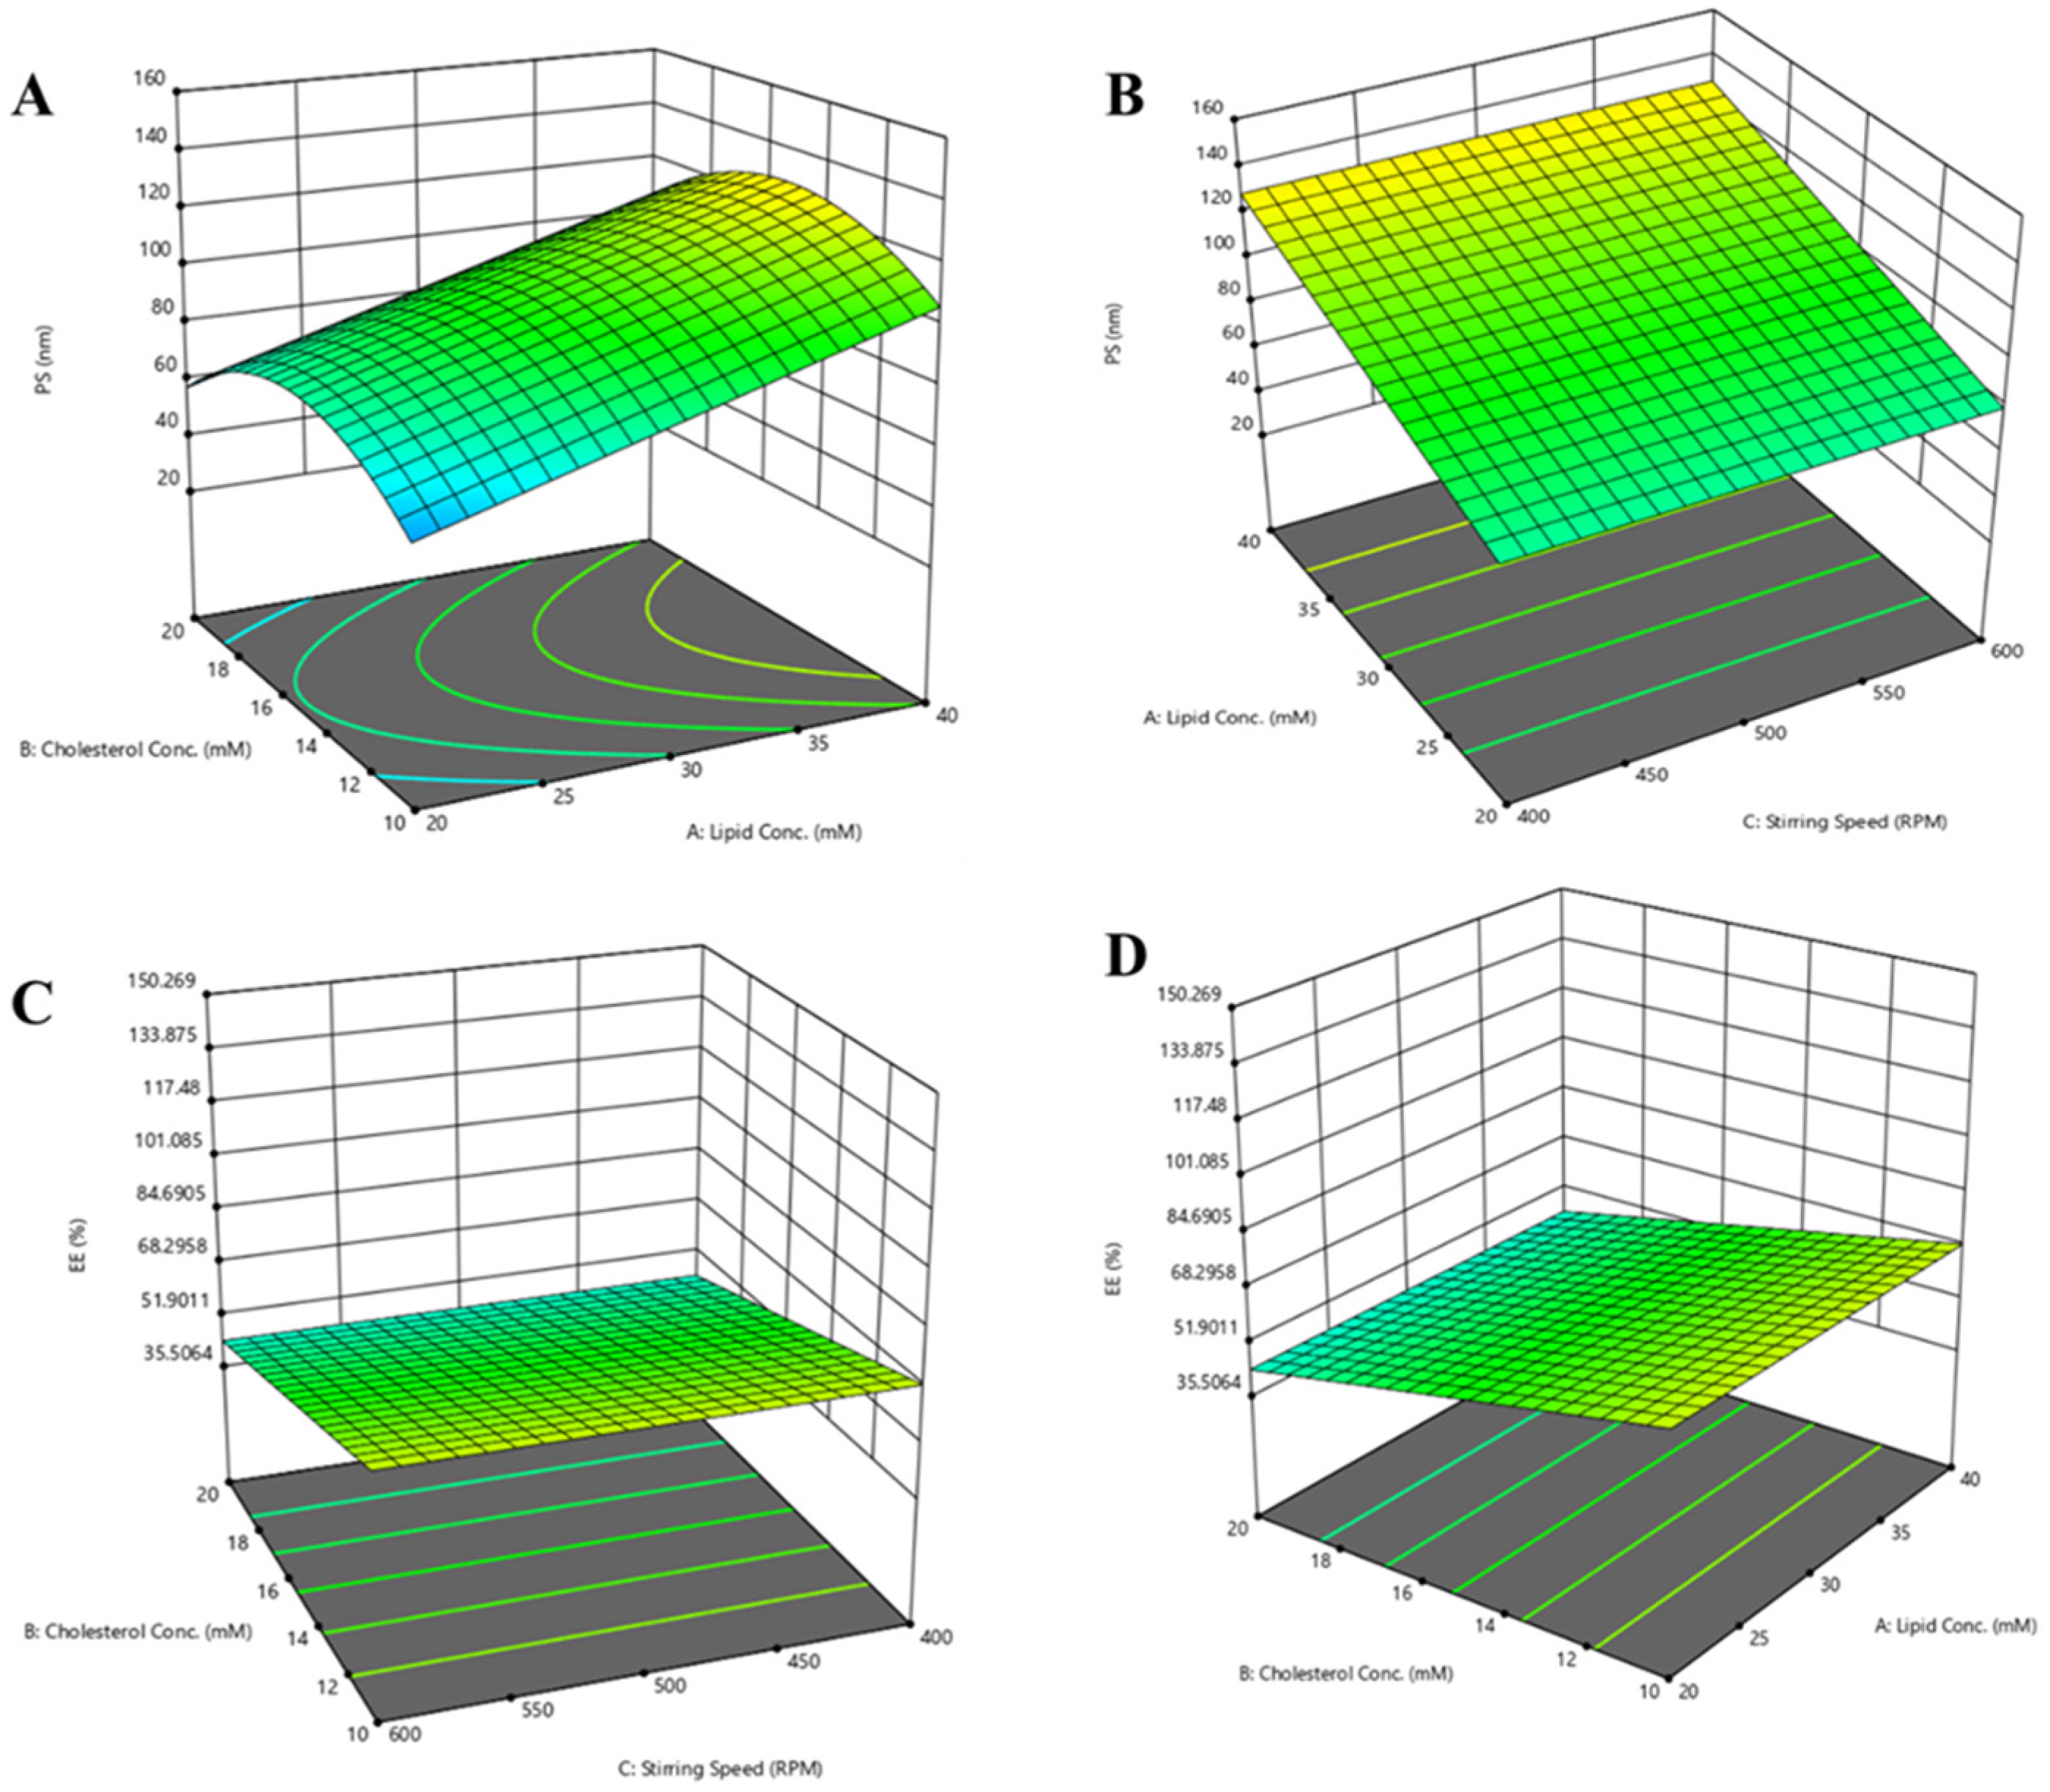
3.3. The Influence of CMA and CPP on Particle Size
3.4. The Influence of CMA and CPP on %EE
3.5. Design Space Generation
3.6. Physicochemical Evaluation of PTH-LPs
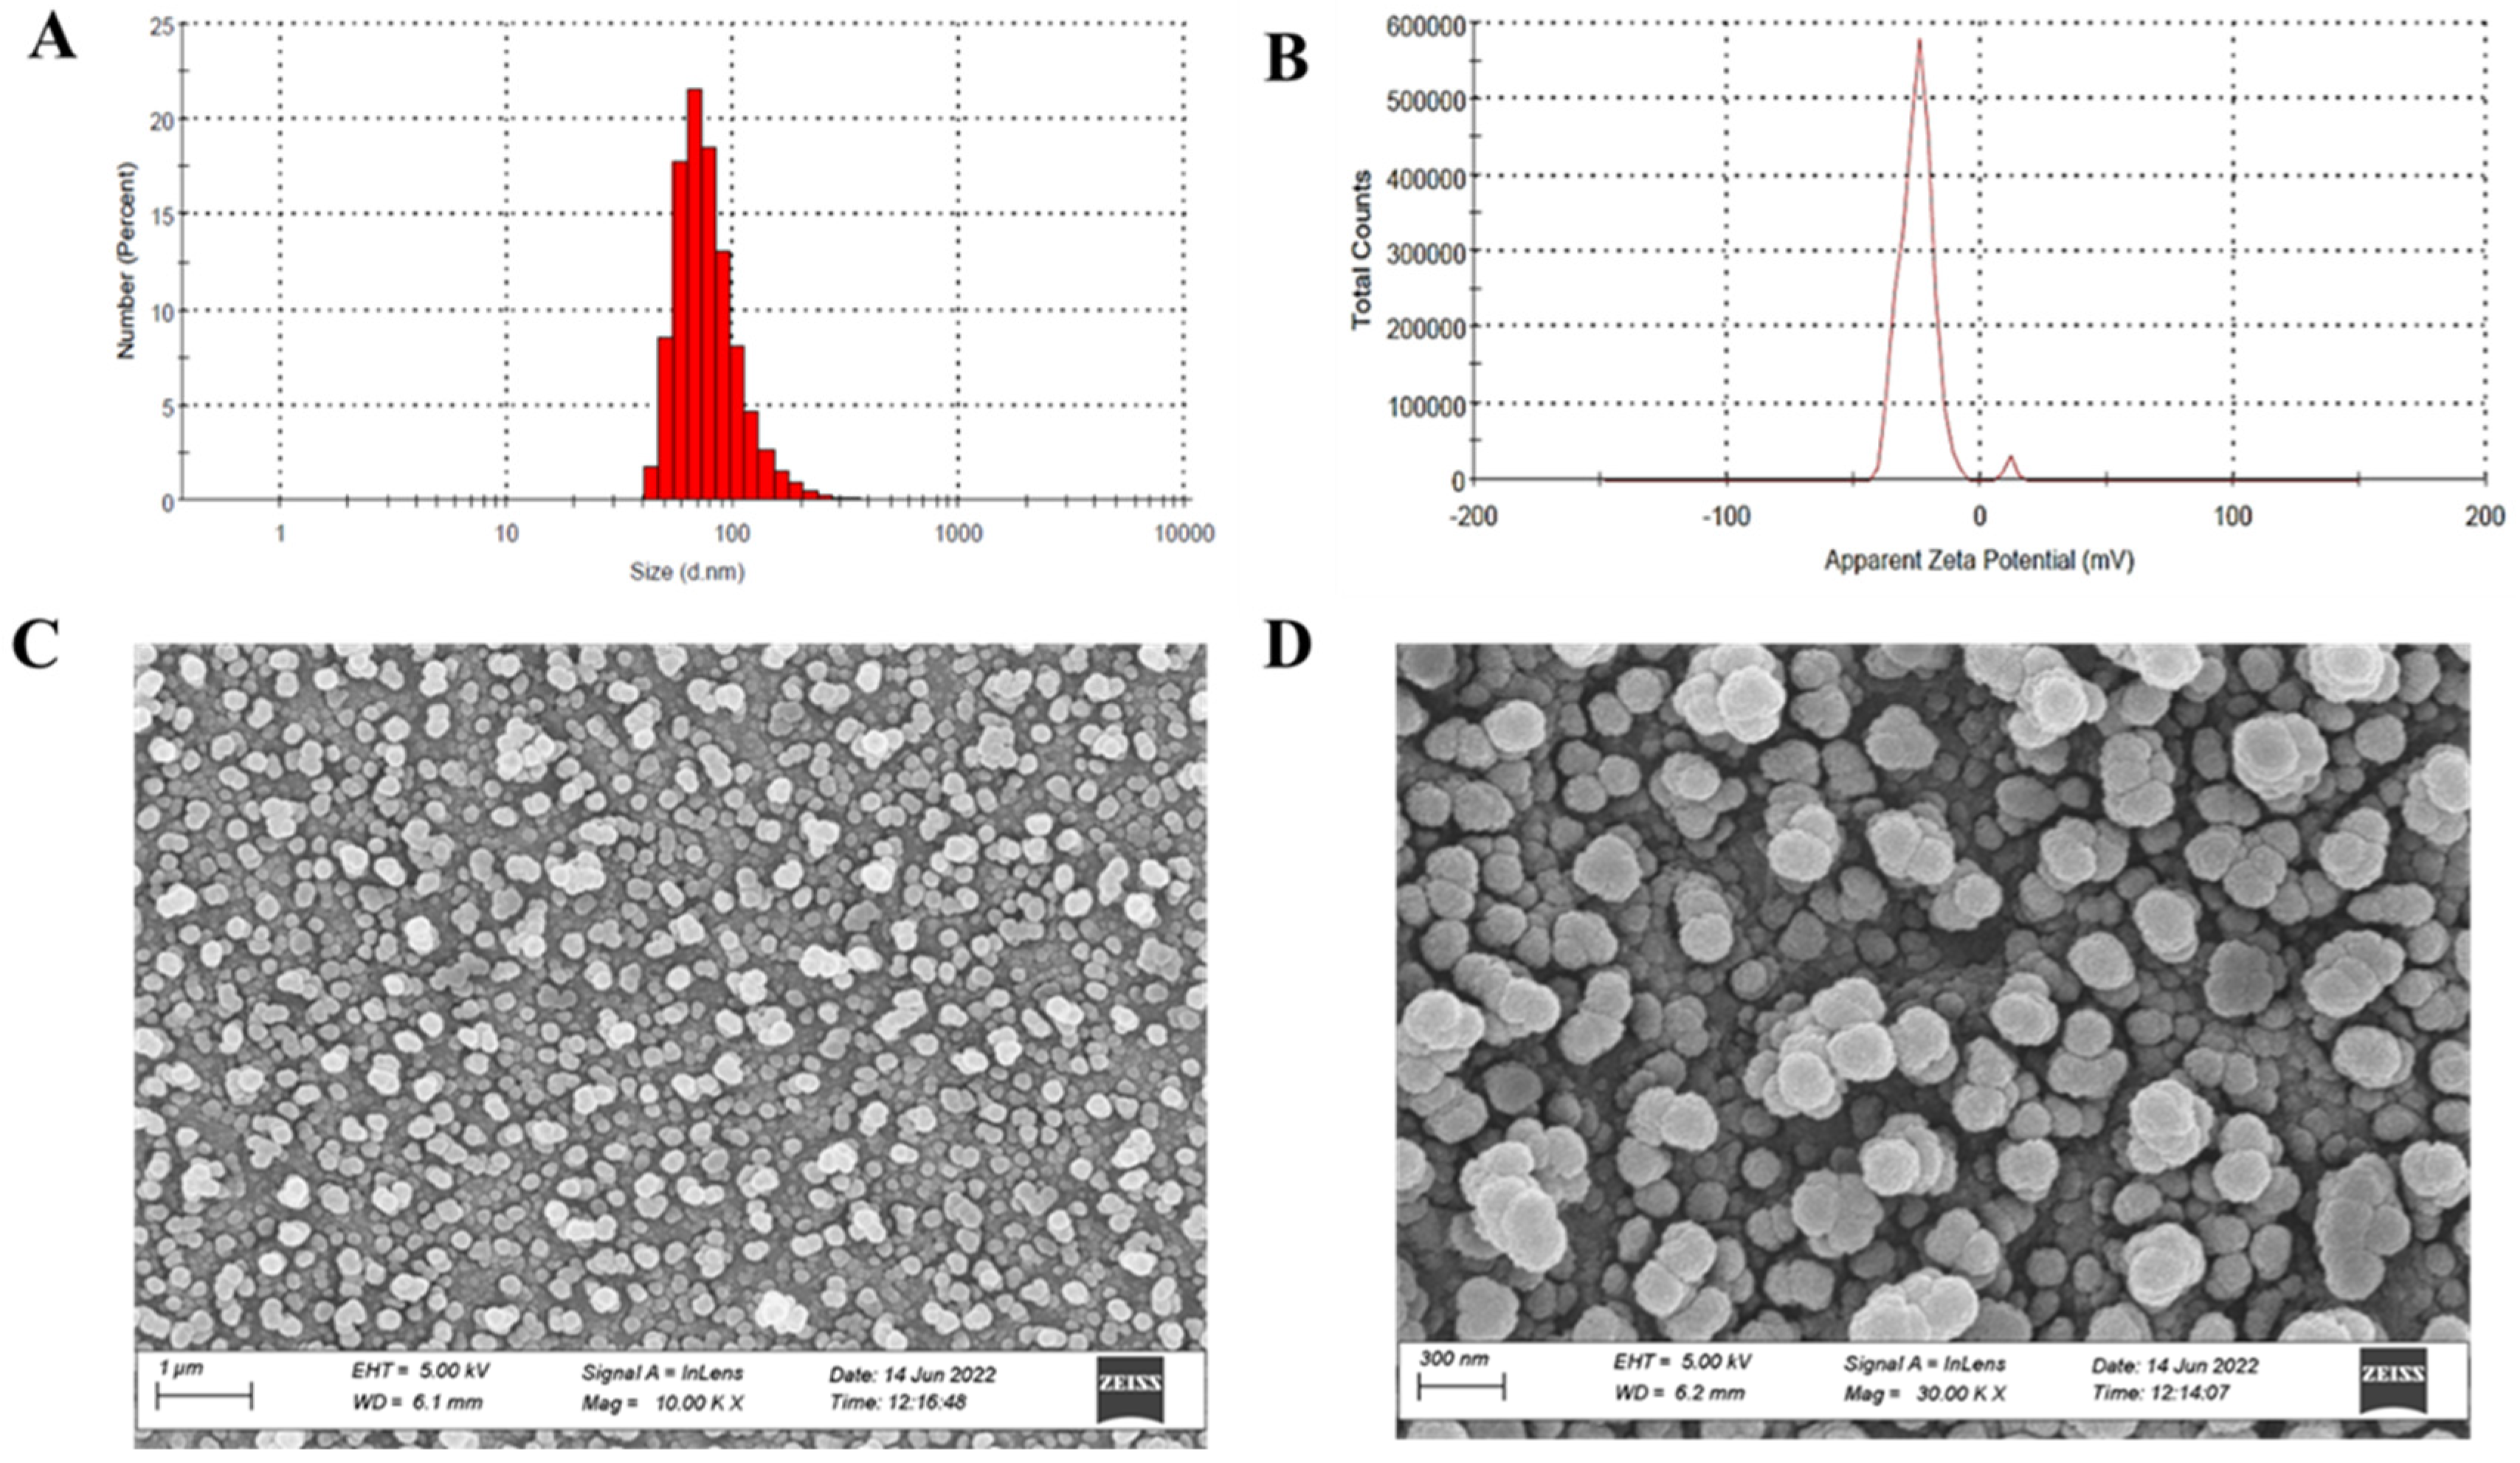
3.6.1. Particle Size, Zeta Potential, and Morphological Assessment
3.6.2. In Vitro Drug Release
3.6.3. In Vitro Cytotoxicity Study and Cell Proliferation Assay
3.6.4. Calcium Calorimetric Assay
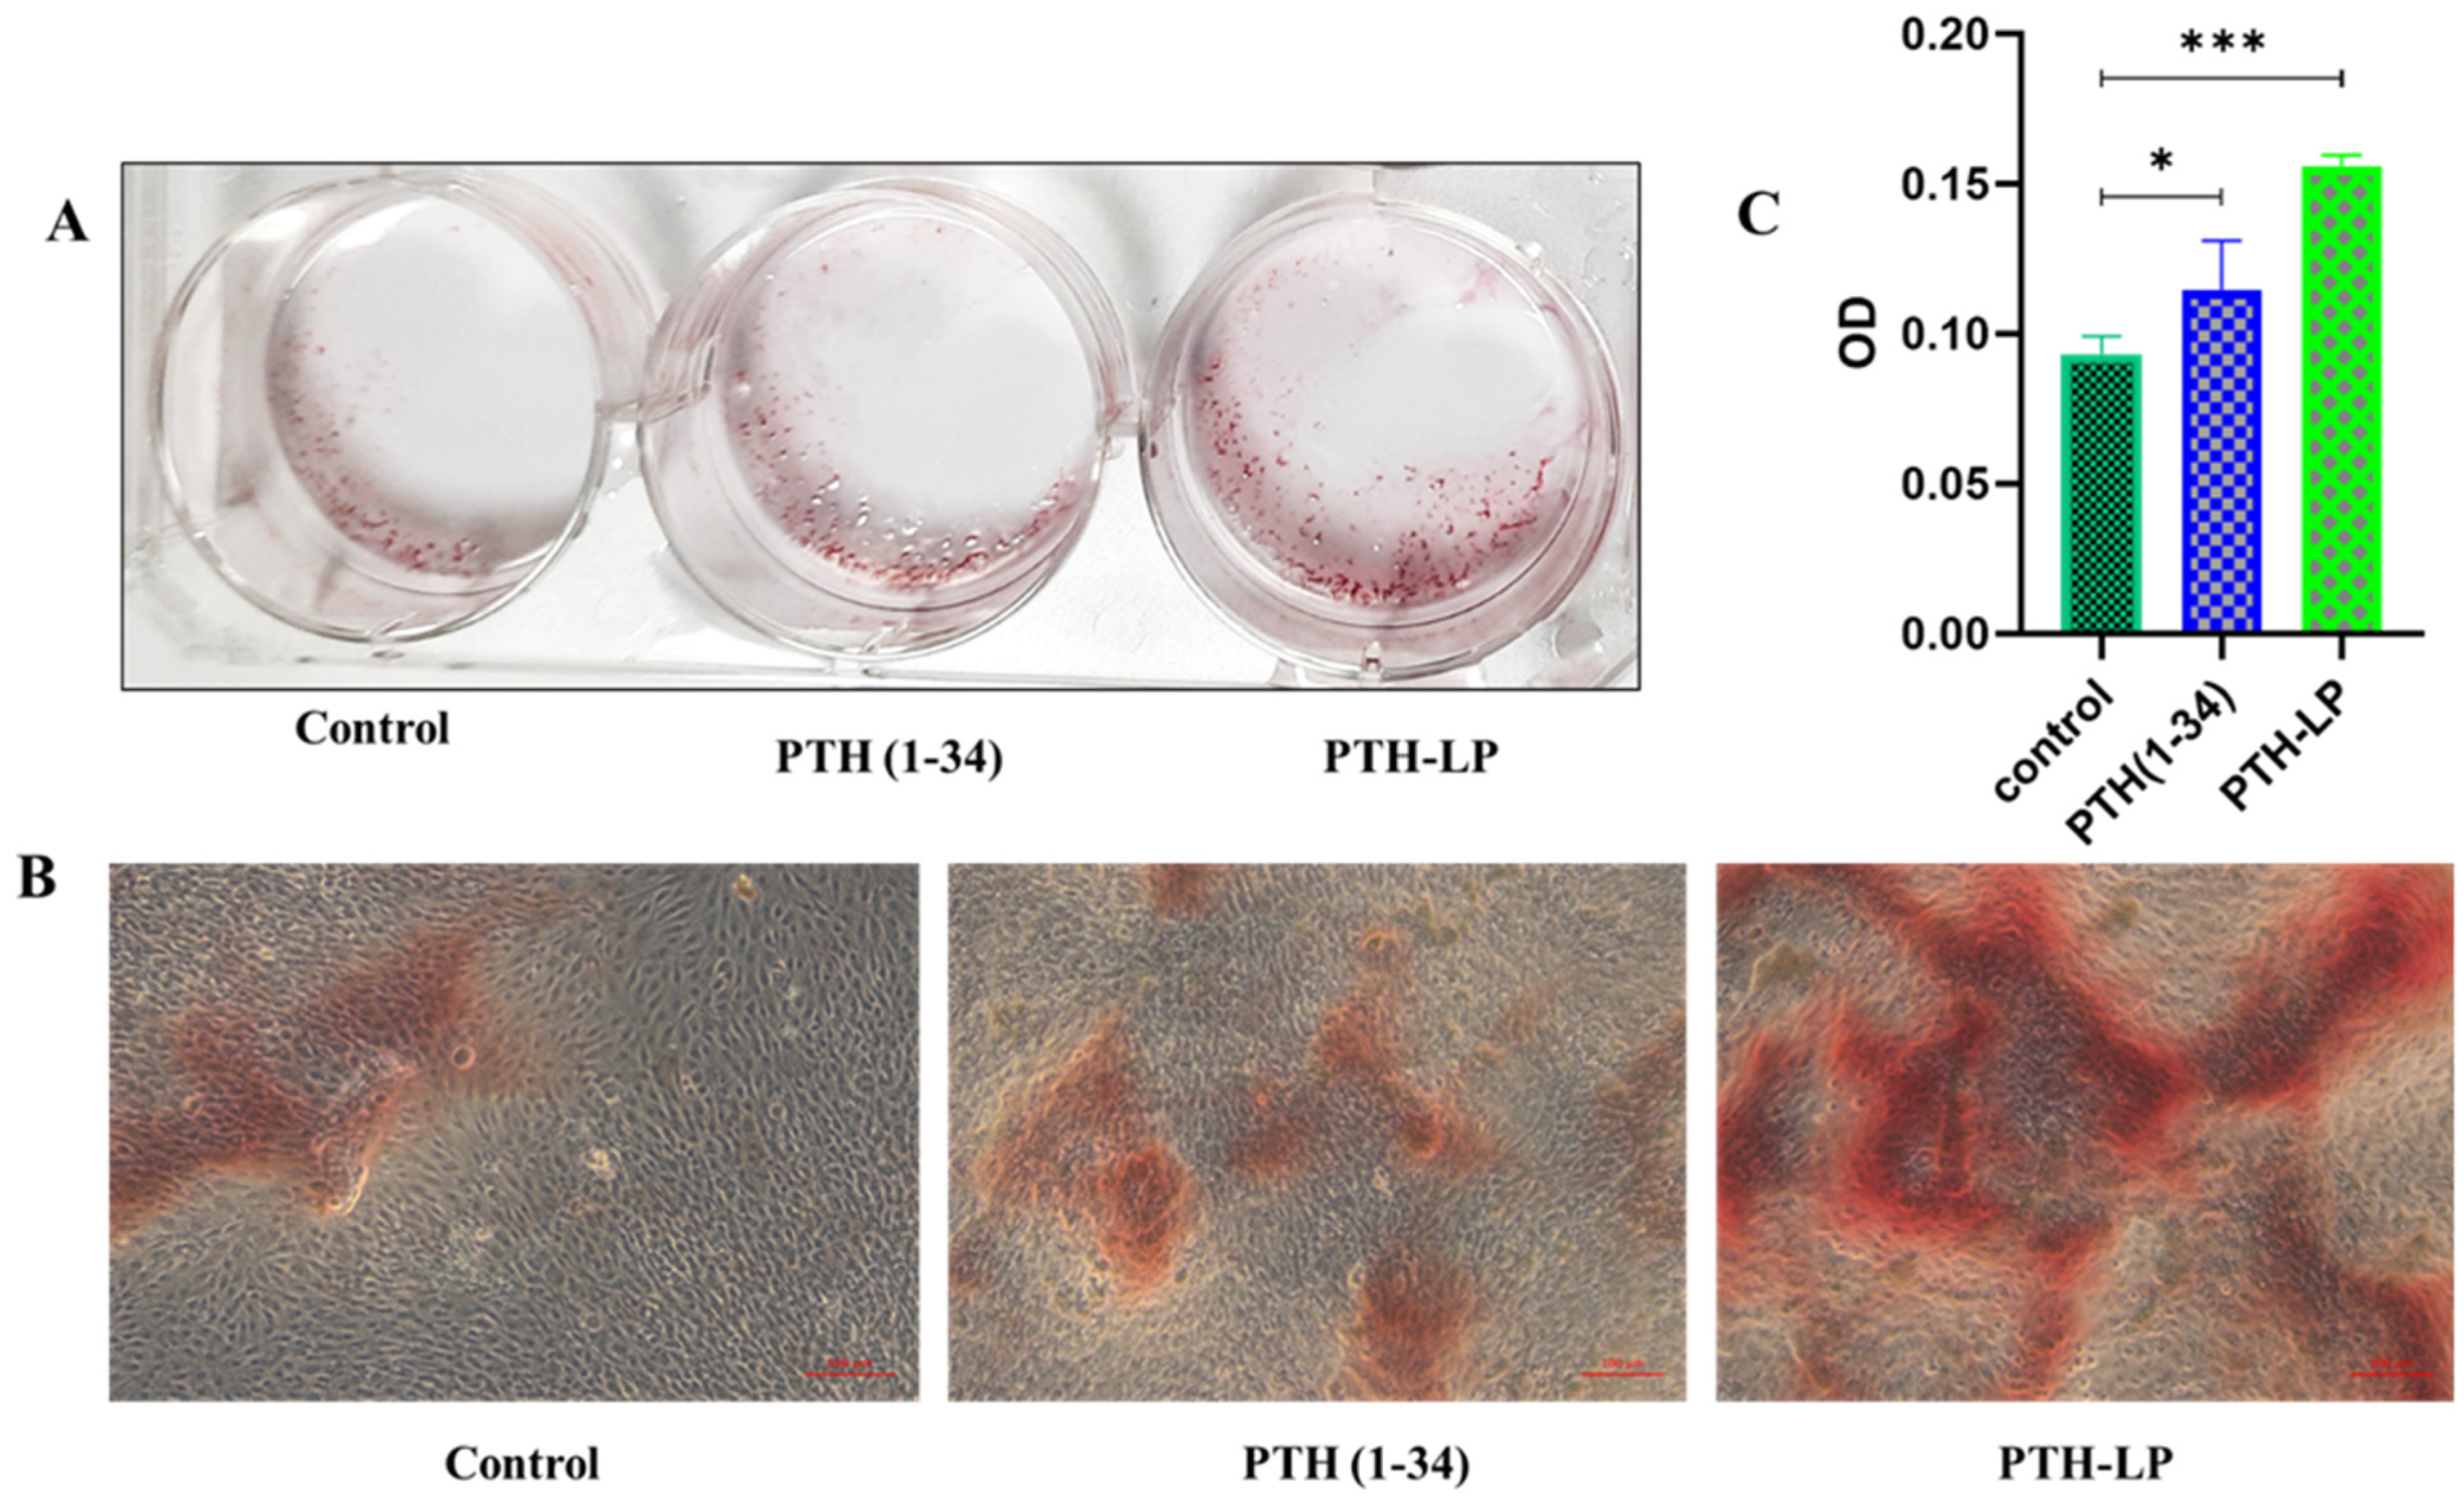
3.6.5. Mineralized Nodule Formation
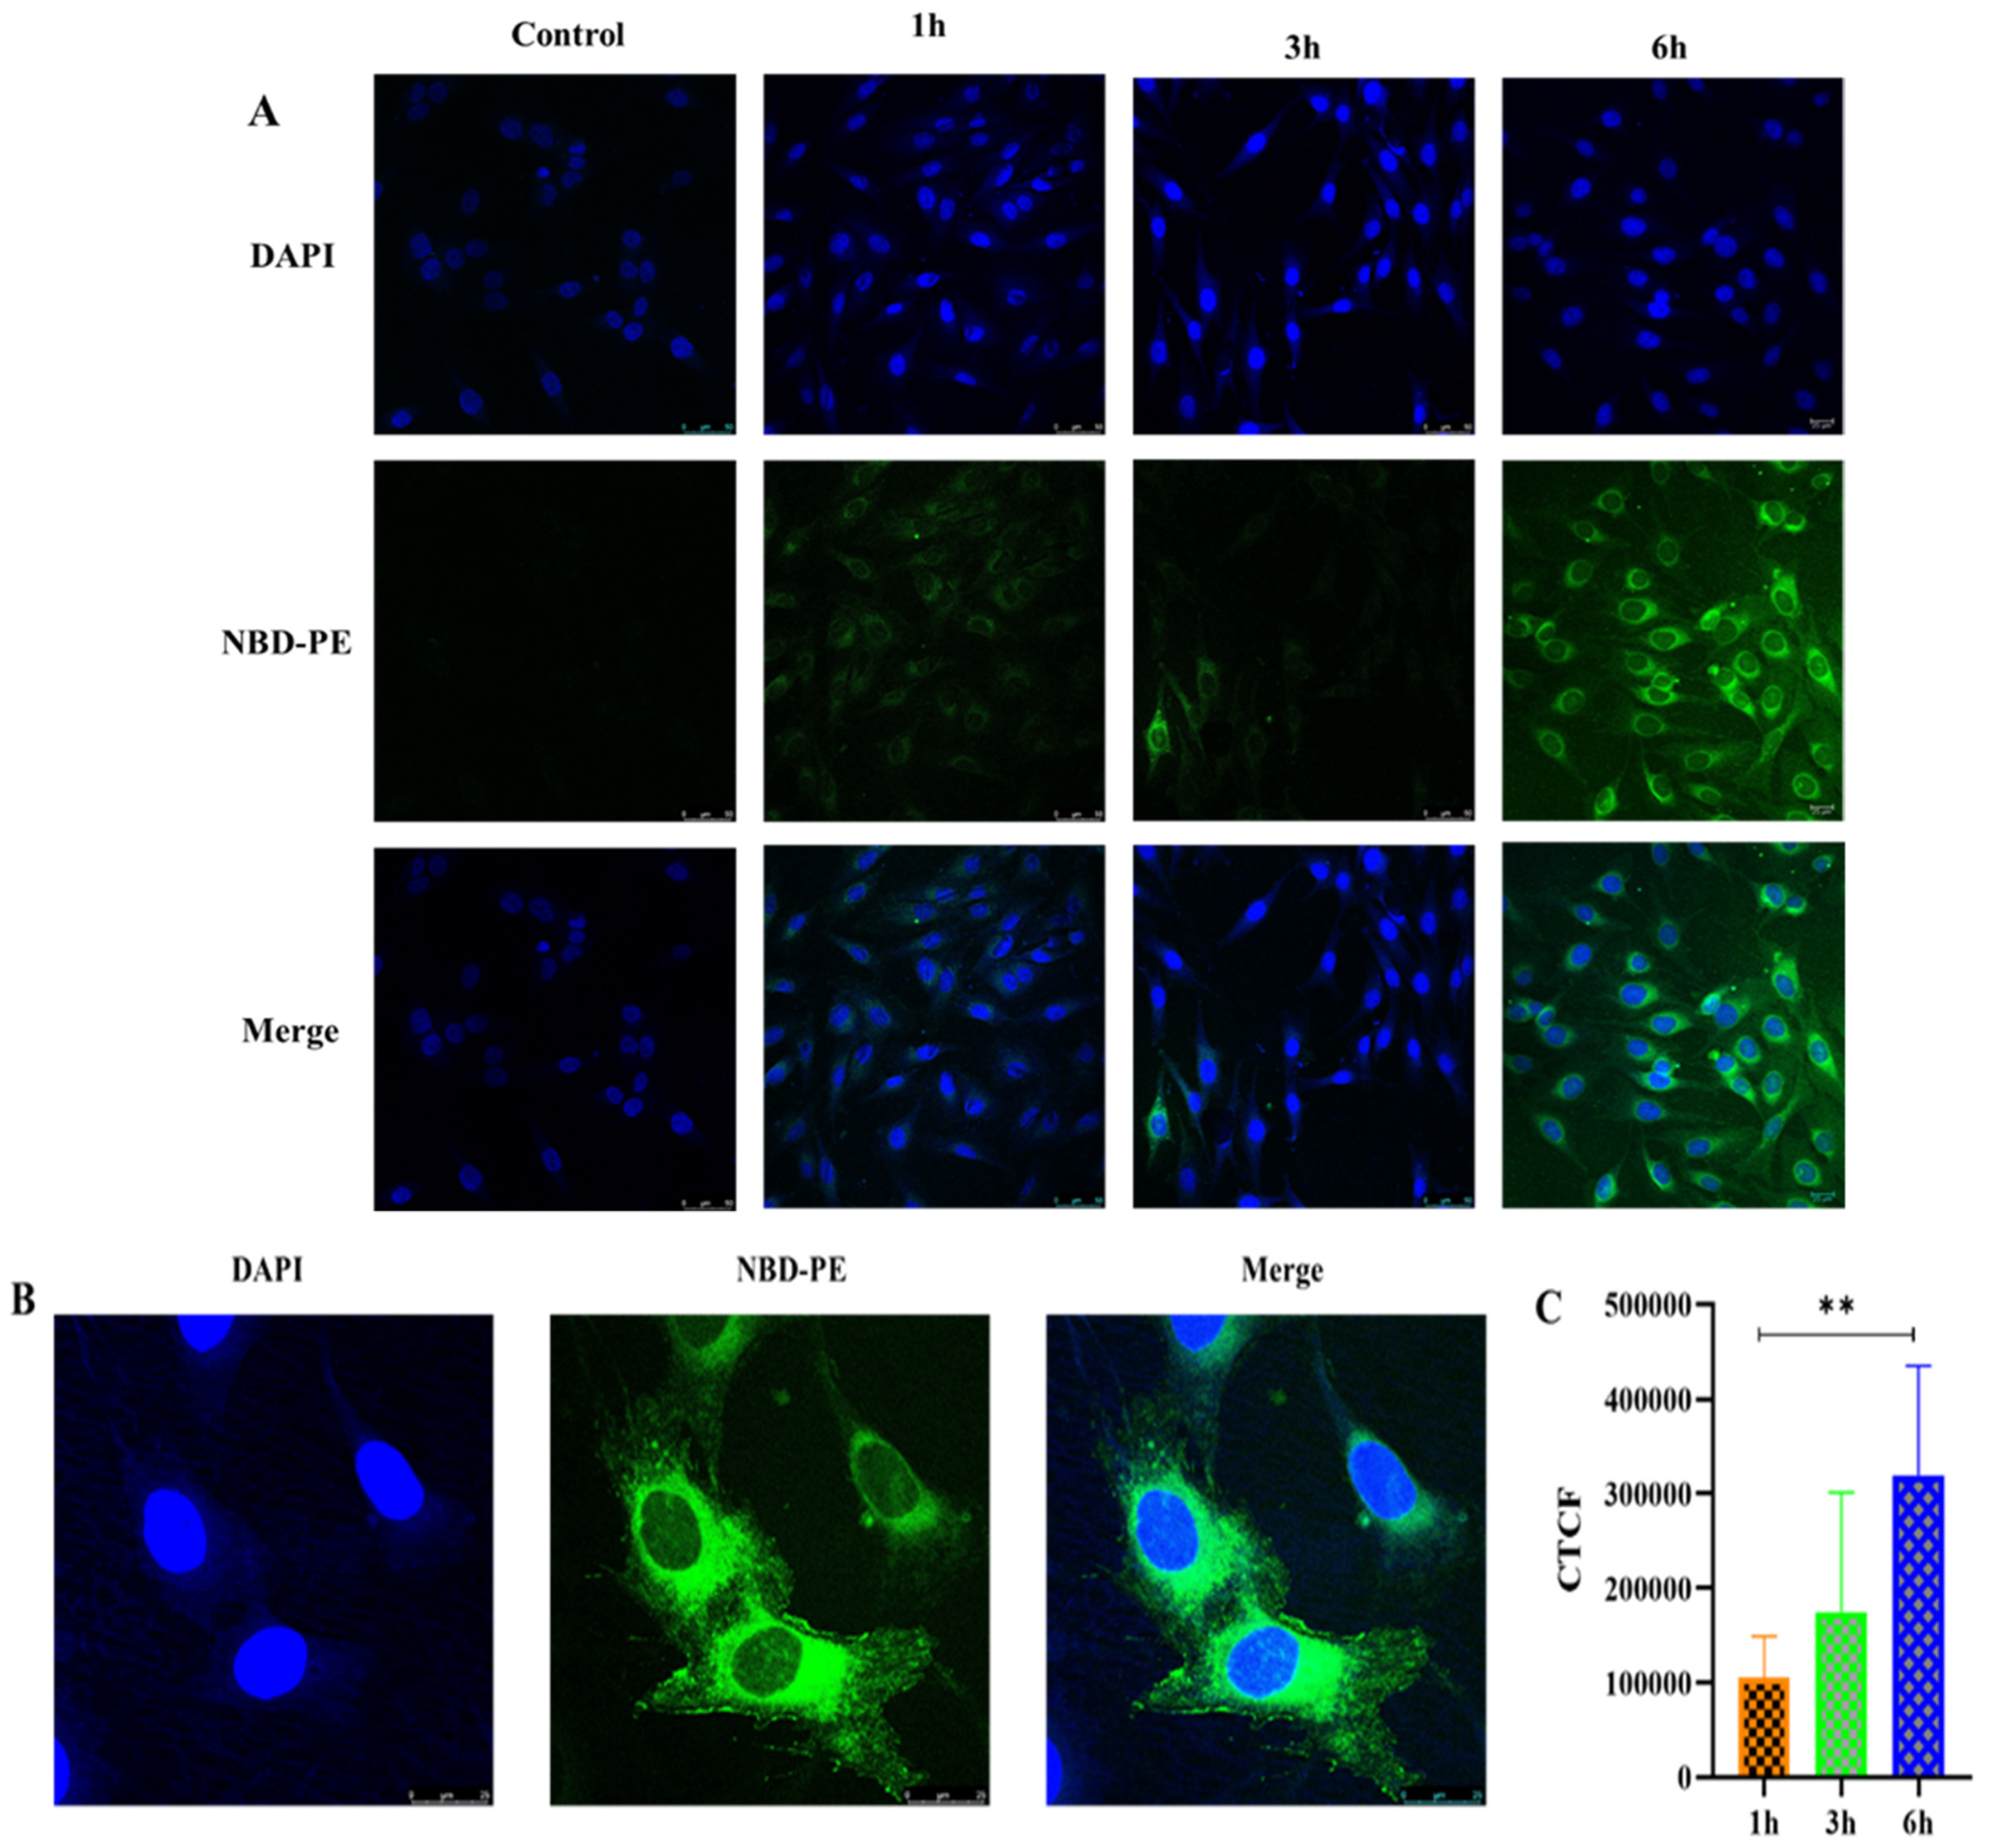
3.6.6. Cellular Uptake Study
4. Conclusions
Supplementary Materials
Author Contributions
Funding
Institutional Review Board Statement
Informed Consent Statement
Data Availability Statement
Acknowledgments
Conflicts of Interest
References
- Compston, J.E.; McClung, M.R.; Leslie, W.D. Osteoporosis. Lancet 2019, 393, 364–376. [Google Scholar] [CrossRef]
- Salave, S.; Rana, D.; Benival, D. Dual Targeting Anti-Osteoporotic Therapy through Potential Nanotherapeutic Approaches. Pharm. Nanotechnol. 2022. [Google Scholar] [CrossRef]
- Eastell, R. Anabolic Treatment for Osteoporosis: Teriparatide. Clin. Cases Miner. Bone Metab. 2017, 14, 173. [Google Scholar] [CrossRef] [PubMed]
- Salave, S.; Rana, D.; Benival, D. Peptide Functionalised Nanocarriers for Bone Specific Delivery of PTH (1-34) in Osteoporosis. Curr. Nanomed. 2021, 11, 142–148. [Google Scholar] [CrossRef]
- Lindsay, R.; Krege, J.H.; Marin, F.; Jin, L.; Stepan, J.J. Teriparatide for Osteoporosis: Importance of the Full Course. Osteoporos. Int. 2016, 27, 2395–2410. [Google Scholar] [CrossRef] [Green Version]
- Quattrocchi, E.; Kourlas, H. Teriparatide: A Review. Clin. Ther. 2004, 26, 841–854. [Google Scholar] [CrossRef]
- FORTEO (Teriparatide Injection) for Subcutaneous Use. Available online: https://www.accessdata.fda.gov/drugsatfda_docs/label/2020/021318s053lbl.pdf (accessed on 12 October 2022).
- Baskaran, R.; Lee, C.J.; Kang, S.M.; Oh, Y.; Jin, S.E.; Lee, D.H.; Yang, S.G. Poly(Lactic-Co-Glycolic Acid) Microspheres Containing a Recombinant Parathyroid Hormone (1-34) for Sustained Release in a Rat Model. Indian J. Pharm. Sci. 2018, 80, 837–843. [Google Scholar] [CrossRef]
- Amani, N.; Javar, H.A.; Dorkoosh, F.A.; Rouini, M.R.; Amini, M.; Sharifzadeh, M.; Boumi, S. Preparation and Pulsatile Release Evaluation of Teriparatide-Loaded Multilayer Implant Composed of Polyanhydride-Hydrogel Layers Using Spin Coating for the Treatment of Osteoporosis. J. Pharm. Innov. 2020, 16, 337–358. [Google Scholar] [CrossRef]
- Wang, X.; Guo, W.; Li, L.; Yu, F.; Li, J.; Liu, L.; Fang, B.; Xia, L. Photothermally Triggered Biomimetic Drug Delivery of Teriparatide via Reduced Graphene Oxide Loaded Chitosan Hydrogel for Osteoporotic Bone Regeneration. Chem. Eng. J. 2021, 413, 127413. [Google Scholar] [CrossRef]
- Altaani, B.M.; Almaaytah, A.M.; Dadou, S.; Alkhamis, K.; Daradka, M.H.; Hananeh, W. Oral Delivery of Teriparatide Using a Nanoemulsion System: Design, in Vitro and in Vivo Evaluation. Pharm. Res. 2020, 37, 80. [Google Scholar] [CrossRef]
- Eswaramoorthy, R.; Chang, C.C.; Wu, S.C.; Wang, G.J.; Chang, J.K.; Ho, M.L. Sustained Release of PTH(1-34) from PLGA Microspheres Suppresses Osteoarthritis Progression in Rats. Acta Biomater. 2012, 8, 2254–2262. [Google Scholar] [CrossRef] [PubMed]
- A Pilot Study on Controlled Release of PTH(1-34) from Encapsulated Poly(Lactic-Glycolic)Acid Microspheres. Available online: http://www.ors.org/Transactions/56/1227.pdf (accessed on 12 October 2022).
- Dave, J.R.; Dewle, A.M.; Mhaske, S.T.; Phulpagar, P.T.; Mathe, V.L.; More, S.E.; Khan, A.A.; Murthy, A.V.R.; Datar, S.S.; Jog, A.J.; et al. Hydroxyapatite Nanorods Loaded with Parathyroid Hormone (PTH) Synergistically Enhance the Net Formative Effect of PTH Anabolic Therapy. Nanomed. Nanotechnol. Biol. Med. 2019, 15, 218–230. [Google Scholar] [CrossRef] [PubMed]
- Jaji, A.Z.; Bakar, M.Z.B.A.; Mahmud, R.; Loqman, M.Y.; Hezmee, M.N.M.; Isa, T.; Wenliang, F.; Hammadi, N.I. Synthesis, Characterization, and Cytocompatibility of Potential Cockle Shell Aragonite Nanocrystals for Osteoporosis Therapy and Hormonal Delivery. Nanotechnol. Sci. Appl. 2017, 10, 23–33. [Google Scholar] [CrossRef] [PubMed] [Green Version]
- Narayanan, D.; Anitha, A.; Jayakumar, R.; Nair, S.V.; Chennazhi, K.P. Synthesis, Characterization and Preliminary in Vitro Evaluation of PTH 1-34 Loaded Chitosan Nanoparticles for Osteoporosis. J. Biomed. Nanotechnol. 2012, 8, 98–106. [Google Scholar] [CrossRef]
- Narayanan, D.; Anitha, A.; Jayakumar, R.; Chennazhi, K.P. PTH 1-34 Loaded Thiolated Chitosan Nanoparticles for Osteoporosis: Oral Bioavailability and Anabolic Effect on Primary Osteoblast Cells. J. Biomed. Nanotechnol. 2014, 10, 166–178. [Google Scholar] [CrossRef]
- Narayanan, D.; Anitha, A.; Jayakumar, R.; Chennazhi, K.P. In Vitro and in Vivo Evaluation of Osteoporosis Therapeutic Peptide PTH 1-34 Loaded PEGylated Chitosan Nanoparticles. Mol. Pharm. 2013, 10, 4159–4167. [Google Scholar] [CrossRef]
- Kristensen, M.; Diedrichsen, R.G.; Vetri, V.; Foderà, V.; Nielsen, H.M. Increased Carrier Peptide Stability through PH Adjustment Improves Insulin and PTH (1-34) Delivery In Vitro and In Vivo Rather than by Enforced Carrier Peptide-Cargo Complexation. Pharmaceutics 2020, 12, 993. [Google Scholar] [CrossRef]
- Bulbake, U.; Kommineni, N.; Bryszewska, M.; Ionov, M.; Khan, W. Cationic Liposomes for Co-Delivery of Paclitaxel and Anti-Plk1 SiRNA to Achieve Enhanced Efficacy in Breast Cancer. J. Drug Deliv. Sci. Technol. 2018, 48, 253–265. [Google Scholar] [CrossRef]
- Kommineni, N.; Paul, D.; Saka, R.; Khan, W.; Nanjappan, S. Stealth Liposomal Chemotherapeutic Agent for Triple Negative Breast Cancer with Improved Pharmacokinetics. Nanotheranostics 2022, 6, 424–435. [Google Scholar] [CrossRef]
- Akbarzadeh, A.; Rezaei-Sadabady, R.; Davaran, S.; Joo, S.W.; Zarghami, N.; Hanifehpour, Y.; Samiei, M.; Kouhi, M.; Nejati-Koshki, K. Liposome: Classification, Preparation, and Applications. Nanoscale Res. Lett. 2013, 8, 102. [Google Scholar] [CrossRef]
- Thapa Magar, K.; Boafo, G.F.; Li, X.; Chen, Z.; He, W. Liposome-Based Delivery of Biological Drugs. Chin. Chem. Lett. 2022, 33, 587–596. [Google Scholar] [CrossRef]
- Hofheinz, R.; Gnad-Vogt, S.; Beyer, U.; Hochhaus, A. Liposomal encapsulated anti-cancer drugs. Anti-Cancer Drugs 2005, 16, 691–707. [Google Scholar] [CrossRef] [PubMed]
- Bulbake, U.; Doppalapudi, S.; Kommineni, N.; Khan, W. Liposomal Formulations in Clinical Use: An Updated Review. Pharmaceutics 2017, 9, 12. [Google Scholar] [CrossRef] [PubMed]
- De Leo, V.; Milano, F.; Agostiano, A.; Catucci, L. Recent Advancements in Polymer/Liposome Assembly for Drug Delivery: From Surface Modifications to Hybrid Vesicles. Polymers 2021, 13, 1027. [Google Scholar] [CrossRef] [PubMed]
- Price, J.C. Handbook of Pharmaceutical Excipients, 5th ed.; Pharmaceutical Press: London, UK, 2005; pp. 545–550. [Google Scholar]
- Yamaoka, T.; Tabata, Y.; Ikada, Y. Distribution and Tissue Uptake of Poly(Ethylene Glycol) with Different Molecular Weights after Intravenous Administration to Mice. J. Pharm. Sci. 1994, 83, 601–606. [Google Scholar] [CrossRef]
- Dreborg, S.; Akerblom, E.B. Immunotherapy with monomethoxypolyethylene glycol modified allergens. Crit. Rev. Ther. Drug Carr. Syst. 1990, 6, 315–365. [Google Scholar]
- International Conference on Harmonisation of Technical Requirements for Registration of Pharmaceuticals for Human Use Pharmaceutical Development Q8(R2). Available online: https://database.ich.org/sites/default/files/Q8_R2_Guideline.pdf (accessed on 12 October 2022).
- Yu, L.X.; Amidon, G.; Khan, M.A.; Hoag, S.W.; Polli, J.; Raju, G.K.; Woodcock, J. Understanding Pharmaceutical Quality by Design. AAPS J. 2014, 16, 771. [Google Scholar] [CrossRef] [Green Version]
- Guidance for Industry Q11 Development and Manufacture of Drug Substances. Available online: https://www.fda.gov/media/80909/download (accessed on 12 October 2022).
- Salave, S.; Rana, D.; Benival, D. Encapsulation of Anabolic Peptide in Lipid Nano Vesicles for Osteoporosis. Curr. Protein Pept. Sci. 2022, 23, 495–503. [Google Scholar]
- ICH Guideline Q9 on Quality Risk Management. Available online: https://www.ema.europa.eu/en/documents/scientific-guideline/international-conference-harmonisation-technical-requirements-registration-pharmaceuticals-human-use_en-3.pdf (accessed on 12 October 2022).
- Design Space Considerations. Available online: http://qbdworks.com/wp-content/uploads/2014/06/Design-Space-Considerations-FDA-AAPS-2012.pdf (accessed on 12 October 2022).
- Liposome Drug Products: Chemistry, Manufacturing, and Controls; Human Pharmacokinetics and Bioavailability; and Labeling Documentation. Available online: https://www.fda.gov/regulatory-information/search-fda-guidance-documents/liposome-drug-products-chemistry-manufacturing-and-controls-human-pharmacokinetics-and (accessed on 12 October 2022).
- Barbălată, C.I.; Tomuță, I.; Achim, M.; Boșca, A.B.; Cherecheș, G.; Sorițău, O.; Porfire, A.S. Application of the QbD Approach in the Development of a Liposomal Formulation with EGCG. J. Pharm. Innov. 2021, 7, 867–880. [Google Scholar] [CrossRef]
- Danaei, M.; Dehghankhold, M.; Ataei, S.; Davarani, F.H.; Javanmard, R.; Dokhani, A.; Khorasani, S.; Mozafari, M.R. Impact of Particle Size and Polydispersity Index on the Clinical Applications of Lipidic Nanocarrier Systems. Pharmaceutics 2018, 10, 57. [Google Scholar] [CrossRef] [Green Version]
- Smith, M.C.; Crist, R.M.; Clogston, J.D.; McNeil, S.E. Zeta Potential: A Case Study of Cationic, Anionic, and Neutral Liposomes. Anal. Bioanal. Chem. 2017, 409, 5779–5787. [Google Scholar] [CrossRef] [PubMed]
- Salave, S.; Jain, S.; Shah, R.; Benival, D. Quantification of Anti-Osteoporotic Anabolic Peptide in Stealth Lipid Nanovesicles Through Validated RP-HPLC Method. J. AOAC Int. 2022. [Google Scholar] [CrossRef] [PubMed]
- Sadeghi, N.; Deckers, R.; Ozbakir, B.; Akthar, S.; Kok, R.J.; Lammers, T.; Storm, G. Influence of Cholesterol Inclusion on the Doxorubicin Release Characteristics of Lysolipid-Based Thermosensitive Liposomes. Int. J. Pharm. 2018, 548, 778–782. [Google Scholar] [CrossRef]
- Blair, H.C.; Larrouture, Q.C.; Li, Y.; Lin, H.; Beer-Stoltz, D.; Liu, L.; Tuan, R.S.; Robinson, L.J.; Schlesinger, P.H.; Nelson, D.J. Osteoblast Differentiation and Bone Matrix Formation In Vivo and In Vitro. Tissue Eng. Part B. Rev. 2017, 23, 268. [Google Scholar] [CrossRef] [PubMed]


| QTPPs | ||||
|---|---|---|---|---|
| QTPP Element | Target | Justification | Ref | |
| Dosage form | Ready to use | Patient convenience and cost consideration | ||
| Dosage design | Liposomes | Scale-up feasibility as well as high safety of excipients used in manufacturing of liposomes | ||
| Drug product quality attributes | Drug content (%EE) | >30% | A maximum %EE is associated with minimum drug loss during the manufacturing process which ultimately reduces the production cost of formulation | [37] |
| Size | <200 nm | A smaller vesicle size is desired to escape from the RES system upon systemic administration of the formulation | [38] | |
| >−30 mV/+30 mV | >−30 mV/+30 mV | Higher or lesser values impart the repulsion of vesicles from each other and hence improve the stability of the formulation | [39] | |
| Parameters | Drug Product CQA’s | |||
|---|---|---|---|---|
| %EE | Particle Size | Zeta Potential | ||
| CMAs | Drug concentration | High | Medium | Medium |
| Lipid concentration | High | High | Medium | |
| Cholesterol concentration | High | High | Medium | |
| CPPs | Stirring rate | High | High | Medium |
| Stirring time | Medium | Medium | Low | |
| CMAs/CPPs | Values | Responses | Target | Predicted Value | Experimental Value | Residual Values (%) |
|---|---|---|---|---|---|---|
| Lipid concentration (mM) | 60.25 ± 11.64 | Y1 | <200 nm | 142.93 ± 2.49 | 147.76 ± 2.14 | −3.26 |
| Cholesterol concentration (mM) | 9.33 ± 2.57 | Y2 | >30% | 70.63 ± 6.51 | 69.18 ± 3.62 | 2.05 |
Publisher’s Note: MDPI stays neutral with regard to jurisdictional claims in published maps and institutional affiliations. |
© 2022 by the authors. Licensee MDPI, Basel, Switzerland. This article is an open access article distributed under the terms and conditions of the Creative Commons Attribution (CC BY) license (https://creativecommons.org/licenses/by/4.0/).
Share and Cite
Salave, S.; Rana, D.; Kumar, H.; Kommineni, N.; Benival, D. Anabolic Peptide-Enriched Stealth Nanoliposomes for Effective Anti-Osteoporotic Therapy. Pharmaceutics 2022, 14, 2417. https://doi.org/10.3390/pharmaceutics14112417
Salave S, Rana D, Kumar H, Kommineni N, Benival D. Anabolic Peptide-Enriched Stealth Nanoliposomes for Effective Anti-Osteoporotic Therapy. Pharmaceutics. 2022; 14(11):2417. https://doi.org/10.3390/pharmaceutics14112417
Chicago/Turabian StyleSalave, Sagar, Dhwani Rana, Hemant Kumar, Nagavendra Kommineni, and Derajram Benival. 2022. "Anabolic Peptide-Enriched Stealth Nanoliposomes for Effective Anti-Osteoporotic Therapy" Pharmaceutics 14, no. 11: 2417. https://doi.org/10.3390/pharmaceutics14112417