
Molecular Imaging of Ultrasound-Mediated Blood-Brain Barrier Disruption in a Mouse Orthotopic Glioblastoma Model

 ,
,  , , , and
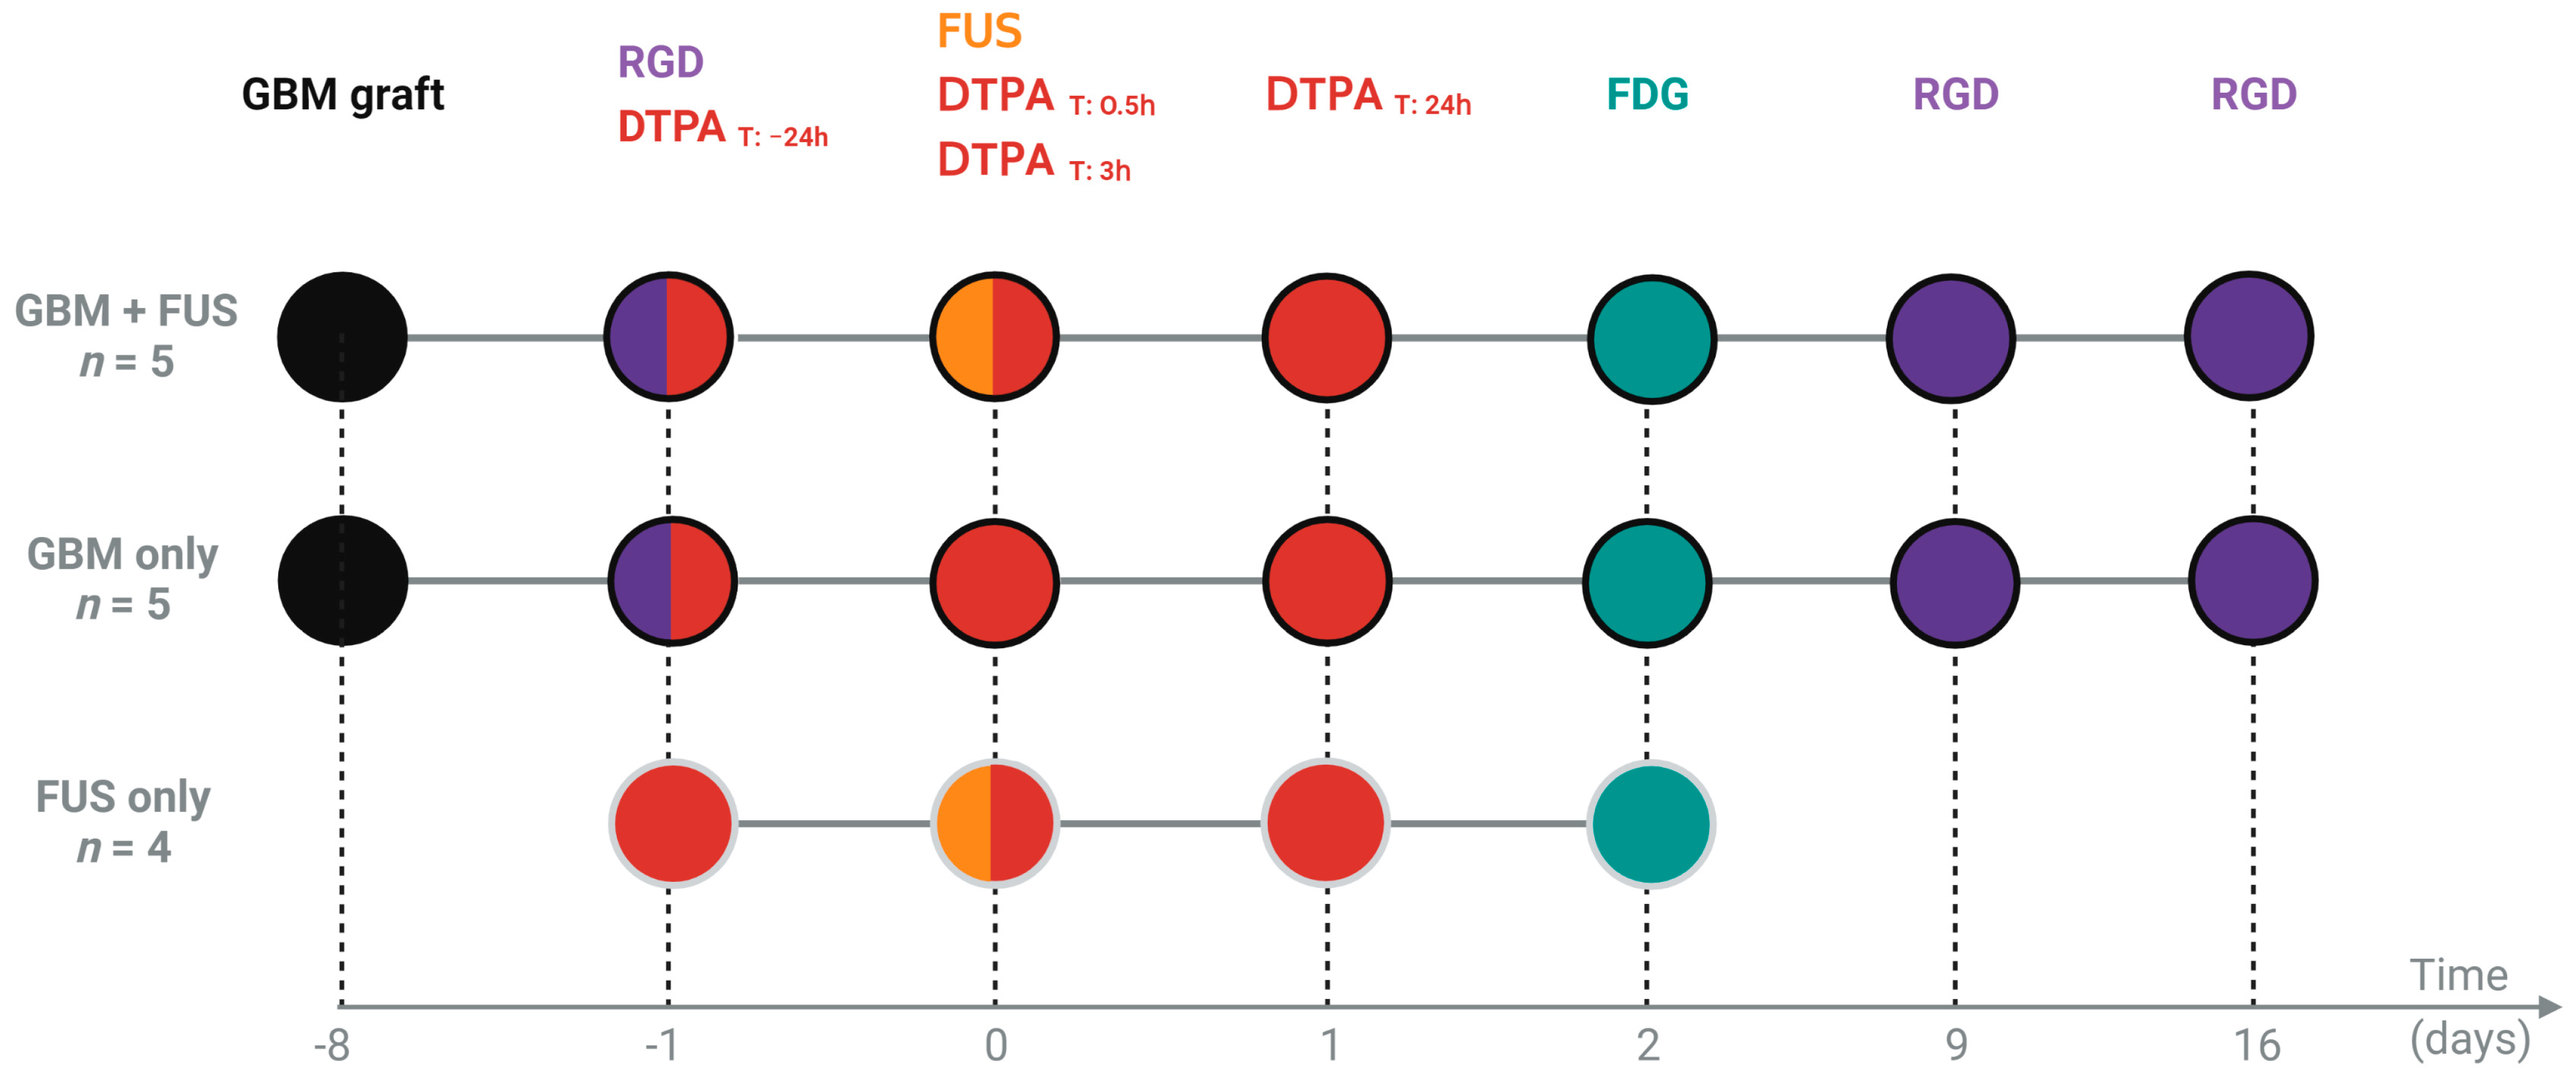
Abstract
:1. Introduction
2. Materials and Methods
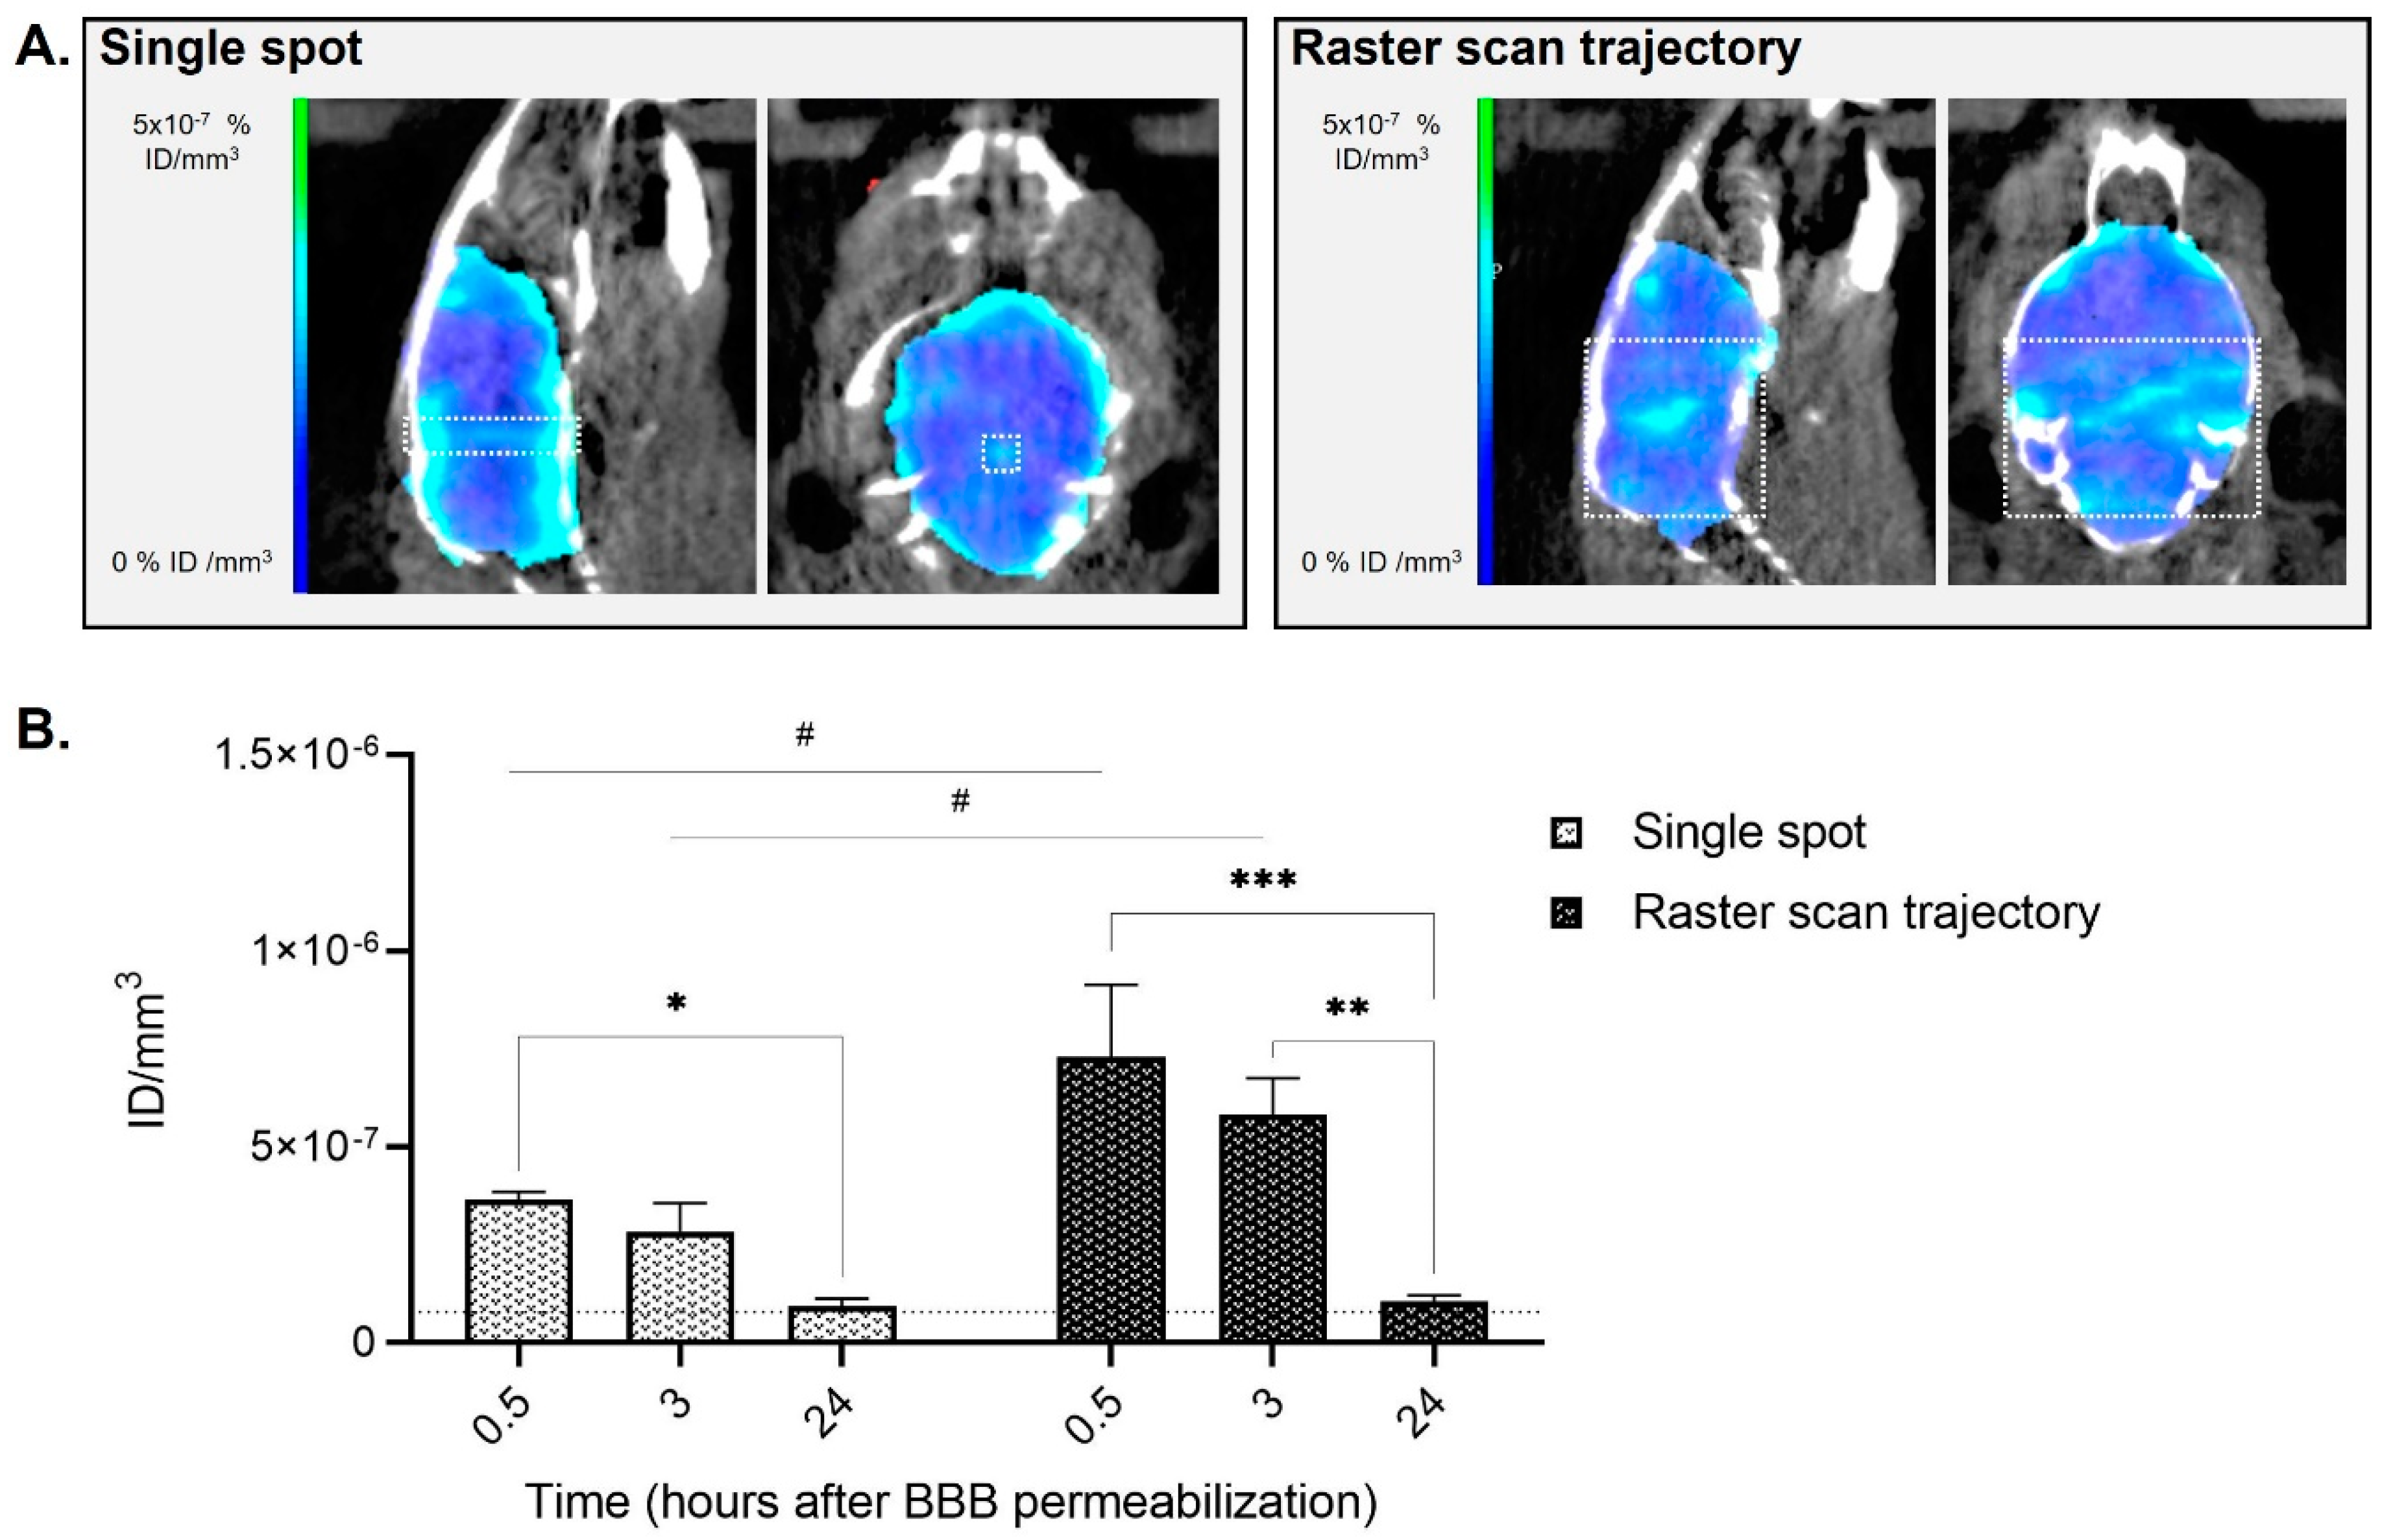
2.1. Pilot Study on Healthy Animals
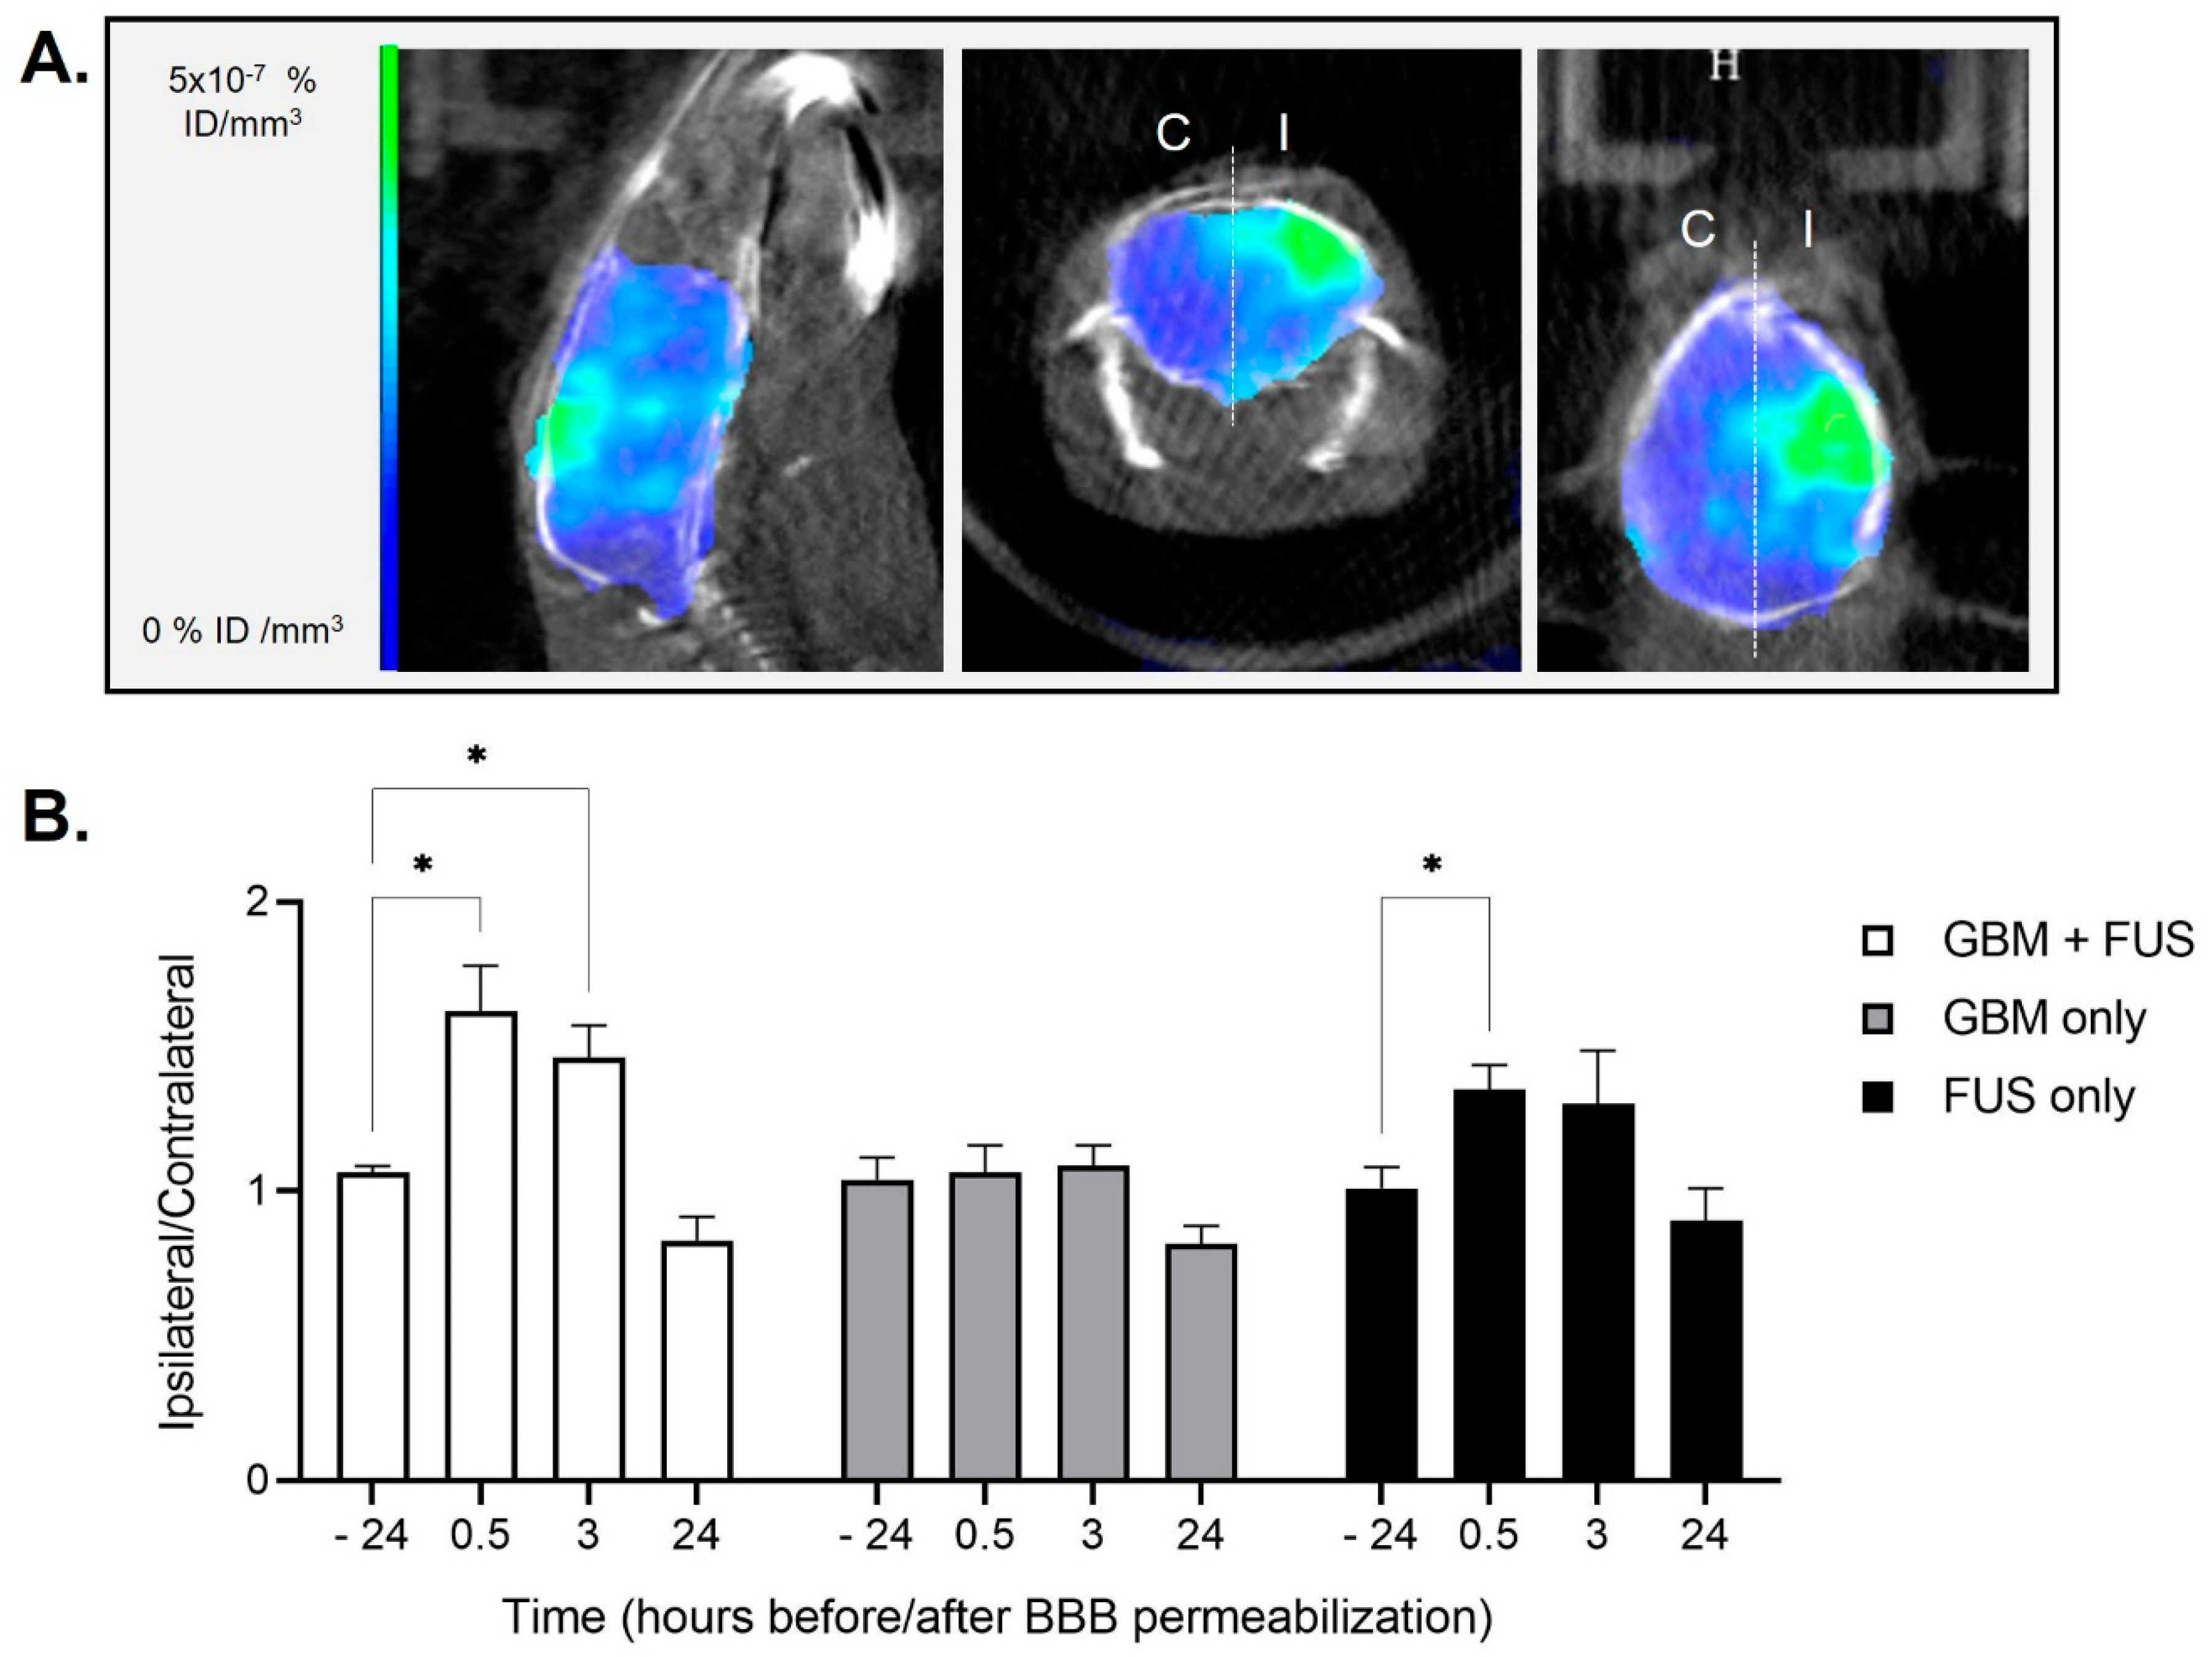
2.2. Hemispheric Blood-Brain Barrier Permeabilization on Healthy and Tumor-Bearing Mice
2.2.1. Glioma Cell Cultures
2.2.2. Orthotopic U-87 MG Human Glioblastoma Tumor Model
2.2.3. Blood-Brain Barrier Permeabilization Protocol
2.3. Imaging
2.3.1. Single Photon Emission Computed Tomography (SPECT) Imaging
2.3.2. Positron Emission Tomography (PET) Imaging
3. Results and Discussion
3.1. Pilot Study on Healthy Animals
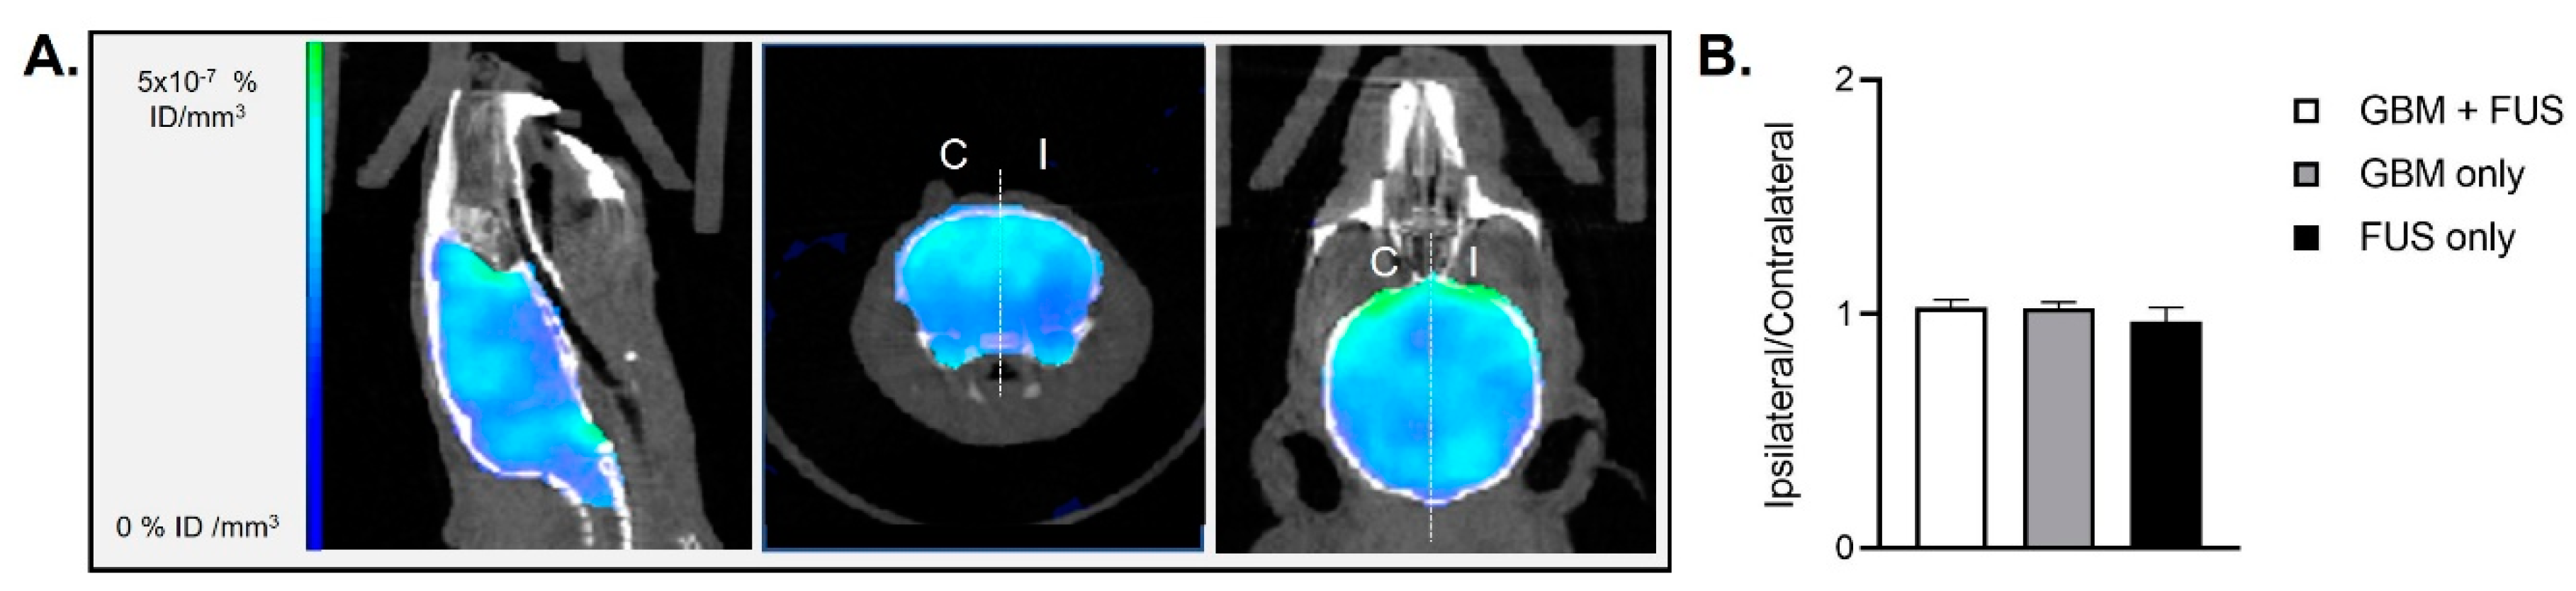
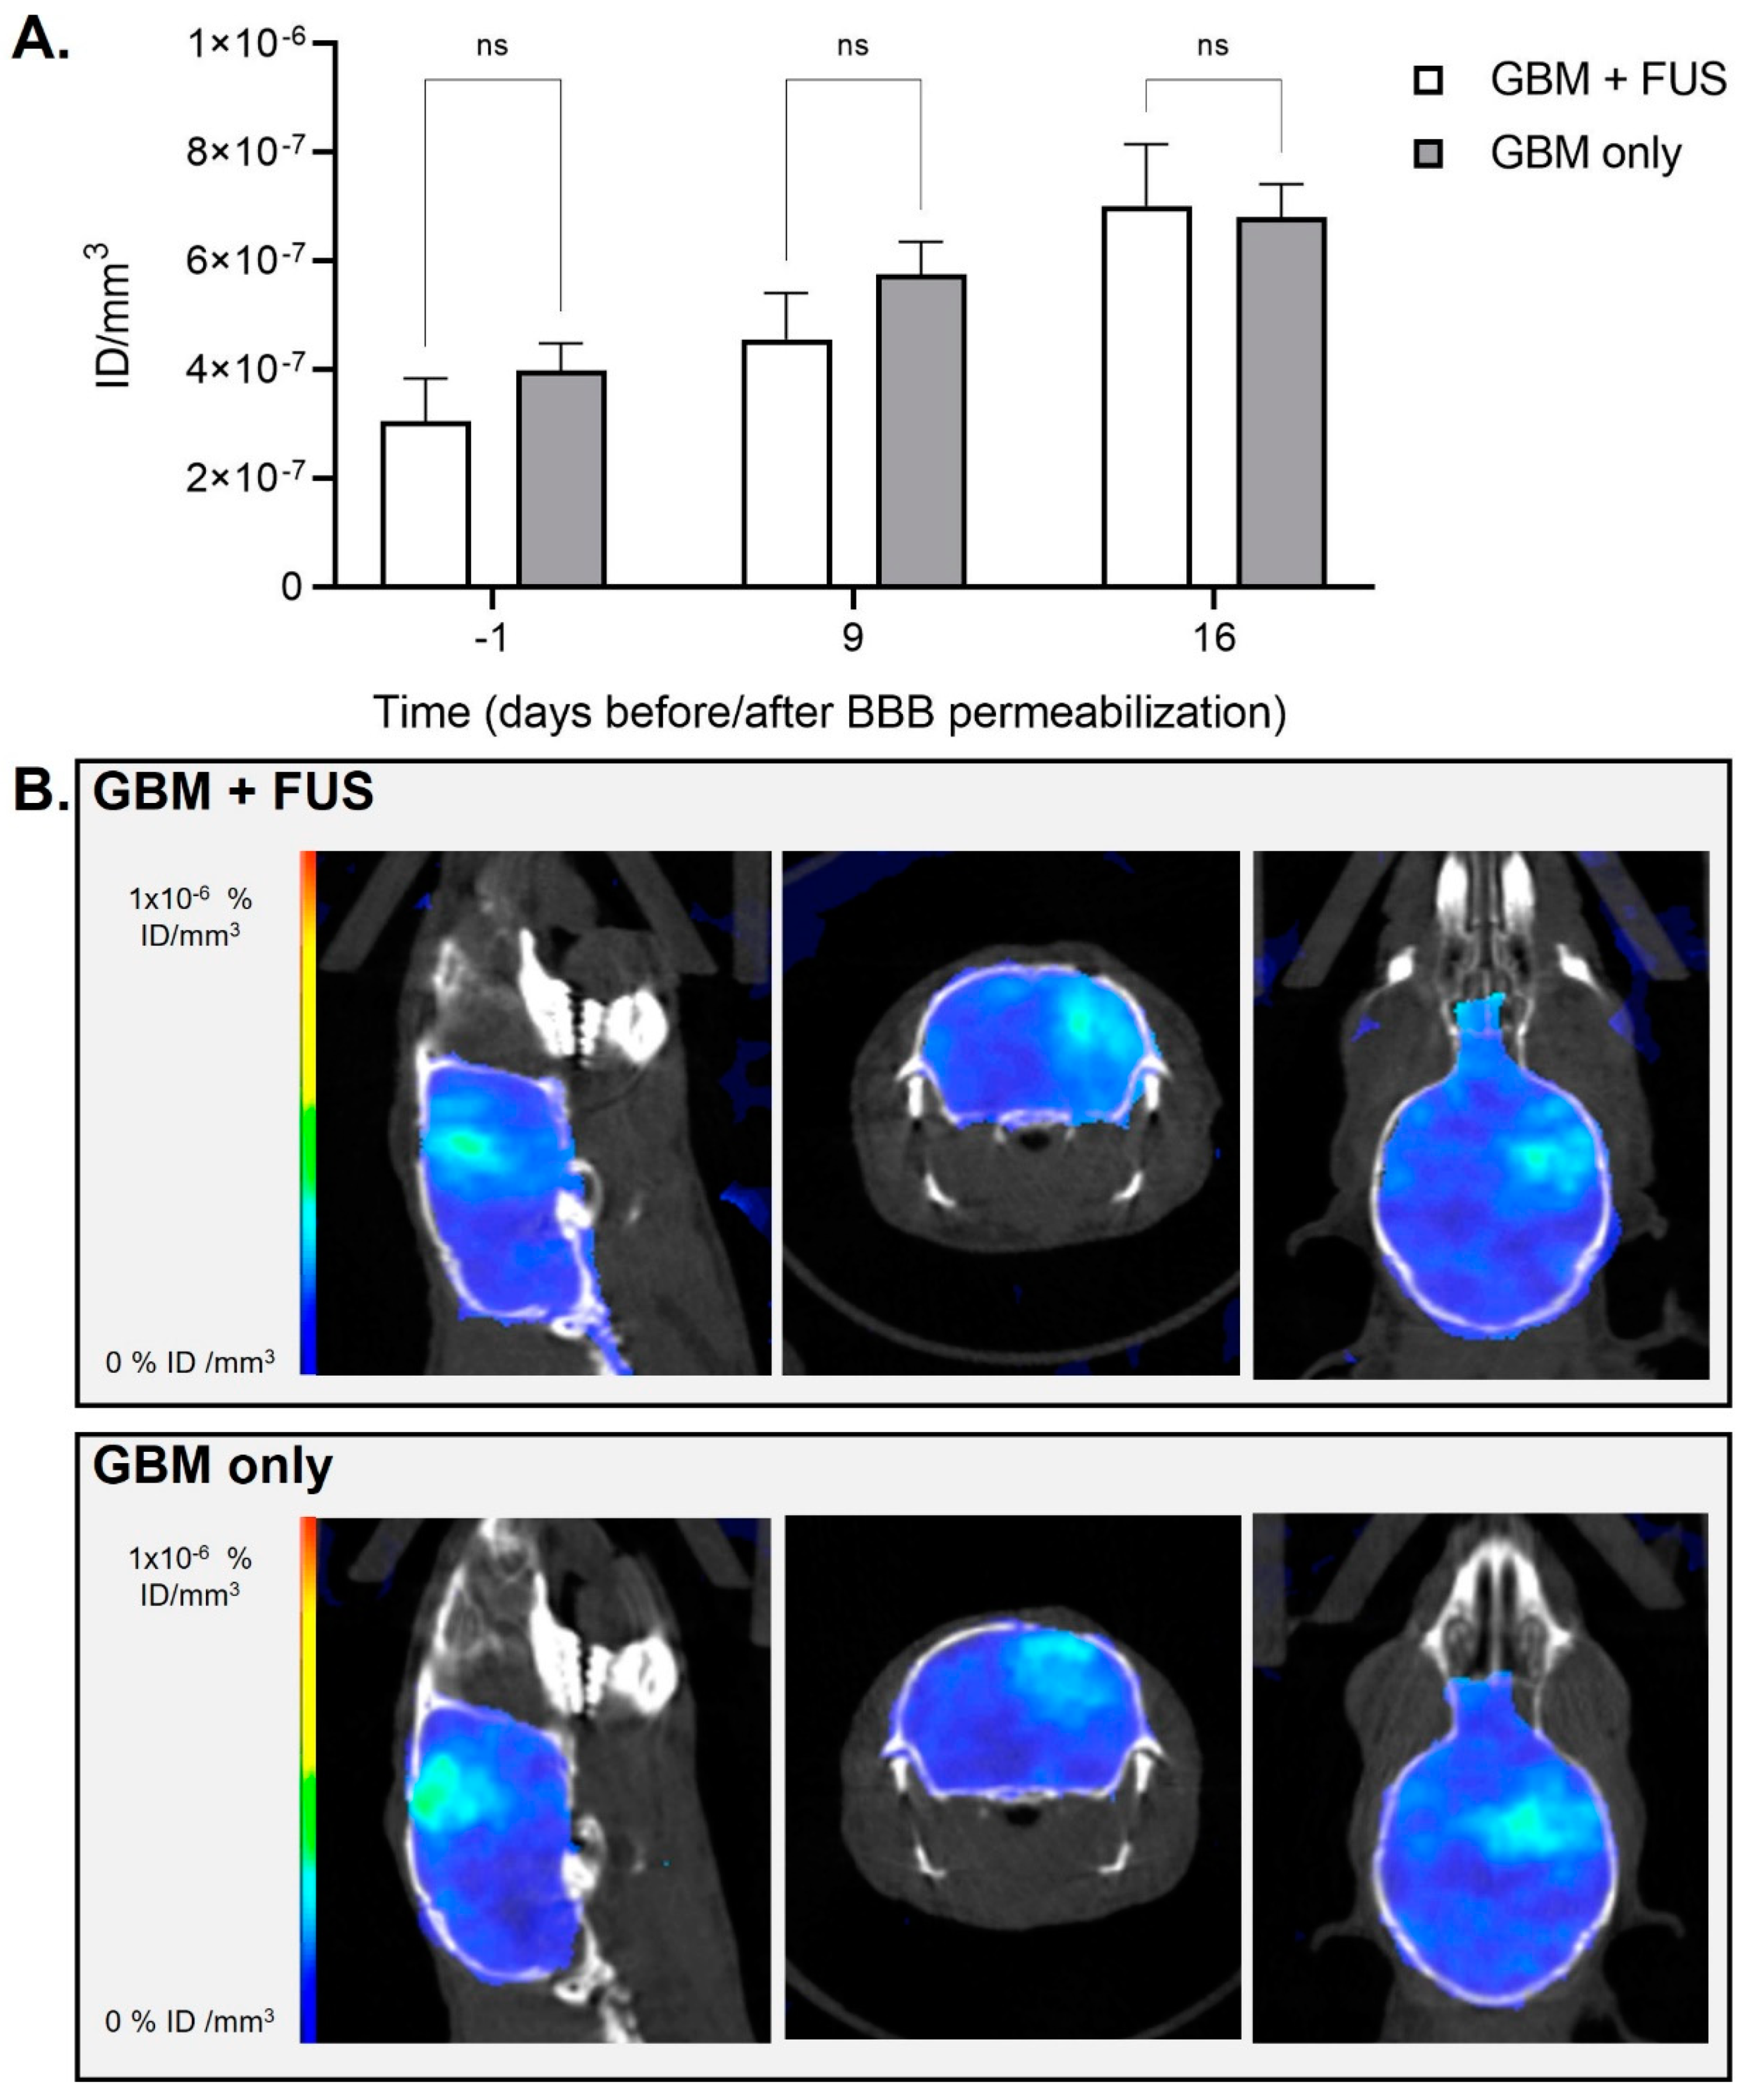
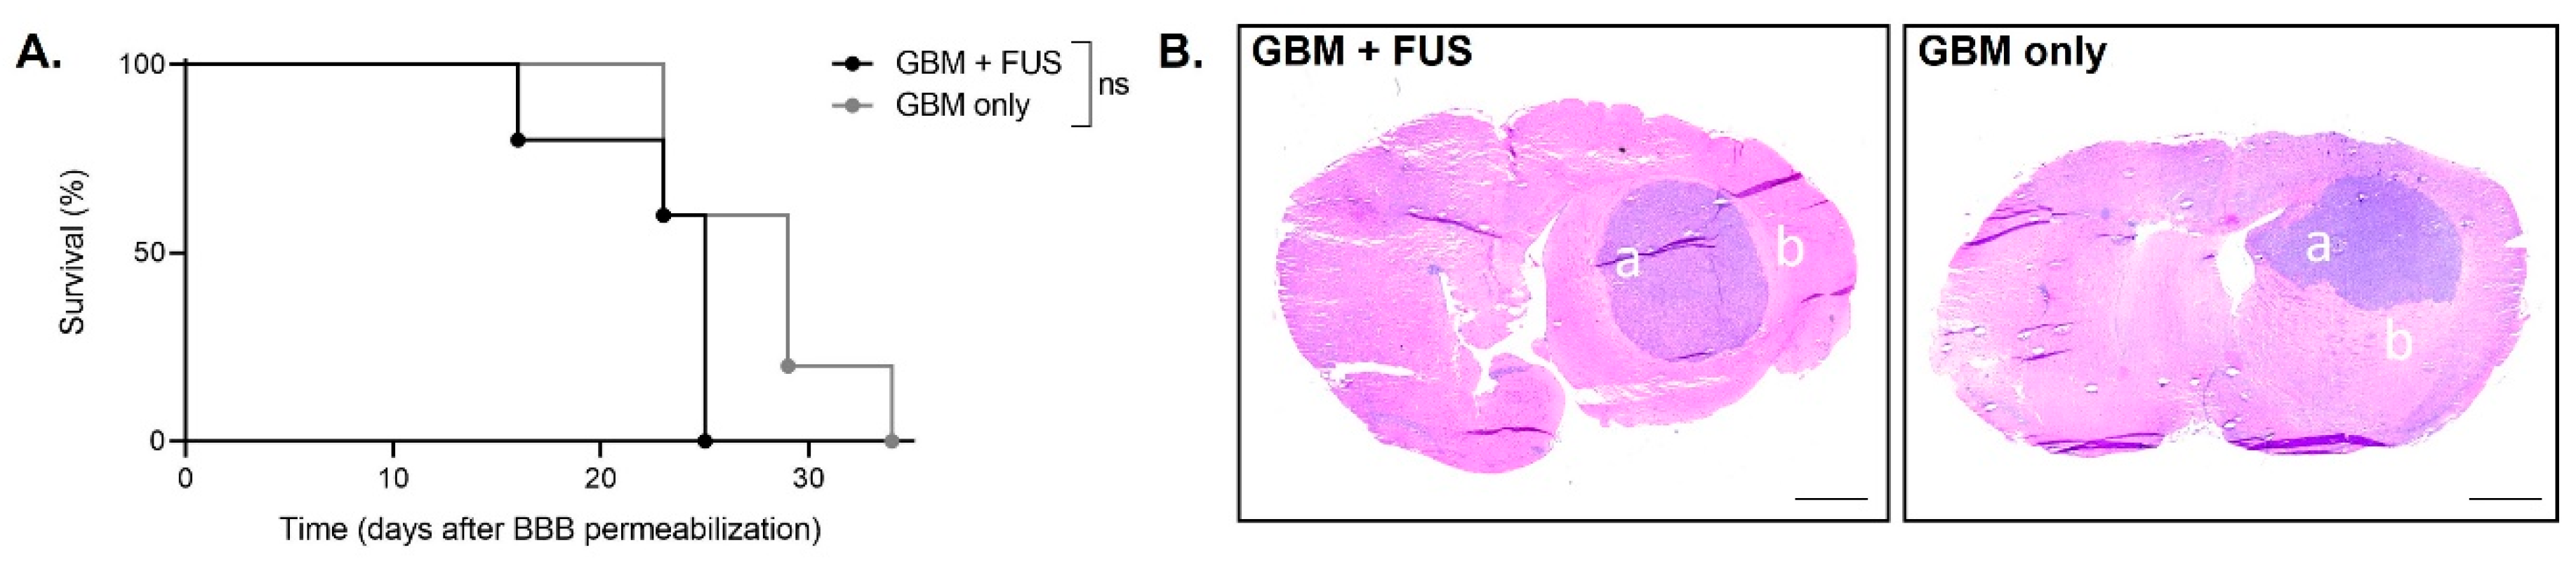
3.2. Hemispheric Blood-Brain Barrier Permeabilization and Imaging Study on Healthy and Tumor-Bearing Animals
4. Conclusions
Supplementary Materials
Author Contributions
Funding
Institutional Review Board Statement
Informed Consent Statement
Data Availability Statement
Conflicts of Interest
References
- Aldape, K.; Brindle, K.M.; Chesler, L.; Chopra, R.; Gajjar, A.; Gilbert, M.R.; Gottardo, N.; Gutmann, D.H.; Hargrave, D.; Holland, E.C.; et al. Challenges to curing primary brain tumours. Nat. Rev. Clin. Oncol. 2019, 16, 509–520. [Google Scholar] [CrossRef] [PubMed] [Green Version]
- Daneman, R.; Prat, A. The blood-brain barrier. Cold Spring Harb. Perspect. Biol. 2015, 7, a020412. [Google Scholar] [CrossRef] [Green Version]
- Begley, D.J. Delivery of therapeutic agents to the central nervous system: The problems and the possibilities. Pharmacol. Ther. 2004, 104, 29–45. [Google Scholar] [CrossRef]
- Pardridge, W.M. Why is the global CNS pharmaceutical market so under-penetrated? Drug Discov. Today 2002, 7, 5–7. [Google Scholar] [CrossRef]
- De Boer, A.G.; Gaillard, P.J. Strategies to improve drug delivery across the blood-brain barrier. Clin. Pharmacokinet. 2007, 46, 553–576. [Google Scholar] [CrossRef] [PubMed]
- De Boer, A.G.; Gaillard, P.J. Drug targeting to the brain. Annu. Rev. Pharmacol. Toxicol. 2007, 47, 323–355. [Google Scholar] [CrossRef]
- Paris-Robidas, S.; Brouard, D.; Emond, V.; Parent, M.; Calon, F. Internalization of targeted quantum dots by brain capillary endothelial cells in vivo. J. Cereb. Blood Flow Metab. Off. J. Int. Soc. Cereb. Blood Flow Metab. 2016, 36, 731–742. [Google Scholar] [CrossRef] [Green Version]
- Snipstad, S.; Vikedal, K.; Maardalen, M.; Kurbatskaya, A.; Sulheim, E.; Davies, C.D.L. Ultrasound and microbubbles to beat barriers in tumors: Improving delivery of nanomedicine. Adv. Drug Deliv. Rev. 2021, 177, 113847. [Google Scholar] [CrossRef]
- Meng, Y.; Suppiah, S.; Mithani, K.; Solomon, B.; Schwartz, M.L.; Lipsman, N. Current and emerging brain applications of MR-guided focused ultrasound. J. Ther. Ultrasound 2017, 5, 26. [Google Scholar] [CrossRef] [Green Version]
- Lipsman, N.; Meng, Y.; Bethune, A.J.; Huang, Y.; Lam, B.; Masellis, M.; Herrmann, N.; Heyn, C.; Aubert, I.; Boutet, A.; et al. Blood-brain barrier opening in Alzheimer’s disease using MR-guided focused ultrasound. Nat. Commun. 2018, 9, 2336. [Google Scholar] [CrossRef]
- Idbaih, A.; Canney, M.; Belin, L.; Desseaux, C.; Vignot, A.; Bouchoux, G.; Asquier, N.; Law-Ye, B.; Leclercq, D.; Bissery, A.; et al. Safety and Feasibility of Repeated and Transient Blood-Brain Barrier Disruption by Pulsed Ultrasound in Patients with Recurrent Glioblastoma. Clin. Cancer Res. Off. J. Am. Assoc. Cancer Res. 2019, 25, 3793–3801. [Google Scholar] [CrossRef] [Green Version]
- Mainprize, T.; Lipsman, N.; Huang, Y.; Meng, Y.; Bethune, A.; Ironside, S.; Heyn, C.; Alkins, R.; Trudeau, M.; Sahgal, A.; et al. Blood-Brain Barrier Opening in Primary Brain Tumors with Non-invasive MR-Guided Focused Ultrasound: A Clinical Safety and Feasibility Study. Sci. Rep. 2019, 9, 321. [Google Scholar] [CrossRef] [PubMed] [Green Version]
- Park, S.H.; Kim, M.J.; Jung, H.H.; Chang, W.S.; Choi, H.S.; Rachmilevitch, I.; Zadicario, E.; Chang, J.W. One-Year Outcome of Multiple Blood-Brain Barrier Disruptions With Temozolomide for the Treatment of Glioblastoma. Front. Oncol. 2020, 10, 1663. [Google Scholar] [CrossRef]
- Brighi, C.; Salimova, E.; de Veer, M.; Puttick, S.; Egan, G. Translation of focused ultrasound for blood-brain barrier opening in glioma. J. Control. Release Off. J. Control Release Soc. 2022, 345, 443–463. [Google Scholar] [CrossRef]
- Marty, B.; Larrat, B.; Van Landeghem, M.; Robic, C.; Robert, P.; Port, M.; Le Bihan, D.; Pernot, M.; Tanter, M.; Lethimonnier, F.; et al. Dynamic study of blood-brain barrier closure after its disruption using ultrasound: A quantitative analysis. J. Cereb. Blood Flow Metab. Off. J. Int. Soc. Cereb. Blood Flow Metab. 2012, 32, 1948–1958. [Google Scholar] [CrossRef]
- Alexandrov, A.V.; Ehrlich, L.E.; Bladin, C.F.; Black, S.E. Clinical significance of increased uptake of HMPAO on brain SPECT scans in acute stroke. J. Neuroimag. Off. J. Am. Soc. Neuroimag. 1996, 6, 150–155. [Google Scholar] [CrossRef]
- Masdeu, J.C.; Arbizu, J. Brain single photon emission computed tomography: Technological aspects and clinical applications. Semin. Neurol. 2008, 28, 423–434. [Google Scholar] [CrossRef]
- Arif, W.M.; Elsinga, P.H.; Gasca-Salas, C.; Versluis, M.; Martínez-Fernández, R.; Dierckx, R.A.J.O.; Borra, R.J.H.; Luurtsema, G. Focused ultrasound for opening blood-brain barrier and drug delivery monitored with positron emission tomography. J. Control Release 2020, 324, 303–316. [Google Scholar] [CrossRef]
- Yang, F.Y.; Wang, H.E.; Liu, R.S.; Teng, M.C.; Li, J.J.; Lu, M.; Wei, M.C.; Wong, T.T. Pharmacokinetic analysis of 111 in-labeled liposomal Doxorubicin in murine glioblastoma after blood-brain barrier disruption by focused ultrasound. PLoS ONE 2012, 7, e45468. [Google Scholar] [CrossRef]
- Tran, V.L.; Novell, A.; Tournier, N.; Gerstenmayer, M.; Schweitzer-Chaput, A.; Mateos, C.; Jego, B.; Bouleau, A.; Nozach, H.; Winkeler, A.; et al. Impact of blood-brain barrier permeabilization induced by ultrasound associated to microbubbles on the brain delivery and kinetics of cetuximab: An immunoPET study using (89)Zr-cetuximab. J. Control Release Off. J. Control Release Soc. 2020, 328, 304–312. [Google Scholar] [CrossRef] [PubMed]
- Lin, K.J.; Liu, H.L.; Hsu, P.H.; Chung, Y.H.; Huang, W.C.; Chen, J.C.; Wey, S.P.; Yen, T.C.; Hsiao, I.T. Quantitative micro-SPECT/CT for detecting focused ultrasound-induced blood-brain barrier opening in the rat. Nucl. Med. Biol. 2009, 36, 853–861. [Google Scholar] [CrossRef]
- Bordonne, M.; Chawki, M.B.; Doyen, M.; Kas, A.; Guedj, E.; Tyvaert, L.; Verger, A. Brain (18)F-FDG PET for the diagnosis of autoimmune encephalitis: A systematic review and a meta-analysis. Eur. J. Nucl. Med. Mol. Imag. 2021, 48, 3847–3858. [Google Scholar] [CrossRef] [PubMed]
- Crabbé, M.; Van der Perren, A.; Kounelis, S.; Lavreys, T.; Bormans, G.; Baekelandt, V.; Casteels, C.; Van Laere, K. Temporal changes in neuroinflammation and brain glucose metabolism in a rat model of viral vector-induced α-synucleinopathy. Exp. Neurol. 2019, 320, 112964. [Google Scholar] [CrossRef] [PubMed]
- Zhao, Z.Q.; Ji, S.; Li, X.Y.; Fang, W.; Liu, S. (68)Ga-labeled dimeric and trimeric cyclic RGD peptides as potential PET radiotracers for imaging gliomas. Appl. Radiat. Isot. Incl. Data Instrum. Methods Use Agric. Ind. Med. 2019, 148, 168–177. [Google Scholar] [CrossRef]
- Danhier, F.; Messaoudi, K.; Lemaire, L.; Benoit, J.P.; Lagarce, F. Combined anti-Galectin-1 and anti-EGFR siRNA-loaded chitosan-lipid nanocapsules decrease temozolomide resistance in glioblastoma: In vivo evaluation. Int. J. Pharm. 2015, 481, 154–161. [Google Scholar] [CrossRef]
- Felix, M.S.; Borloz, E.; Metwally, K.; Dauba, A.; Larrat, B.; Matagne, V.; Ehinger, Y.; Villard, L.; Novell, A.; Mensah, S.; et al. Ultrasound-Mediated Blood-Brain Barrier Opening Improves Whole Brain Gene Delivery in Mice. Pharmaceutics 2021, 13, 1245. [Google Scholar] [CrossRef]
- Choi, J.J.; Pernot, M.; Small, S.A.; Konofagou, E.E. Noninvasive, transcranial and localized opening of the blood-brain barrier using focused ultrasound in mice. Ultrasound Med. Biol. 2007, 33, 95–104. [Google Scholar] [CrossRef]
- Hugon, G.; Goutal, S.; Dauba, A.; Breuil, L.; Larrat, B.; Winkeler, A.; Novell, A.; Tournier, N. [(18)F]2-Fluoro-2-deoxy-sorbitol PET Imaging for Quantitative Monitoring of Enhanced Blood-Brain Barrier Permeability Induced by Focused Ultrasound. Pharmaceutics 2021, 13, 1752. [Google Scholar] [CrossRef]
- Gerstenmayer, M.; Fellah, B.; Magnin, R.; Selingue, E.; Larrat, B. Acoustic Transmission Factor through the Rat Skull as a Function of Body Mass, Frequency and Position. Ultrasound Med. Biol. 2018, 44, 2336–2344. [Google Scholar] [CrossRef] [PubMed] [Green Version]
- Magnin, R.; Rabusseau, F.; Salabartan, F.; Mériaux, S.; Aubry, J.F.; Le Bihan, D.; Dumont, E.; Larrat, B. Magnetic resonance-guided motorized transcranial ultrasound system for blood-brain barrier permeabilization along arbitrary trajectories in rodents. J. Ther. Ultrasound 2015, 3, 22. [Google Scholar] [CrossRef]
- Novell, A.; Kamimura, H.A.S.; Cafarelli, A.; Gerstenmayer, M.; Flament, J.; Valette, J.; Agou, P.; Conti, A.; Selingue, E.; Aron Badin, R.; et al. A new safety index based on intrapulse monitoring of ultra-harmonic cavitation during ultrasound-induced blood-brain barrier opening procedures. Sci. Rep. 2020, 10, 10088. [Google Scholar] [CrossRef] [PubMed]
- Metwally, K.; Bastiancich, C.; Correard, F.; Novell, A.; Fernandez, S.; Guillet, B.; Larrat, B.; Mensah, S.; Estève, M.A.; Da Silva, A. Development of a multi-functional preclinical device for the treatment of glioblastoma. Biomed. Opt. Express 2021, 12, 2264–2279. [Google Scholar] [CrossRef]
- McDannold, N.; Zhang, Y.; Vykhodtseva, N. Blood-brain barrier disruption and vascular damage induced by ultrasound bursts combined with microbubbles can be influenced by choice of anesthesia protocol. Ultrasound Med. Biol. 2011, 37, 1259–1270. [Google Scholar] [CrossRef] [PubMed] [Green Version]
- McDannold, N.; Zhang, Y.; Vykhodtseva, N. The Effects of Oxygen on Ultrasound-Induced Blood-Brain Barrier Disruption in Mice. Ultrasound Med. Biol. 2017, 43, 469–475. [Google Scholar] [CrossRef] [PubMed] [Green Version]
- Larrat, B.; Pernot, M.; Aubry, J.F.; Dervishi, E.; Sinkus, R.; Seilhean, D.; Marie, Y.; Boch, A.L.; Fink, M.; Tanter, M. MR-guided transcranial brain HIFU in small animal models. Phys. Med. Biol. 2010, 55, 365–388. [Google Scholar] [CrossRef] [Green Version]
- Albrecht, D.S.; Granziera, C.; Hooker, J.M.; Loggia, M.L. In Vivo Imaging of Human Neuroinflammation. ACS Chem. Neurosci. 2016, 7, 470–483. [Google Scholar] [CrossRef] [Green Version]
- Roesler, R.; Dini, S.A.; Isolan, G.R. Neuroinflammation and immunoregulation in glioblastoma and brain metastases: Recent developments in imaging approaches. Clin. Exp. Immunol. 2021, 206, 314–324. [Google Scholar] [CrossRef]
- Candelario-Jalil, E.; Dijkhuizen, R.M.; Magnus, T. Neuroinflammation, Stroke, Blood-Brain Barrier Dysfunction, and Imaging Modalities. Stroke 2022, 53, 1473–1486. [Google Scholar] [CrossRef]
- Wunder, A.; Klohs, J.; Dirnagl, U. Non-invasive visualization of CNS inflammation with nuclear and optical imaging. Neuroscience 2009, 158, 1161–1173. [Google Scholar] [CrossRef]
- Brendel, M.; Focke, C.; Blume, T.; Peters, F.; Deussing, M.; Probst, F.; Jaworska, A.; Overhoff, F.; Albert, N.; Lindner, S.; et al. Time Courses of Cortical Glucose Metabolism and Microglial Activity Across the Life Span of Wild-Type Mice: A PET Study. J. Nucl. Med. Off. Publ. Soc. Nucl. Med. 2017, 58, 1984–1990. [Google Scholar] [CrossRef]
- Doroudinia, A.; Safarpour Lima, B.; Bakhshayesh Karam, M.; Ghadimi, N.; Yousefi, F. Interesting Manifestation of Autoimmune Encephalitis on FDG PET Scan. Clin. Nucl. Med. 2022, 47, e190–e191. [Google Scholar] [CrossRef] [PubMed]
- Yang, Z.; Zan, Y.; Zheng, X.; Hai, W.; Chen, K.; Huang, Q.; Xu, Y.; Peng, J. Dynamic FDG-PET Imaging to Differentiate Malignancies from Inflammation in Subcutaneous and In Situ Mouse Model for Non-Small Cell Lung Carcinoma (NSCLC). PLoS ONE 2015, 10, e0139089. [Google Scholar] [CrossRef]
- Zhuang, H.; Pourdehnad, M.; Lambright, E.S.; Yamamoto, A.J.; Lanuti, M.; Li, P.; Mozley, P.D.; Rossman, M.D.; Albelda, S.M.; Alavi, A. Dual time point 18F-FDG PET imaging for differentiating malignant from inflammatory processes. J. Nucl. Med. Off. Publ. Soc. Nucl. Med. 2001, 42, 1412–1417. [Google Scholar]
- Verhoeven, J.; Baguet, T.; Piron, S.; Pauwelyn, G.; Bouckaert, C.; Descamps, B.; Raedt, R.; Vanhove, C.; De Vos, F.; Goethals, I. 2-[18F]FELP, a novel LAT1-specific PET tracer, for the discrimination between glioblastoma, radiation necrosis and inflammation. Nucl. Med. Biol. 2020, 82–83, 9–16. [Google Scholar] [CrossRef] [PubMed]
- Yang, F.Y.; Wang, H.E.; Lin, G.L.; Teng, M.C.; Lin, H.H.; Wong, T.T.; Liu, R.S. Micro-SPECT/CT-based pharmacokinetic analysis of 99mTc-diethylenetriaminepentaacetic acid in rats with blood-brain barrier disruption induced by focused ultrasound. J. Nucl. Med. Off. Publ. Soc. Nucl. Med. 2011, 52, 478–484. [Google Scholar] [CrossRef] [Green Version]
- Yang, F.Y.; Chang, W.Y.; Chen, J.C.; Lee, L.C.; Hung, Y.S. Quantitative assessment of cerebral glucose metabolic rates after blood-brain barrier disruption induced by focused ultrasound using FDG-MicroPET. NeuroImage 2014, 90, 93–98. [Google Scholar] [CrossRef]
- Okada, M.; Kikuchi, T.; Okamura, T.; Ikoma, Y.; Tsuji, A.B.; Wakizaka, H.; Kamakura, T.; Aoki, I.; Zhang, M.R.; Kato, K. In-vivo imaging of blood-brain barrier permeability using positron emission tomography with 2-amino-[3-11C]isobutyric acid. Nucl. Med. Commun. 2015, 36, 1239–1248. [Google Scholar] [CrossRef]
- Li, Z.B.; Wu, Z.; Cao, Q.; Dick, D.W.; Tseng, J.R.; Gambhir, S.S.; Chen, X. The synthesis of 18F-FDS and its potential application in molecular imaging. Mol. Imaging Biol. 2008, 10, 92–98. [Google Scholar] [CrossRef]
- Sultan, D.; Ye, D.; Heo, G.S.; Zhang, X.; Luehmann, H.; Yue, Y.; Detering, L.; Komarov, S.; Taylor, S.; Tai, Y.C.; et al. Focused Ultrasound Enabled Trans-Blood Brain Barrier Delivery of Gold Nanoclusters: Effect of Surface Charges and Quantification Using Positron Emission Tomography. Small 2018, 14, e1703115. [Google Scholar] [CrossRef]
- Sinharay, S.; Tu, T.W.; Kovacs, Z.I.; Schreiber-Stainthorp, W.; Sundby, M.; Zhang, X.; Papadakis, G.Z.; Reid, W.C.; Frank, J.A.; Hammoud, D.A. In vivo imaging of sterile microglial activation in rat brain after disrupting the blood-brain barrier with pulsed focused ultrasound: [18F]DPA-714 PET study. J. Neuroinflamm. 2019, 16, 155. [Google Scholar] [CrossRef] [Green Version]
- Monnet-Tschudi, F.; Defaux, A.; Braissant, O.; Cagnon, L.; Zurich, M.-G. Methods to Assess Neuroinflammation. Curr. Protoc. Toxicol. 2011, 50, 12.19.11–12.19.20. [Google Scholar] [CrossRef] [PubMed]


Publisher’s Note: MDPI stays neutral with regard to jurisdictional claims in published maps and institutional affiliations. |
© 2022 by the authors. Licensee MDPI, Basel, Switzerland. This article is an open access article distributed under the terms and conditions of the Creative Commons Attribution (CC BY) license (https://creativecommons.org/licenses/by/4.0/).
Share and Cite
Bastiancich, C.; Fernandez, S.; Correard, F.; Novell, A.; Larrat, B.; Guillet, B.; Estève, M.-A. Molecular Imaging of Ultrasound-Mediated Blood-Brain Barrier Disruption in a Mouse Orthotopic Glioblastoma Model. Pharmaceutics 2022, 14, 2227. https://doi.org/10.3390/pharmaceutics14102227
Bastiancich C, Fernandez S, Correard F, Novell A, Larrat B, Guillet B, Estève M-A. Molecular Imaging of Ultrasound-Mediated Blood-Brain Barrier Disruption in a Mouse Orthotopic Glioblastoma Model. Pharmaceutics. 2022; 14(10):2227. https://doi.org/10.3390/pharmaceutics14102227
Chicago/Turabian StyleBastiancich, Chiara, Samantha Fernandez, Florian Correard, Anthony Novell, Benoit Larrat, Benjamin Guillet, and Marie-Anne Estève. 2022. "Molecular Imaging of Ultrasound-Mediated Blood-Brain Barrier Disruption in a Mouse Orthotopic Glioblastoma Model" Pharmaceutics 14, no. 10: 2227. https://doi.org/10.3390/pharmaceutics14102227