
In Vitro Evaluation of Curcumin- and Quercetin-Loaded Nanoemulsions for Intranasal Administration: Effect of Surface Charge and Viscosity

 ,
,  , ,
, ,  , , and
Abstract
:1. Introduction
2. Materials and Methods
2.1. Materials
2.2. Production of Nanoemulsions
2.3. Physicochemical Characterization of CUR/QU-Loaded NEs
2.3.1. Nanoemulsions Particle Size and Surface Charge
2.3.2. Nanoparticle Tracking Analysis
2.3.3. Determination of Curcumin and Quercetin Concentration by HPLC
2.3.4. Chemical Stability of Curcumin and Quercetin in Nanoemulsions
2.3.5. Electron Paramagnetic Spin Resonance Spectroscopy
Preparation of the Samples
EPR Measurements
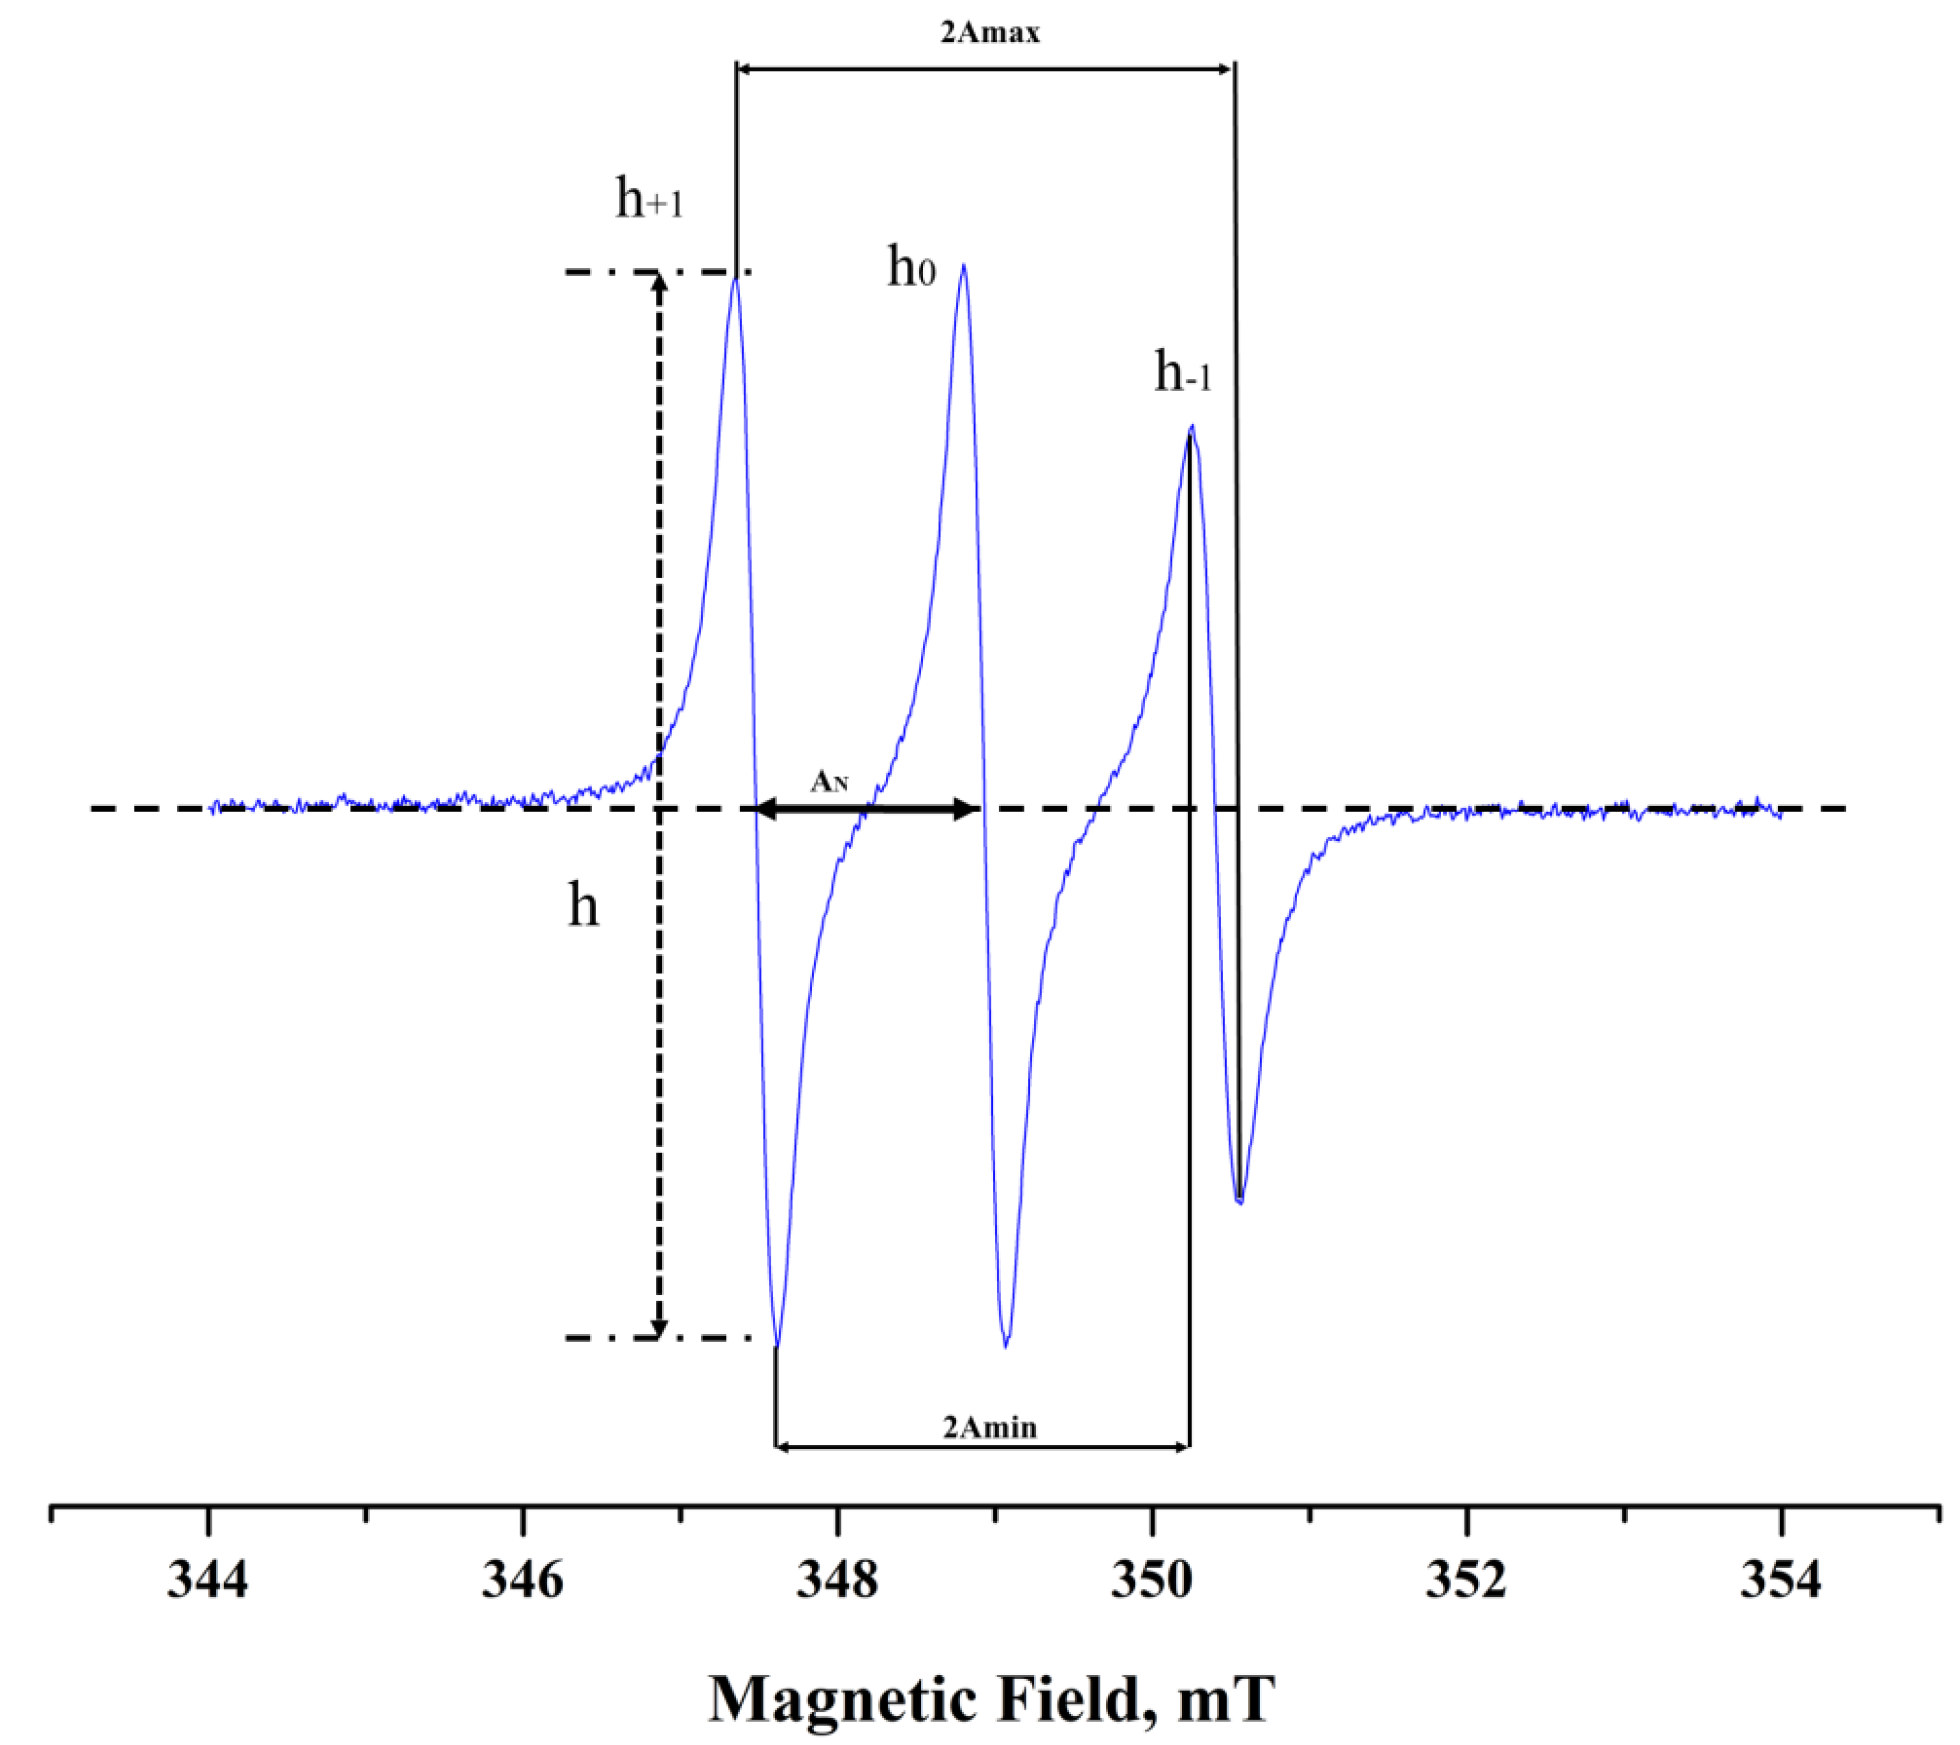
Electron Paramagnetic Spin Resonance Studies
Calculation of the Rotational Correlation Time (τR)
Calculation of the Order Parameter (S) and the Isotropic Hyperfine Splitting Constant (α′0)
Kinetics of the Scavenging Reaction
2.4. Cytotoxicity Assay
2.5. Permeation Experiments across an In Vitro Model of Nasal Mucosa
2.5.1. Seeding on Transwell™ Inserts
2.5.2. Transepithelial Electrical Resistance (TEER) Measurements
2.5.3. Curcumin and Quercetin Permeation across RPMI2650 Cells
3. Statistics
4. Results
4.1. Preparation and Characterization of the Nanoemulsions
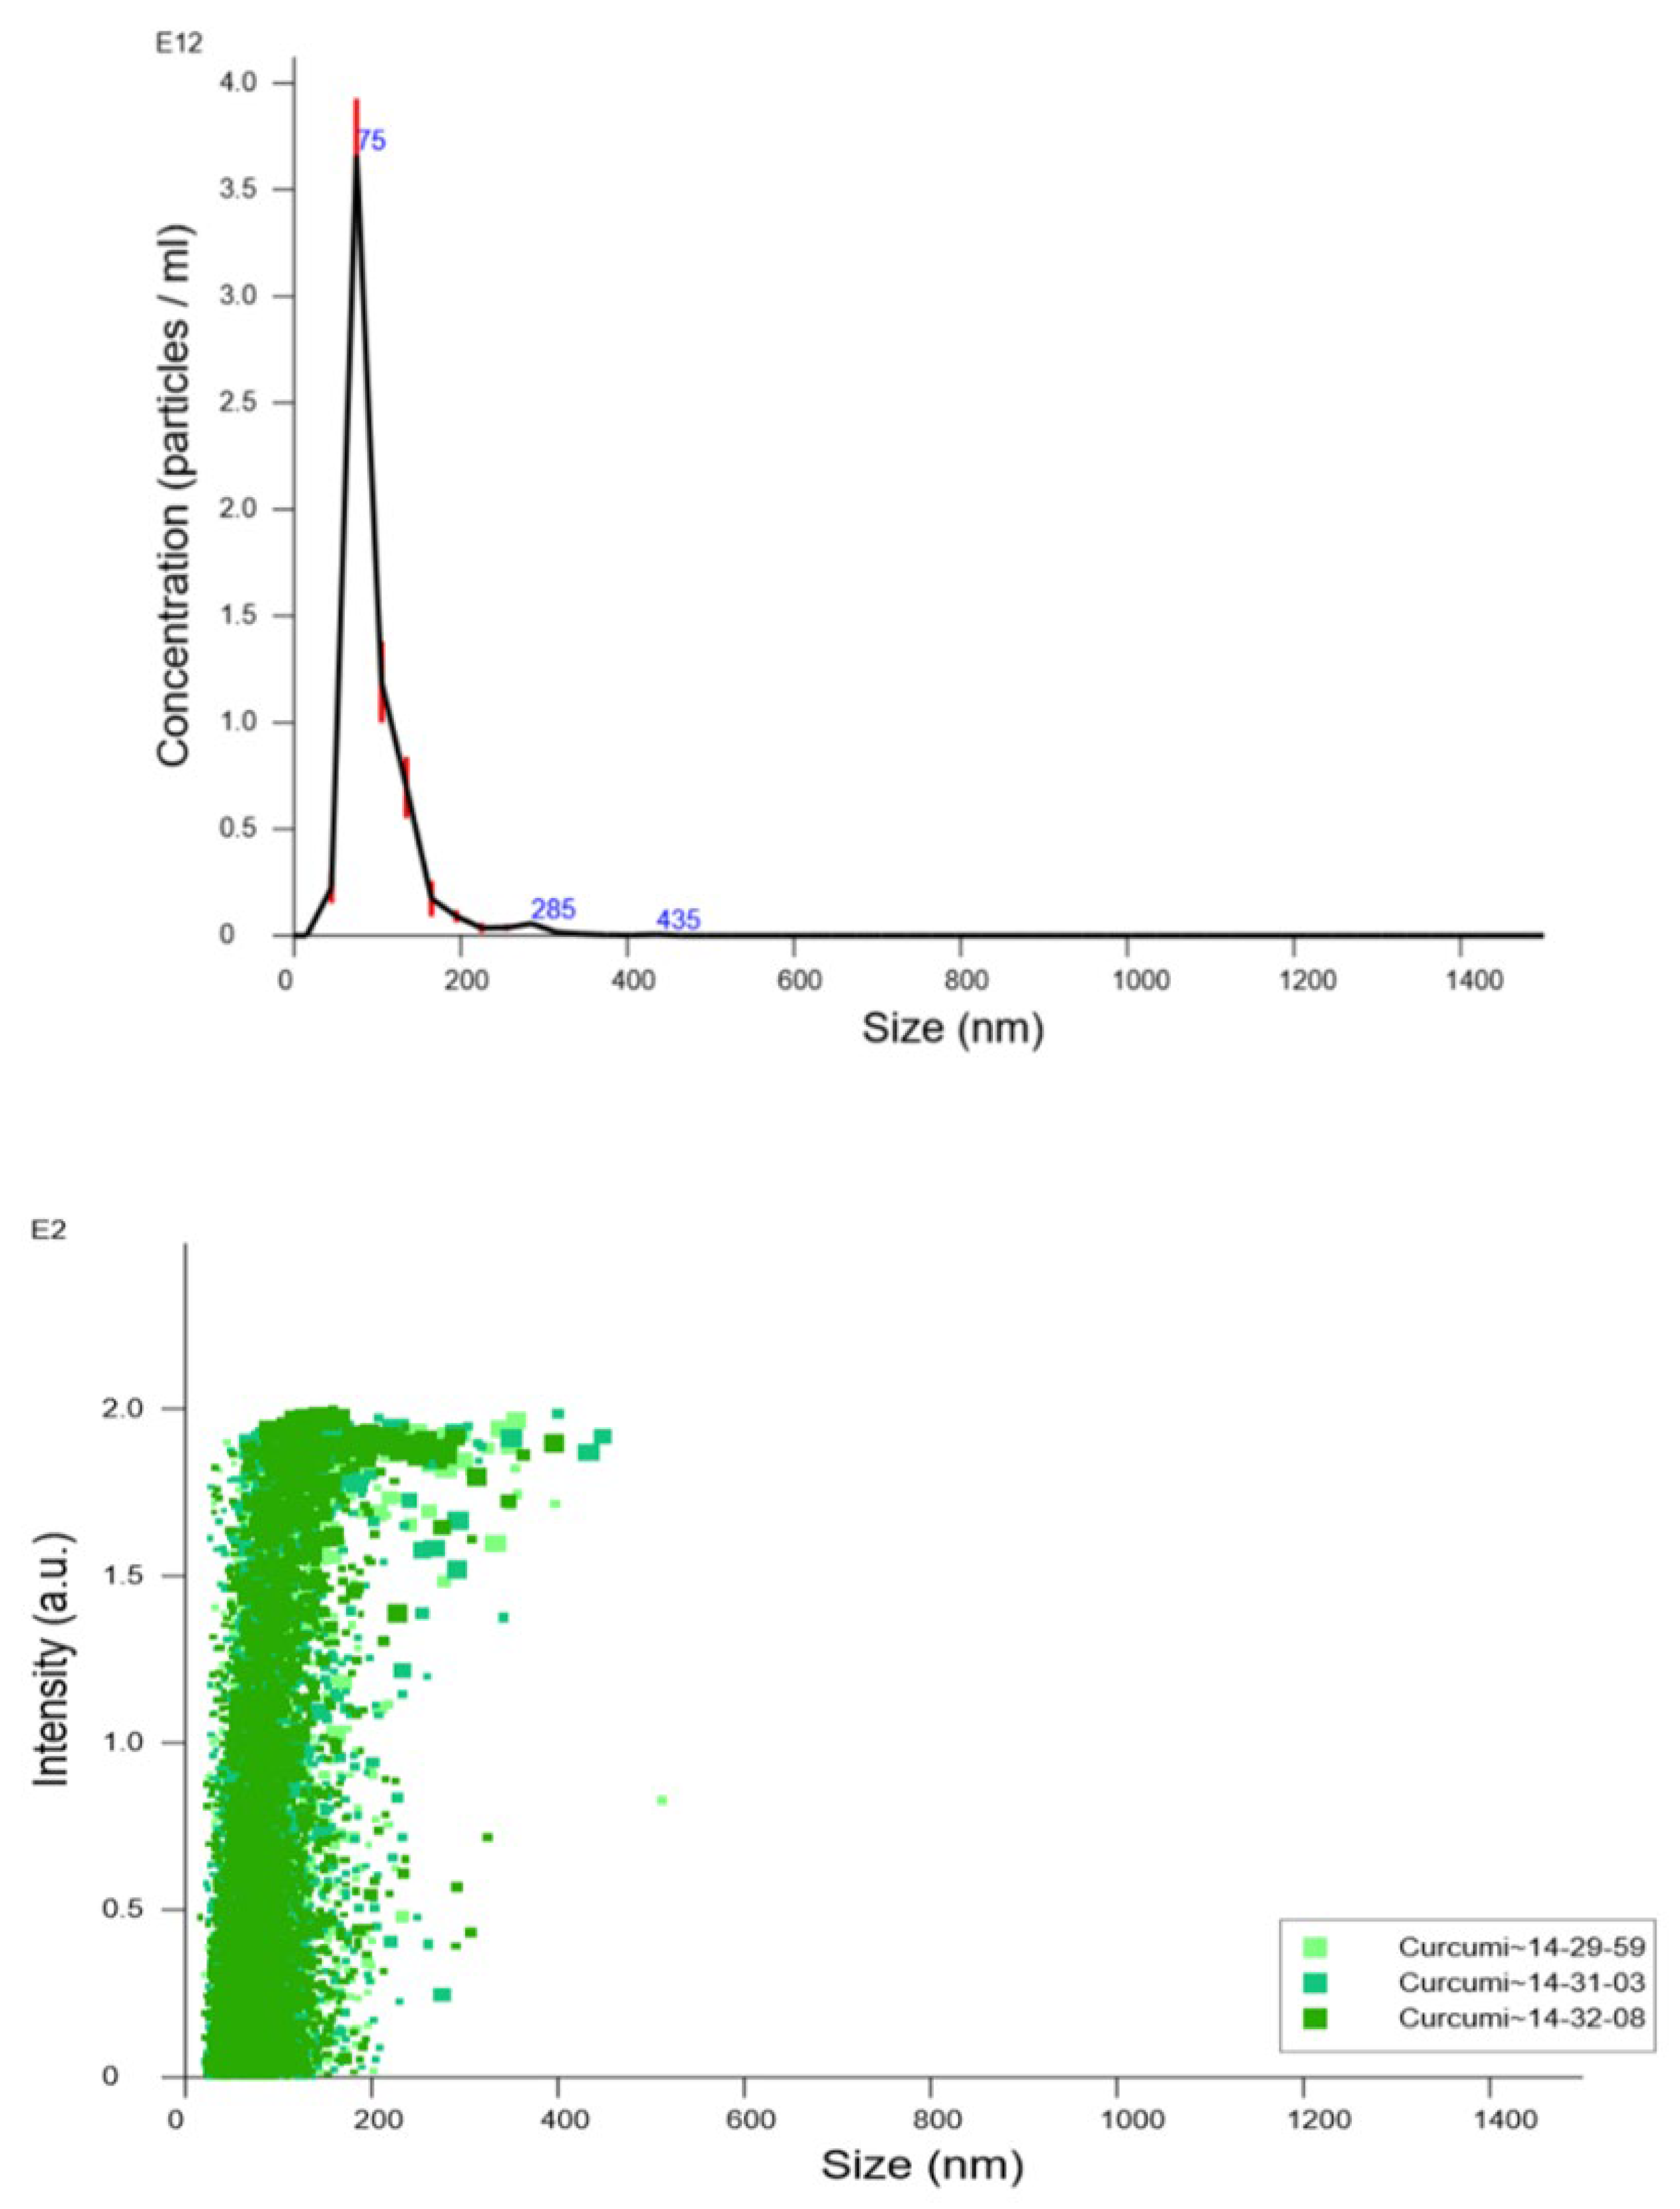
4.2. Nanoparticle Tracking Analysis
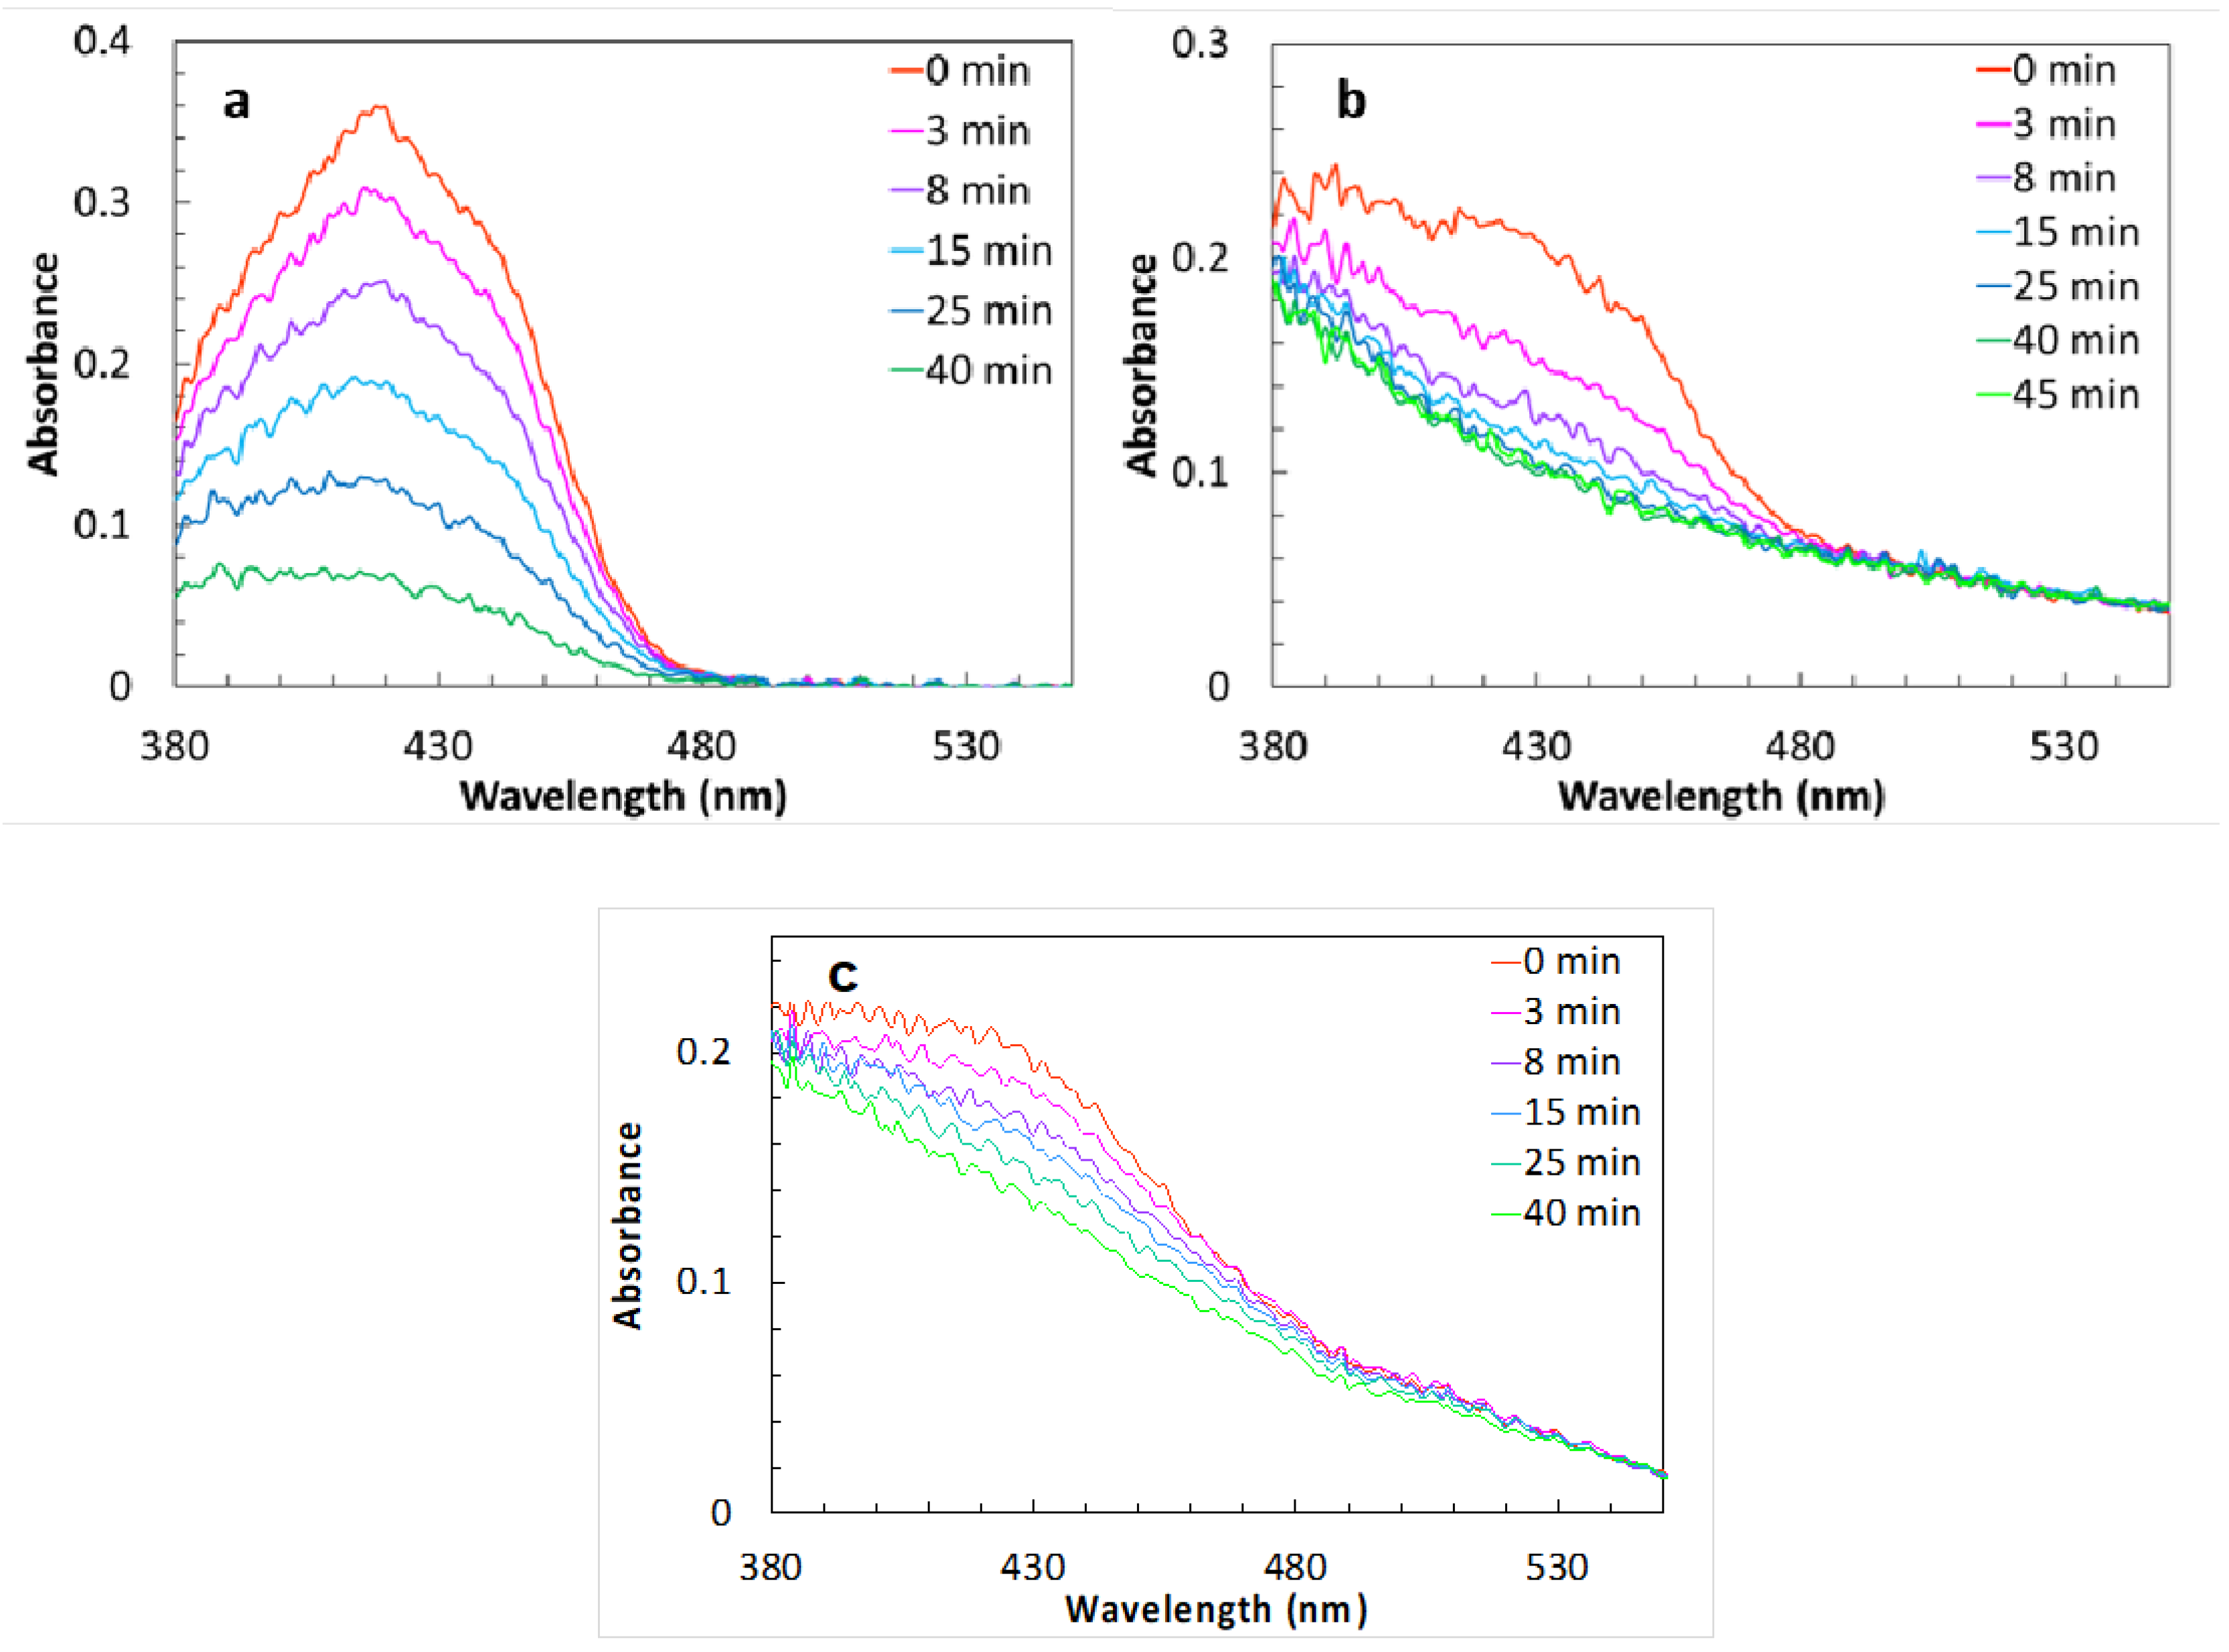
4.3. Nanoemulsions’ Stability
4.4. Nanoemulsions’ Interfacial Properties Investigation by Electron Paramagnetic Resonance
4.4.1. 16-DSA
4.4.2. 5-DSA
4.5. Nanoemulsions’ Antioxidant Effect
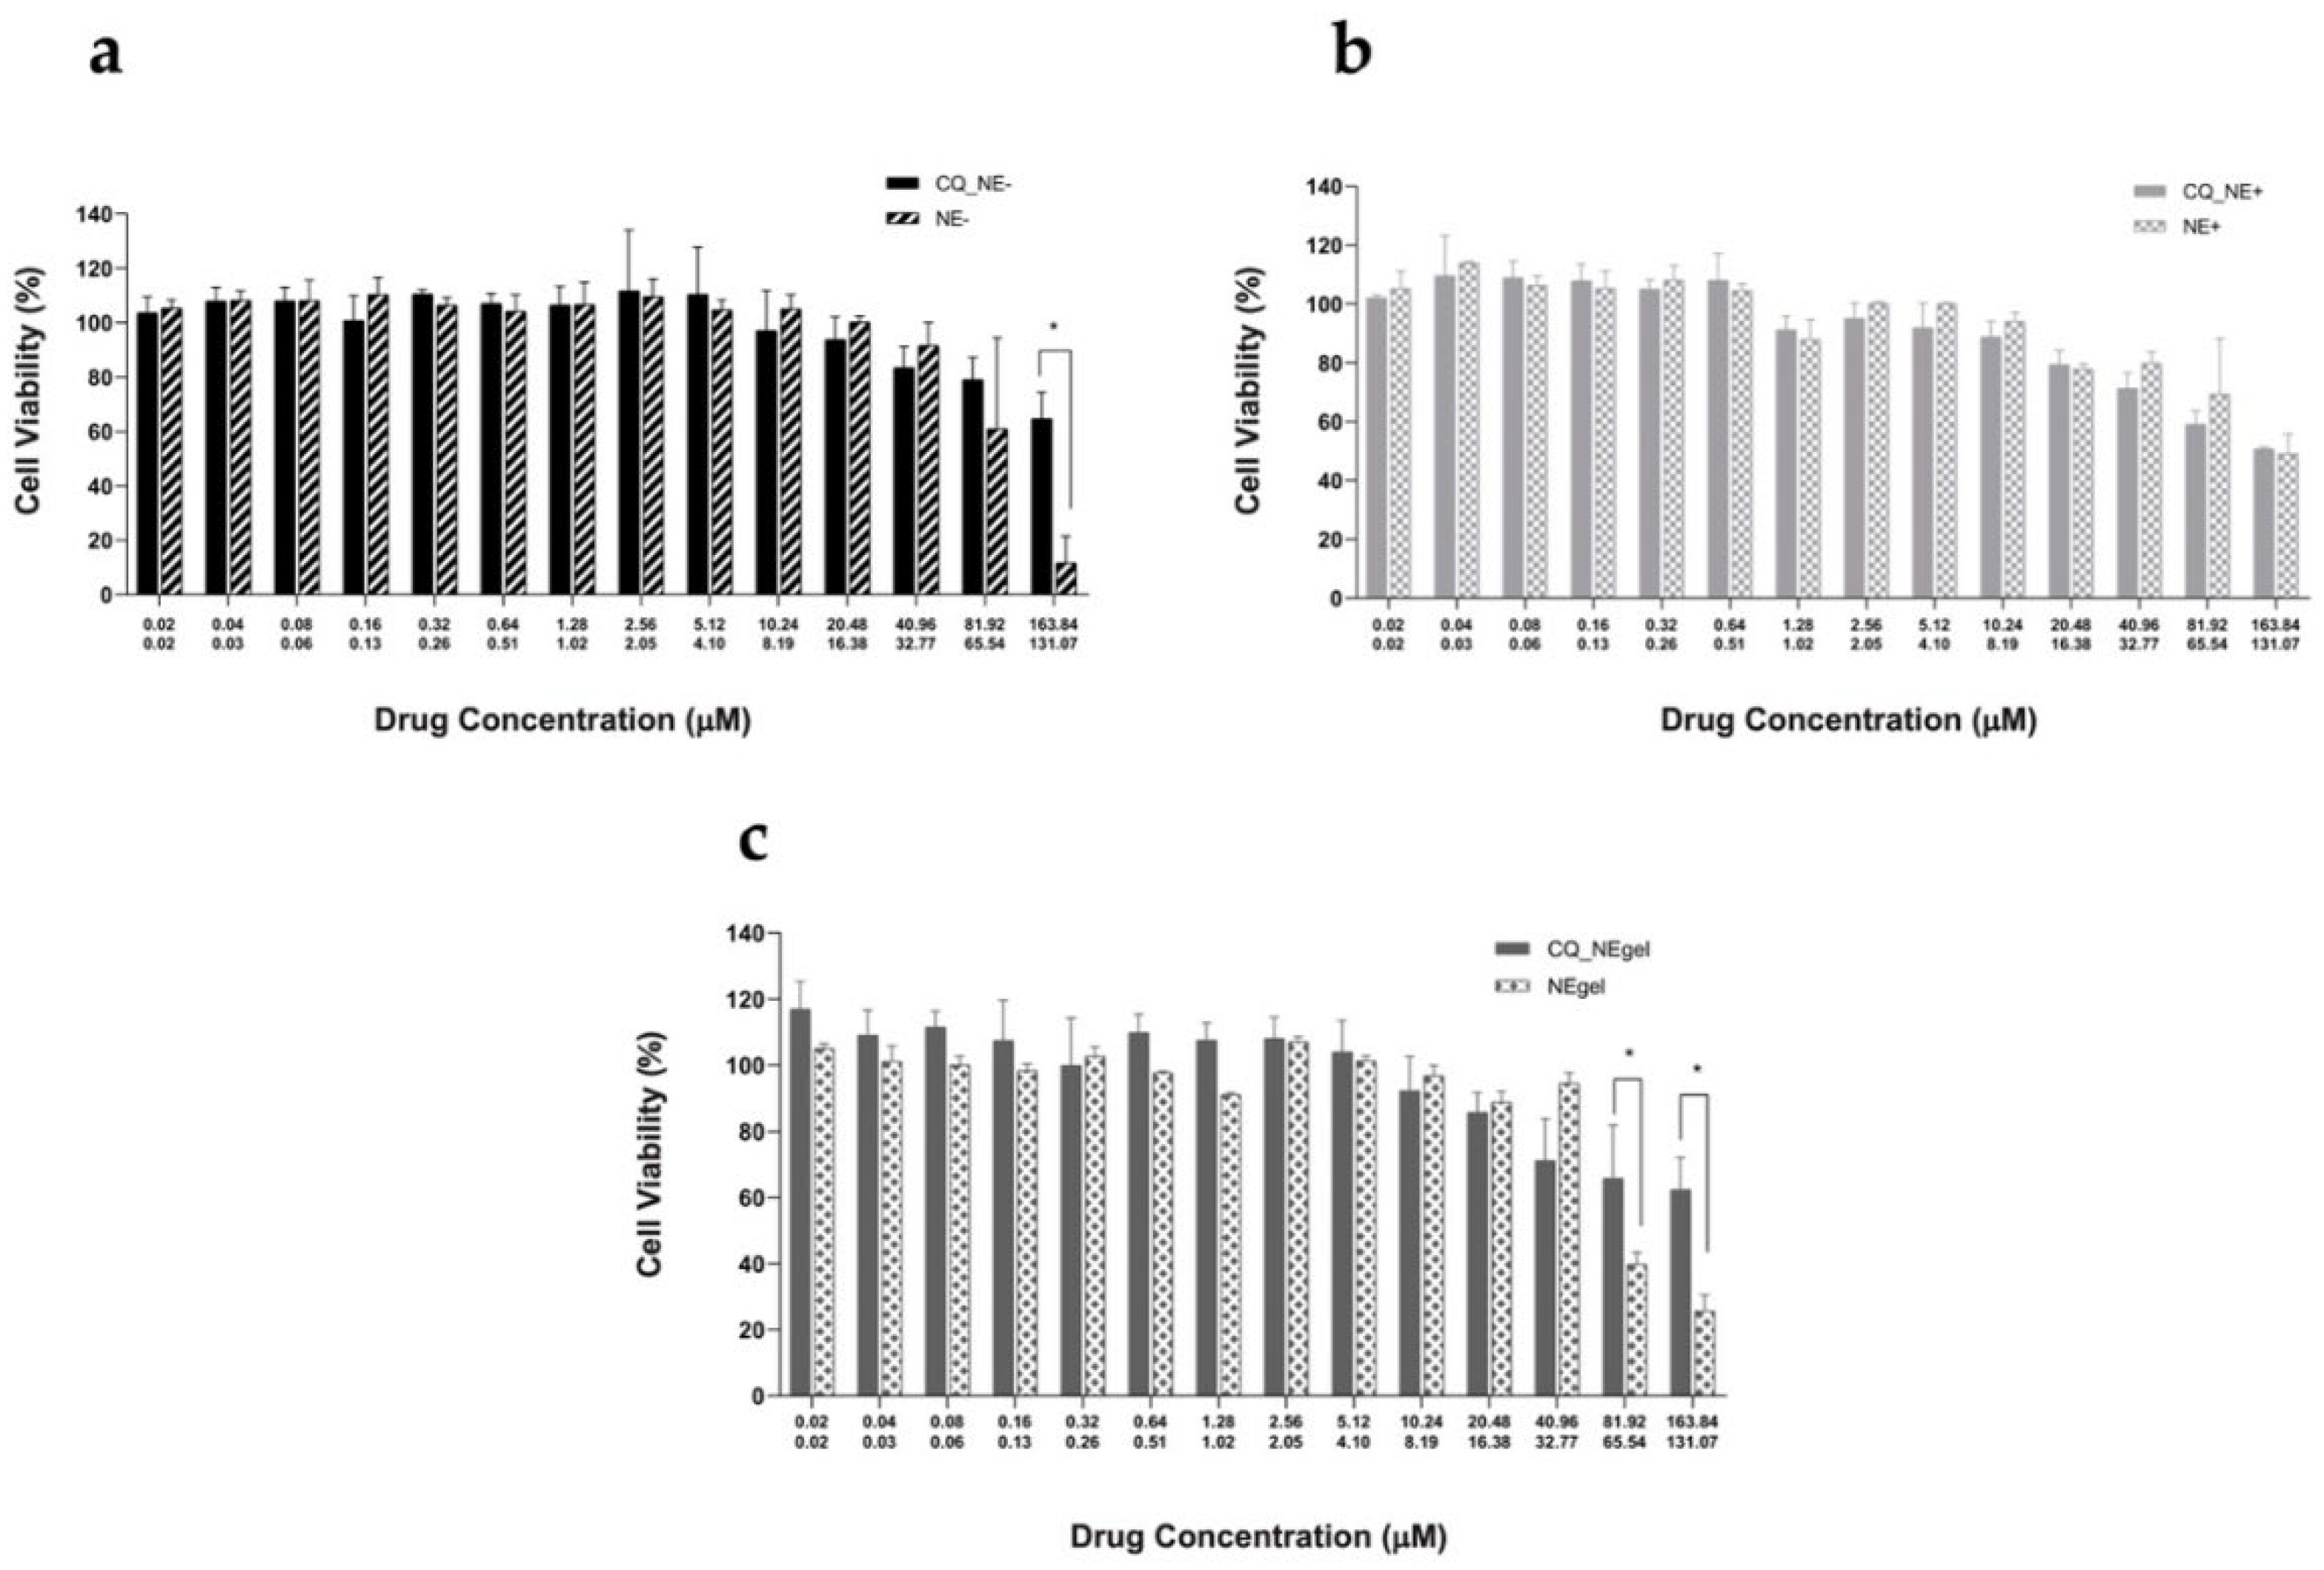
4.6. Cytotoxicity on Human Nasal Cells
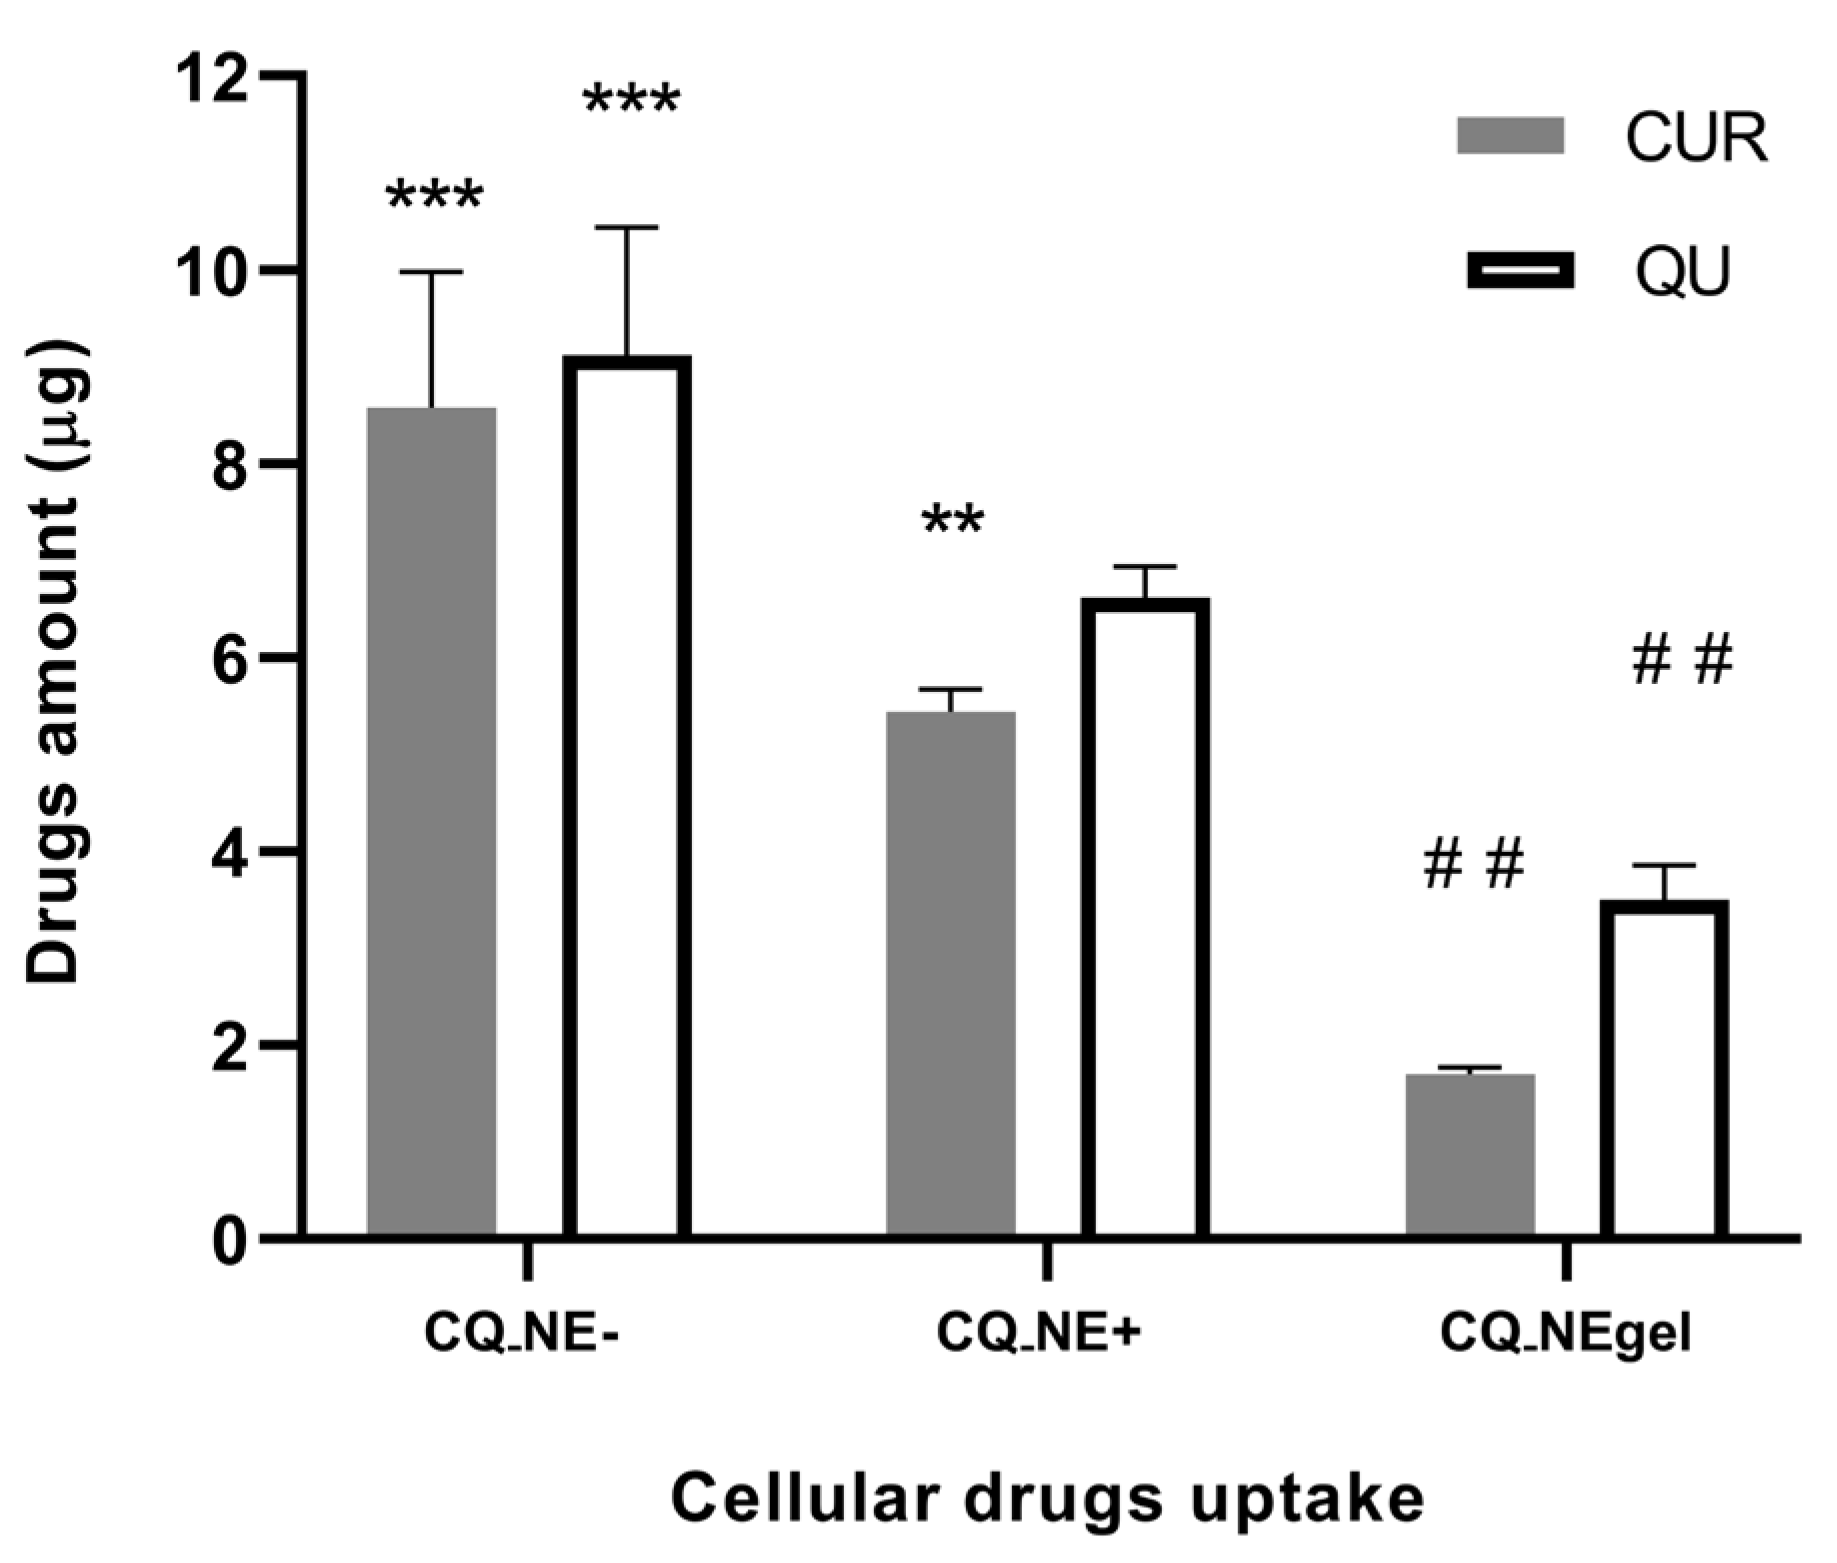
4.7. Permeation Experiments on a Nasal Epithelium Cell Model
5. Discussion
6. Conclusions
Supplementary Materials
Author Contributions
Funding
Institutional Review Board Statement
Informed Consent Statement
Data Availability Statement
Acknowledgments
Conflicts of Interest
References
- Lungare, S.; Bowen, J.; Badhan, R. Development and Evaluation of a Novel Intranasal Spray for the Delivery of Amantadine. J. Pharm. Sci. 2016, 105, 1209–1220. [Google Scholar] [CrossRef] [PubMed]
- Wengst, A.; Reichl, S. RPMI 2650 Epithelial Model and Three-Dimensional Reconstructed Human Nasal Mucosa as in Vitro Models for Nasal Permeation Studies. Eur. J. Pharm. BioPharm. 2010, 74, 290–297. [Google Scholar] [CrossRef] [PubMed]
- Gartziandia, O.; Egusquiaguirre, S.P.; Bianco, J.; Pedraz, J.L.; Igartua, M.; Hernandez, R.M.; Préat, V.; Beloqui, A. Nanoparticle Transport across in Vitro Olfactory Cell Monolayers. Int. J. Pharm. 2016, 499, 81–89. [Google Scholar] [CrossRef] [PubMed]
- Singh, S.K.; Dadhania, P.; Vuddanda, P.R.; Jain, A.; Velaga, S.; Singh, S. Intranasal Delivery of Asenapine Loaded Nanostructured Lipid Carriers: Formulation, Characterization, Pharmacokinetic and Behavioural Assessment. RSC Adv. 2016, 6, 2032–2045. [Google Scholar] [CrossRef]
- Grassin-Delyle, S.; Buenestado, A.; Naline, E.; Faisy, C.; Blouquit-Laye, S.; Couderc, L.-J.; Guen, M.L.; Fischler, M.; Devillier, P. Intranasal Drug Delivery: An Efficient and Non-Invasive Route for Systemic Administration Focus on Opioids. Pharmacol. Ther. 2012, 134, 366–379. [Google Scholar] [CrossRef]
- Kreft, M.E.; Jerman, U.D.; Lasič, E.; Rižner, T.L.; Hevir-Kene, N.; Peternel, L.; Kristan, K. The Characterization of the Human Nasal Epithelial Cell Line RPMI 2650 Under Different Culture Conditions and Their Optimization for an Appropriate in Vitro Nasal Model. Pharm. Res. 2015, 32, 665–679. [Google Scholar] [CrossRef]
- Ozsoy, Y.; Gungor, S.; Cevher, E. Nasal Delivery of High Molecular Weight Drugs. Molecules 2009, 14, 3754–3779. [Google Scholar] [CrossRef] [Green Version]
- Illum, L. Transport of Drugs from the Nasal Cavity to the Central Nervous System. Eur. J. Pharm. Sci. 2000, 11, 1–18. [Google Scholar] [CrossRef]
- Dufes, C.; Olivier, J.-C.; Gaillard, F.; Gaillard, A.; Couet, W.; Muller, J.-M. Brain Delivery of Vasoactive Intestinal Peptide (VIP) Following Nasal Administration to Rats. Int. J. Pharm. 2003, 255, 87–97. [Google Scholar] [CrossRef] [Green Version]
- Sousa, F.; Castro, P. 3.4—Cell-Based in Vitro Models for Nasal Permeability Studies. In Concepts and Models for Drug Permeability Studies; Sarmento, B., Ed.; Elsevier: Amsterdam, The Netherlands, 2016; pp. 83–100. ISBN 978-0-08-100094-6. [Google Scholar]
- Comfort, C.; Garrastazu, G.; Pozzoli, M.; Sonvico, F. Opportunities and Challenges for the Nasal Administration of Nanoemulsions. Curr. Top. Med. Chem. 2015, 15, 356–368. [Google Scholar] [CrossRef] [PubMed]
- Bonferoni, M.C.; Rossi, S.; Sandri, G.; Ferrari, F.; Gavini, E.; Rassu, G.; Giunchedi, P. Nanoemulsions for “Nose-to-Brain” Drug Delivery. Pharmaceutics 2019, 11, 84. [Google Scholar] [CrossRef] [Green Version]
- Angeloni, C.; Vauzour, D. Natural Products and Neuroprotection. Int. J. Mol. Sci. 2019, 20, 5570. [Google Scholar] [CrossRef] [PubMed] [Green Version]
- Askarizadeh, A.; Barreto, G.E.; Henney, N.C.; Majeed, M.; Sahebkar, A. Neuroprotection by Curcumin: A Review on Brain Delivery Strategies. Int. J. Pharm. 2020, 585, 119476. [Google Scholar] [CrossRef]
- Vaz, G.R.; Hädrich, G.; Bidone, J.; Rodrigues, J.L.; Falkembach, M.C.; Putaux, J.-L.; Hort, M.A.; Monserrat, J.M.; Junior, A.S.V.; Teixeira, H.F.; et al. Development of Nasal Lipid Nanocarriers Containing Curcumin for Brain Targeting. J. Alzheimer’s Dis. 2017, 59, 961–974. [Google Scholar] [CrossRef] [PubMed]
- Khan, H.; Ullah, H.; Aschner, M.; Cheang, W.S.; Akkol, E.K. Neuroprotective Effects of Quercetin in Alzheimer’s Disease. Biomolecules 2019, 10, 59. [Google Scholar] [CrossRef] [PubMed] [Green Version]
- Bicker, J.; Fortuna, A.; Alves, G.; Falcão, A. Nose-to-Brain Delivery of Natural Compounds for the Treatment of Central Nervous System Disorders. Curr. Pharm. Des. 2019, 26, 594–619. [Google Scholar] [CrossRef]
- Han, Q.; Wang, X.; Cai, S.; Liu, X.; Zhang, Y.; Yang, L.; Wang, C.; Yang, R. Quercetin Nanoparticles with Enhanced Bioavailability as Multifunctional Agents toward Amyloid Induced Neurotoxicity. J. Mater. Chem. B 2018, 6, 1387–1393. [Google Scholar] [CrossRef]
- Tiwari, S.K.; Agarwal, S.; Seth, B.; Yadav, A.; Nair, S.; Bhatnagar, P.; Karmakar, M.; Kumari, M.; Chauhan, L.K.S.; Patel, D.K.; et al. Curcumin-Loaded Nanoparticles Potently Induce Adult Neurogenesis and Reverse Cognitive Deficits in Alzheimer’s Disease Model via Canonical Wnt/β-Catenin Pathway. ACS Nano 2014, 8, 76–103. [Google Scholar] [CrossRef]
- Vaz, G.R.; Clementino, A.; Bidone, J.; Villetti, M.A.; Falkembach, M.; Batista, M.; Barros, P.; Sonvico, F.; Dora, C. Curcumin and Quercetin-Loaded Nanoemulsions: Physicochemical Compatibility Study and Validation of a Simultaneous Quantification Method. Nanomaterials 2020, 10, 1650. [Google Scholar] [CrossRef]
- Filipe, V.; Hawe, A.; Jiskoot, W. Critical Evaluation of Nanoparticle Tracking Analysis (NTA) by NanoSight for the Measurement of Nanoparticles and Protein Aggregates. Pharm. Res. 2010, 27, 796–810. [Google Scholar] [CrossRef] [Green Version]
- Hole, P.; Sillence, K.; Hannell, C.; Maguire, C.M.; Roesslein, M.; Suarez, G.; Capracotta, S.; Magdolenova, Z.; Horev-Azaria, L.; Dybowska, A.; et al. Interlaboratory Comparison of Size Measurements on Nanoparticles Using Nanoparticle Tracking Analysis (NTA). J. Nanopart. Res. 2013, 15, 2101. [Google Scholar] [CrossRef] [Green Version]
- Spin Labeling, Theory and Applications; Berliner, L.J.; Reuben, J. (Eds.) Biological Magnetic Resonance; Springer: Boston, MA, USA, 1989; ISBN 9781461280606. [Google Scholar]
- Klare, J.P.; Steinhoff, H.-J. Spin Labeling EPR. Photosynth. Res. 2009, 102, 377–390. [Google Scholar] [CrossRef]
- Fanun, M.; Papadimitriou, V.; Xenakis, A. Characterization of Cephalexin Loaded Nonionic Microemulsions. J. Colloid Interface Sci. 2011, 361, 115–121. [Google Scholar] [CrossRef]
- Tzika, E.D.; Papadimitriou, V.; Sotiroudis, T.G.; Xenakis, A. Antioxidant Properties of Fruits and Vegetables Shots and Juices: An Electron Paramagnetic Resonance Study. Food Biophys. 2008, 3, 48–53. [Google Scholar] [CrossRef]
- Bai, S.; Yang, T.; Abbruscato, T.J.; Ahsan, F. Evaluation of Human Nasal RPMI 2650 Cells Grown at an Air–Liquid Interface as a Model for Nasal Drug Transport Studies. J. Pharm. Sci. 2008, 97, 1165–1178. [Google Scholar] [CrossRef]
- Clementino, A.; Batger, M.; Garrastazu, G.; Pozzoli, M.; Favero, E.D.; Rondelli, V.; Gutfilen, B.; Barboza, T.; Sukkar, M.B.; Souza, S.A.L.; et al. The Nasal Delivery of Nanoencapsulated Statins—An Approach for Brain Delivery. Int. J. Nanomed. 2016, 11, 6575–6590. [Google Scholar] [CrossRef] [Green Version]
- Clementino, A.R.; Pellegrini, G.; Banella, S.; Colombo, G.; Cantù, L.; Sonvico, F.; Favero, E.D. Structure and Fate of Nanoparticles Designed for the Nasal Delivery of Poorly Soluble Drugs. Mol. Pharm. 2021, 18, 3132–3146. [Google Scholar] [CrossRef]
- Pozzoli, M.; Ong, H.X.; Morgan, L.; Sukkar, M.; Traini, D.; Young, P.M.; Sonvico, F. Application of RPMI 2650 Nasal Cell Model to a 3D Printed Apparatus for the Testing of Drug Deposition and Permeation of Nasal Products. Eur. J. Pharm. BioPharm. 2016, 107, 223–233. [Google Scholar] [CrossRef] [PubMed]
- Srinivasan, B.; Kolli, A.R.; Esch, M.B.; Abaci, H.E.; Shuler, M.L.; Hickman, J.J. TEER Measurement Techniques for In Vitro Barrier Model Systems. J. Lab. Autom. 2014, 20, 107–126. [Google Scholar] [CrossRef] [PubMed] [Green Version]
- Mazza, M.; Pomponi, M.; Janiri, L.; Bria, P.; Mazza, S. Omega-3 Fatty Acids and Antioxidants in Neurological and Psychiatric Diseases: An Overview. Prog. Neuro-Psychopharmacol. Biol. Psychiatry 2007, 31, 12–26. [Google Scholar] [CrossRef] [PubMed]
- Clementino, A.R.; Marchi, C.; Pozzoli, M.; Bernini, F.; Zimetti, F.; Sonvico, F. Anti-Inflammatory Properties of Statin-Loaded Biodegradable Lecithin/Chitosan Nanoparticles: A Step Toward Nose-to-Brain Treatment of Neurodegenerative Diseases. Front. Pharmacol. 2021, 12, 716380. [Google Scholar] [CrossRef] [PubMed]
- Daull, P.; Lallemand, F.; Garrigue, J.-S. Benefits of Cetalkonium Chloride Cationic Oil-in-Water Nanoemulsions for Topical Ophthalmic Drug Delivery. J. Pharm. Pharmacol. 2014, 66, 531–541. [Google Scholar] [CrossRef] [PubMed] [Green Version]
- Zhang, J.; Fan, Y.; Smith, E. Experimental Design for the Optimization of Lipid Nanoparticles. J. Pharm. Sci. 2009, 98, 1813–1819. [Google Scholar] [CrossRef] [PubMed]
- Griffiths, D.; Carnell-Morris, P.; Wright, M. Nanoparticles in Biology and Medicine, Methods and Protocols. Methods Mol. Biol. 2020, 2118, 289–303. [Google Scholar] [CrossRef]
- Sokolova, V.; Ludwig, A.-K.; Hornung, S.; Rotan, O.; Horn, P.A.; Epple, M.; Giebel, B. Characterisation of Exosomes Derived from Human Cells by Nanoparticle Tracking Analysis and Scanning Electron Microscopy. Colloids Surf. B Biointerfaces 2011, 87, 146–150. [Google Scholar] [CrossRef] [PubMed]
- Barreiro-Iglesias, R.; Alvarez-Lorenzo, C.; Concheiro, A. Incorporation of Small Quantities of Surfactants as a Way to Improve the Rheological and Diffusional Behavior of Carbopol Gels. J. Control. Release 2001, 77, 59–75. [Google Scholar] [CrossRef]
- Nikolic, I.; Mitsou, E.; Pantelic, I.; Randjelovic, D.; Markovic, B.; Papadimitriou, V.; Xenakis, A.; Lunter, D.J.; Zugic, A.; Savic, S. Microstructure and Biopharmaceutical Performances of Curcumin-Loaded Low-Energy Nanoemulsions Containing Eucalyptol and Pinene: Terpenes’ Role Overcome Penetration Enhancement Effect? Eur. J. Pharm. Sci. 2020, 142, 105135. [Google Scholar] [CrossRef]
- Pan, Y.; Tikekar, R.V.; Nitin, N. Effect of Antioxidant Properties of Lecithin Emulsifier on Oxidative Stability of Encapsulated Bioactive Compounds. Int. J. Pharm. 2013, 450, 129–137. [Google Scholar] [CrossRef]
- Reno, F.E.; Normand, P.; McInally, K.; Silo, S.; Stotland, P.; Triest, M.; Carballo, D.; Piché, C. A Novel Nasal Powder Formulation of Glucagon: Toxicology Studies in Animal Models. BMC Pharmacol. Toxicol. 2015, 16, 29. [Google Scholar] [CrossRef] [Green Version]
- Sastre, J.; Mosges, R. Local and Systemic Safety of Intranasal Corticosteroids. J. Investig. Allergol. Clin. Immunol. 2012, 22, 1–12. [Google Scholar]
- Agrawal, M.; Saraf, S.; Saraf, S.; Antimisiaris, S.G.; Chougule, M.B.; Shoyele, S.A.; Alexander, A. Nose-to-Brain Drug Delivery: An Update on Clinical Challenges and Progress towards Approval of Anti-Alzheimer Drugs. J. Control. Release 2018, 281, 139–177. [Google Scholar] [CrossRef] [PubMed]
- Riss, T.L.; Moravec, R.A.; Niles, A.L.; Duellman, S.; Benink, H.A.; Worzella, T.J.; Minor, L. Cell Viability Assays. In Assay Guidance Manual; Markossian, S., Grossman, A., Brimacombe, K., Arkin, M., Auld, D., Austin, C.P., Baell, J., Chung, T.D.Y., Coussens, N.P., Dahlin, J.L., et al., Eds.; Eli Lilly & Company and the National Center for Advancing Translational Sciences: Bethesda, MD, USA, 2004. [Google Scholar]
- McClements, D.J.; Rao, J. Food-Grade Nanoemulsions: Formulation, Fabrication, Properties, Performance, Biological Fate, and Potential Toxicity. Crit. Rev. Food Sci. 2011, 51, 285–330. [Google Scholar] [CrossRef]
- Ekelund, K.; Östh, K.; Påhlstorp, C.; Björk, E.; Ulvenlund, S.; Johansson, F. Correlation between Epithelial Toxicity and Surfactant Structure as Derived from the Effects of Polyethyleneoxide Surfactants on Caco-2 Cell Monolayers and Pig Nasal Mucosa. J. Pharm. Sci. 2005, 94, 730–744. [Google Scholar] [CrossRef] [PubMed]
- Ho, C.-Y.; Wu, M.-C.; Lan, M.-Y.; Tan, C.-T.; Yang, A.-H. In Vitro Effects of Preservatives in Nasal Sprays on Human Nasal Epithelial Cells. Am. J. Rhinol. Allergy 2008, 22, 125–129. [Google Scholar] [CrossRef] [PubMed]
- Bortolotti, F.; Fabrizio, B.; Balducci, A.G.; Giulia, B.A.; Sonvico, F.; Fabio, S.; Russo, P.; Paola, R.; Colombo, G.; Gaia, C. In vitro permeation of desmopressin across rabbit nasal mucosa from liquid nasal sprays: The enhancing effect of potassium sorbate. Eur. J. Pharm. Sci. 2009, 37, 36–42. [Google Scholar] [CrossRef] [PubMed]
- Pozzoli, M.; Traini, D.; Young, P.M.; Sukkar, M.B.; Sonvico, F. Development of a Soluplus Budesonide Freeze-Dried Powder for Nasal Drug Delivery. Drug Dev. Ind. Pharm. 2017, 43, 1510–1518. [Google Scholar] [CrossRef]
- Pozzoli, M.; Rogueda, P.; Zhu, B.; Smith, T.; Young, P.M.; Traini, D.; Sonvico, F. Dry Powder Nasal Drug Delivery: Challenges, Opportunities and a Study of the Commercial Teijin Puvlizer Rhinocort Device and Formulation. Drug Dev. Ind. Pharm. 2016, 42, 1660–1668. [Google Scholar] [CrossRef]
- Rapalli, V.K.; Kaul, V.; Waghule, T.; Gorantla, S.; Sharma, S.; Roy, A.; Dubey, S.K.; Singhvi, G. Curcumin Loaded Nanostructured Lipid Carriers for Enhanced Skin Retained Topical Delivery: Optimization, Scale-up, In-Vitro Characterization and Assessment of Ex-Vivo Skin Deposition. Eur. J. Pharm. Sci. 2020, 152, 105438. [Google Scholar] [CrossRef]
- More, S.K.; Pawar, A.P. Preparation, Optimization and Preliminary Pharmacokinetic Study of Curcumin Encapsulated Turmeric Oil Microemulsion in Zebra Fish. Eur. J. Pharm. Sci. 2020, 155, 105539. [Google Scholar] [CrossRef]
- Smith, A.J.; Kavuru, P.; Wojtas, L.; Zaworotko, M.J.; Shytle, R.D. Cocrystals of Quercetin with Improved Solubility and Oral Bioavailability. Mol. Pharm. 2011, 8, 1867–1876. [Google Scholar] [CrossRef]
- Baspinar, Y.; Borchert, H.-H. Penetration and Release Studies of Positively and Negatively Charged Nanoemulsions—Is There a Benefit of the Positive Charge? Int. J. Pharm. 2012, 430, 247–252. [Google Scholar] [CrossRef]
- Cone, R.A. Barrier Properties of Mucus. Adv. Drug Deliv. Rev. 2009, 61, 75–85. [Google Scholar] [CrossRef] [PubMed]
- Sigurdsson, H.H.; Kirch, J.; Lehr, C.-M. Mucus as a Barrier to Lipophilic Drugs. Int. J. Pharm. 2013, 453, 56–64. [Google Scholar] [CrossRef] [PubMed]
- Mistry, A.; Stolnik, S.; Illum, L. Nose-to-Brain Delivery: Investigation of the Transport of Nanoparticles with Different Surface Characteristics and Sizes in Excised Porcine Olfactory Epithelium. Mol. Pharm. 2015, 12, 2755–2766. [Google Scholar] [CrossRef] [PubMed]
- Witten, J.; Samad, T.; Ribbeck, K. Selective Permeability of Mucus Barriers. Curr. Opin. Biotechnol. 2018, 52, 124–133. [Google Scholar] [CrossRef]
- Dall’Acqua, S.; Miolo, G.; Innocenti, G.; Caffieri, S. The Photodegradation of Quercetin: Relation to Oxidation. Molecules 2012, 17, 8898–8907. [Google Scholar] [CrossRef] [Green Version]
- Priyadarsini, K. The Chemistry of Curcumin: From Extraction to Therapeutic Agent. Molecules 2014, 19, 20091–20112. [Google Scholar] [CrossRef] [Green Version]


| Formulation | PEG 660 Stearate (% w/v) | Castor Oil (mg) | Fish Oil (mg) | Egg Lecithin (mg) | CUR (mg) | QU (mg) | Cetalkonium Chloride (% w/v) | Deacetylated Gellan Gum (% w/v) |
|---|---|---|---|---|---|---|---|---|
| NE− | 1.5 | 2400 | 2400 | 1200 | - | - | - | - |
| CQ_NE− | 1.5 | 2400 | 2400 | 1200 | 45 | 45 | - | - |
| NE+ | 1.5 | 2400 | 2400 | 1200 | - | - | 0.0175 | - |
| CQ_NE+ | 1.5 | 2400 | 2400 | 1200 | 45 | 45 | 0.0175 | - |
| NEgel | 1.5 | 2400 | 2400 | 1200 | - | - | - | 0.5 |
| CQ_NEgel | 1.5 | 2400 | 2400 | 1200 | 45 | 45 | - | 0.5 |
| Name (Acronym) | Structural Formula | Molecular Formula |
|---|---|---|
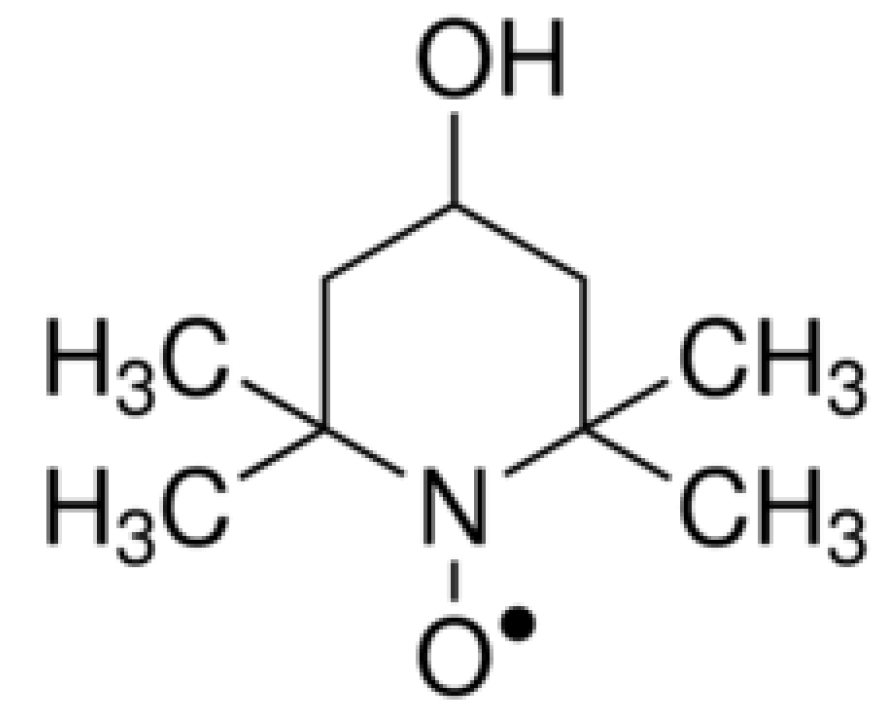
| 5-doxyl stearic acid (5-DSA) |  | C22H42NO4 |
| 16-doxyl stearic acid (16-DSA) |  | C22H42NO4 |
| Nanoemulsion | Size (nm) | PDI 1 | ζ Potential (mV) |
|---|---|---|---|
| NE− | 102.86 ± 1.80 | 0.183 ± 0.02 | −25.7 ± 0.20 |
| NE+ | 131.86 ± 0.80 | 0.246 ± 0.01 | +6.4 ± 0.20 |
| NEgel | 134.87 ± 0.40 | 0.240 ± 0.03 | −25.7 ± 0.2 |
| CQ_NE− | 119.43 ± 0.83 | 0.202 ± 0.02 | −22.3 ± 0.15 |
| CQ_NE+ | 131.00 ± 0.25 | 0.210 ± 0.01 | +7.9 ± 0.24 |
| CQ_NEgel | 244.80 ± 2.40 | 0.191 ± 0.01 | −29.1 ± 0.40 |
| Nanoemulsion | Curcumin Content (mg/mL) | Recovery Curcumin (%) | Quercetin Content (mg/mL) | Recovery Quercetin (%) | Entrapment Efficiency (%) |
|---|---|---|---|---|---|
| CQ_NE− | 0.61 ± 0.01 | 81.33 ± 1.30 | 0.72 ± 0.01 | 96.00 ± 1.30 | >99 |
| CQ_NE+ | 0.62 ± 0.02 | 82.66 ± 2.60 | 0.71 ± 0.03 | 94.66 ± 4.00 | >99 |
| CQ_NEgel | 0.61 ± 0.01 | 81.33 ± 1.30 | 0.72 ± 0.01 | 96.00 ± 1.30 | >99 |
| 16-DSA | τR (ns) | S | α´0 |
|---|---|---|---|
| NE− | 1.46 ± 0.07 | 0.08 ± 0.01 | 14.27 ± 0.05 |
| CQ_NE− | 1.51 ± 0.07 | 0.08 ± 0.01 | 14.20 ± 0.03 |
| NE+ | 1.40 ± 0.05 | 0.08 ≤ 0.01 | 14.36 ± 0.06 |
| CQ_NE+ | 1.46 ± 0.06 | 0.08 ± 0.01 | 14.32 ± 0.03 |
| 5-DSA | τR (ns) | S |
|---|---|---|
| NE− | 6.74 ± 0.08 | 0.49 ± 0.02 |
| CQ_NE− | 6.97 ± 0.07 | 0.50 ± 0.01 |
| NE+ | 6.37 ± 0.04 | 0.49 ± 0.01 |
| CQ_NE+ | 6.70 ± 0.04 | 0.50 ± 0.01 |
| Time (Min) | NE− | CQ_NE− | NE+ | CQ_NE+ |
|---|---|---|---|---|
| 2 | 8.3 ± 0.4 | 15.6 ± 5.2 | 5.3 ± 1.6 | 22.7 ± 6.7 |
| 5 | 8.9 ± 1.1 | 18.3 ± 5.3 | 6.8 ± 1.5 | 24.3 ± 5.8 |
| 10 | 9.8 ± 0.7 | 19.9 ± 4.5 | 8.1 ± 1.1 | 24.8 ± 5.2 |
| 15 | 10.4 ± 0.7 | 19.1 ± 5.9 | 8.1 ± 1.1 | 24.8 ± 4.9 |
| 20 | 10.8 ± 1.0 | 19.3 ± 5.8 | 7.7 ± 1.4 | 25.0 ± 4.8 |
| 25 | 10.5 ± 1.0 | 19.8 ± 5.3 | 8.5 ± 0.8 | 24.9 ± 4.9 |
| 30 | 10.5 ± 0.9 | 19.7 ± 5.2 | 8.9 ± 0.8 | 25.1 ± 4.7 |
Publisher’s Note: MDPI stays neutral with regard to jurisdictional claims in published maps and institutional affiliations. |
© 2022 by the authors. Licensee MDPI, Basel, Switzerland. This article is an open access article distributed under the terms and conditions of the Creative Commons Attribution (CC BY) license (https://creativecommons.org/licenses/by/4.0/).
Share and Cite
Vaz, G.; Clementino, A.; Mitsou, E.; Ferrari, E.; Buttini, F.; Sissa, C.; Xenakis, A.; Sonvico, F.; Dora, C.L. In Vitro Evaluation of Curcumin- and Quercetin-Loaded Nanoemulsions for Intranasal Administration: Effect of Surface Charge and Viscosity. Pharmaceutics 2022, 14, 194. https://doi.org/10.3390/pharmaceutics14010194
Vaz G, Clementino A, Mitsou E, Ferrari E, Buttini F, Sissa C, Xenakis A, Sonvico F, Dora CL. In Vitro Evaluation of Curcumin- and Quercetin-Loaded Nanoemulsions for Intranasal Administration: Effect of Surface Charge and Viscosity. Pharmaceutics. 2022; 14(1):194. https://doi.org/10.3390/pharmaceutics14010194
Chicago/Turabian StyleVaz, Gustavo, Adryana Clementino, Evgenia Mitsou, Elena Ferrari, Francesca Buttini, Cristina Sissa, Aristotelis Xenakis, Fabio Sonvico, and Cristiana Lima Dora. 2022. "In Vitro Evaluation of Curcumin- and Quercetin-Loaded Nanoemulsions for Intranasal Administration: Effect of Surface Charge and Viscosity" Pharmaceutics 14, no. 1: 194. https://doi.org/10.3390/pharmaceutics14010194