Article

Modulation of Conductivity of Alginate Hydrogels Containing Reduced Graphene Oxide through the Addition of Proteins

by
Ahmed Raslan
1,†,
Jesús Ciriza
2,3,4,†,
Ana María Ochoa de Retana
5,
María Luisa Sanjuán
6,
Muhammet S. Toprak
7,
Patricia Galvez-Martin
8,
Laura Saenz-del-Burgo
1,2,9,* and
Jose Luis Pedraz
1,2,9,*
1
NanoBioCel Group, Laboratory of Pharmacy and Pharmaceutical Technology, Faculty of Pharmacy, University of the Basque Country UPV/EHU, 01006 Vitoria-Gasteiz, Spain
2
Biomedical Research Networking Center in Bioengineering, Biomaterials, and Nanomedicine, CIBER-BBN, Paseo de la Universidad 7, 01006 Vitoria-Gasteiz, Spain
3
Tissue Microenvironment (TME) Lab, Aragón Institute of Engineering Research (I3A), University of Zaragoza, C/Mariano Esquillor s/n, 50018 Zaragoza, Spain
4
Institute for Health Research Aragón (IIS Aragón), 50009 Zaragoza, Spain
5
Department of Organic Chemistry I, Faculty of Pharmacy and Lascaray Research Center, University of the Basque Country (UPV/EHU), Paseo de la Universidad 7, 01006 Vitoria-Gasteiz, Spain
6
Instituto de Ciencia de Materiales de Aragón (Universidad de Zaragoza-CSIC), Facultad de Ciencias, 50009 Zaragoza, Spain
7
Biomedical and X-ray Physics, Department of Applied Physics, KTH-Royal Institute of Technology, 10691 Stockholm, Sweden
8
R&D Animal and Human Health, Bioibérica S.A.U., 08029 Barcelona, Spain
9
Bioaraba Health Research Institute, Jose Atxotegi, s/n, 01009 Vitoria-Gasteiz, Spain
*
Authors to whom correspondence should be addressed.
Authors contributed the same.
Pharmaceutics 2021, 13(9), 1473; https://doi.org/10.3390/pharmaceutics13091473
Submission received: 10 June 2021 / Revised: 3 September 2021 / Accepted: 7 September 2021 / Published: 15 September 2021

Abstract

:
Modifying hydrogels in order to enhance their conductivity is an exciting field with applications in cardio and neuro-regenerative medicine. Therefore, we have designed hybrid alginate hydrogels containing uncoated and protein-coated reduced graphene oxide (rGO). We specifically studied the adsorption of three different proteins, BSA, elastin, and collagen, and the outcomes when these protein-coated rGO nanocomposites are embedded within the hydrogels. Our results demonstrate that BSA, elastin, and collagen are adsorbed onto the rGO surface, through a non-spontaneous phenomenon that fits Langmuir and pseudo-second-order adsorption models. Protein-coated rGOs are able to preclude further adsorption of erythropoietin, but not insulin. Collagen showed better adsorption capacity than BSA and elastin due to its hydrophobic nature, although requiring more energy. Moreover, collagen-coated rGO hybrid alginate hydrogels showed an enhancement in conductivity, showing that it could be a promising conductive scaffold for regenerative medicine.

Graphical Abstract

1. Introduction

Hydrogels are three-dimensional scaffolds made up of highly hydrophilic polymers. Because they absorb so much water, these hydrogels swell, representing a high degree of flexibility, closer to that of natural tissue [1]. Hydrogels also represent high porosity, excellent biocompatibility, and controllable degradability [2], triggering their application in biomedicine including, applications of soft contact lenses in the correction of vision [3], developing a tissue engineering process [2,4,5], diagnostics [6], and embolizing cells [7]. Depending on the type of bonding, these hydrogels can be classified as either physical or chemical. Physical bonding, such as hydrogen bonding, and hydrophobicity result in physical gels, which are often reversible and affected by environmental factors [1]. Chemical gels, in contrast, are formed by covalent bonding between polymers. These hydrogels are permanent and stable [8,9].
However, there are many limitations to the applications of nature hydrogels in clinical applications. These include high water content, large pores, weak mechanical strength, and fast drug release [3,10].
In the course of time, natural hydrogels have been gradually replaced by synthetic hydrogels that have a longer half lifetime and high mechanical strength [11].
Incorporating a special chemical group into the hydrogel will improve its functionality and allow the hydrogel to be switched by heat, light, magnetic fields, chemical agents, or pH alterations [2,12,13]. Functionalized hydrogels with therapeutic peptides and proteins are also possible. These can be used to treat diseases, such as cancer, immune disorders, mental disorders, hypertension, and certain cardiovascular and metabolic problems.
Extracellular matrix (ECM) is a non-cellular component of tissue that provides physical support to cells. Emerging research has shown that ECM provides tissue-specific biochemical and biophysical cues required for tissue morphogenesis [14].
For decades, alginate was considered one of the best biomaterials for assembling and fabricating functional hydrogels, owing to its excellent biocompatibility and high porosity [15,16]. However, several drawbacks, such as its mechanical strength, weakness, the leak of cell adhesion, and its rapid drug release, have limited its clinical application [17,18]. To solve these drawbacks, different materials have been integrated into the alginate matrix, also creating biomimetic support. In this regard, graphene has been applied in various fields based on this excellent characteristic, including electronics [19], being considered a strong candidate in the field of biomedicine, both for fabricating drug delivery vehicles and gene therapy [19,20,21,22]. However, studies with graphene are contradictory [22]. On one hand, some reports describe graphene as a material that does not cause any alteration in cell function [23,24], with acceptable hemocompatibility, and without induction of immune response, even at high concentrations [24]. On the other hand, reports show a cytotoxic effect even at a low dosage [23,25]. Graphene oxide (GO), a derivative from graphene, can be produced through Hummer’s method [26,27,28,29,30] and shows unique physical and mechanical properties, including high thermal conductivity [26,31,32], colossal surface area [33,34], and a robust mechanical strength [35,36]. The oxidation process of graphene alters the surface of graphene, increasing its affinity to water [37,38] and, therefore, mediating a vast number of biochemical reactions and bio-conjugations along its surface [39]. GO biocompatibility is affected in two-dimensional cultures by factors such as GO surface processing and the particle size of surface functionality, with impact on adhesion or cell proliferation [40]. In this regard, our group combined GO with alginate to modify alginate surface properties and its mechanical strength, showing good biocompatibility with myoblasts in alginate microcapsules, within a range of GO concentrations. Concisely, GO concentrations between 25 and 50 µg/mL enhanced the viability of C2C12 myoblasts [16,40,41,42]. However, the integration of GO within alginate matrices reduced the release of therapeutic factors, since GO could sorb the secreted therapeutic factors on its surface due to its high surface activity. GO sorption was solved by applying a pre-coating layer on the GO surface with fetal bovine serum [16,40,41,42].
An alternative graphene derivate is reduced GO, with low surface absorbability compared to GO [43]. Several techniques have been utilized to reduce GO, including mechanical reduction or chemical reduction [43], adding alterations in rGO surface, such as the chemical structure and hydrophilicity [37,44]. However, there is again conflicting information comparing the biocompatibility of GO and rGO [43,45,46]. It has been described that the irradiated light reduction in GO yields an immense reactive oxygen species generation and oxidative stress [43], while the small particle size of thermally reduced oxide can stimulate cytotoxicity, facilitating its cell membrane penetration [43]. However, chemically reduced rGO shows lower toxicity than other rGO forms [47]. Modified scaffolds with rGO have shown strong mechanical strength and ultra-high electrical conductivity [48], with favorable impacts on cell viability, proliferation, and differentiation [48]. Hydrothermal processing of alginate and graphene oxide in an aqueous solution yields hybrid alginate-rGO hydrogels with high porosity. In the hydrothermal process, graphene nanosheets and alginate form a porous structure as a result of auto-assembly; afterwards, the hybrid hydrogel is produced by ionically linking polymer networks of alginate [49]. Thus, rGO has become more applicable in tissue engineering, particularly for neuronal regeneration [48,50] or cardiomyocytes regeneration [51]. Here, we are using reduced graphene-based materials, as it is one of the best redox species that could be studied on an electrode. The redox peaks will give a clear indication of changes to the double layer on the electrode’s surface. When rGO-protein-alginate is incorporated over an electrode the double layer changes, this can affect the double-layer capacitance and the electron transfer resistance. Therefore, by monitoring the charge transfer resistance, we could understand the charge transfer properties of the double layer. Cyclic voltammetry (CV) and electrochemical impedance spectroscopy (EIS) are interrelated electroanalytical methods to examine the electrochemical double layer on the electrodes. In this work, we aimed to create conductive protein-rGO-alginate hydrogels using different proteins in order to study their adsorption capacity and electrochemical characteristics to identify the best composition.

2. Materials and Methods

2.1. Materials

The chemically reduced graphene oxide (rGO) powder was provided by Graphenea (San Sebastian, Spain). Bovine Serum Albumin (BSA) and type 1 Collagen were purchased from Sigma Aldrich (Saint Louis, MO, USA). Elastin was provided by Bioiberica (Barcelona, Spain). High pure, low-viscosity, and ultra guluronic (LVG) acid alginate was purchased from FMC Biopolymer (Drammen, Norway).

2.2. Protein Adsorption

rGO powder in a 3/1 mixture of water and DMSO (v/v) to get a suspension of 4 mg/mL rGO, homogenizing by sonication for 60 min in a bath. The resulting rGO dispersion was diluted to 2.5 mg/mL with 18 MΩ cm resistivity deionize water (DI). Then, 90 μL of 200 μg/mL BSA, 200 μg/mL elastin, or 500 μg/mL collagen were mixed with 10 μL of 250 μg/mL rGO suspension for 120 min at 37 °C under agitation at 400 rpm. The samples were spun down at 15,000 rpm for 15 min to collect supernatants. The lack of adsorbed protein was determined with the BCA kit (Thermo Fisher, Massachusetts, MA, USA) in a M 200 TECAN microplate reader (TECAN Trading AG, Männedorf, Switzerland) at 562 nm. At least three samples were quantified to ensure accuracy and repeatability. The % of protein sorption was estimated by Equation (1), and the adsorption capacity qe (µg/µg) was estimated by Equation (2), where C0 (µg/mL) and Ce (µg/mL) are the original protein concentration and the protein concentration at steadiness, respectively, S is the sample volume (mL), and m is the mass of rGO (µg).
Adsorbability (%) = (C0 − Ce) × 100/C0
Adsorption capacity qe = (C0 − Ce) × S/m
Freundlich and Langmuir’s adsorption isotherm models were implemented to estimate the adsorption isotherm. The Langmuir model is displayed in Equations (3) and (4), where the concentration of the adsorbed protein at steady-state is Ce (µg/mL), qe is the adsorption capacity (µg/ug), qmax (µg/µg) is the maximum quantity of protein sorbed per unit mass of rGO, KL (mL/µg) is the Langmuir factor associated with the surface affinity for the protein, C0 is the initial protein concentration, and RL is the separation factor that specifies the Langmuir isotherm’s fundamental aspects [52].
Ce/qe = Ce/qmax + 1/(qmax·KL)
RL = 1/ (1 + KL·C0)
Freundlich model is described as follows (Equation (5)), where KF and m are the Freundlich constant and intensity adsorption, respectively:
Log qe = log KF + 1/m·log Ce

2.3. Kinetics of Protein Adsorption

250 µg/mL rGO was suspended either in 50 µg/mL BSA, 200 µg/mL collagen, or 50 µg/mL elastin by agitation at 37 °C. After spinning down at 15,000 rpm for 10 min, supernatants were collected after the following incubation times: 5, 10, 20, 30, and 80 min. Adsorbed protein was quantified with a BCA kit (Thermo Fisher) in a M 200 TECAN microplate reader (TECAN Trading AG, Männedorf, Switzerland) at 562 nm. At least three samples were quantified to ensure accuracy and repeatability. Intra-particle diffusion model, pseudo-first-order, and pseudo-second-order rate adsorption were applied to the results to determine the most appropriate adsorption kinetic model. At least three samples were quantified for each condition. Several models were evaluated to elucidate the adsorption mechanism and the adsorption rate (Equations (6)–(9)) [16], where qt (µg/µg) is the quantity of the adsorbed protein vs. time (t) (min.), Kp is the intra-particle diffusion rate constant (µg/µg. min1/2), and C (µg/µg) is a constant for the intra-particle diffusion model, which provides a piece of information about the thickness of the barrier layer [52,53], qe (µg/µg) is the adsorption capacity at equilibrium, K1 (min−1) is the constant rate of the pseudo-first-order model, and K2 (µg·µg−1min−1) is the pseudo-second-order model’s constant rate.
qt = Kp.t1/2 + C
log (qe − qt) = log (qe) − (K1·t)/2.303
t/qt = t/qe + 1/K2·1/(qe)2
1/qt = 1/(K2 + qe2)·1/t + 1/qe

2.4. Thermodynamics of Protein Adsorption

250 µg/mL rGO was suspended either in 50 µg/mL BSA, 200 µg/mL collagen, or 50 µg/mL elastin solution. Mixtures with each protein were incubated and agitated at the following temperatures: 5, 10, 15, 25, 37, and 39 °C. After spinning down at 15,000 rpm for ten minutes, supernatants were collected to quantify the amount of non-adsorbed protein with BCA kit (Thermo Fisher) in a M 200 TECAN microplate reader (TECAN Trading AG, Männedorf, Switzerland) at 562 nm. At least three samples were quantified for each condition. The fundamental thermodynamic factors, such as entropy change (∆S°), enthalpy change (∆H°), and Gibbs free energy change (∆G°), were calculated using Equations (10)–(13) [53,54,55], where R is the gas constant (8.314 J/mol K), T the absolute temperature (K), Kd the equilibrium constant, qe (µg/µg) the quantity of protein adsorbed per mass unit of rGO at equilibrium, and Ce (µg/mL) the equilibrium concentration of each protein:
Kd = qe/Ce
∆G° = −R·T·lnKd
lnKd = −∆H/R·T + ∆S/R
∆G° = ∆H − T∆S

2.5. Characterization of the rGO-Protein Binding

The binding of each protein to rGO surface was studied by Raman and Fourier transform infrared spectroscopy. First, 250 µg/mL rGO was suspended either in 50 µg/mL BSA, 200 µg/mL collagen, or 50 µg/mL elastin solution, and agitated at 37 °C for 2 h. The supernatants were collected after spinning down at rpm for 15 min and lyophilized in a Telstar Lyobeta 15 lyophilizer. rGO without protein incubation and proteins without rGO were also studied. At least three samples were studied for each condition.
Raman spectrum was obtained by confocal Raman imaging (Alpha 300 M, Company WITec, Ulm, Germany) with a 532 nm laser (5% laser power, a contact time of the 50 s, and four accumulations). FT-IR, using an attenuated total reflectance (ATR) technique, was performed in a FT-IR Bruker IFS 66/S Spectrometer, with 32 scans at a resolution of 4 cm−1 between the wavelength ranges of 4000–400 cm−1. Air background was applied as a blank. At least three samples were analyzed for each condition.

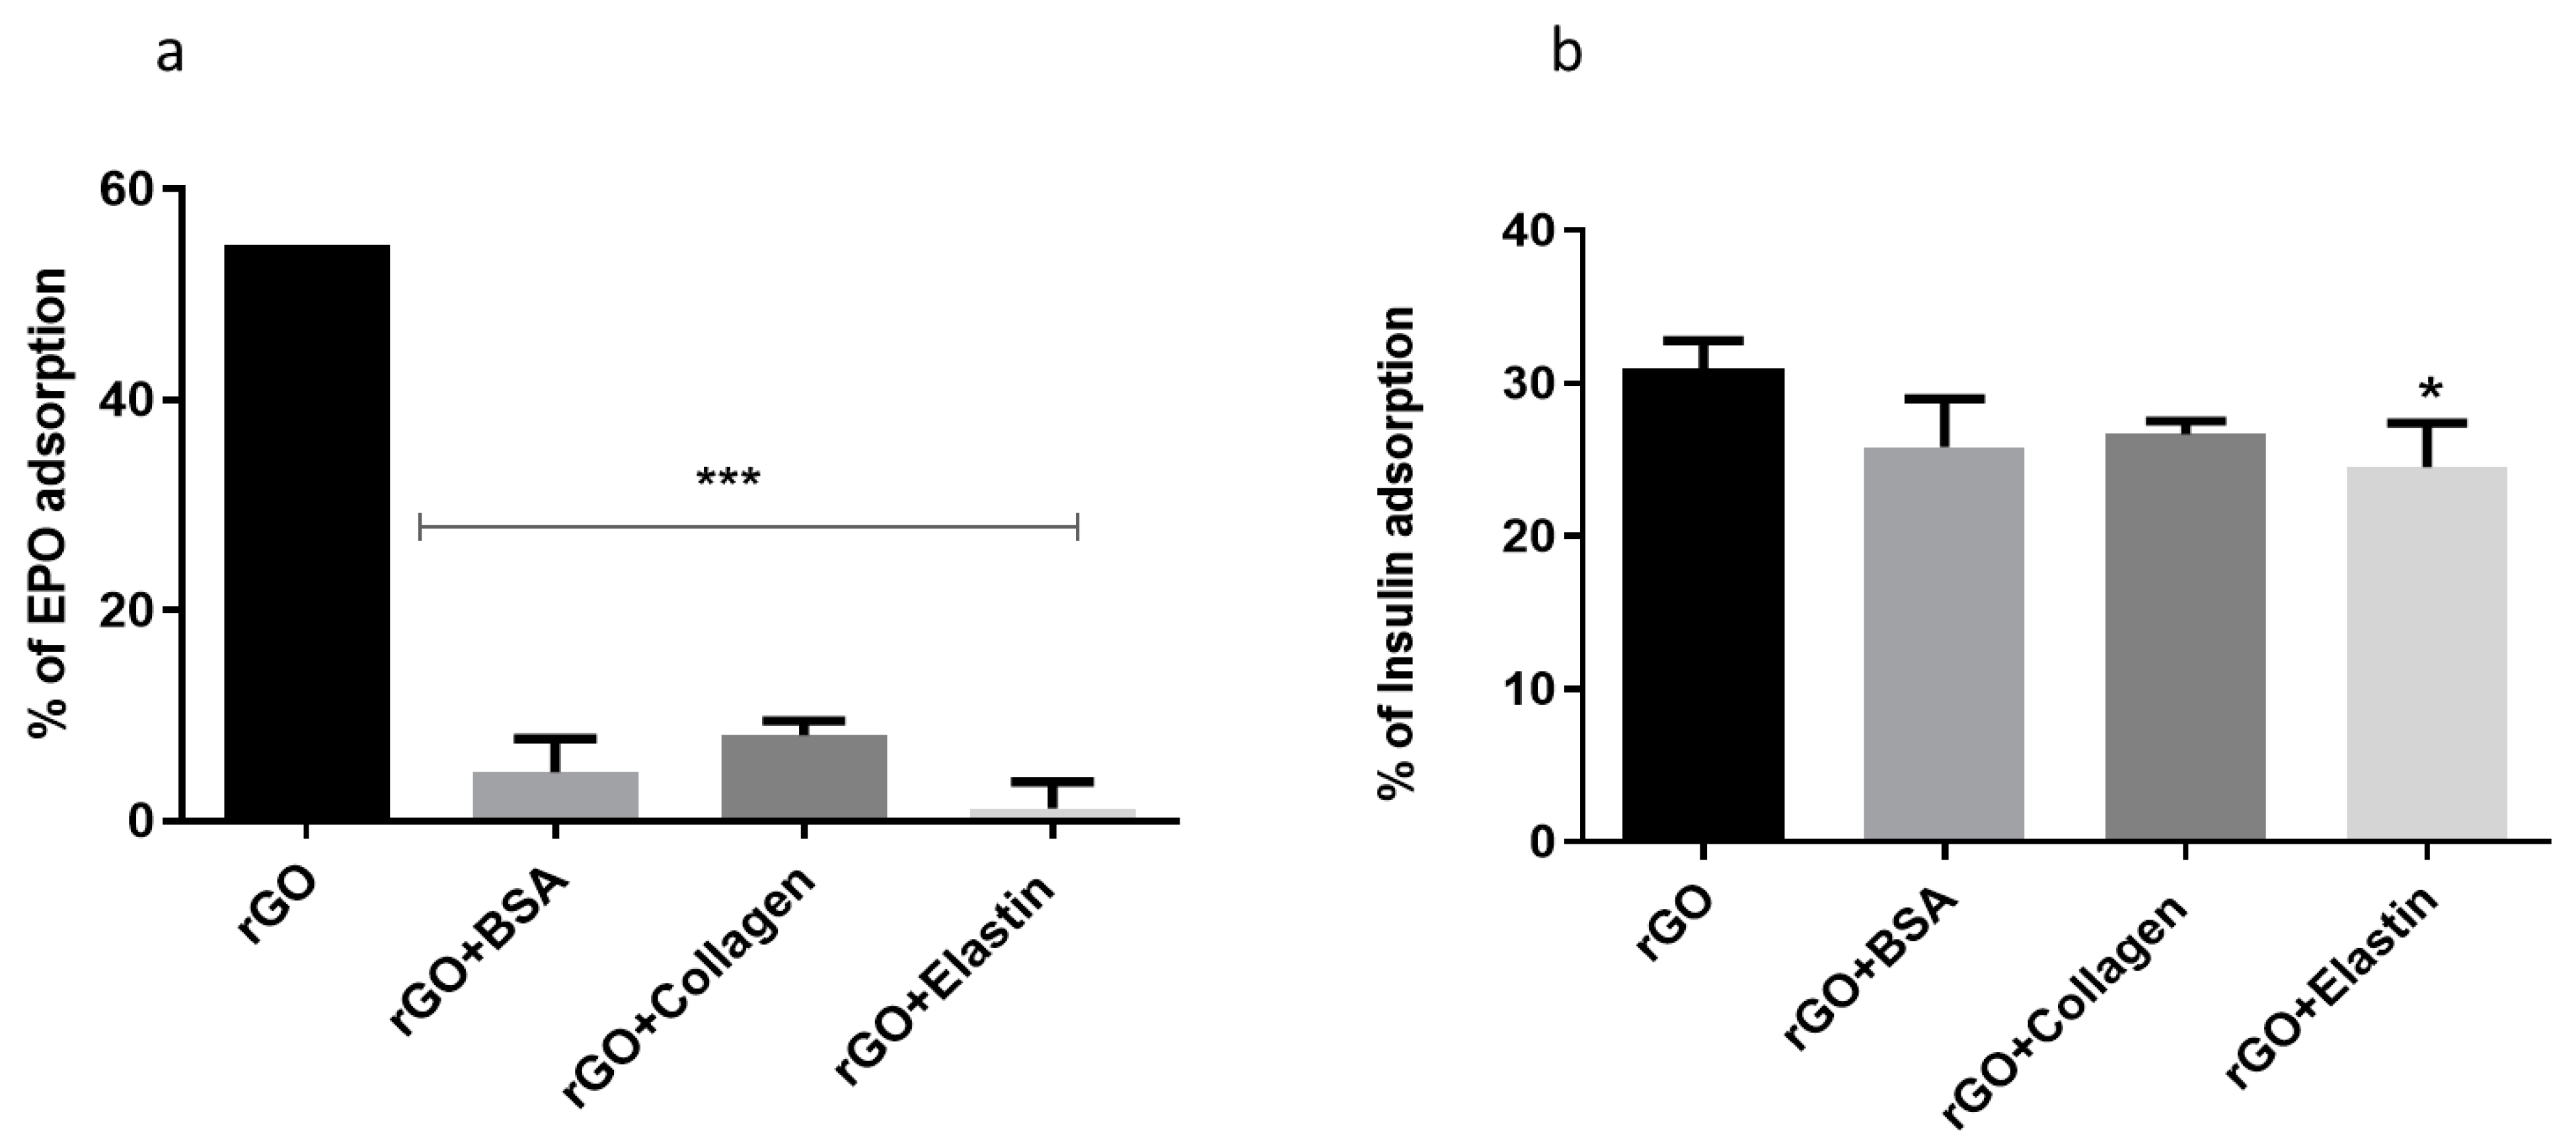
2.6. EPO and Insulin Adsorption Blocking Study

100 µg/mL rGO was suspended either in DI water, 50 µg/mL BSA, 200 µg/mL collagen, or elastin and incubated for two hours at 37 °C. After being spun down at 15,000 rpm for 15 min, supernatants were removed, and protein-coated rGO was incubated with 200 µL of 200 mIU/mL recombinant EPO or 150 mIU/mL recombinant insulin for 24 h at 37 °C. Uncoated rGO was used as a reference. Next, samples were spun down by centrifuging for 15 min at 15,000 rpm and supernatants were collected. Non adsorbed EPO and insulin were quantified with Quantikine IVD EPO (R&D Systems) and Insulin Elisa (Mercodia), respectively, following manufacturer recommendation. At least three samples were analyzed for each condition.

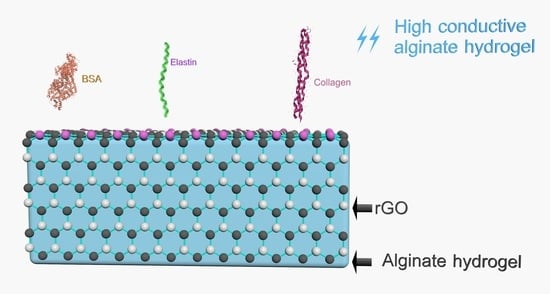
2.7. Preparation of Alginate Hydrogels Containing rGO and Protein-Coated rGO

At room temperature, 1.87 g of high pure sodium alginate was dissolved in 1% mannitol by magnetic string at 200 rpm for 2 h; then, it was mixed and homogenized with either rGO or protein-coated rGO suspension, obtaining a final concentration of 1.5% alginate and 50 μg/mL rGO. To prepare hybrid alginate hydrogels, alginate solutions were mixed with 60 μL of 1.22 M calcium sulfate through a connector (Braun) between two Luer Lock syringes (BS Syringe). The mixed solutions were dispensed between two glass slides with 2 mm spacing, leaving them for 30 min to form hydrogel disks, 14 mm in diameter.

2.8. Conductivity of Alginate Hydrogels Containing Protein-Coated rGO

Electrochemical impedance spectra (EIS) were measured using a potentiostat (Princeton Applied research, Oak Ridge, TN, USA), with a screen-printed electrode (Dropsens, Oviedo, Spain) based on carbon, and a silver electrode as reference. Samples were immersed in 0.1 M PBS buffer at room temperature, applying frequency series from 10−1 to 105 Hz. Cyclic Voltammetry (CV) measurements were performed in 0.1 M PBS buffer between the potential range from −0.2 to 0.5 V and at different scan speeds (100 mVs−1). Specific capacitance was estimated from CV curves by Equation (14) [16,56], where C (F·g−1) is the specific capacitance, Q the mean charge throughout the charging and discharging procedure, the potential range V (Volt), and the mass m (g) of the hydrogel disk:
C = Q/(2Vm)

2.9. Statistical Analysis

Statistical analysis was performed with GraphPad Prism 9.0 (GraphPad Inc., San Diego, CA, USA) and SPSS (version 27.00, IBM, New York, NY, USA) software. Results were presented as mean ± standard deviation. A normality test was performed, considering p < 0.05 as statistically significant values after ANOVA and Tukey’s post hoc test bivariate correlation testing.

3. Results and Discussion

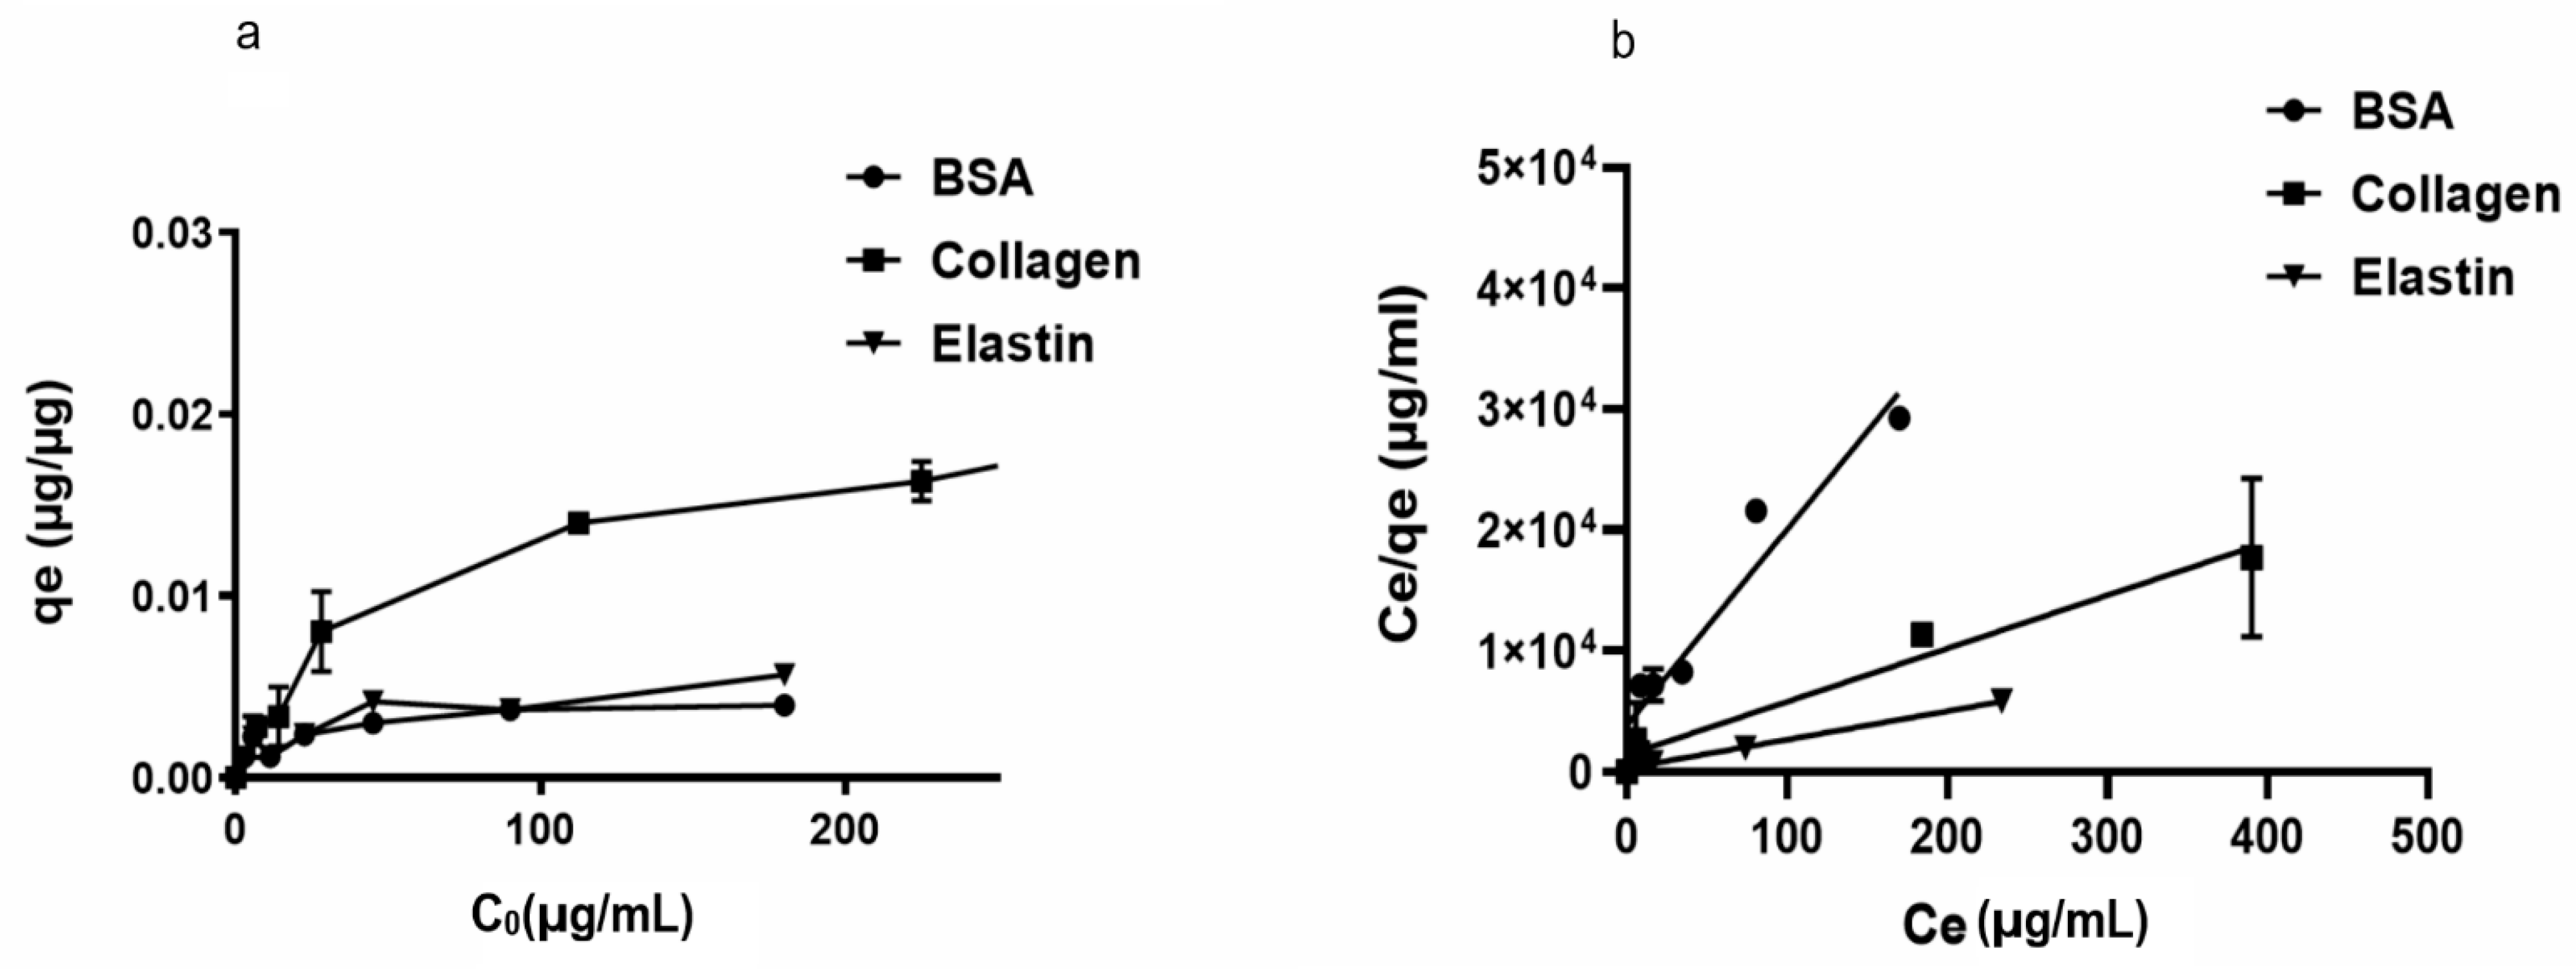
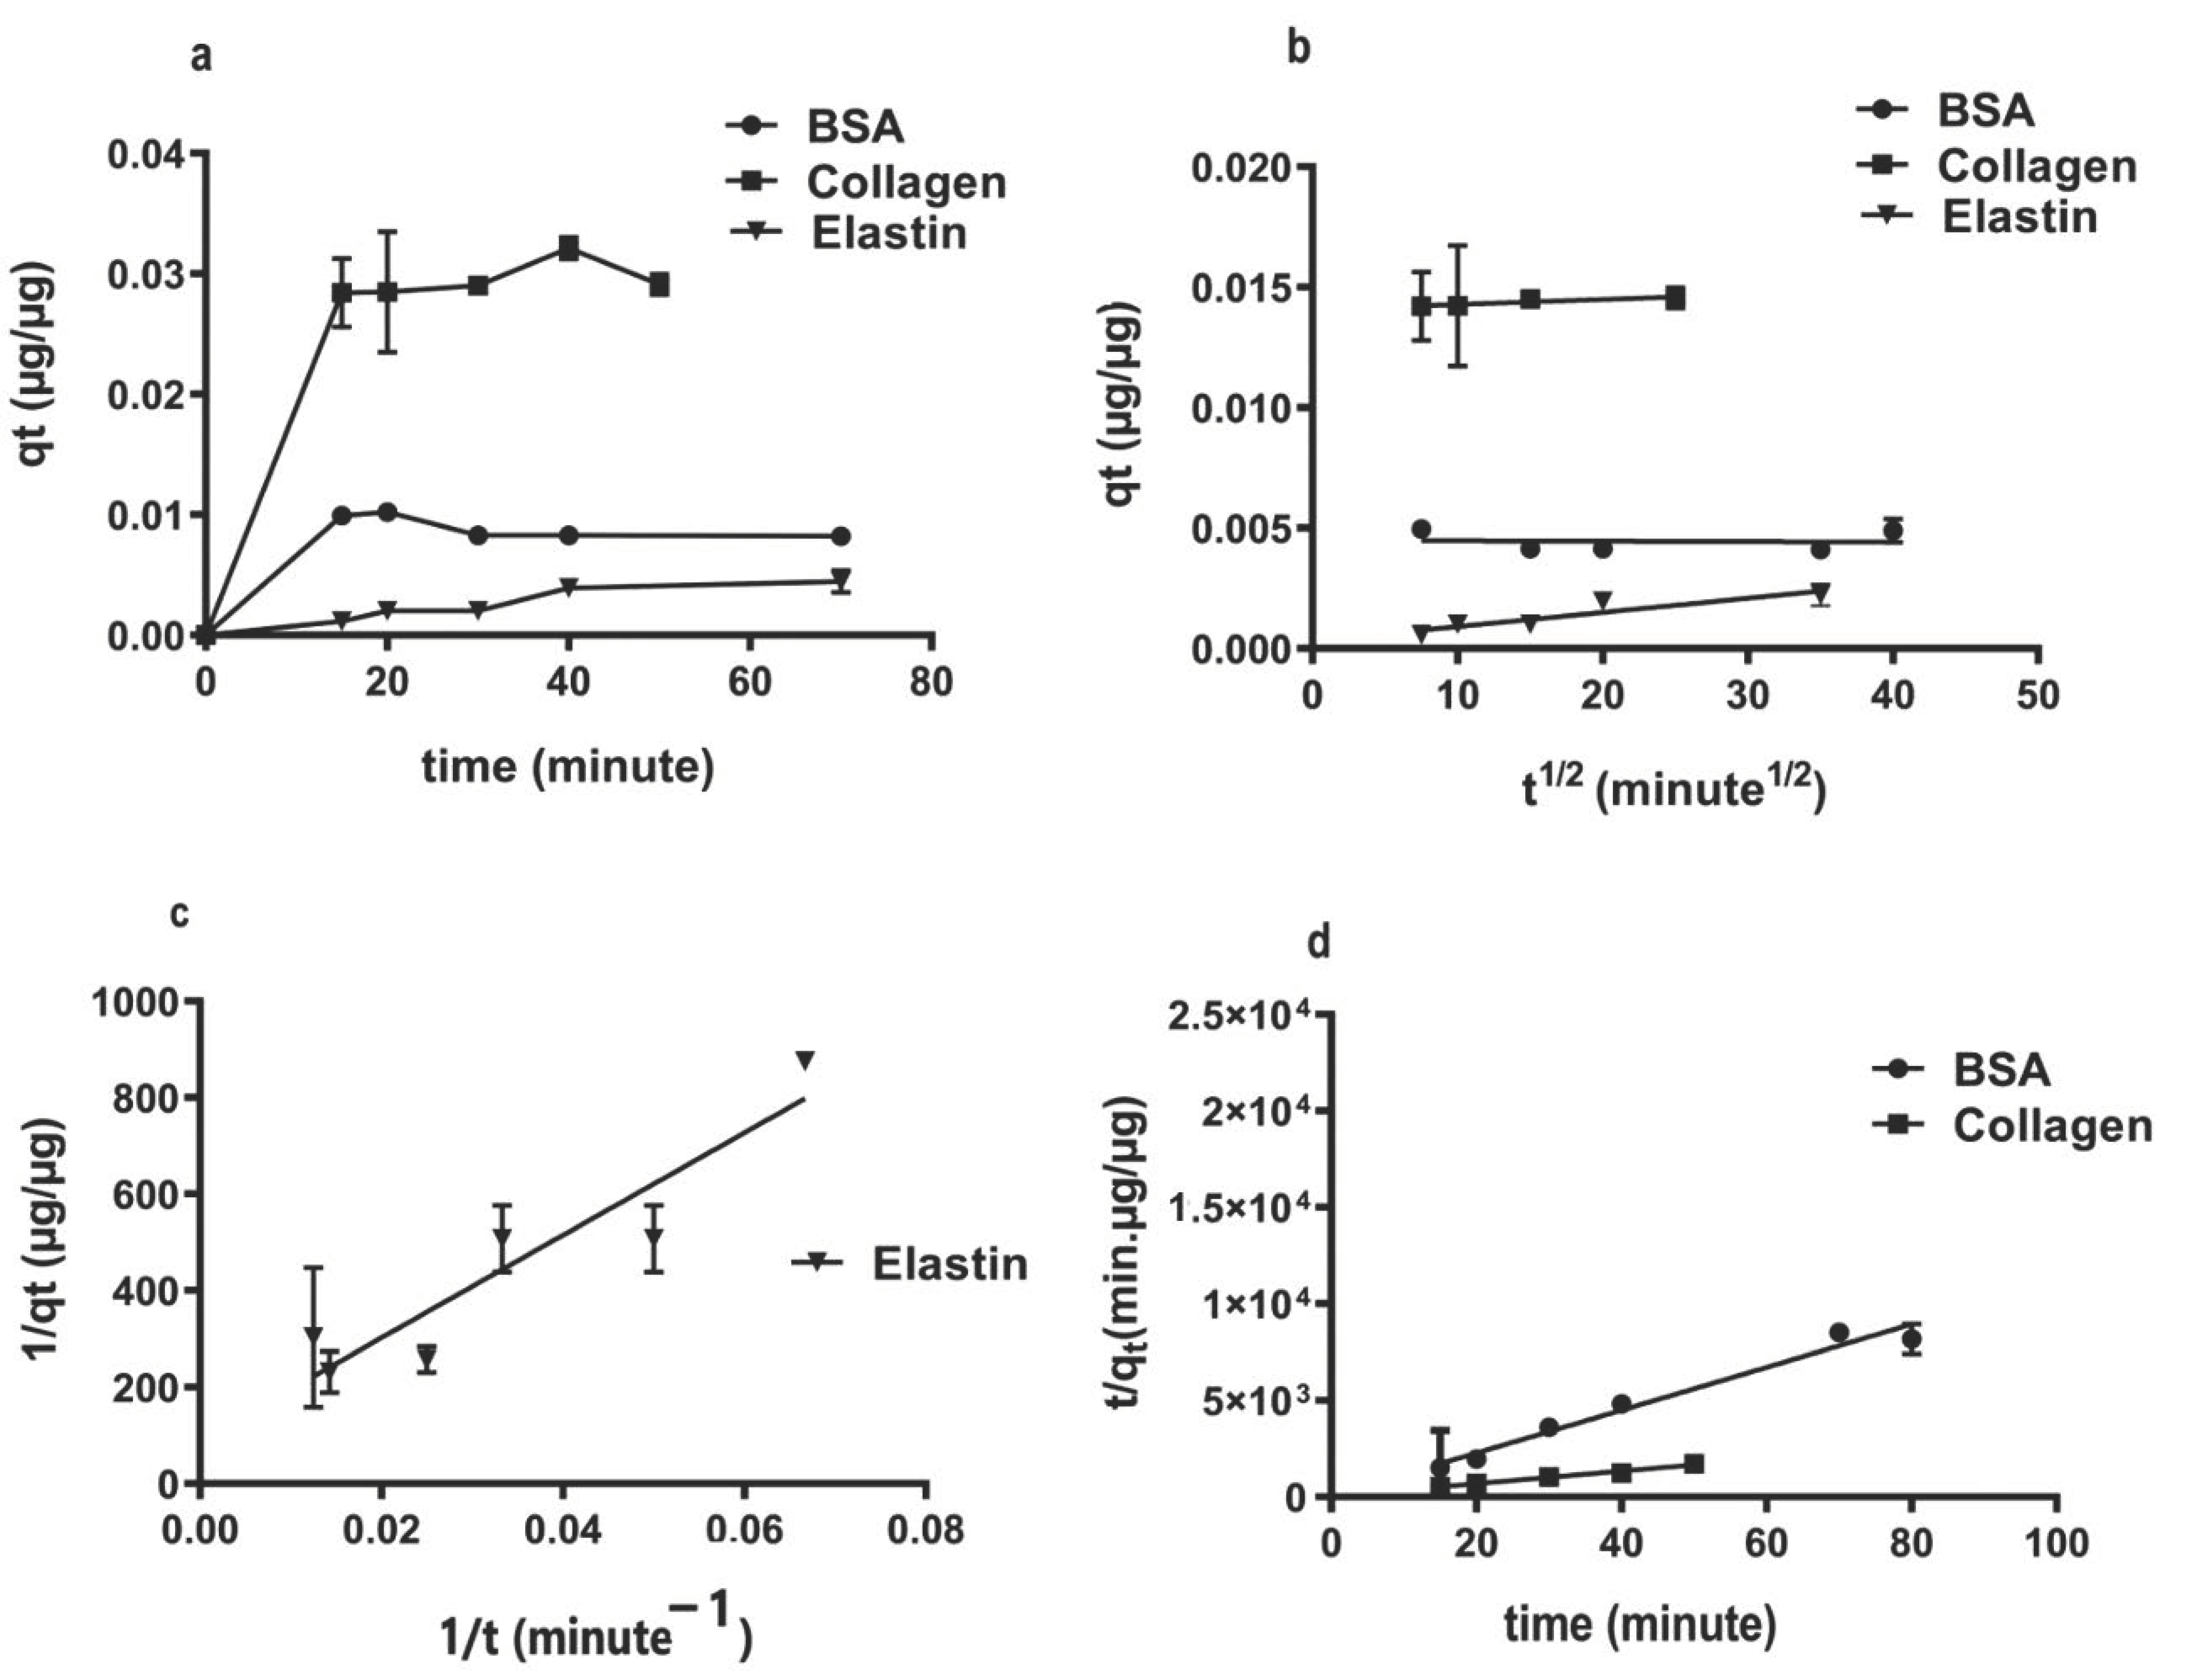
3.1. Adsorption of Proteins on rGO Surface

We began studying the adsorption capacity of rGO to several proteins usually located in FBS. Thus, we observed that rGO adsorption capacity (qe) was enhanced at low protein dose values, indicating the presence of available active groups on the rGO surface. However, no significant modifications in qe values at high initial protein doses (Co) were quantified, suggesting that no further protein loading on the rGO surface was allowed. Among the studied proteins, collagen showed the highest adsorption capacity (qe = 0.022 µg/µg), while other hydrophilic proteins, such as BSA and elastin showed a low affinity for rGO surface (qe between 0.0049–0.0067 µg/µg) (Figure 1a).
In order to understand the adsorption phenomena involved on rGO surface, Langmuir and Freundlich’s models were applied to the qe values recorded at a constant temperature, calculating the required parameters for the aforementioned models (Table 1 and Figure 1b). Protein adsorption phenomena on the rGO surface was better specified by the Langmuir than the Freundlich model, with R2 values between 0.968 and 0.996 for the Langmuir model and convergence between calculated qmax values and experimental qe results. Therefore, we suggest that adsorption phenomena occur on a homogeneous surface of rGO, with a specific number of adsorption sites on rGO surface binding to protein active sites and forming a monolayer [56]. In fact, Langmuir variable values (RL) < 1 would suggest advantageous adsorption onto the rGO surface for the studied proteins, with irreversibile adsorption for collagen and elastin (RL ≈ 0) [57].
Studying the adsorption capacity (qt) of rGO over time, we observed a quick adsorption process, completed after 20 min (Figure 2a). The intraparticle-diffusion model was implemented to attain a suitable mechanism that fits the protein adsorption on rGO surface (Figure 2b). However, since qt vs. t1/2 plotting showed linearity without going across zero, we think that intraparticle-diffusion is not the only process controlling protein adsorption on the rGO surface; film diffusion also contributes to the protein adsorption [40]. Calculated intraparticle-diffusion parameters, such as the diffusion rate constant (KP) and the impediment layer wideness (C) (Table 2), showed collagen with the highest intra-particle diffusion rate Kp (0.0001 µg·µg−1min−1/2) and boundary layer thickness (0.0132), correlating to a strong hydrophobic attraction between collagen and the hydrophobic rGO surface. This result suggests that π–π bonding between collagen and rGO might also be responsible for this bonding [57]. However, the hydrophilicity of BSA and elastin would result in the decrease in interference forces and therefore the affinity with rGO.
Among adsorption kinetic mathematical models, the low R2 values calculated in the pseudo-first-order model (0.35–0.82), with vast difference between estimated qe and experimental qt (Table 2), discarded this model for describing adsorption phenomena on the rGO surface. However, the pseudo-second-order model showed high R2 values (0.93–0.99) and convergence between the estimated qe and the experimental qt values (Table 2); therefore, this model can be considered the best kinetic model to define the studied protein adsorption phenomena on the rGO surface [58,59]. Interestingly, pseudo-second-order constant K2 reduced while hydrophilicity increased with the lowest K2 for elastin (2.16·µg−1·in−1) and with the highest for collagen (27.27 µg·µg−1·min−1). Representing qt values versus time, while a linear pseudo-second-order plot was more suitable for collagen and BSA (Figure 2c), a nonlinear pseudo-second-order plot was fit for elastin adsorption (Figure 2d) [60]. Collagen showed a ten-fold higher adsorption rate constant (K2) than BSA and elastin, indicating the highest affinity for rGO than elastin or BSA and due to the strong hydrophobic–hydrophobic interactions between rGO surface and collagen [61].

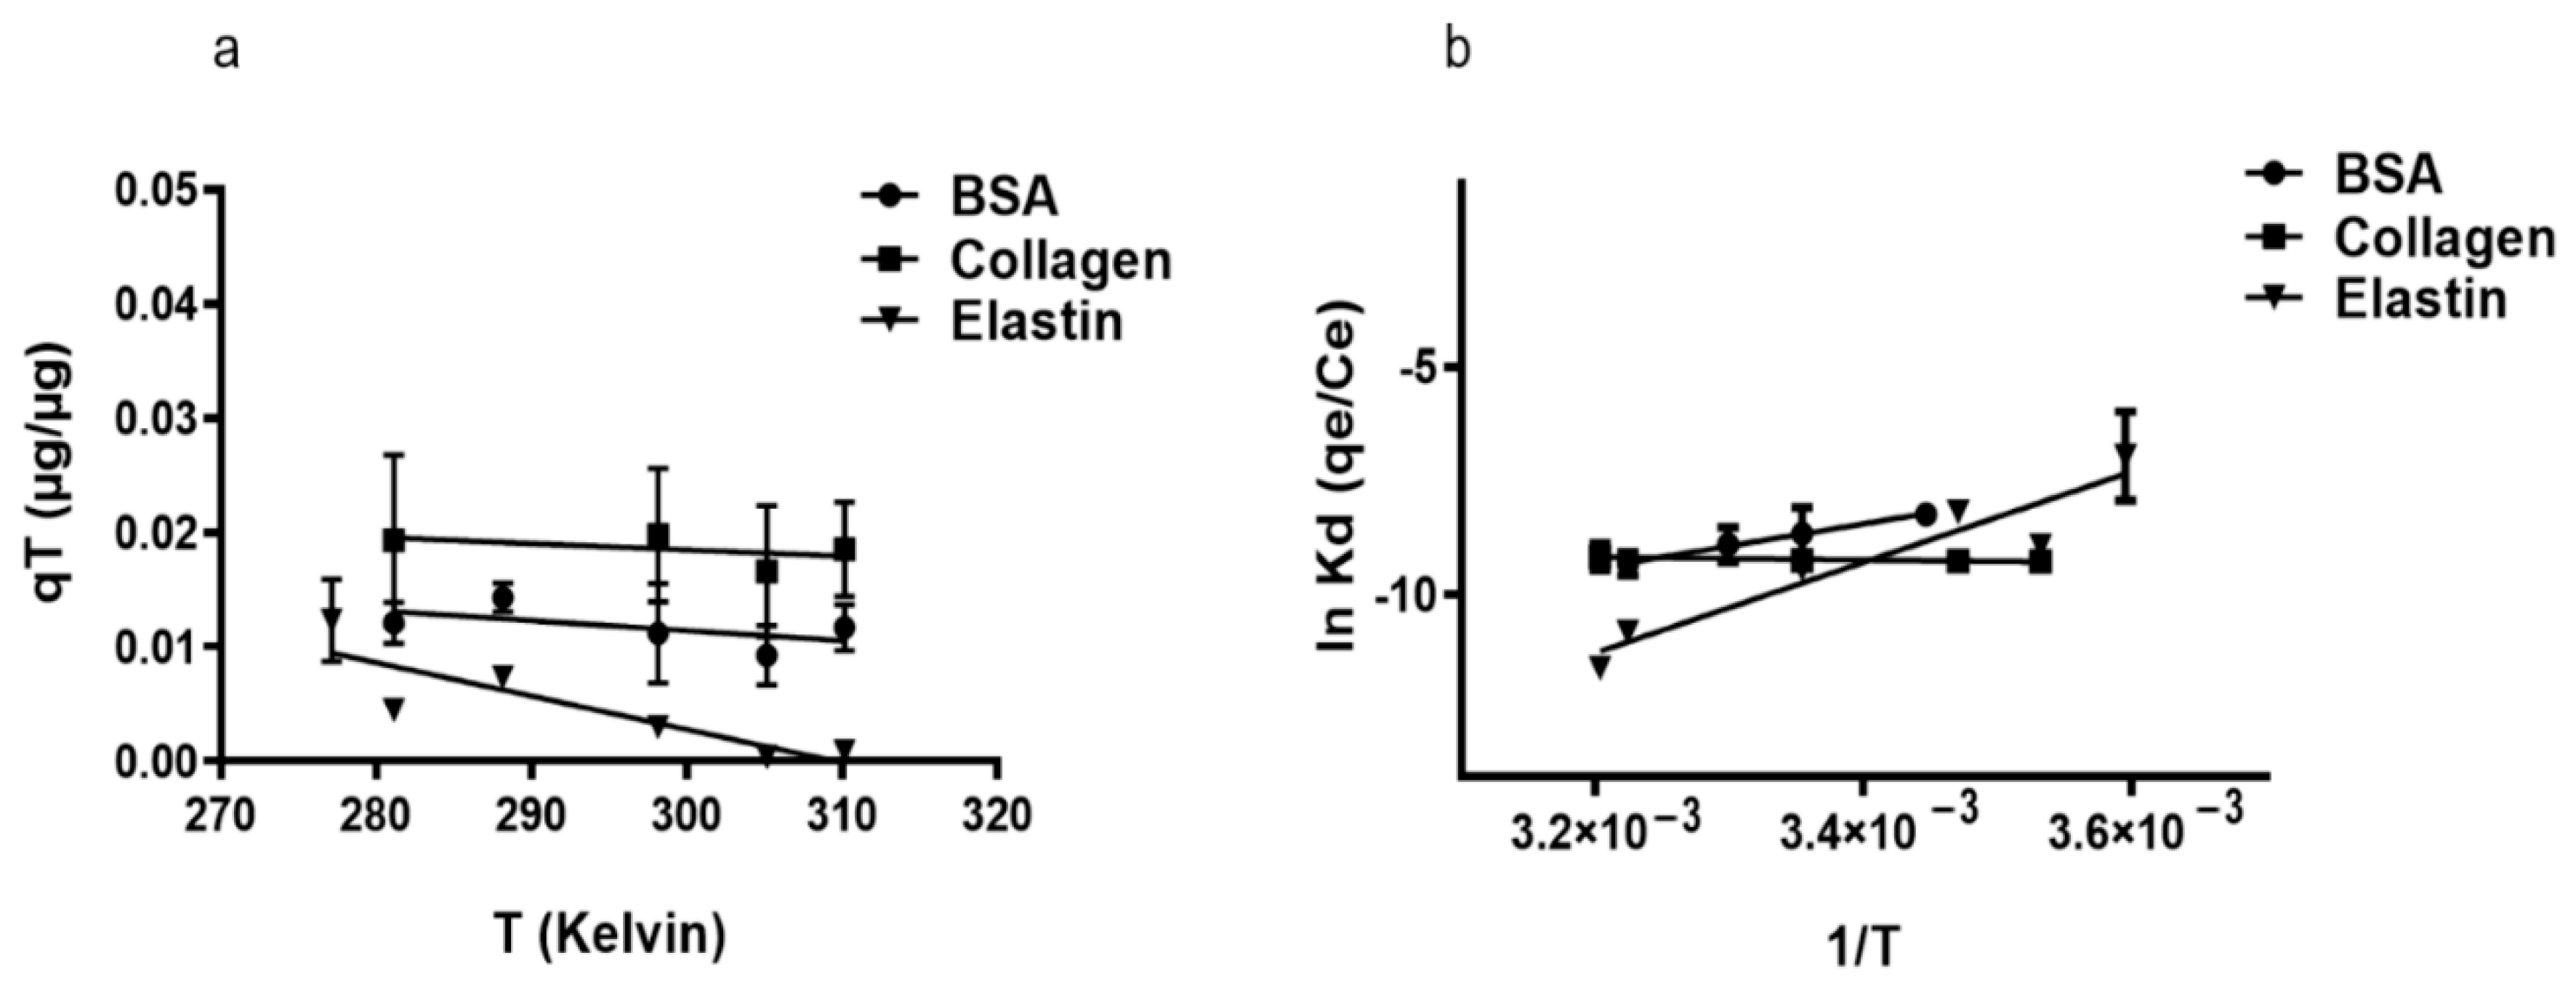
3.2. Thermodynamics of Protein Adsorption onto rGO Surface

The study of adsorption capacity (qT) with BSA and elastin on rGO surface increasing temperature revealed the exothermic character (∆H° < 0) of the adsorption (Figure 3a, Table 3). However, collagen showed endothermic adsorption when the temperature was increased (∆H° = 2.44 kJ/mol). We consider that the protein adsorption could start with an endothermic hydration step, followed by exothermic adsorption, but in collagen, there would be a hydration step caused by its hydrophobic nature that requires more energy than the other studied proteins [62]. This hypothesis would explain why an increase in the temperature would enhance the adsorption capacity of collagen, while it would increase the kinetic energy of BSA and elastin causing their elution from rGO surface. Moreover, the low ΔG° values (Table 3) indicated the physio-sorption nature of the adsorption [58], a non-spontaneous phenomenon that is a feature of positive ΔG° values. It could be attributed to the presence of an energy barrier in the migration of the studied proteins towards the rGO surface, with water forming a hydration shell around the proteins that would hinder their adsorption on rGO. Finally, the remarkable reduction in entropy during the adsorption of the studied proteins [58] suggests that molecular motion at the solid–liquid interface is more organized [63].

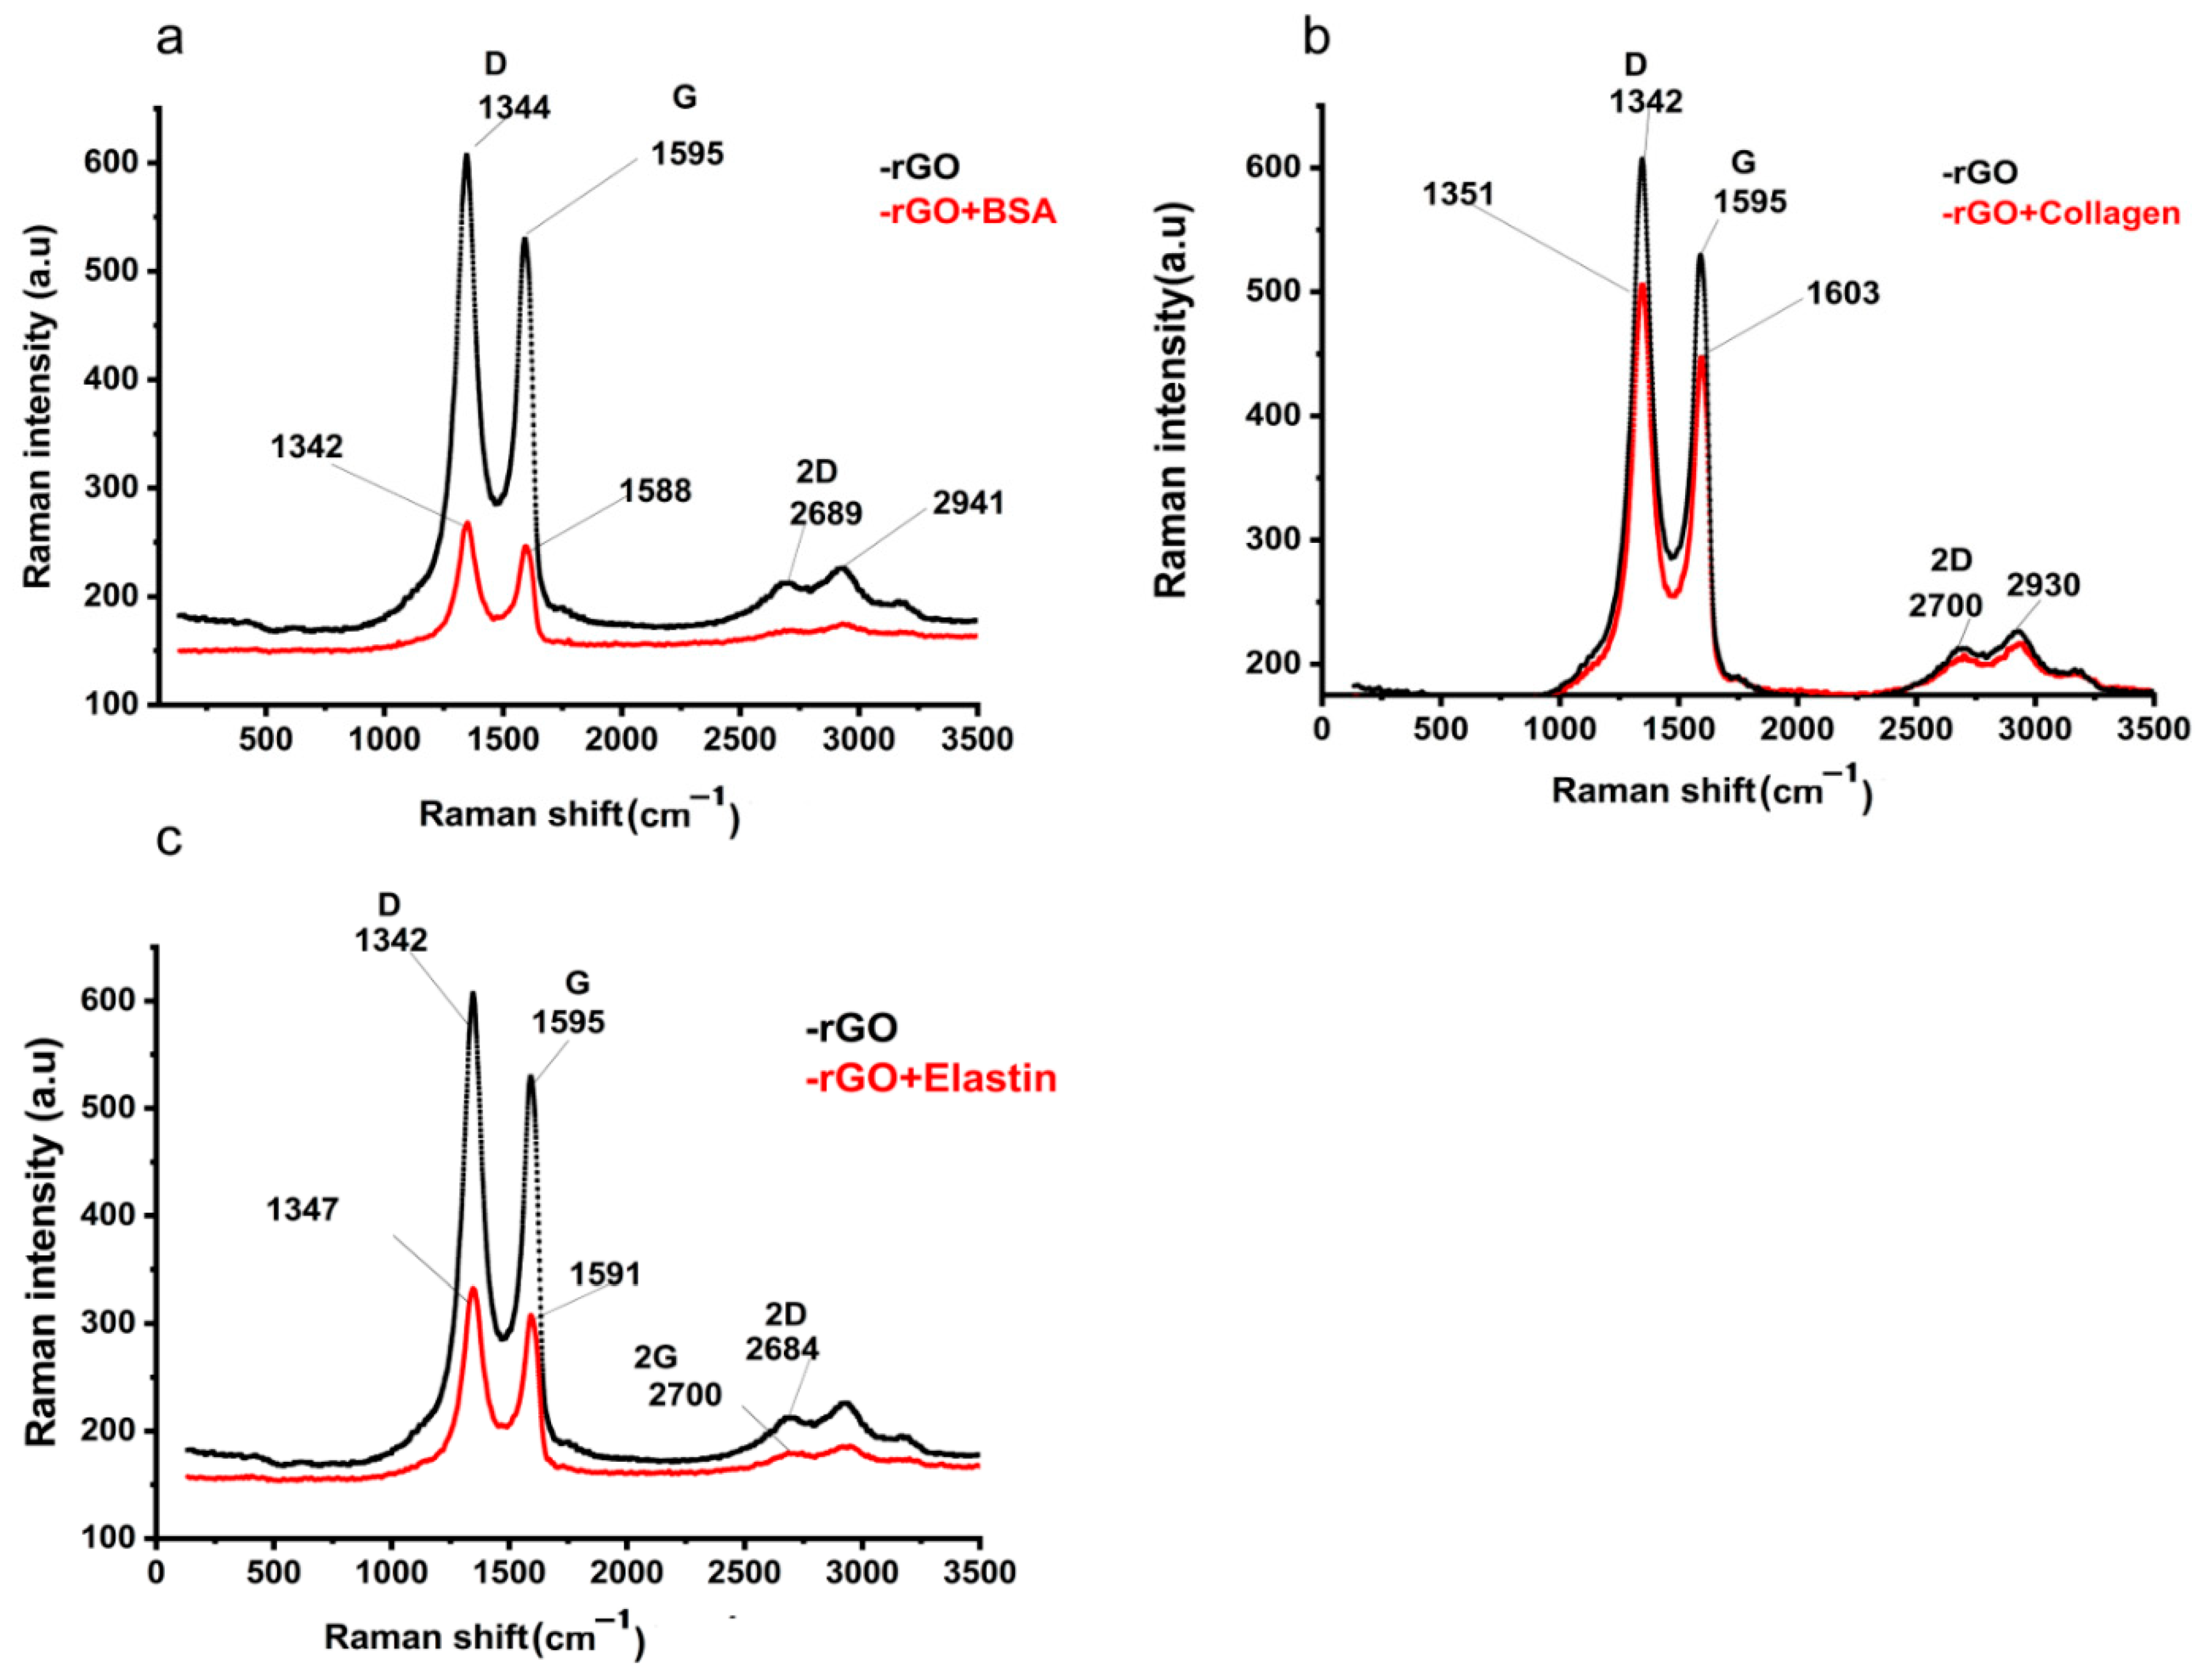
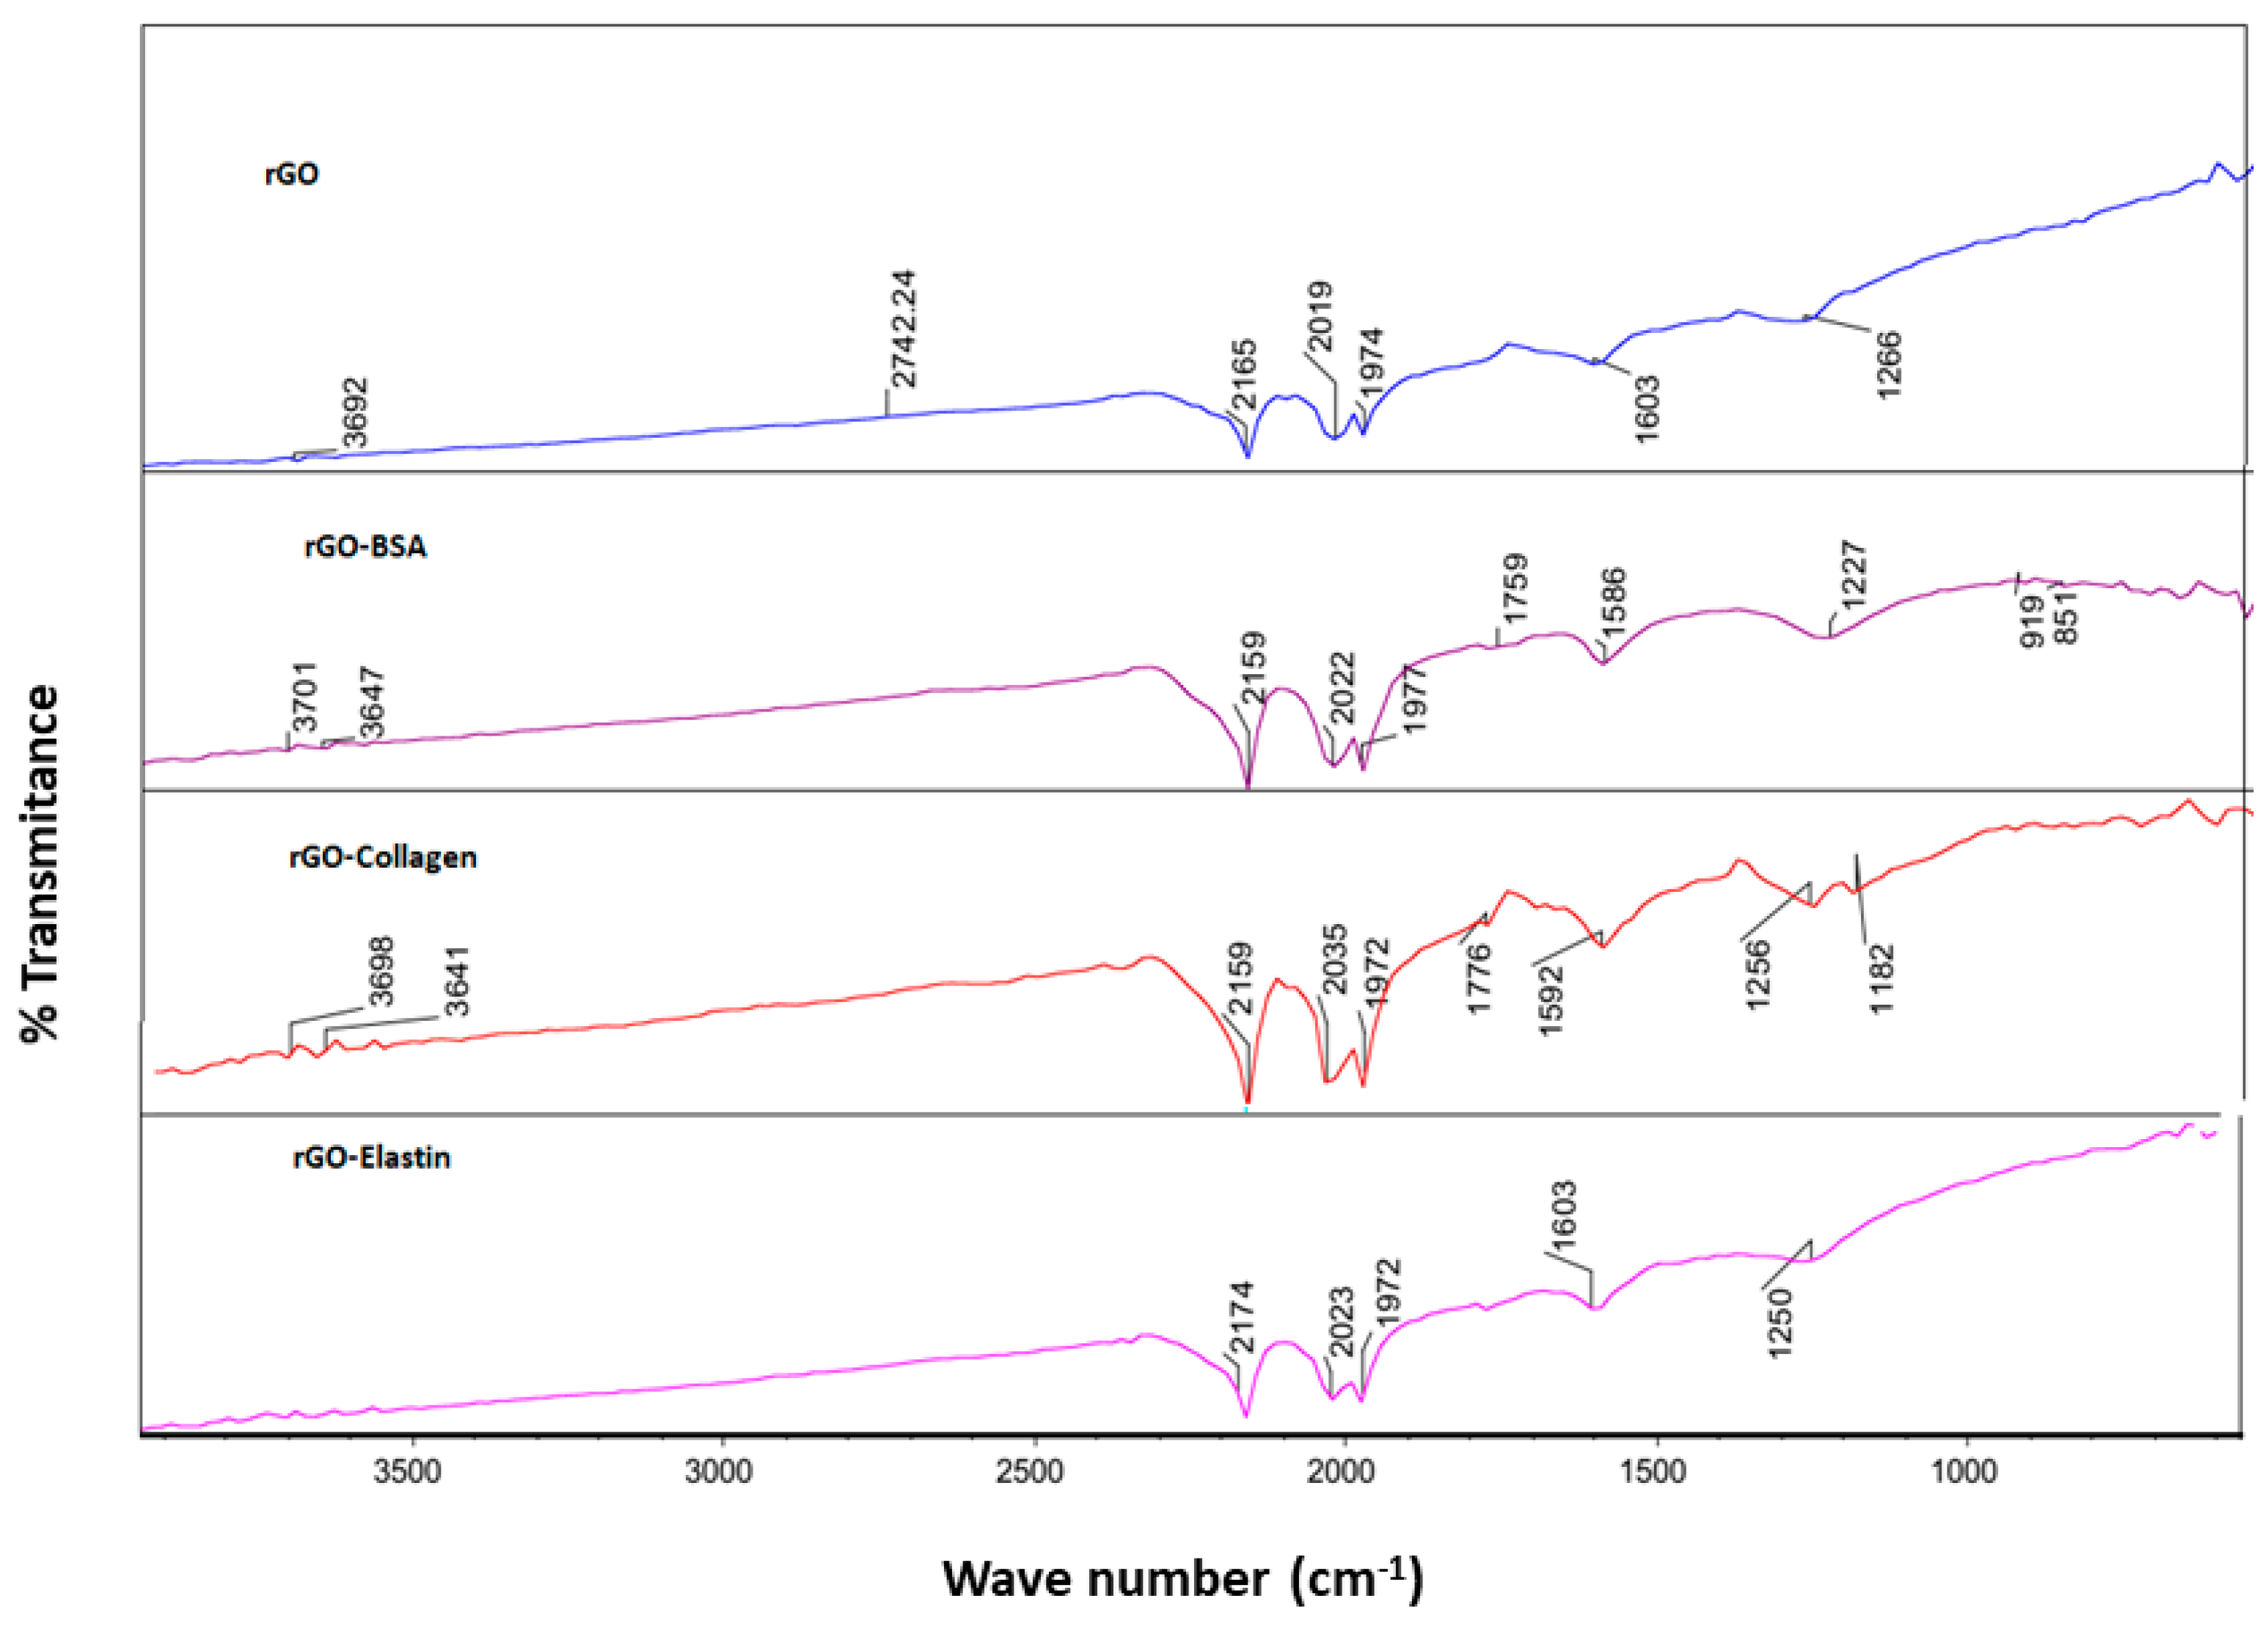
3.3. Surface Chemistry of Protein Adsorbed rGO

In order to confirm the adsorption of the studied proteins onto the rGO surface, we studied rGO and protein-adsorbed rGO by Raman spectroscopy and FT-IR. In Raman spectra, G and D bands at ~1595 cm−1 and ~342 cm−1 in rGO Raman spectrum indicated the occurrence of defects due to the reduction process of GO [52] (Figure 4a), also detected in protein adsorbed-rGO samples (Figure 4b–d). After proteins were adsorbed on the rGO surface, the G and D bands shifted to ~1588–1601 cm−1 and ~1342–1351 cm−1, respectively. The intensity ratio between those bands (ID/IG) suggested an sp2 electron distribution in all the samples [63], being higher than those ID/IG ratios previously described in graphene [64], and slightly increased when proteins were adsorbed on rGO (Table 4). Finally, the 2D band position and their intensity ratio with G band (2D/G) increase would indicate more structural defects, most likely attributed to protein adsorption on rGO [65], confirming the adsorption of the studied proteins on the rGO surface [66].
Then, we confirmed the adsorption of the studied proteins on the rGO surface by FT-IR using an attenuated total reflectance (ATR) technique. Thus, we detected an absorption peak in rGO sample at 1603 cm−1 related to C=C stretching vibration, and at 1736 cm−1 and 1266 cm−1, corresponding to carboxyl C=O and carbonyl C-O stretching vibrations, respectively [56] (Figure 5). When rGO incubated with the studied proteins was analyzed by FT-IR, an obvious shift of the C=C stretching band from 1603 cm−1 to 1590–1600 cm−1 and a shift of the C-O stretching band from 1266 cm−1 to 1227–1250 cm−1 were detected, which were ascribed to the π–π bonding between the benzene ring from proteins and the rGO surface (Table 5) [67]. Although due to the incomplete reduction in rGO, a hydroxyl signal was detected in FT-IR spectra, forming H-bonding when incubated with proteins (3692–3701 cm−1), these slight changes are not strong enough for stable H-bond formation. Therefore, we consider that the studied protein adsorption on the rGO surface is attributed mainly to π–π interactions between the rGO surface and the proteins [52,68].

3.4. Therapeutic Protein Adsorption on Protein Coated rGO

In order to determine if blocking the rGO surface with the studied proteins precluded further adsorption of other proteins, we studied the adsorption of two different therapeutic proteins as erythropoietin and insulin (Figure 6) for 24 h at 37 °C. No differences were detected among the studied coating proteins when adsorption studies were performed with either erythropoietin (EPO) or insulin. However, this behavior with the therapeutic proteins was slightly different, since EPO trapping was lower than insulin, indicating a higher blocking for EPO protein by the protein coating.
The mechanism of insulin adsorption by graphene and GO was shown to be different. The high adsorption of insulin hormone by graphene can be explained by a strong π–π interaction between the phenyl rings of insulin and the graphene surfaces [69]. On the other hand, insulin adsorption on the GO surface was attributed to electrostatic interactions and hydrogen bonds with the oxygenated functional groups. This interaction would be enough to overcome the blocking exerted by the coated studied proteins onto rGO, being unable to block the adsorption of further proteins with low molecular weight (6 kDa) and high hydrophilicity, such as insulin [16].

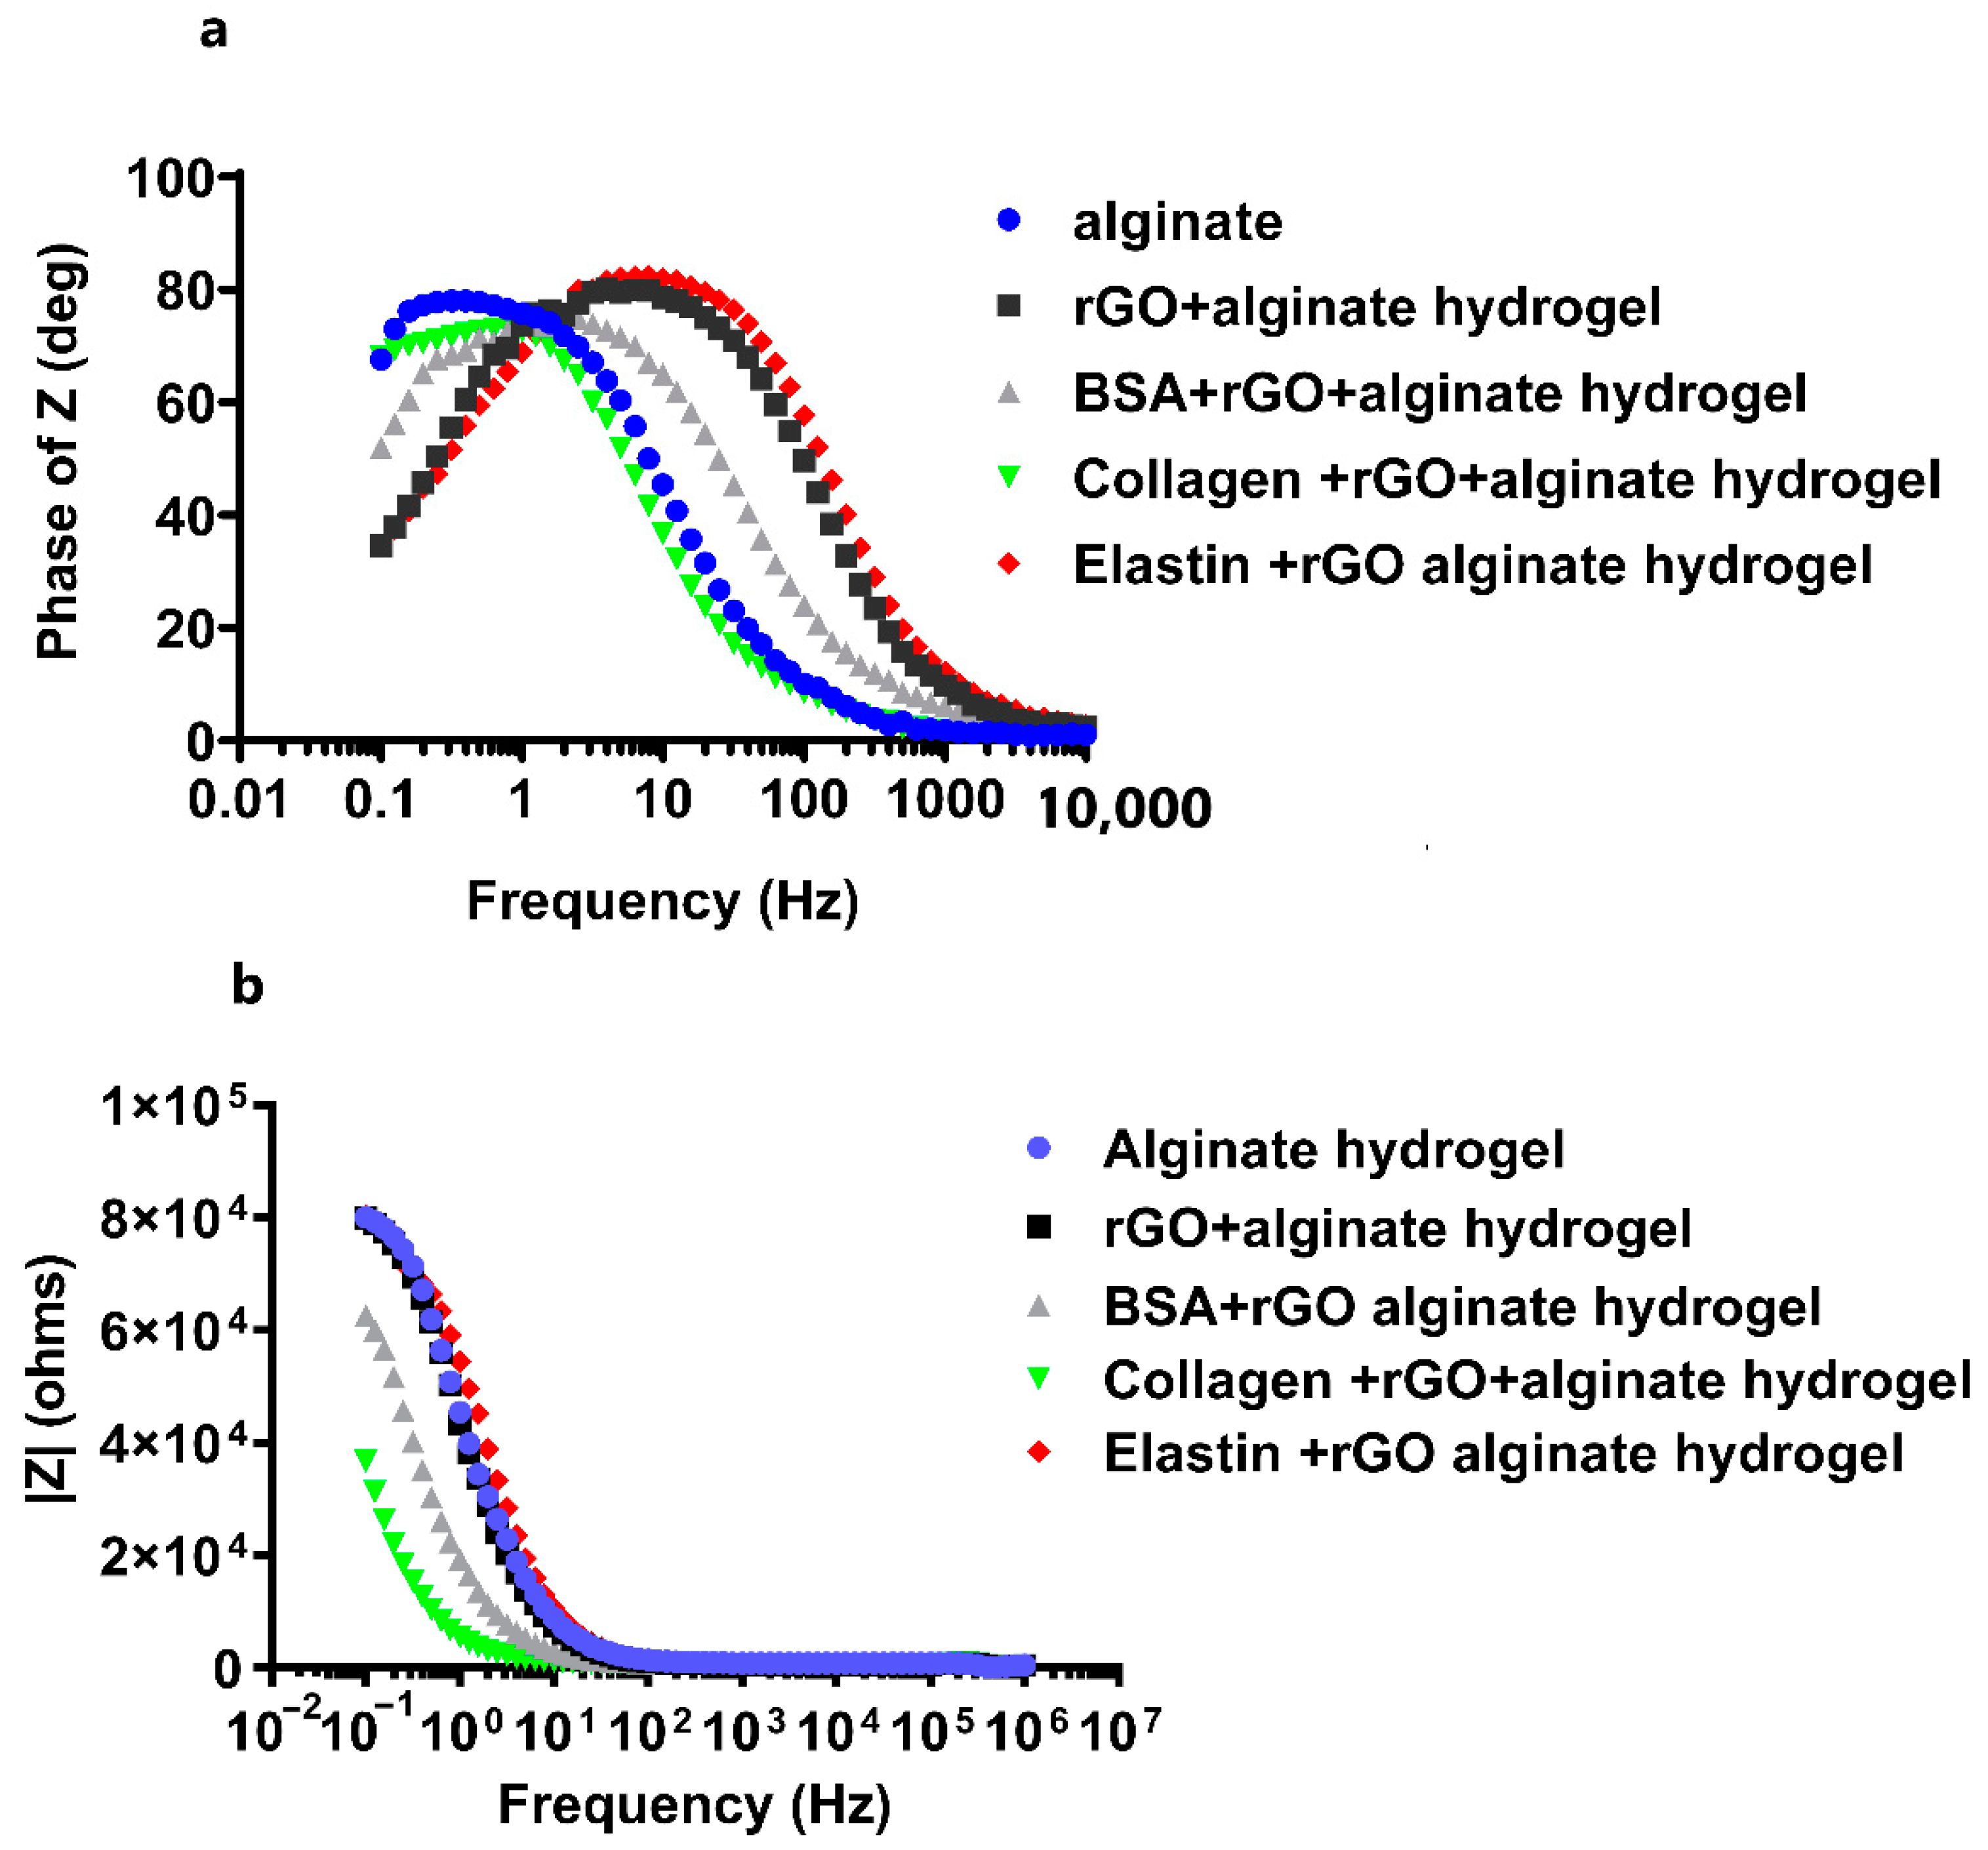
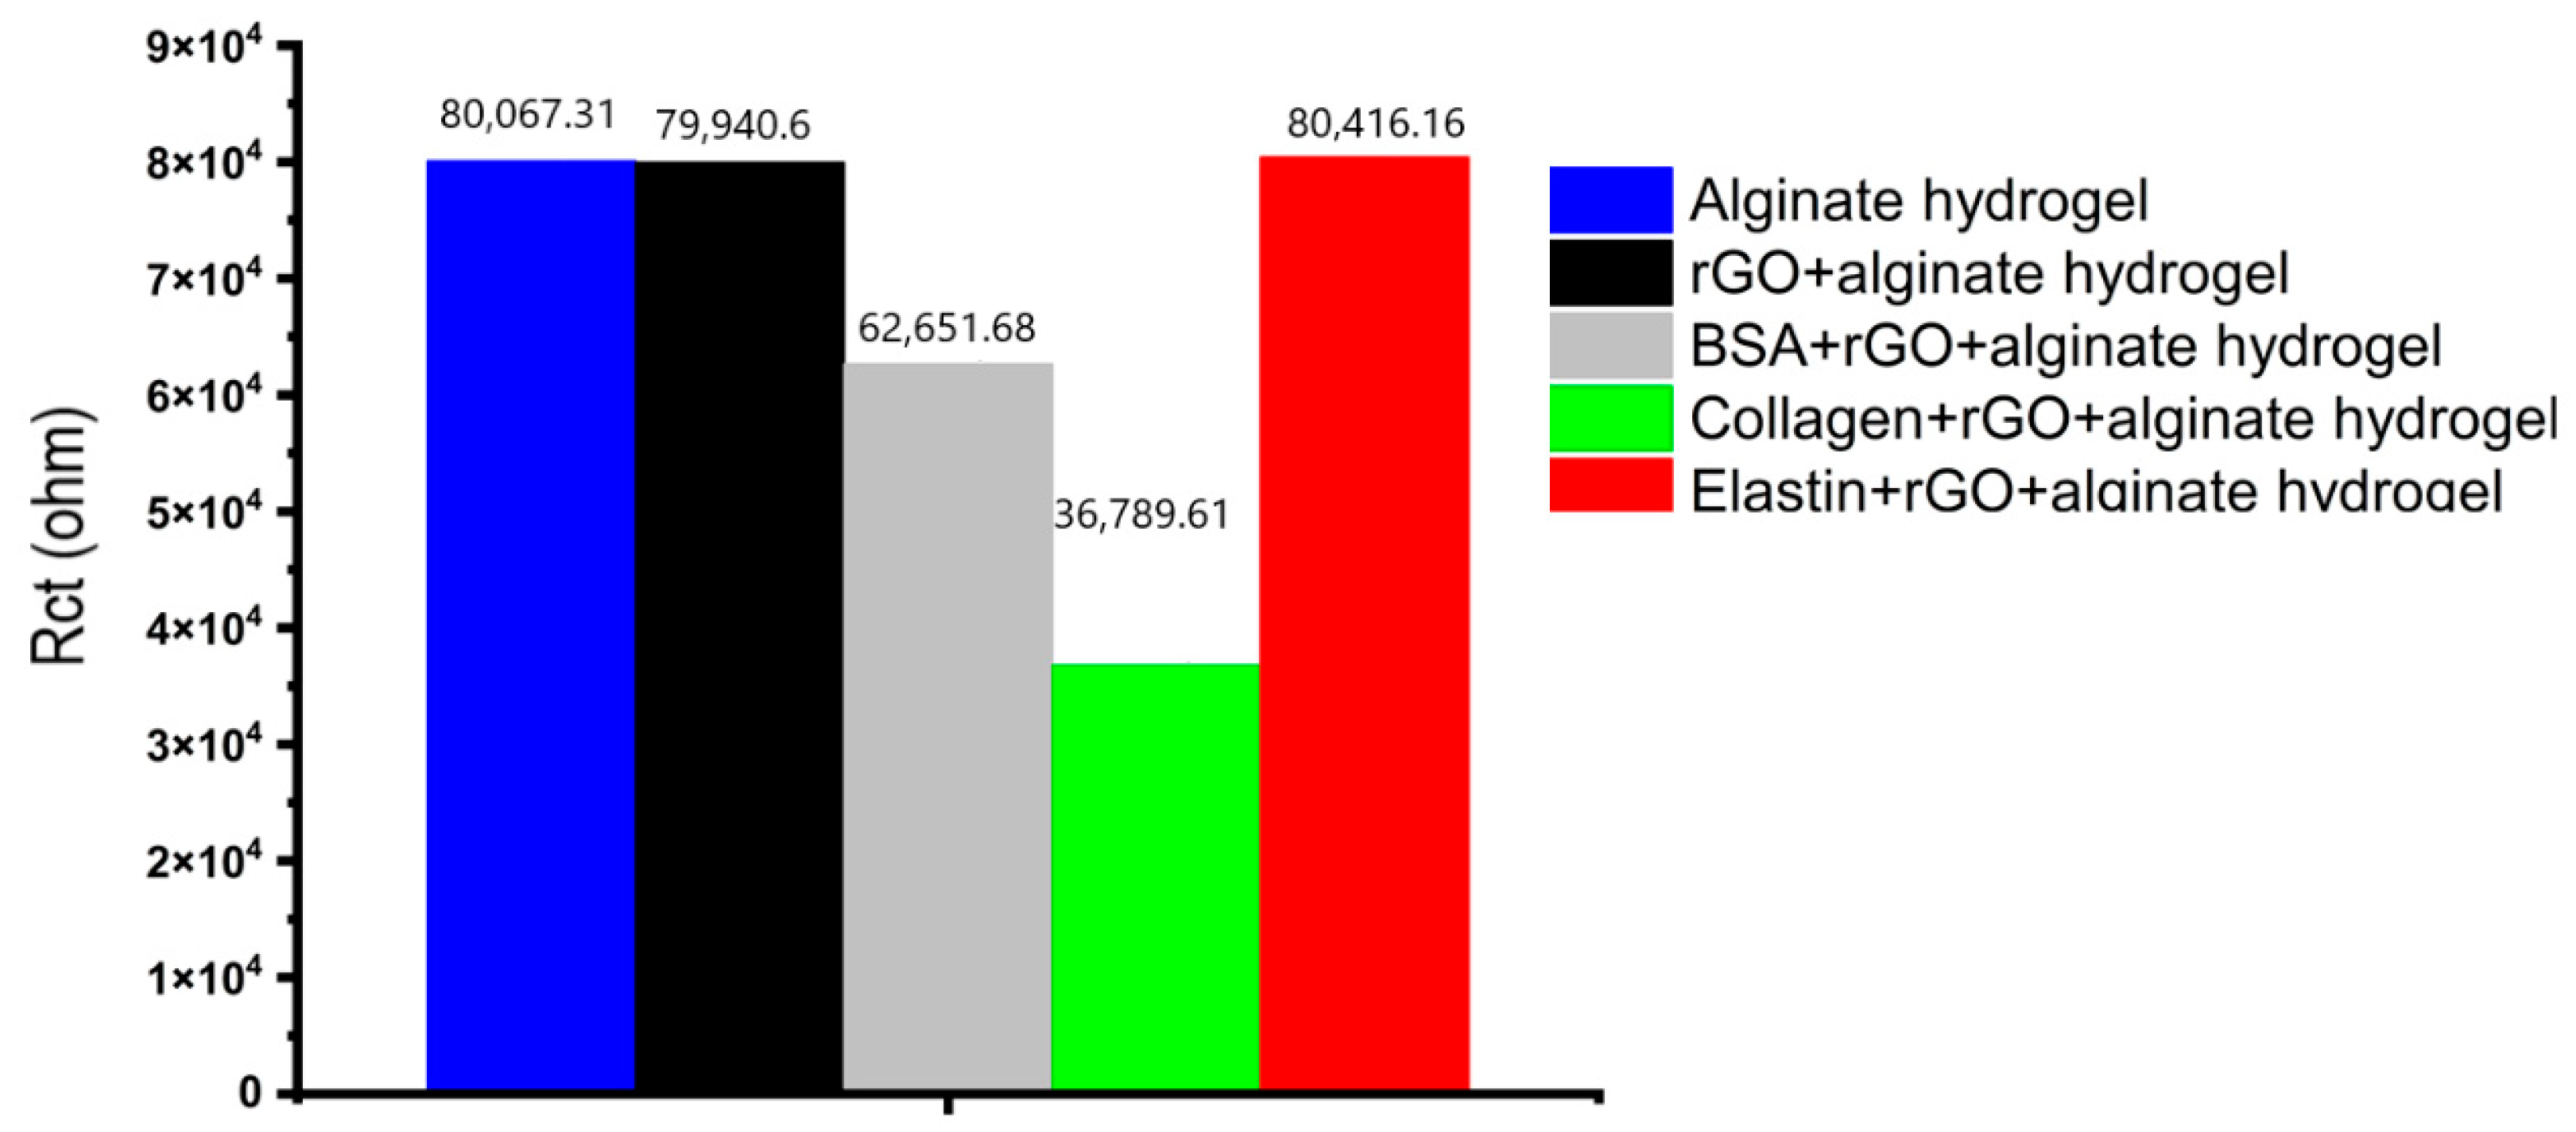
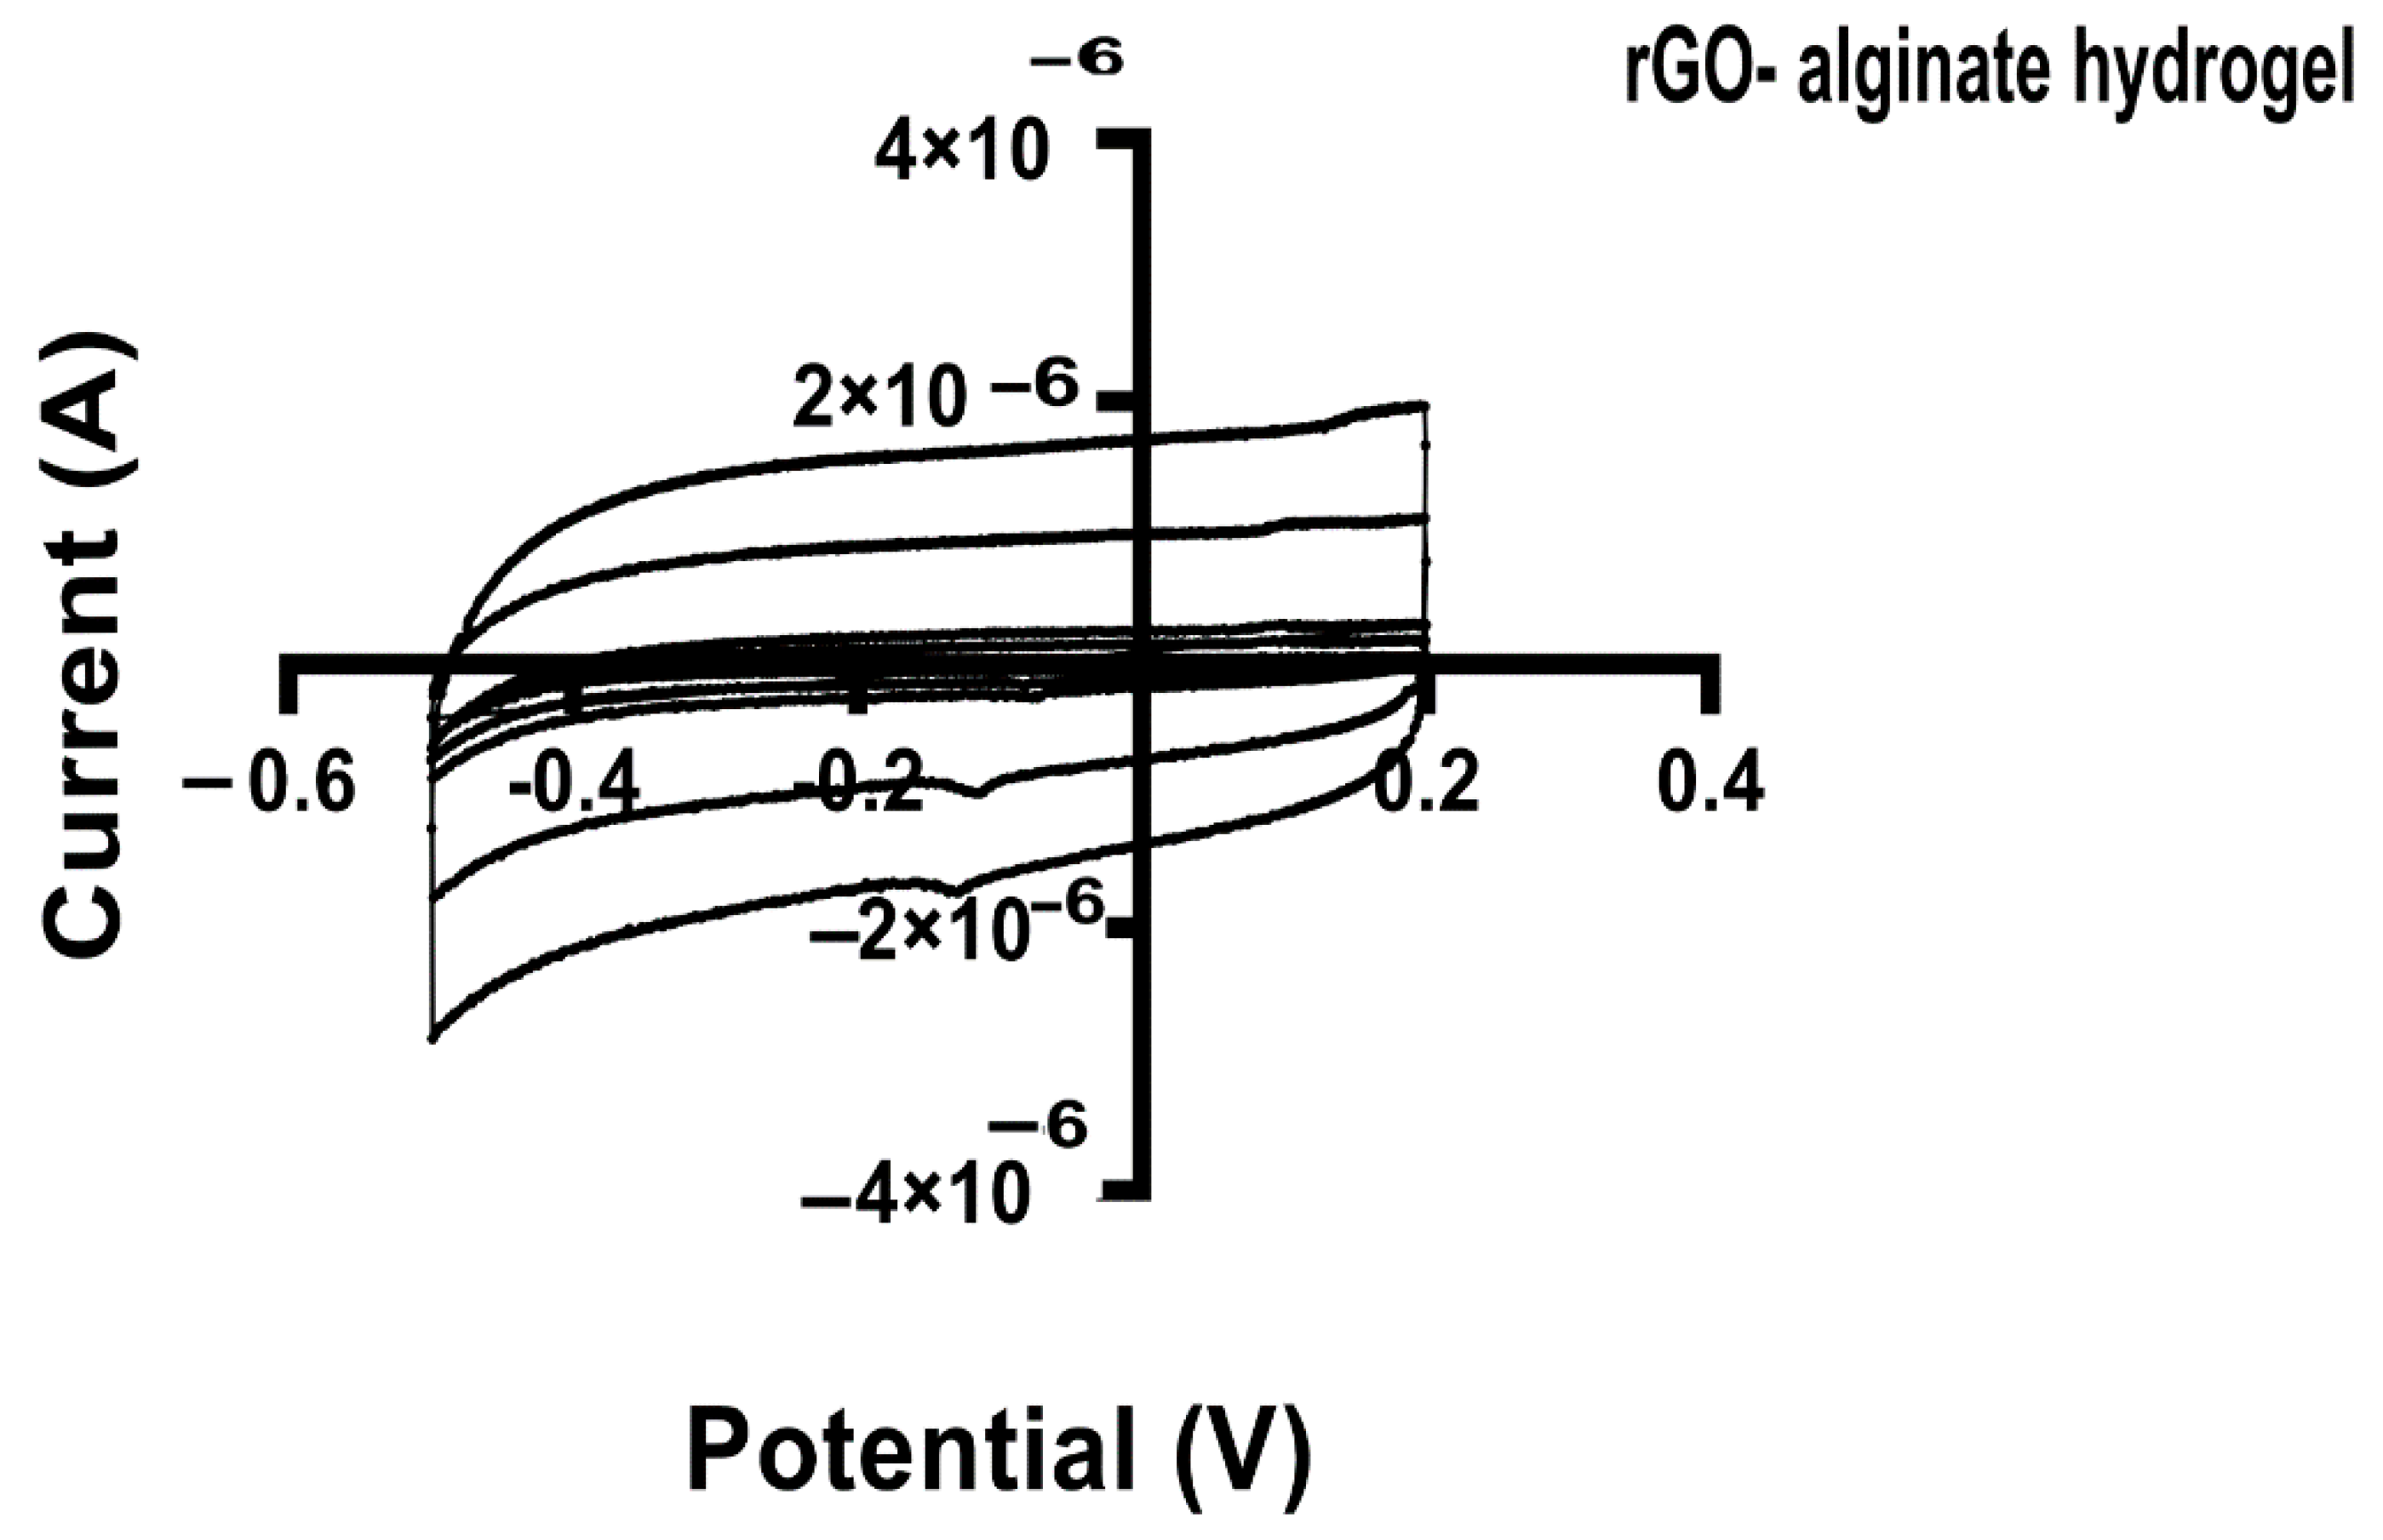
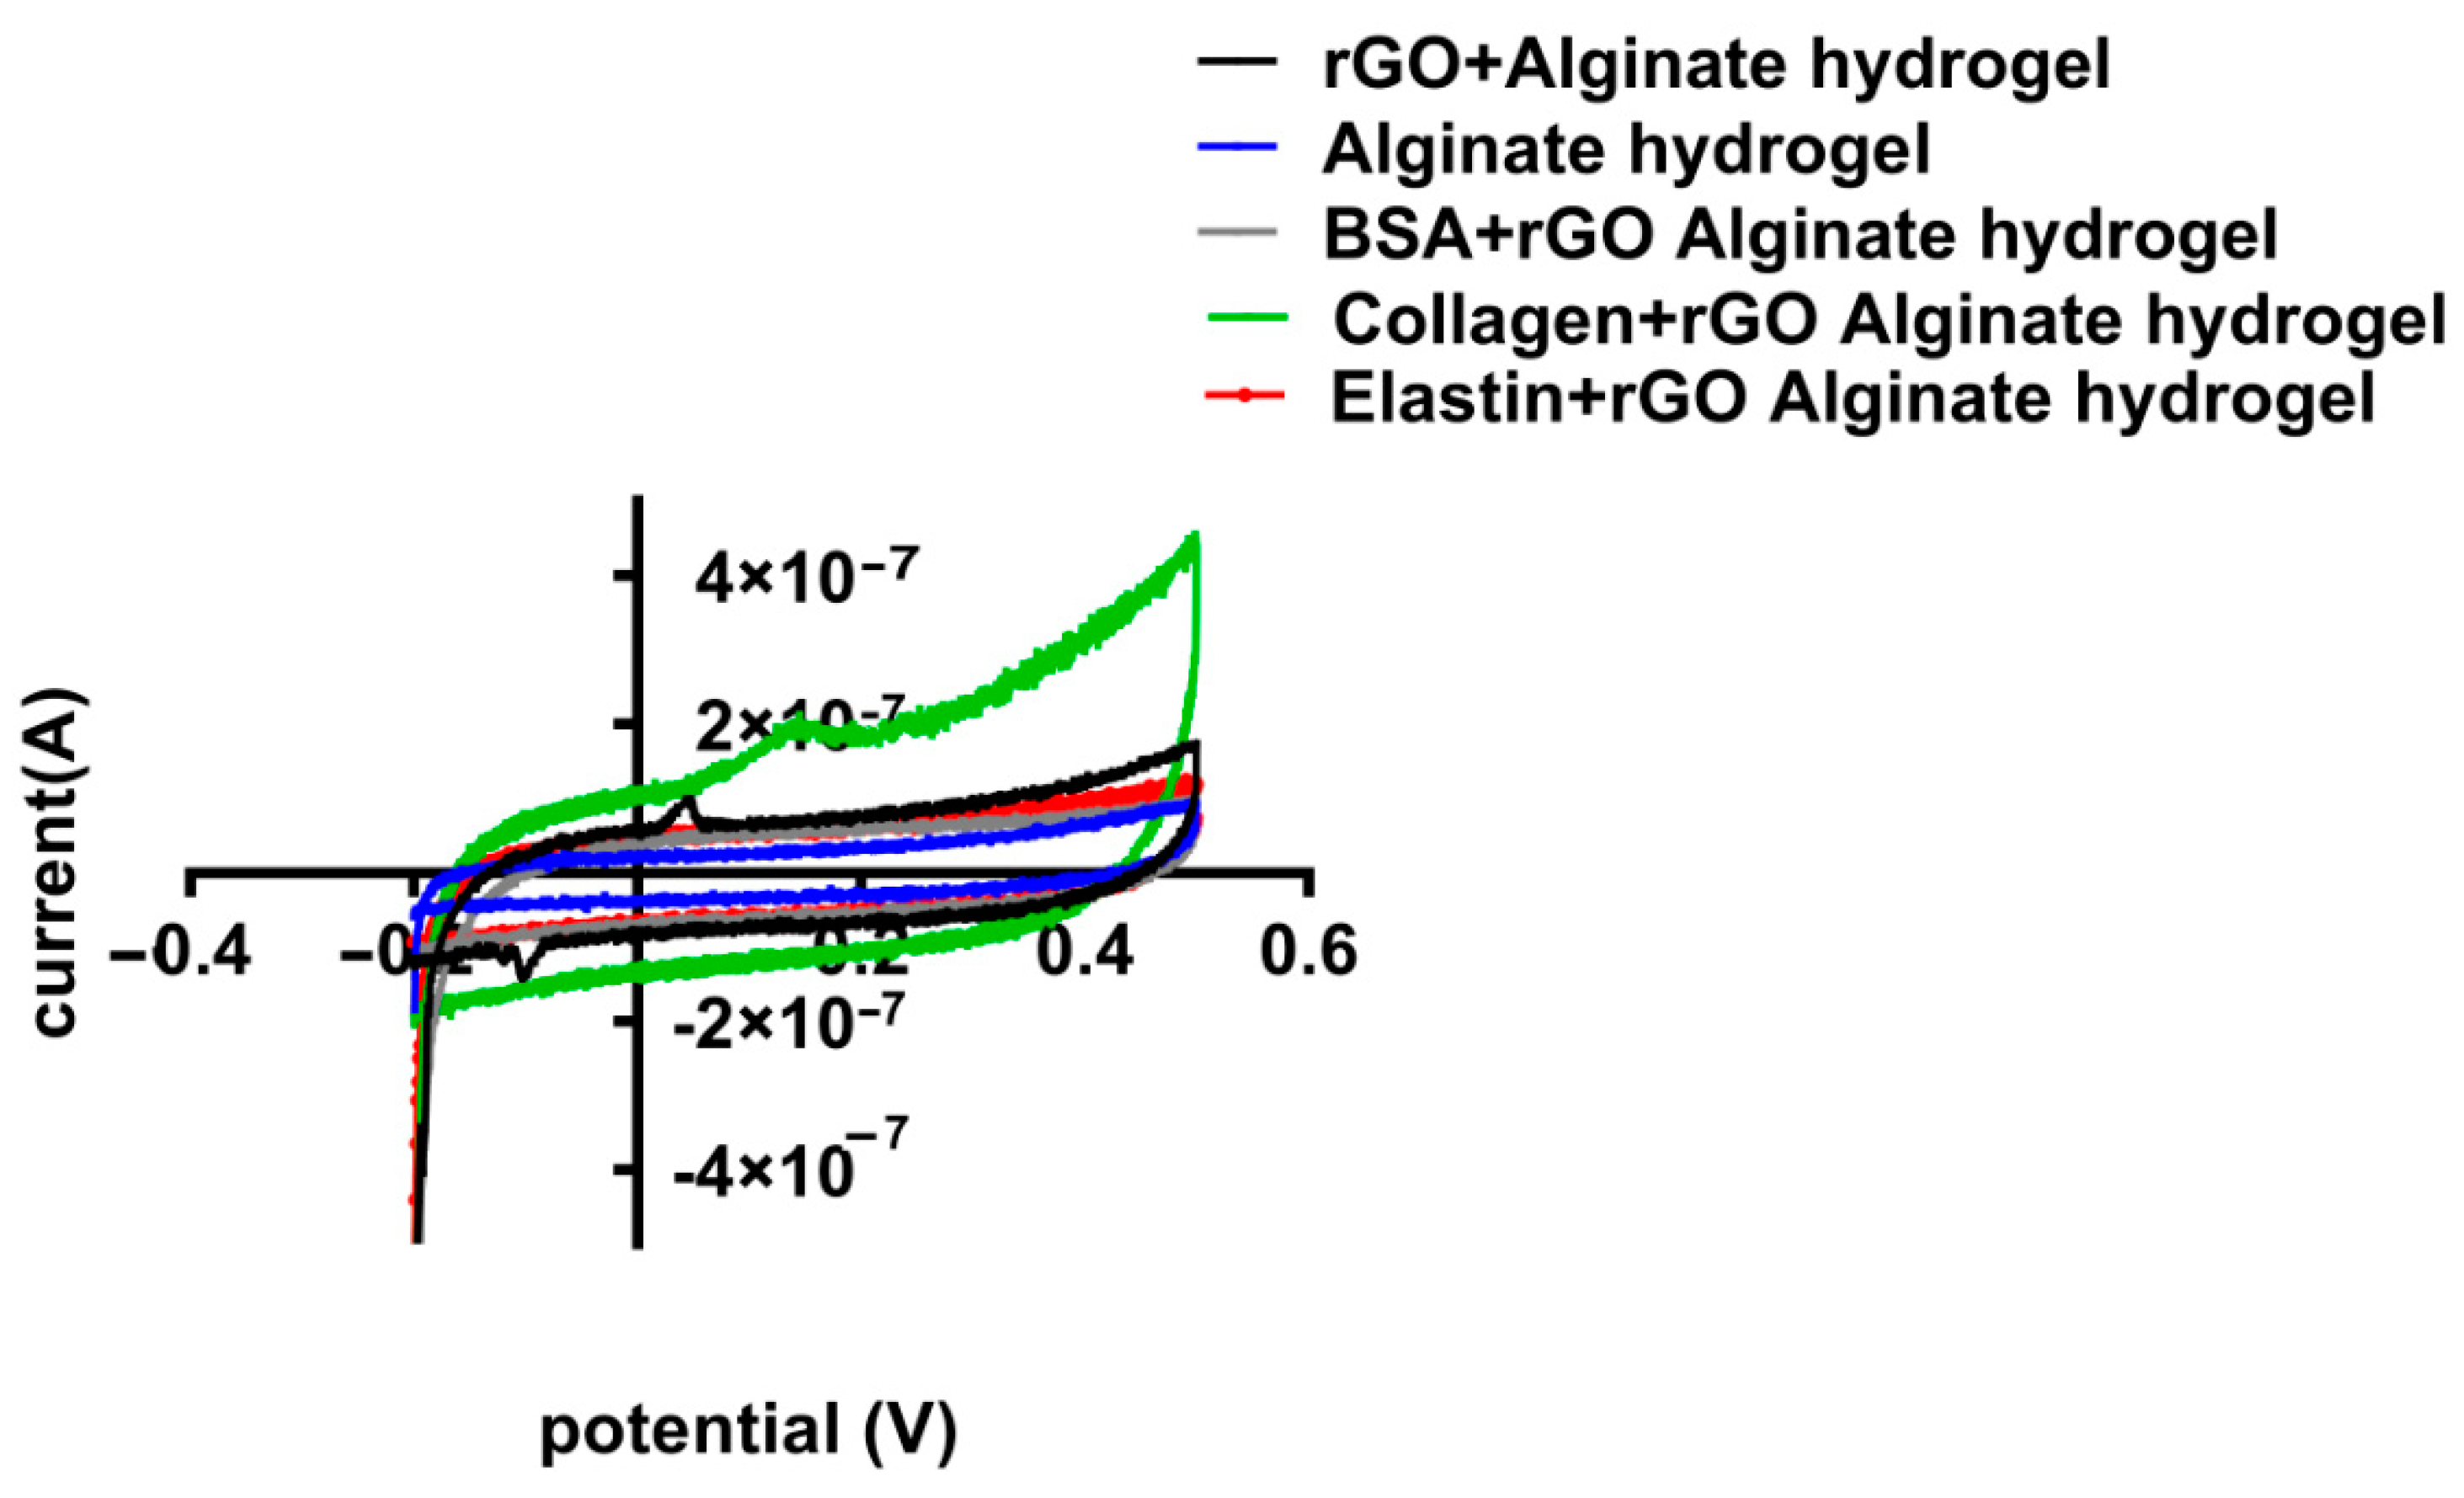
3.5. Conductivity Studies of Alginate Hydrogels Containing Protein Coated rGO

rGO has properties close to graphene and shows excellent electrical properties, including high electrical conductivity and high mobility [43]. During the reduction process, structural defects are formed, such as physical holes after removing the oxygen functional groups or alkyl groups. These holes can act as charge carriers and are responsible for the high conductivity of rGO [56]. In fact, the incorporation of rGO within scaffold matrices has improved their conductivity, such as rGO–gelatin methacryloyl (GelMA) hybrid hydrogels displaying improved electrical conductivity and mechanical properties [63]. Hybrid scaffolds with carbon nanofibers (CNFs) incorporated in alginate and gelatin hydrogels have demonstrated high electroconduction. Furthermore, this preparation method permits the elaboration of homogeneously dispersed hydrogels with integrated CNFs. The hybrid composite hydrogels including rGO were reported to display excellent electrical conductivity in the range of 4.1 × 10⁻⁴ ± 2 × 10⁻⁵ S/cm [70]. Therefore, we decided to study the electrochemical activity of protein-coated-rGO embedded within alginate hydrogels through the impedance spectroscopy (EIS) and cyclic voltammetry (CV) measurements. We quantified the phase angle (deg) and impedance modulus |Z| (ohms) within a range of frequencies between 10−1 and 106 Hz in EIS, followed by analyzing the experimental data by Bode model (Figure 7) to determine the insulating or conducting behavior for the studied hydrogels. We determined that the addition of rGO or protein-coated-rGO to alginate matrix induced a slight decrease in hydrogel impedance at low frequencies. Moreover, we observed that the phase angle stayed close to 90° at low frequencies, decreasing towards zero at ultra-high frequencies in all the hydrogels studied (Figure 7a), quantifying the highest phase angle in collagen-coated rGO-alginate hydrogels. The magnitude of the impedance is inversely proportional to capacitance: ideal capacitors have lower impedance [71]. With rising frequency, the impedance of any given capacitance decreases. The frequency response of impedance is depicted in two portions on the Bode plot (Figure 7a). The first is associated with the hydrogel and is below 101 Hz, whereas the second is related to the charge transfer resistance between the hybrid hydrogel and the electrolyte [72].
The charge transfer resistance, as seen in Figure 7b, has the largest variance, where alginate hydrogels showed the highest impedance value, decreasing when rGO or protein-rGO was introduced into the hydrogels, especially with collagen that showed the lowest impedance value. At low frequencies, the charge transfer resistance can be obtained by interpolating the semi-circle to the real x-axis [73]. The current density of the rGO-proteins alginate hydrogels rises as the hydrogel resistance and charge transfer resistance fall [73]. Figure 8 depicts the charge transfer resistance (Rct) derived by analyzing the EIS spectra. Because the charge transfer resistance characterizes the electron flow at the counter electrode to a great extent, the lower the resistance, the faster the electron flow rate in the hydrogel [73].
The impedance of rGO-proteins alginate hydrogels reduced greater and that was attributed to the π–π bonding between rGO and the adsorbed proteins [74], the electrons of the π–π bonding have higher mobility than that of the holes in rGO, which is the main charge carrier in rGO [75,76].
Cyclic voltammetry (CV) is a technique used to assess redox properties, stability, and surface area of electrodes for biosensing, using materials such as graphene [77]. In this work, we applied the CV to study the electrochemical activity of the alginate hydrogel and hybrid alginate hydrogel with rGO and rGO-proteins. Through the CV the specific capacitance of each hydrogel can be estimated. Voltammetry (CV) measurements showed excellent capacitance for all the tested hydrogels, maintaining the box-like shape even at different scan rates (Figure 9).
When rGO-proteins were added to the alginate matrix, the specific capacitance of the hybrid alginate hydrogel was modified (Figure 10). Collagen-coated rGO maximized the capacitance reaching the highest value (3.17 × 10⁻⁵ F/g), while BSA-rGO-alginate hydrogel and elastin-rGO-alginate hydrogel minimized it (to 1.88 × 10⁻⁵ F/g and 1.20 × 10⁻⁵ F/g, respectively) (Table 6). Therefore, CV results confirmed the measurement quantified in EIS, indicating that collagen-coated rGO hydrogel enhances the conducting behavior of rGO hydrogels [74], modifying the electrical properties of alginate hydrogel.

4. Conclusions

Aiming to improve alginate hydrogels, we incorporated reduced graphene oxide (rGO) coated with proteins—BSA, collagen, or elastin—into the alginate hydrogel matrix. Our finding demonstrated that the adsorption of these three proteins onto the rGO surface occurs through the π–π interactions. Moreover, the hydrophobic nature of the rGO surface has increased its affinity for hydrophobic protein and decreased its affinity for hydrophilic proteins. Among the studied proteins, the rGO surface showed the highest adsorption capacity to collagen (qe = 0.0220 µg/µg), while BSA and elastin represented three to five times lower qe values (0.0070 µg/µg and 0.0049 µg/µg, respectively). The thermodynamic study showed that the adsorption of these proteins onto rGO is a non-spontaneous phenomenon. Moreover, the adsorption of collagen by rGO is an endothermic process, while the adsorption of BSA and elastin is exothermic. When rGO-protein matrices were incorporated into the alginate hydrogels, the protein coat on the rGO surface was able to preclude further adsorption of erythropoietin. This collagen-coated rGO addition to alginate hydrogel enhanced alginate’s conductivity, leading to the lowest impedance modulus and the highest specific capacitance, 3.17 × 10⁻⁵ (F/g). This enhancement would be extremely helpful for its application in tissue engineering for neuronal or cardiomyocyte regeneration, cell-based therapy, and tissue engineering.

Author Contributions

Conceptualization, J.L.P. and L.S.-d.-B.; methodology, J.C., A.M.O.d.R., M.L.S.; validation, A.R., J.C., A.M.O.d.R., M.S.T.; formal analysis, A.R., J.C., A.M.O.d.R., L.S.-d.-B., J.L.P.; investigation, A.R., J.C., A.M.O.d.R., M.L.S.; resources, P.G.-M., J.L.P.; data curation, A.R., A.M.O.d.R., M.L.S.; writing—original draft preparation, A.R., J.C., L.S.-d.-B., J.L.P.; writing—review and editing, A.R., J.C., M.S.T., L.S.-d.-B., J.L.P.; supervision, L.S.-d.-B., J.L.P.; project administration, J.L.P.; funding acquisition, J.L.P. All authors have read and agreed to the published version of the manuscript.

Funding

This study was financially supported by the Basque Country Government [grant number T907-16].

Institutional Review Board Statement

Not applicable.

Informed Consent Statement

Not applicable.

Acknowledgments

We wish to thank the intellectual and technical assistance from the ICTS “NANBIOSIS”, more specifically by the Drug Formulation Unit (U10) of the CIBER in Bioengineering, Biomaterials, and Nanomedicine (CIBER-BBN) at the University of Basque Country UPV/EHU.

Conflicts of Interest

The authors declare no conflict of interest.

References

  1. Caló, E.; Khutoryanskiy, V. Biomedical applications of hydrogels: A review of patents and commercial products. Eur. Polym. J. 2015, 65, 252–267. [Google Scholar] [CrossRef] [Green Version]
  2. Chai, Q.; Jiao, Y.; Yu, X. Hydrogels for biomedical applications: Their characteristics and the mechanisms behind them. Gels 2017, 3, 6. [Google Scholar] [CrossRef] [Green Version]
  3. Hoare, T.R.; Kohane, D.S. Hydrogels in drug delivery: Progress and challenges. Polymer 2008, 49, 1993–2007. [Google Scholar] [CrossRef] [Green Version]
  4. Mei, L.; Zeng, X.; Ma, C.; Yi, H.; Ali, Z.; Mou, X.; Li, S.; Deng, Y.; He, N. Injectable hydrogels for cartilage and bone tissue engineering. Bone Res. 2017, 5, 75–94. [Google Scholar]
  5. Tsou, Y.-H.; Khoneisser, J.; Huang, P.-C.; Xu, X. Hydrogel as a bioactive material to regulate stem cell fate. Bioact. Mater. 2016, 1, 39–55. [Google Scholar] [CrossRef] [PubMed] [Green Version]
  6. Van Der Linden, H.J.; Herber, S.; Olthuis, W.; Bergveld, P. Stimulus-sensitive hydrogels and their applications in chemical (micro)analysis. Analyst 2003, 128, 325–331. [Google Scholar] [CrossRef] [PubMed]
  7. Hudson, B.N.; Dawes, C.S.; Liu, H.-Y.; Dimmitt, N.; Chen, F.; Konig, H.; Lin, C.-C. Stabilization of enzyme-immobilized hydrogels for extended hypoxic cell culture. Emergent Mater. 2019, 2, 263–272. [Google Scholar] [CrossRef]
  8. Kaczmarek, B.; Nadolna, K.; Owczarek, A. Chapter 6—The physical and chemical properties of hydrogels based on natural polymers. In Hydrogels Based on Natural Polymers; Chen, Y., Ed.; Elsevier: Amsterdam, The Netherlands, 2020; pp. 151–172. [Google Scholar]
  9. Hoffman, A.S. Hydrogels for biomedical applications. Adv. Drug Deliv. Rev. 2012, 64, 18–23. [Google Scholar] [CrossRef]
  10. Raza, F.; Zafar, H.; Zhu, Y.; Ren, Y.; Ullah, A.; Khan, A.U.; He, X.; Han, H.; Aquib, M.; Boakye-Yiadom, K.O.; et al. A Review on Recent Advances in Stabilizing Peptides/Proteins upon Fabrication in Hydrogels from Biodegradable Polymers. Pharmaceutics 2018, 10, 16. [Google Scholar] [CrossRef] [Green Version]
  11. Billiet, T.; Vandenhaute, M.; Schelfhout, J.; Van Vlierberghe, S.; Dubruel, P. A review of trends and limitations in hydrogel-rapid prototyping for tissue engineering. Biomaterials 2012, 33, 6020–6041. [Google Scholar] [CrossRef] [PubMed]
  12. Pan, G.; Guo, Q.; Ma, Y.; Yang, H.; Li, B. Thermo-responsive hydrogel layers imprinted with RGDS peptide: A system for harvesting cell sheets. Angew. Chem. Int. Ed. Engl. 2013, 52, 6907–6911. [Google Scholar] [CrossRef]
  13. Li, L.; Wang, Y.; Pan, L.; Shi, Y.; Cheng, W.; Shi, Y.; Yu, G. A Nanostructured Conductive Hydrogels-Based Biosensor Platform for Human Metabolite Detection. Nano Lett. 2015, 15, 1146–1151. [Google Scholar] [CrossRef]
  14. González-Díaz, E.C.; Varghese, S. Hydrogels as extracellular matrix analogs. Gels 2016, 2, 20. [Google Scholar] [CrossRef]
  15. Noguera, A.E.; Ciriza, J.; Cañibano-Hernández, A.; Fernandez, L.; Ochoa, I.; del Burgo, L.S.; Pedraz, J.L. Tunable injectable alginate-based hydrogel for cell therapy in Type 1 Diabetes Mellitus. Int. J. Biol. Macromol. 2018, 107, 1261–1269. [Google Scholar] [CrossRef]
  16. Raslan, A.; Burgo, L.; Espona-Noguera, A.; Retana, A.; Sanjuán, M.; Cañibano-Hernández, A.; Gálvez-Martín, P.; Ciriza, J.; Pedraz, J. BSA- and elastin-coated GO, but not collagen-coated GO, enhance the biological performance of alginate hydrogels. Pharmaceutics 2020, 12, 543. [Google Scholar] [CrossRef] [PubMed]
  17. Zhou, H.; Xu, H.H. The fast release of stem cells from alginate-fibrin microbeads in injectable scaffolds for bone tissue engineering. Biomaterials 2011, 32, 7503–7513. [Google Scholar] [CrossRef] [PubMed] [Green Version]
  18. Hernández, R.M.A.; Orive, G.; Murua, A.; Pedraz, J.L. Microcapsules and microcarriers for in situ cell delivery. Adv. Drug Deliv. Rev. 2010, 62, 711–730. [Google Scholar] [CrossRef]
  19. Liu, J.; Cui, L.; Losic, D. Graphene and graphene oxide as new nanocarriers for drug delivery applications. Acta Biomater. 2013, 9, 9243–9257. [Google Scholar] [CrossRef]
  20. Feng, L.; Liu, Z. Graphene in biomedicine: Opportunities and challenges. Nanomedicine 2011, 6, 317–324. [Google Scholar] [CrossRef] [PubMed]
  21. Yan, L.; Zhao, F.; Li, S.; Hu, Z.; Zhao, Y. Low-toxic and safe nanomaterials by surface-chemical design, carbon nanotubes, fullerenes, metallofullerenes, and graphenes. Nanoscale 2010, 3, 362–382. [Google Scholar] [CrossRef]
  22. Sasidharan, A.; Panchakarla, L.S.; Sadanandan, A.R.; Ashokan, A.; Chandran, P.; Girish, C.M.; Menon, D.; Nair, S.V.; Rao, C.N.R.; Koyakutty, M. Hemocompatibility and macrophage response of pristine and functionalized graphene. Small 2012, 8, 1251–1263. [Google Scholar] [CrossRef] [PubMed]
  23. Hu, W.; Peng, C.; Luo, W.; Lv, M.; Li, X.; Li, D.; Huang, Q.; Fan, C. Graphene-based antibacterial paper. ACS Nano 2010, 4, 4317–4323. [Google Scholar] [CrossRef] [PubMed]
  24. Yue, H.; Wei, W.; Yue, Z.; Wang, B.; Luo, N.; Gao, Y.; Ma, D.; Ma, G.; Su, Z. The role of the lateral dimension of graphene oxide in the regulation of cellular responses. Biomaterials 2012, 33, 4013–4021. [Google Scholar] [CrossRef] [PubMed]
  25. Kang, Y.; Liu, J.; Wu, J.; Yin, Q.; Liang, H.; Chen, A.; Shao, L. Graphene oxide and reduced graphene oxide induced neural pheochromocytoma-derived PC12 cell lines apoptosis and cell cycle alterations via the ERK signaling pathways. Int. J. Nanomed. 2017, 12, 5501–5510. [Google Scholar] [CrossRef] [PubMed] [Green Version]
  26. Casero, E.; Parra-Alfambra, A.; Domínguez, M.D.P.; Pariente, F.; Lorenzo, E.; Alonso, F.P. Differentiation between graphene oxide and reduced graphene by electrochemical impedance spectroscopy (EIS). Electrochem. Commun. 2012, 20, 63–66. [Google Scholar] [CrossRef]
  27. Eigler, S.; Dotzer, C.; Hirsch, A. Visualization of defect densities in reduced graphene oxide. Carbon 2012, 50, 3666–3673. [Google Scholar] [CrossRef]
  28. Kannappan, S.; Kaliyappan, K.; Manian, R.K.; Pandian, A.S.; Yang, H.; Lee, Y.S.; Jang, J.-H.; Lu, H. Graphene based supercapacitors with improved specific capacitance and fast charging time at high current density. arXiv 2013, arXiv:1311.1548. [Google Scholar]
  29. Pokharel, P.; Lee, D.S. Thermal and mechanical properties of reduced graphene oxide/polyurethane nanocomposite. J. Nanosci. Nanotechnol. 2014, 14, 5718–5721. [Google Scholar] [CrossRef]
  30. Yan, H.; Tao, X.; Yang, Z.; Li, K.; Yang, H.; Li, A.; Cheng, R. Effects of the oxidation degree of graphene oxide on the adsorption of methylene blue. J. Hazard. Mater. 2014, 268, 191–198. [Google Scholar] [CrossRef]
  31. Molina, J.; Fernández, J.; Inés, J.; del Río, A.; Bonastre, J.; Cases, F. Electrochemical characterization of reduced graphene oxide-coated polyester fabrics. Electrochimica Acta 2013, 93, 44–52. [Google Scholar] [CrossRef]
  32. Rose, A.; Raghavan, N.; Thangavel, S.; Maheswari, B.U.; Nair, D.P.; Venugopal, G. Investigation of cyclic voltammetry of graphene oxide/polyaniline/polyvinylidene fluoride nanofibers prepared via electrospinning. Mater. Sci. Semicond. Process. 2015, 31, 281–286. [Google Scholar] [CrossRef]
  33. Bai, H.; Li, C.; Shi, G. Functional composite materials based on chemically converted graphene. Adv. Mater. 2011, 23, 1089–1115. [Google Scholar] [CrossRef]
  34. Raslan, A.; del Burgo, L.S.; Ciriza, J.; Pedraz, J.L. Graphene oxide and reduced graphene oxide-based scaffolds in regenerative medicine. Int. J. Pharm. 2020, 580, 119226. [Google Scholar] [CrossRef] [PubMed]
  35. Chen, D.; Feng, H.; Li, J. Graphene oxide: Preparation, functionalization, and electrochemical applications. Chem. Rev. 2012, 112, 6027–6053. [Google Scholar] [CrossRef]
  36. Mohan, V.B.; Lau, K.-t.; Hui, D.; Bhattacharyya, D. Graphene-based materials and their composites: A review on pro-duction, applications and product limitations. Compos. Part B Eng. 2018, 142, 200–220. [Google Scholar] [CrossRef]
  37. Park, S.; An, J.; Jung, I.; Piner, R.D.; An, S.J.; Li, X.; Velamakanni, A.; Ruoff, R.S. Colloidal suspensions of highly reduced graphene oxide in a wide variety of organic solvents. Nano Lett. 2009, 9, 1593–1597. [Google Scholar] [CrossRef] [PubMed]
  38. Konkena, B.; Vasudevan, S. Understanding aqueous dispersibility of graphene oxide and reduced graphene oxide through pKa measurements. J. Phys. Chem. Lett. 2012, 3, 867–872. [Google Scholar] [CrossRef]
  39. Park, S.; Ruoff, R.S. Chemical methods for the production of graphenes. Nat. Nanotechnol. 2009, 4, 217–224. [Google Scholar] [CrossRef]
  40. Ciriza, J.; del Burgo, L.S.; Muñoz, J.L.P.; Ochoa, I.; Fernandez, L.; Orive, G.; Hernandez, R.; Pedraz, J. Graphene oxide increases the viability of C2C12 myoblasts microencapsulated in alginate. Int. J. Pharm. 2015, 493, 260–270. [Google Scholar] [CrossRef]
  41. Ciriza, J.; Del Burgo, L.S.; Gurruchaga, H.; Borras, F.E.; Franquesa, M.; Orive, G.; Hernández, R.M.; Pedraz, J.L. Graphene oxide enhances alginate encapsulated cells viability and functionality while not affecting the foreign body response. Drug Deliv. 2018, 25, 1147–1160. [Google Scholar] [CrossRef] [Green Version]
  42. Del Burgo, L.S.; Ciriza, J.; Acarregui, A.; Gurruchaga, H.; Blanco, F.J.; Orive, G.; Hernández, R.M.; Pedraz, J.L. Hybrid alginate–protein-coated graphene oxide microcapsules enhance the functionality of erythropoietin secreting C2C12 myoblasts. Mol. Pharm. 2017, 14, 885–898. [Google Scholar] [CrossRef]
  43. Zhang, Q.; Liu, X.; Meng, H.; Liu, S.; Zhang, C. Reduction pathway-dependent cytotoxicity of reduced graphene oxide. Environ. Sci. Nano 2018, 5, 1361–1371. [Google Scholar] [CrossRef]
  44. Konios, D.; Stylianakis, M.M.; Stratakis, E.; Kymakis, E. Dispersion behaviour of graphene oxide and reduced graphene oxide. J. Colloid Interface Sci. 2014, 430, 108–112. [Google Scholar] [CrossRef]
  45. Liao, K.-H.; Lin, Y.-S.; Macosko, C.W.; Haynes, C. Cytotoxicity of graphene oxide and graphene in human erythrocytes and skin fibroblasts. ACS Appl. Mater. Interfaces 2011, 3, 2607–2615. [Google Scholar] [CrossRef]
  46. Tabish, T.; Pranjol, M.Z.I.; Hayat, H.; Rahat, A.A.M.; Abdullah, T.M.; Whatmore, J.L.; Zhang, Z. In vitro toxic effects of reduced graphene oxide nanosheets on lung cancer cells. Nanotechnology 2017, 28, 504001. [Google Scholar] [CrossRef] [PubMed] [Green Version]
  47. Mittal, S.; Kumar, V.; Dhiman, N.; Chauhan, L.K.S.; Pasricha, R.; Pandey, A.K. Physico-chemical properties based differential toxicity of graphene oxide/reduced graphene oxide in human lung cells mediated through oxidative stress. Sci. Rep. 2016, 6, 39548. [Google Scholar] [CrossRef]
  48. Guo, W.; Wang, S.; Yu, X.; Qiu, J.; Li, J.; Tang, W.; Li, Z.; Mou, X.; Liu, H.; Wang, Z.L. Construction of a 3D rGO–collagen hybrid scaffold for enhancement of the neural differentiation of mesenchymal stem cells. Nanoscale 2016, 8, 1897–1904. [Google Scholar] [CrossRef] [PubMed]
  49. Xiao, D.; He, M.; Liu, Y.; Xiong, L.; Zhang, Q.; Wei, L.; Li, L.; Yu, X. Strong alginate/reduced graphene oxide composite hydrogels with enhanced dye adsorption performance. Polym. Bull. 2020, 77, 6609–6623. [Google Scholar] [CrossRef]
  50. Jea, A.; Palejwala, A.; Fridley, J.; Mata, J.; Samuel, E.G.; Luerssen, T.; Perlaky, L.; Kent, T.; Tour, J. Biocompatibility of reduced graphene oxide nanoscaffolds following acute spinal cord injury in rats. Surg. Neurol. Int. 2016, 7, 75. [Google Scholar] [CrossRef] [PubMed] [Green Version]
  51. Mihic, A.; Cui, Z.; Wu, J.; Vlacic, G.; Miyagi, Y.; Li, S.-H.; Lu, S.; Sung, H.-W.; Weisel, R.D.; Li, R.-K. A conductive polymer hydrogel supports cell electrical signaling and improves cardiac function after implantation into myocardial infarct. Circulation 2015, 132, 772–784. [Google Scholar] [CrossRef] [Green Version]
  52. Nuengmatcha, P.; Mahachai, R.; Chanthai, S. Adsorption capacity of the as-synthetic graphene oxide for the removal of alizarin red S dye from aqueous solution. Orient. J. Chem. 2016, 32, 1399–1410. [Google Scholar] [CrossRef] [Green Version]
  53. Fierro, V.; Torné-Fernández, V.; Montane, D.; Celzard, A. Adsorption of phenol onto activated carbons having different textural and surface properties. Microporous Mesoporous Mater. 2008, 111, 276–284. [Google Scholar] [CrossRef]
  54. Xu, X.; Mao, X.; Wang, Y.; Li, D.; Du, Z.; Wu, W.; Jiang, L.; Yang, J.; Li, J. Study on the interaction of graphene oxide-silver nanocomposites with bovine serum albumin and the formation of nanoparticle-protein corona. Int. J. Biol. Macromol. 2018, 116, 492–501. [Google Scholar] [CrossRef]
  55. Ahmad, M.A.; Puad, N.A.A.; Bello, O.S. Kinetic, equilibrium and thermodynamic studies of synthetic dye removal using pomegranate peel activated carbon prepared by microwave-induced KOH activation. Water Resour. Ind. 2014, 6, 18–35. [Google Scholar] [CrossRef] [Green Version]
  56. Peng, B.; Chen, L.; Que, C.; Yang, K.; Deng, F.; Deng, X.; Shi, G.; Xu, G.; Wu, M. Adsorption of antibiotics on graphene and biochar in aqueous solutions induced by π-π interactions. Sci. Rep. 2016, 6, 31920. [Google Scholar] [CrossRef] [PubMed] [Green Version]
  57. Chen, P.; Li, H.; Song, S.; Weng, X.; He, D.; Zhao, Y. Adsorption of dodecylamine hydrochloride on graphene oxide in water. Results Phys. 2017, 7, 2281–2288. [Google Scholar] [CrossRef]
  58. Nethaji, S.; Sivasamy, A.; Mandal, A.B. Adsorption isotherms, kinetics and mechanism for the adsorption of cationic and anionic dyes onto carbonaceous particles prepared from Juglans regia shell biomass. Int. J. Environ. Sci. Technol. 2012, 10, 231–242. [Google Scholar] [CrossRef] [Green Version]
  59. Yang, A.; Zhu, Y.; Huang, C.P. Facile preparation and adsorption performance of graphene oxide-manganese oxide composite for uranium. Sci. Rep. 2018, 8, 9058. [Google Scholar] [CrossRef] [Green Version]
  60. Moussout, H.; Ahlafi, H.; Aazza, M.; Maghat, H. Critical of linear and nonlinear equations of pseudo-first order and pseudo-second order kinetic models. Karbala Int. J. Mod. Sci. 2018, 4, 244–254. [Google Scholar] [CrossRef]
  61. Wang, W.; Liu, P.; Wu, K.; Tan, S.; Li, W.; Yang, Y. Preparation of hydrophobic reduced graphene oxide supported Ni-B-P-O and Co-B-P-O catalysts and their high hydrodeoxygenation activities. Green Chem. 2015, 18, 984–988. [Google Scholar] [CrossRef]
  62. Hong, F.; Yue, B.; Hirao, N.; Liu, Z.; Chen, B. Significant improvement in Mn2O3 transition metal oxide electrical conductivity via high pressure. Sci. Rep. 2017, 7, srep44078. [Google Scholar] [CrossRef] [Green Version]
  63. Wang, J.; Chen, B. Adsorption and coadsorption of organic pollutants and a heavy metal by graphene oxide and reduced graphene materials. Chem. Eng. J. 2015, 281, 379–388. [Google Scholar] [CrossRef]
  64. Ossonon, B.D.; Bélanger, D. Synthesis and characterization of sulfophenyl-functionalized reduced graphene oxide sheets. RSC Adv. 2017, 7, 27224–27234. [Google Scholar] [CrossRef] [Green Version]
  65. Kim, K.H.; Yang, M.; Cho, K.M.; Jun, Y.-S.; Lee, S.B.; Jung, H.-T. High quality reduced graphene oxide through repairing with multi-layered graphene ball nanostructures. Sci. Rep. 2013, 3, 3251. [Google Scholar] [CrossRef]
  66. Li, L.; Xu, D.; Pei, Z. Kinetics and thermodynamics studies for bisphenol S adsorption on reduced graphene oxide. RSC Adv. 2016, 6, 60145–60151. [Google Scholar] [CrossRef]
  67. Peng, S.; Feng, P.; Wu, P.; Huang, W.; Yang, Y.; Guo, W.; Gao, C.; Shuai, C. Graphene oxide as an interface phase between polyetheretherketone and hydroxyapatite for tissue engineering scaffolds. Sci. Rep. 2017, 7, srep46604. [Google Scholar] [CrossRef] [PubMed]
  68. Shin, S.R.; Zihlmann, C.; Akbari, M.; Assawes, P.; Cheung, L.; Zhang, K.; Manoharan, V.; Zhang, Y.S.; Yüksekkaya, M.; Wan, K.; et al. Reduced graphene oxide-GelMA hybrid hydrogels as scaffolds for cardiac tissue engineering. Small 2016, 12, 3677–3689. [Google Scholar] [CrossRef] [Green Version]
  69. Kumar, S.; Parekh, S.H. Linking graphene-based material physicochemical properties with molecular adsorption, structure and cell fate. Commun. Chem. 2020, 3, 1–11. [Google Scholar] [CrossRef] [Green Version]
  70. Serafin, A.; Murphy, C.; Rubio, M.C.; Collins, M.N. Printable alginate/gelatin hydrogel reinforced with carbon nanofibers as electrically conductive scaffolds for tissue engineering. Mater. Sci. Eng. C 2021, 122, 111927. [Google Scholar] [CrossRef] [PubMed]
  71. Krishnamoorthy, K.; Ananth, A.; Mok, Y.S.; Kim, S.-J. Plasma assisted synthesis of graphene nanosheets and their supercapacitor applications. Sci. Adv. Mater. 2014, 6, 349–353. [Google Scholar] [CrossRef]
  72. Ruano, G.; Iribarren, J.I.; Pérez-Madrigal, M.M.; Torras, J.; Alemán, C. Electrical and capacitive response of hydrogel solid-like electrolytes for supercapacitors. Polymers 2021, 13, 1337. [Google Scholar] [CrossRef]
  73. Ghann, W.E.; Kang, H.; Uddin, J.; Chowdhury, F.A.; Khondaker, S.I.; Moniruzzaman, M.; Kabir, H.; Rahman, M.M. Synthesis and characterization of reduced graphene oxide and their application in dye-sensitized solar cells. ChemEngineering 2019, 3, 7. [Google Scholar] [CrossRef] [Green Version]
  74. Mavrič, T.; Benčina, M.; Imani, R.; Junkar, I.; Valant, M.; Kralj-Iglič, V.; Iglič, A. Chapter three—Electrochemical biosensor based on tio2 nanomaterials for cancer diagnostics. In Advances in Biomembranes and Lipid Self-Assembly; Iglič, A., Rappolt, M., García-Sáez, A.J., Eds.; Academic Press: Cambridge, MA, USA, 2018; Volume 27, pp. 63–105. [Google Scholar]
  75. Kumar, P.V.; Bernardi, M.; Grossman, J.C. The impact of functionalization on the stability, work function, and photoluminescence of reduced graphene oxide. ACS Nano 2013, 7, 1638–1645. [Google Scholar] [CrossRef] [PubMed]
  76. Safron, N.S.; Arnold, M.S. Characterization of conduction mechanisms relevant to device performance in nanoperforated graphene. Int. J. High Speed Electron. Syst. 2011, 20, 697–706. [Google Scholar] [CrossRef]
  77. Ismail, N.A.B.; Abd-Wahab, F.; Salim, W.W.A.W. Cyclic voltammetry and electrochemical impedance spectroscopy of partially reduced graphene oxide—PEDOT: PSS transducer for biochemical sensing. In Proceedings of the 2018 IEEE-EMBS Conference on Biomedical Engineering and Sciences (IECBES), Sarawak, Malaysia, 3–6 December 2018; pp. 330–335. [Google Scholar] [CrossRef]
Figure 1. (a). Adsorption capacity (qe) of rGO (250 µg/mL) with initial concentrations of 200 μg/mL BSA, 200 μg/mL elastin and 500 μg/mL collagen after two hours of incubation at 37 °C. (b) Langmuir models for BSA, collagen, and BSA adsorption on the rGO surface.
Pharmaceutics 13 01473 g001
Figure 2. Kinetic protein adsorption models on rGO surface. (a) Adsorption capacity over time; (b) intra-particle diffusion model plot; (c) pseudo-second-order model plot for BSA and collagen; (d) nonlinear plot of pseudo-second-order for elastin.
Pharmaceutics 13 01473 g002
Figure 3. (a) Influence of temperature on the adsorption of proteins. Where mixtures of 250 µg/mL rGO were suspended either in 50 µg/mL BSA, 200 µg/mL collagen, or 50 µg/mL elastin solution and incubated for 2 h at the following temperatures: 5, 10, 15, 25, 37, and 39 °C. (b) Van’t Hoff linear plot of ln Kd against 1/T for proteins adsorption on rGO. ΔH° was estimated from the slope (= −ΔH°/R) and ΔS° from the y-intercept (= +ΔS°/R).
Pharmaceutics 13 01473 g003
Figure 4. Raman spectra of rGO before and after the adsorption of (a) BSA (rGO + BSA), (b) collagen (rGO + collagen), and (c) elastin (rGO + elastin).
Pharmaceutics 13 01473 g004
Figure 5. FT-IR spectra of rGO before and after the adsorption of BSA (rGO-BSA), collagen (rGO-collagen), and elastin (rGO-elastin).
Pharmaceutics 13 01473 g005
Figure 6. (a) Erythropoietin (EPO) and (b) insulin adsorption on rGO and rGO-protein matrix. Note: *: p < 0.05, ***: p < 0.001, compared to rGO without protein coating.
Pharmaceutics 13 01473 g006
Figure 7. Electrochemical impedance spectroscopy (EIS) measurements for pristine alginate hydrogel, and hybrid alginate hydrogels containing protein-coated rGOs (rGO-BSA, rGO-Collagen, and rGO-Elastin). Bode plots representing (a) phase angle Z vs. frequency, and (b) the impedance modulus |Z| (ohms) vs. frequency. Measurements were performed in 0.1 M PBS buffer at room temperature.
Pharmaceutics 13 01473 g007
Figure 8. The charge transfer resistance (Rct) derived by analyzing the EIS spectra.
Pharmaceutics 13 01473 g008
Figure 9. Cyclic voltammograms (CV) for hybrid rGO-alginate hydrogel at various scan rates. The potential (V) was plotted against the current (A). All specimens were dipped in 0.1M PBS and CV measurements were done at the potential range from −0.2 to 0.5 V at different scan rates (100 mVs−1).
Pharmaceutics 13 01473 g009
Figure 10. Cyclic voltammetry (CV) potential (V) vs. current curves for different hybrid alginate hydrogels containing uncoated and protein-coated rGOs (rGO-BSA, rGO-Collagen, and rGO-Elastin). All specimens were dipped in 0.1M PBS and CV measurements have been done at the potential range of −0.2 to 0.5 V, though the rate is specified as 100 mV/s.
Pharmaceutics 13 01473 g010
Table 1. Parameters required for Langmuir and Freundlich adsorption isotherms. qe (µg/µg) is the Adsorption capacity at equilibrium, KL (mL/µg) is the Langmuir factor, R2 is the coefficient of determination for the Langmuir model, and qmax (µg/µg) is the maximum adsorption capacity of the proteins by rGO. For the Freundlich model, where KF is the Freundlich constant and m is the intensity adsorption, R2 is the coefficient of determination for the Freundlich isotherm.
Langmuir ModelFreundlich Model
qe
µg/µg
KL ml/µgRLR2qmax
µg/µg
1/mmKfR2
BSA0.00700.02970.15700.9680.00910.3452.8960.001970.95
Collagen0.02200.03130.06600.9870.02300.3862.5900.002280.92
Elastin0.00490.19800.02710.9960.00490.1616.1840.002300.83
Table 2. Calculated parameters from intra-particle diffusion pseudo-first-order and pseudo-second-order model. Calculated parameters from intra-particle diffusion are the intra-particle diffusion rate constant (Kp), constant for the intra-particle diffusion model (C) and coefficient of determination (R2). The presented parameters for the pseudo-first-order are the adsorption capacity at equilibrium (qe), rate constant (K1), and the coefficient of determination (R2). For the pseudo-second-order model, the parameters are the rate constant (K2) and the adsorption capacity at different times (qt).
Intra-Particle-Diffusion ModelPseudo First Order ModelPseudo Second Order Model
Kp
µg·µg−1min−1/2
CR2K1
min−1
qe
µg/µg
R2qe
µg/µg
K2
µg·µg−1min−1
R2qt
µg/µg
BSA0.000020.00370.6722.10.00740.350.0092.340.980.0091
Collagen 0.00010.01320.9616.30.00190.650.030727.270.990.0294
Elastin0.000050.00040.91 67.70.03790.820.00672.160.930.0044
Table 3. Thermodynamic parameters for protein adsorption by rGO: enthalpy of adsorption, ΔH° (kJ/mol); entropy of adsorption, ΔS° (kJ/mol·K); Gibbs free energy of adsorption, ΔG° (kJ/mol); coefficient of determination, R2.
ΔH°
kJ/mol
ΔS°
kJ/mol.K
ΔG°
kJ/mol
R2
BSA−40.34−0.20723.950.99
Collagen 2.44−0.06923.680.95
Elastin −89.96−0.35828.400.94
Table 4. Parameters from Raman spectra: the D band is related to scattering from local defects or disorders present in carbon, and the G bands arise from the in-plane diverging stretching of the C–C bonds in the graphitic structure, and (2D) is related to the number of graphene layers. ID/IG is the intensity ratio of the D and G bands, which refers to the amount of defects existing in the graphene matter. The intensity ratio of 2D/G is related to the number of graphene layers in the matrix.
SampleD
cm−1
G
cm−1
2DID/IG2D/G
rGO1342159526641.170.142
rGO-BSA1342158826691.190.226
rGO-Collagen1342161016921.200.144
rGO-Elastin1347159127001.160.173
Table 5. Parameters from FT-IR using an attenuated total reflectance (ATR) for rGO and rGO-proteins.
C=C (cm−1)Carboxyl C=O (cm−1)Carbonyl C-O (cm−1)H-Bonding (cm−1)
rGO1603173612663650
rGO+BSA1590176012273701
rGO+Collagen1592177412473618
rGO+Elastin1600177012503655
Table 6. Specific capacitance for the tested hydrogels.
HydrogelsSpecific Capacitance (F/g)
Alginate6.60 × 10−6
rGO + alginate1.84 × 10−5
BSA + rGO + alginate1.88 × 10−5
Collagen + rGO + alginate3.17 × 10−5
elastin + rGO + alginate1.20 × 10−5
Publisher’s Note: MDPI stays neutral with regard to jurisdictional claims in published maps and institutional affiliations.

