Article

In Vitro Evaluation of Hyperthermia Magnetic Technique Indicating the Best Strategy for Internalization of Magnetic Nanoparticles Applied in Glioblastoma Tumor Cells

by
Javier B. Mamani
1,
Taylla K. F. Souza
1,
Mariana P. Nucci
1,2,
Fernando A. Oliveira
1,
Leopoldo P. Nucci
3,
Arielly H. Alves
1,
Gabriel N. A. Rego
1,
Luciana Marti
1,† and
Lionel F. Gamarra
1,*,†
1
Hospital Israelita Albert Einstein, São Paulo 05652-000, SP, Brazil
2
LIM44-Hospital das Clínicas da Faculdade Medicina da Universidade de São Paulo, São Paulo 05403-000, SP, Brazil
3
Centro Universitário do Planalto Central, Brasília 72445-020, DF, Brazil
*
Author to whom correspondence should be addressed.
These authors contributed equally to this work.
Pharmaceutics 2021, 13(8), 1219; https://doi.org/10.3390/pharmaceutics13081219
Submission received: 27 June 2021 / Revised: 4 August 2021 / Accepted: 4 August 2021 / Published: 7 August 2021
(This article belongs to the Special Issue Magnetic Nanoparticles for Therapy and Diagnosis in Nanomedicine)

Abstract

:
This in vitro study aims to evaluate the magnetic hyperthermia (MHT) technique and the best strategy for internalization of magnetic nanoparticles coated with aminosilane (SPIONAmine) in glioblastoma tumor cells. SPIONAmine of 50 and 100 nm were used for specific absorption rate (SAR) analysis, performing the MHT with intensities of 50, 150, and 300 Gauss and frequencies varying between 305 and 557 kHz. The internalization strategy was performed using 100, 200, and 300 µgFe/mL of SPIONAmine, with or without Poly-L-Lysine (PLL) and filter, and with or without static or dynamic magnet field. The cell viability was evaluated after determination of MHT best condition of SPIONAmine internalization. The maximum SAR values of SPIONAmine (50 nm) and SPIONAmine (100 nm) identified were 184.41 W/g and 337.83 W/g, respectively, using a frequency of 557 kHz and intensity of 300 Gauss (≈23.93 kA/m). The best internalization strategy was 100 µgFe/mL of SPIONAmine (100 nm) using PLL with filter and dynamic magnet field, submitted to MHT for 40 min at 44 °C. This condition displayed 70.0% decreased in cell viability by flow cytometry and 68.1% by BLI. We can conclude that our study is promising as an antitumor treatment, based on intra- and extracellular MHT effects. The optimization of the nanoparticles internalization process associated with their magnetic characteristics potentiates the extracellular acute and late intracellular effect of MHT achieving greater efficiency in the therapeutic process.

1. Introduction

The treatment of cancer remains considered as one of the most challenging health issue. Despite recent, intensive, and rapid advances in new technologies, drugs, and therapies against cancer during the last decades, the glioblastoma multiforme (GBM) is still the most prevalent (14.5% of all tumors and 48.6% of malignant tumors) and the most refractory of the gliomas in adults [1,2]. GMB represents 76% of all gliomas [3], with a high rate of patients deaths (15,000/year in the United States), and less than 10% of patients achieve a 5-year survival rate [4,5]. The main therapeutics approaches for GBM tumors include radiation therapy, chemotherapy, thermal therapy, and surgeries focusing on the best technique of tumor resection; these therapies can be used isolated or combined [6,7]. Regarding the low efficacy of the GBM therapies mentioned above, further studies to improve and/or innovate the therapeutic approach for GBM are required. Nowadays, alternative therapies have been explored, such as cancer immunotherapy, magnetic hyperthermia (MHT), photodynamic therapy, and other treatments that use novel therapeutic agents [8]. The treatments focusing on thermal heating are of great value, as tumor cells have lower tolerance to thermal variance effect compared to healthy cells [6].
In this sense, MHT has been highlighted as a noninvasive approach, which does not require surgery and causes a local effect without damaging healthy cells [2]. This technique has demonstrated good results in different pre-clinical studies with animal models [9,10,11] and also in phase III clinical trials in humans [12,13,14], being promising for treating cancer compared to other heating techniques [15]. This technique involves the administration of MNPs, among them the superparamagnetic iron oxide nanoparticles (SPION), followed by the application of an alternating external magnetic field, which generates heat within the tumor area [16]. The heating produced by MHT remains sustained in temperatures above 43 °C, leading to tumor cell lyses due to low energy dissipation generated by heat associated with the heterogeneity of oxygen supply and nutrient demand caused by excessive sinuous ramifications of blood vessels and absence of lymphatic vessels. This increase in temperature alters the function of many structural and enzymatic proteins in the tumor cells, which, in turn, alters the cellular index of proliferation and induces their death [17,18], as these cells are more sensitive to heat than healthy cells.
The MHT technique is based on two relaxation processes of magnetic nanoparticles—the Néel and the Brownian relaxations, which are associated with intracellular and extracellular MHT processes [19]. For nanoparticles internalized into tumor cells and submitted to an alternating magnetic field (AMF), only the Neel relaxation contributes to thermal energy (intracellular MHT) whereas Brownian relaxation is not relevant, due to the high viscosity of the medium that does not allow the nanoparticles to rotate freely. For nanoparticles non-internalized by cells, the contribution of Néel and Brownian relaxations are relevant for the extracellular MHT process [20].
However, some challenges are involved in the success of this technique such as the use of magnetic nanoparticles (MNPs) that are biocompatible, biodegradable, and with good colloidal stability, as well as the use of MNPs in lower amounts that better generates the local heat capability [8]. The available MHT techniques do not effectively direct the heat to the tumor, therefore currently display low efficiency. Accordingly, this lack of efficiency has led to the development of nanomaterials with properties able to dissipate energy at the tumor site, increasing the efficiency and specificity for deeper tumors [6,21]. In addition, the development of different strategies for the cell internalization process and/or development of nanoparticles with paramagnetic properties [22] as iron oxide nanoparticles also contributes to enhancing this therapy efficiency.
Nonetheless, the MHT requires an initial efficiency evaluation through in vitro and in vivo studies. To this end, the evaluation of several parameters is required, among them, the type of tumor cell, nanomaterial properties, AMF characteristics, therapeutic temperature, and intra- and extracellular process of MHT [23].
The relevance of the in vitro MTH evaluation studies is related to parameters required for envisioning therapeutic strategies for cancer treatment, such as the concentration of magnetic nanoparticles, guidance of the nanomaterial, and time limit application of the therapy, which are all of vital importance to determine the therapy efficiency. In this sense, the in vitro evaluation of parameters involved in the MHT technique can guide the results extrapolation for the development of in vivo studies.
Thus, the aim of this in vitro study was to evaluate the hyperthermia magnetic technique by flow cytometry and bioluminescence (BLI) and the best strategy of internalization of magnetic nanoparticles coated with aminosilane applied by glioblastoma tumor cells, where the internalization strategies were evaluated in the presence of static or dynamic magnetic field, in addition to the use of transfection agent and filtering.

2. Materials and Methods

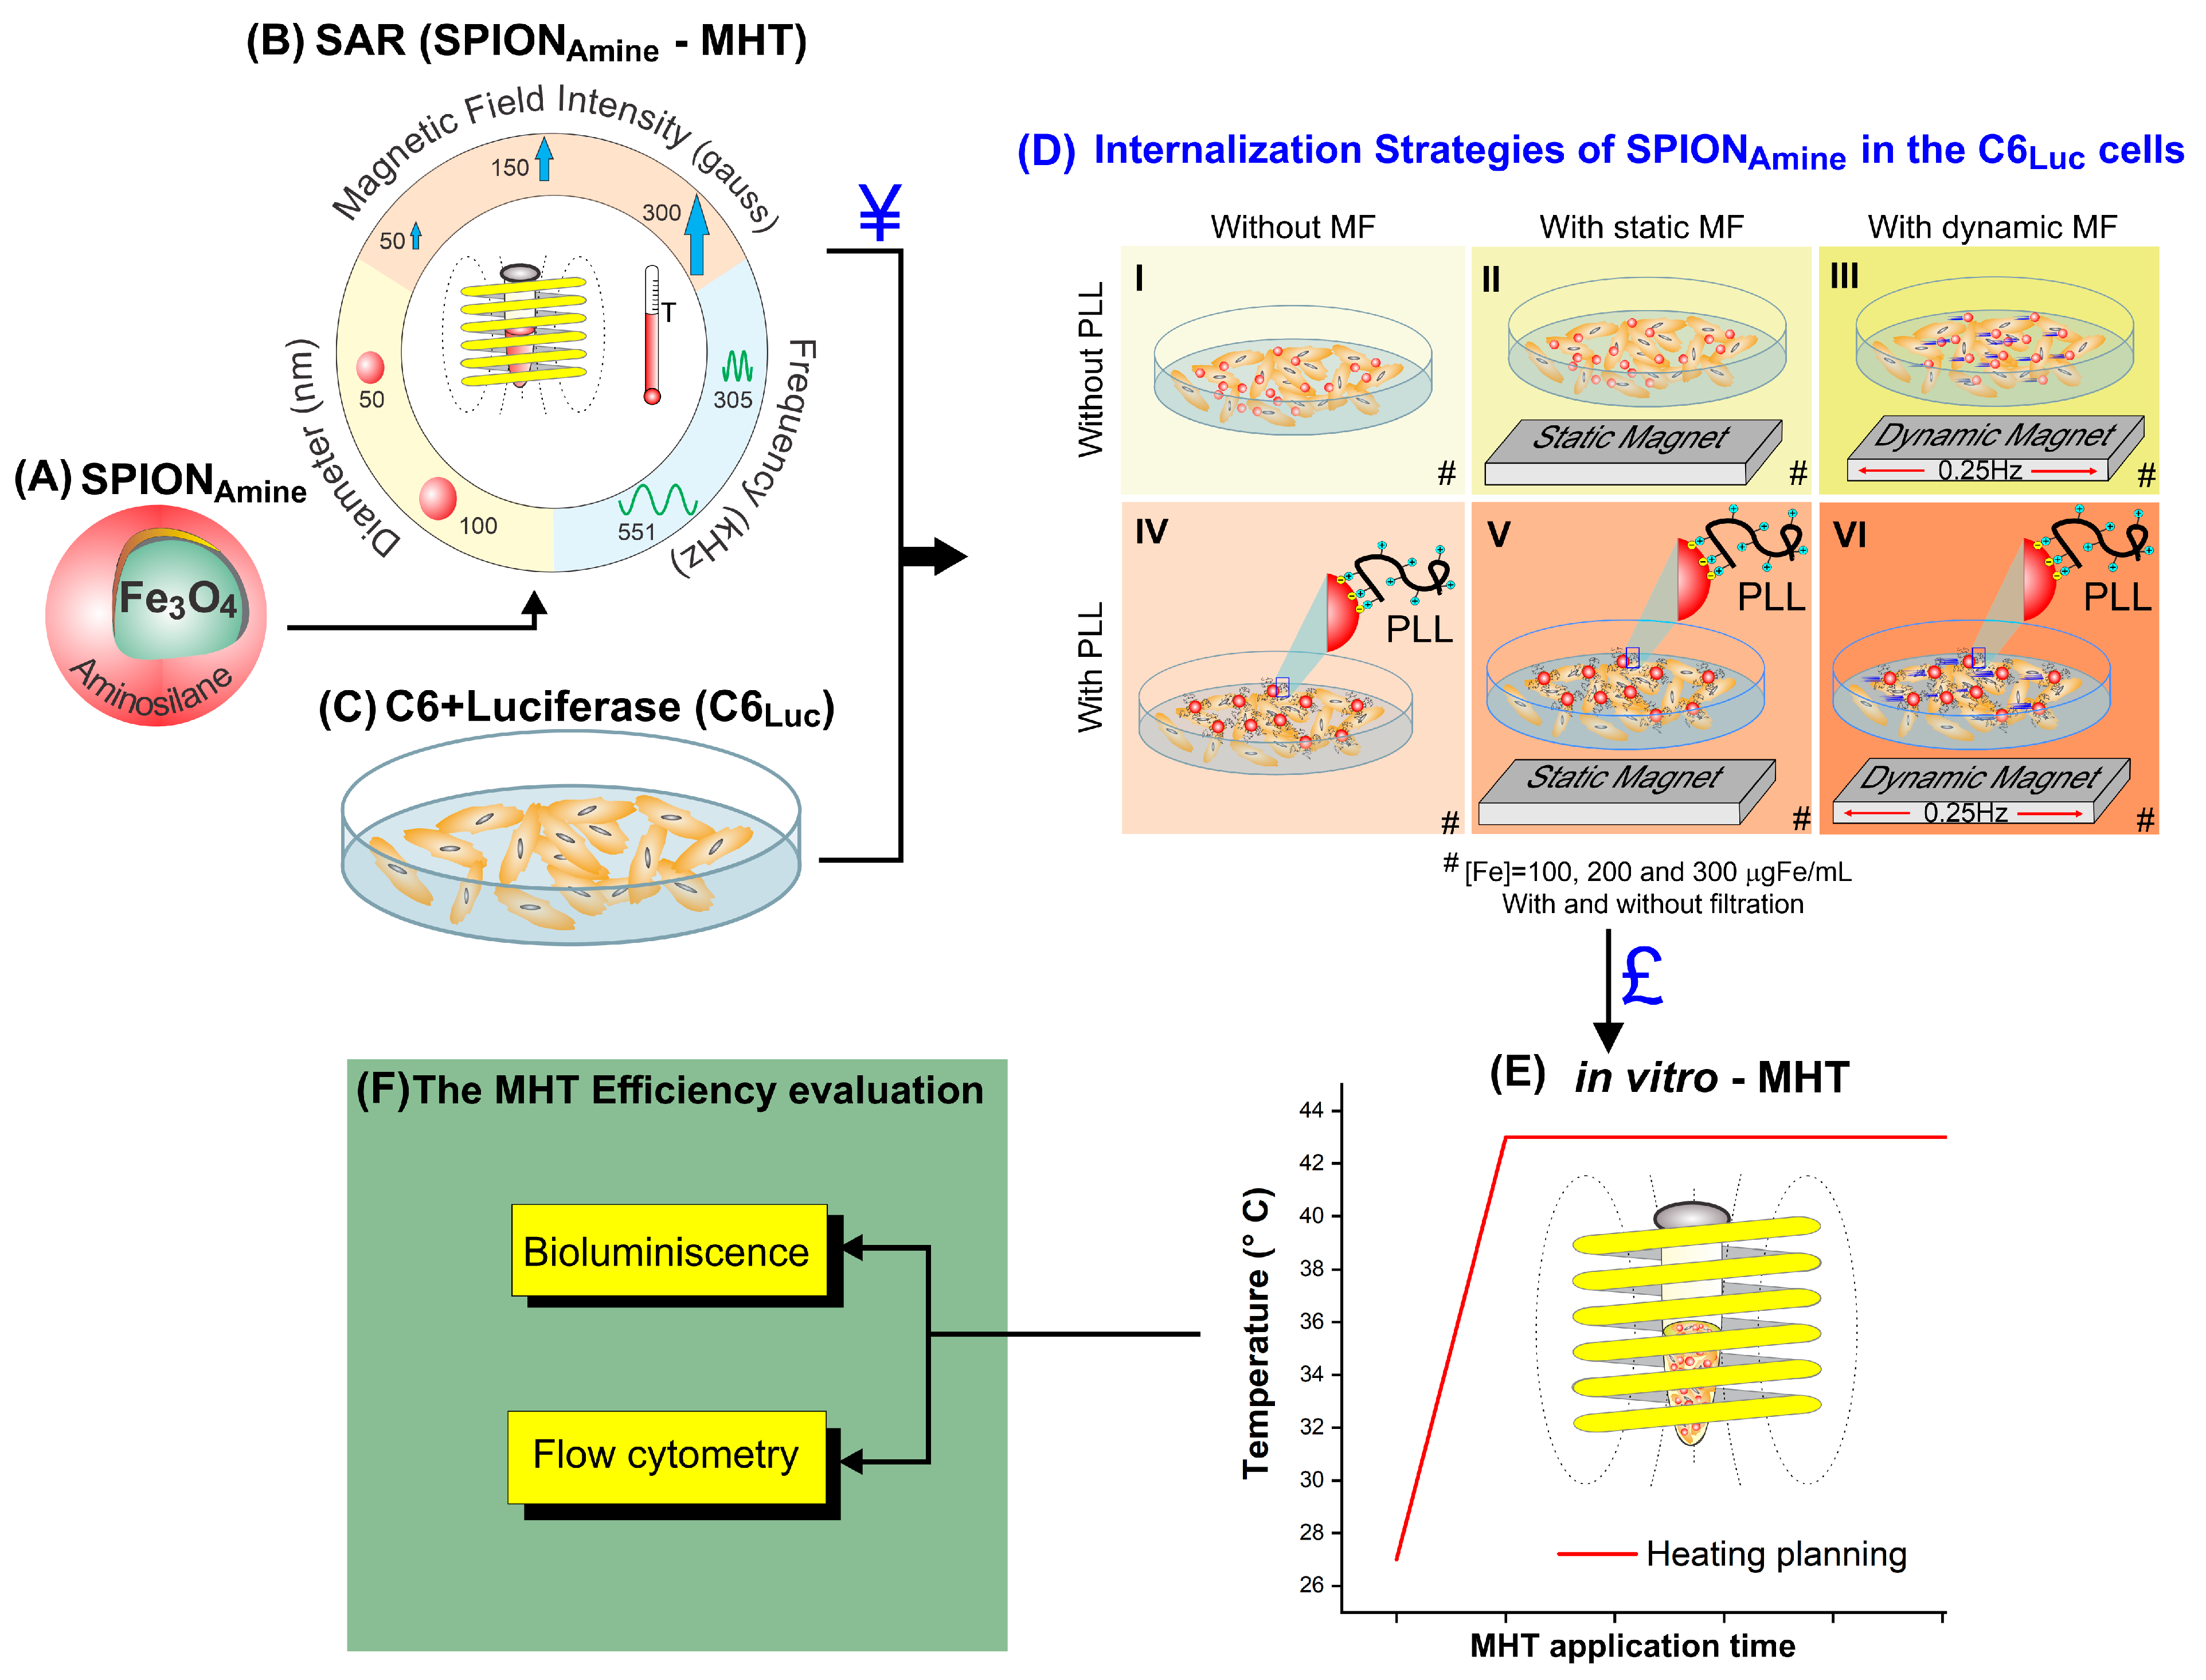
2.1. Experimental Design

The experimental design was performed in four phases. The first phase consisted in the specific absorption rate (SAR) process determination of the superparamagnetic iron oxide nanoparticles coated with aminosilane (SPIONAmineFigure 1A) using two SPION sizes, two frequencies, and three magnetic field intensities (Figure 1B), and the C6 cells transfection with luciferase (Figure 1C).
The best SAR value (Figure 1, ¥) determined the SPION used in the second phase, the internalization process of the SPIONAmine into the C6Luc cells in three concentrations 100, 200, and 300 µgFe/mL (#) using different strategies (Figure 1D). The strategies of internalization were performed combining the following conditions: cell labeling without MF (Figure 1(D-I)), with static MF (Figure 1(D-II)), with dynamic MF (Figure 1(D-III)), in the absence of Poly-L-Lysine (PLL), and the same conditions in the presence of PLL (IV, V, and VI, respectively), combined with and without filtration (#). The best C6 internalization strategy (Figure 1£), as well as the best frequency and magnetic field intensity (Figure 1B) were performed in a third phase, which consisted of MHT in vitro assays (Figure 1E), following a heating plane (red line) to keep the therapeutic temperature constant. In the last phase, the MHT therapy efficiency evaluation was performed by using the BLI technique and the flow cytometry analysis (Figure 1F).

2.2. Superparamagnetic Iron Oxide Nanoparticles Coated with Aminosilane (SPIONAmine)

The SPIONAmine functionalized with amine group (−NH2) is a commercial colloidal solution dispersed in aqueous medium (Chemicell GmbH, Berlin, Germany) at a concentration of 25 mg/mL, density of 1.25 g/cm3, with hydrodynamic diameter of 50 nm and 100 nm and number of particles 1.3 × 10¹⁶/g and 1.8 × 10¹⁵/g respectively.
The SPIONAmine hydrodynamic diameter value (size of distribution) and zeta potential were measured using the dynamic light scattering (DLS) technique by Zetasizer Nano S system (Malvern, UK). The hydrodynamic size distribution was obtained at 173° manual angle, average of 25 and time of 10 s per medium. Measurements were done on fixed position and at 25 °C with 120 s equilibrium period.
The mean diameter was obtained by fitting the experimental data to a log-normal distribution function f ( D p ) = 1 2 π ω P D P exp ( ( ln D P ln D P 0 ) 2 2 ω P 2 ) with mean diameter < D P > = D P 0 exp ( ω P 2 / 2 ) and standard deviation of mean diameter σ P = D P 0 [ exp ( 2 ω P 2 ) exp ( ω P 2 ) ] 1 / 2 .
For the zeta potential measures, the samples pH value was determined as 7.4 and kept at 25 °C of temperature.

2.3. Magneto Hyperthermia Equipment Configuration

The MHT application used a commercial alternating magnetic field system DM100 (nB nanoScale Biomagnetics), which supports a magnetic field of intensity range from 50 to 300 Gauss and an oscillation frequency range from 305 to 557 kHz. The temperature measures were performed using a fiber optic system (ReflexTM, Neoptix) with an accuracy of ±0.3 °C. The MHT system was refrigerated using the minichiller MCA-5-RI (Mecalor, Brazil) system adjusted to a water flow of 2 m³/h and 2.8 bar of pressure, maintaining the water temperature at 12 °C.

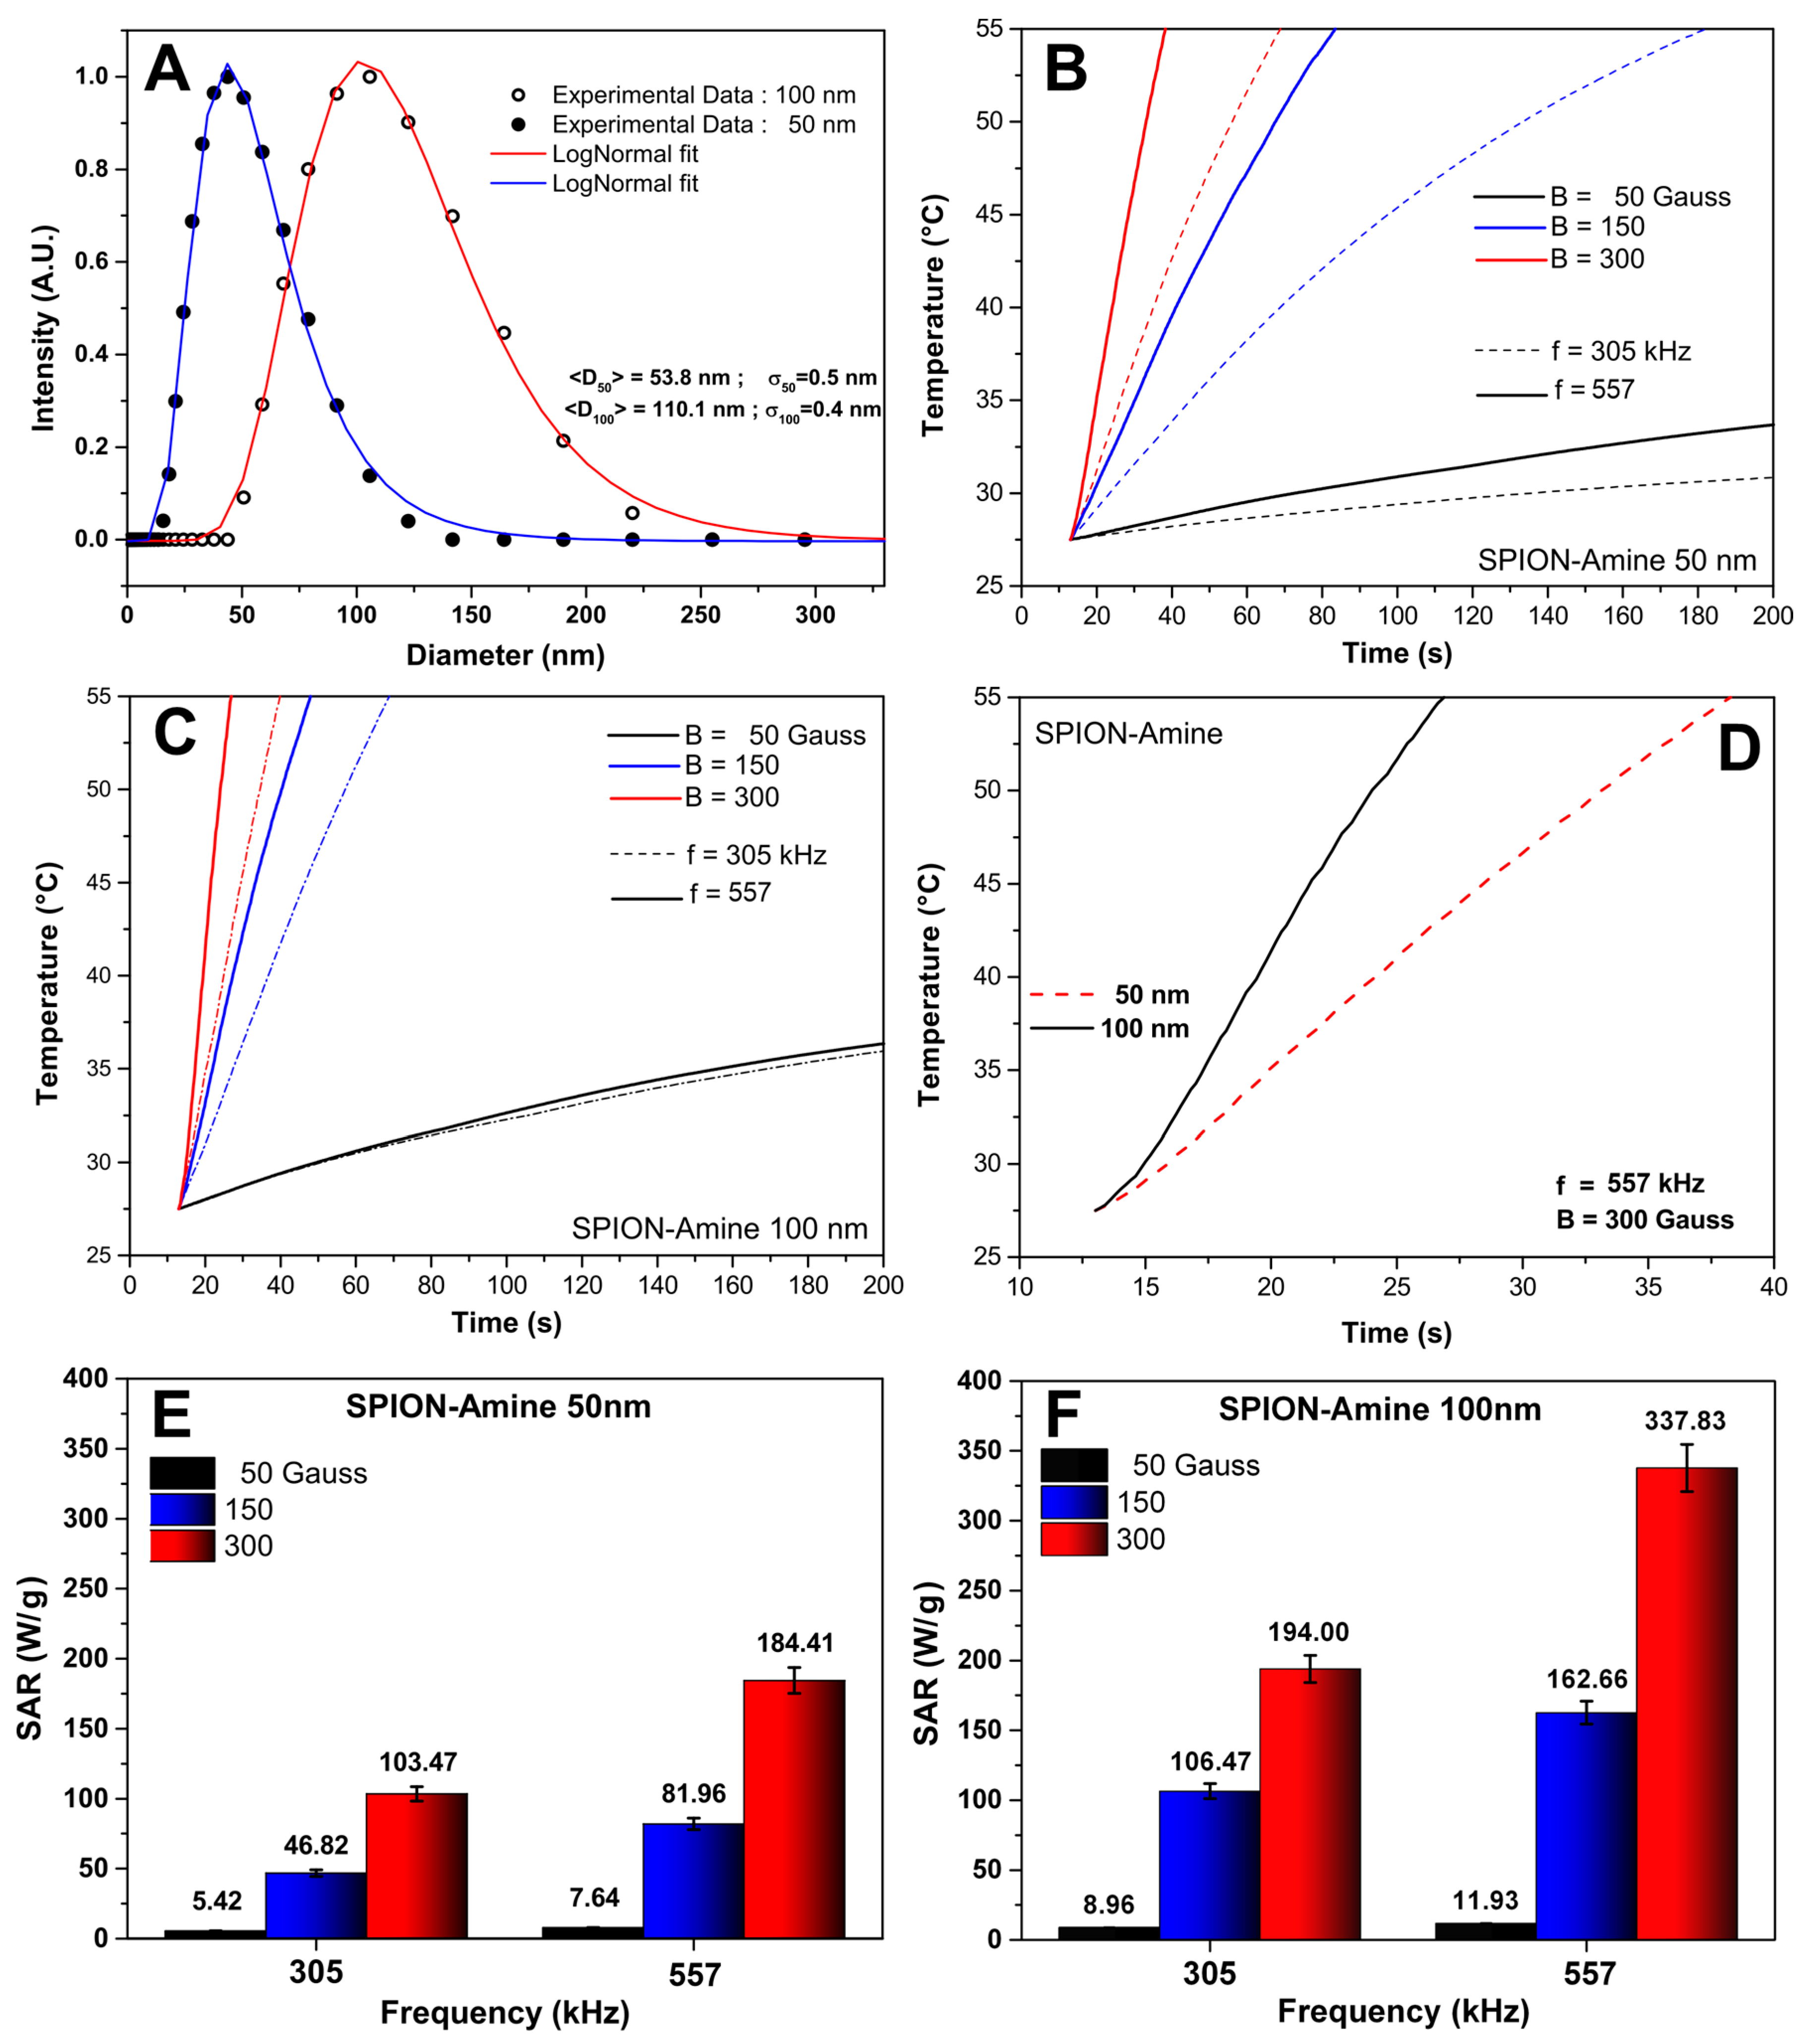
2.4. SPIONAmine Heating Potential

In order to determine the heating potential of nanoparticles, 1 mL of SPIONAmine (50 and 100 nm) at a concentration of 10 mgFe/mL dispersed in aqueous medium and thermally insulated in a glass recipient were used, maintaining the room temperature at 20 °C. Heating curves (temperature versus time) of samples were acquired in the following configurations: magnetic field of 50, 150, and 300 Gauss associated with frequencies of 305 and 557 kHz, until achieve the temperature of 55 °C or 200 s of analysis. The heating curves generated were used to calculate SAR values.

2.5. Specific Absorption Rate (SAR) Measurement of SPIONAmine in Colloidal Suspensions

SAR reports the heat emitted by SPIONAmine per unit of mass exposed to AMF and depend on factors such as magnetic field strength, frequency (f), permeability (μ), and SPIONAmine size and shape. The two sizes of the SPIONAmine SAR were calculated using the software Zar v1.0 (nanoScale Biomagnetics, Zaragoza, Spain), and the relation S A R   ( W / g ) = m N P c N P + m 1 c 1   m N P   ( d T d t )   m a x , where m N P is the nanoparticles mass 25 kg/m³: m 1   mass of liquid (1000 kg/m³), c N P : specific heat of the nanoparticles (0.16 kCal/kg°C), c 1 : specific heat of the liquid (1.0 kCal/kg°C), and ( d T / d t ) m a x : maximum gradient of the temperature curve of the colloid submitted to an InH test (K/s).

2.6. Cells Culture and Lentiviral Transduction for Luciferase Expression

The cells were cultured in RPMI culture medium (GIBCO® Invitrogen Corporation, CA, USA), supplemented with 10% FBS (GIBCO® Invitrogen Corporation, Carlsbad, CA, USA), and 1% antibiotic–antimycotic solution (GIBCO® Invitrogen Corporation, Carlsbad, CA, USA). The cells were incubated in a humidified atmosphere with 5% CO2 at 37 °C (Thermo Fisher Scientific Inc. 3110, Waltham, MA, USA), until achieving the desired density of 75% confluence.
The virion production used for lentiviral transduction was described in a previous study [24]. For lentiviral transduction, 2 × 10⁵ C6 glioma cells per well in a 24-well plate, cultured in 2 mL of RPMI received 10 MOI/cell of the lentiviral vector pMSCV-Luc2-T2A-Pure carrying the pseudotyped viruses of the vesicular stomatitis virus (VSV-G) [25], that codifies the bioluminescent reporter luciferase 2 (viral title: 2.4 × 10⁸ UI/mL), and puromycin resistance gene [26]. To favor the vector entry into C6 cells, we also added polybrene to the culture medium (8 µg polybrene/mL of RPMI). The next day, and after every 2 days we added 1 µg/mL puromycin (Thermo-Fisher Scientific). After two weeks in culture, only the puromycin-resistant cells survived expressing luciferase 2 protein.

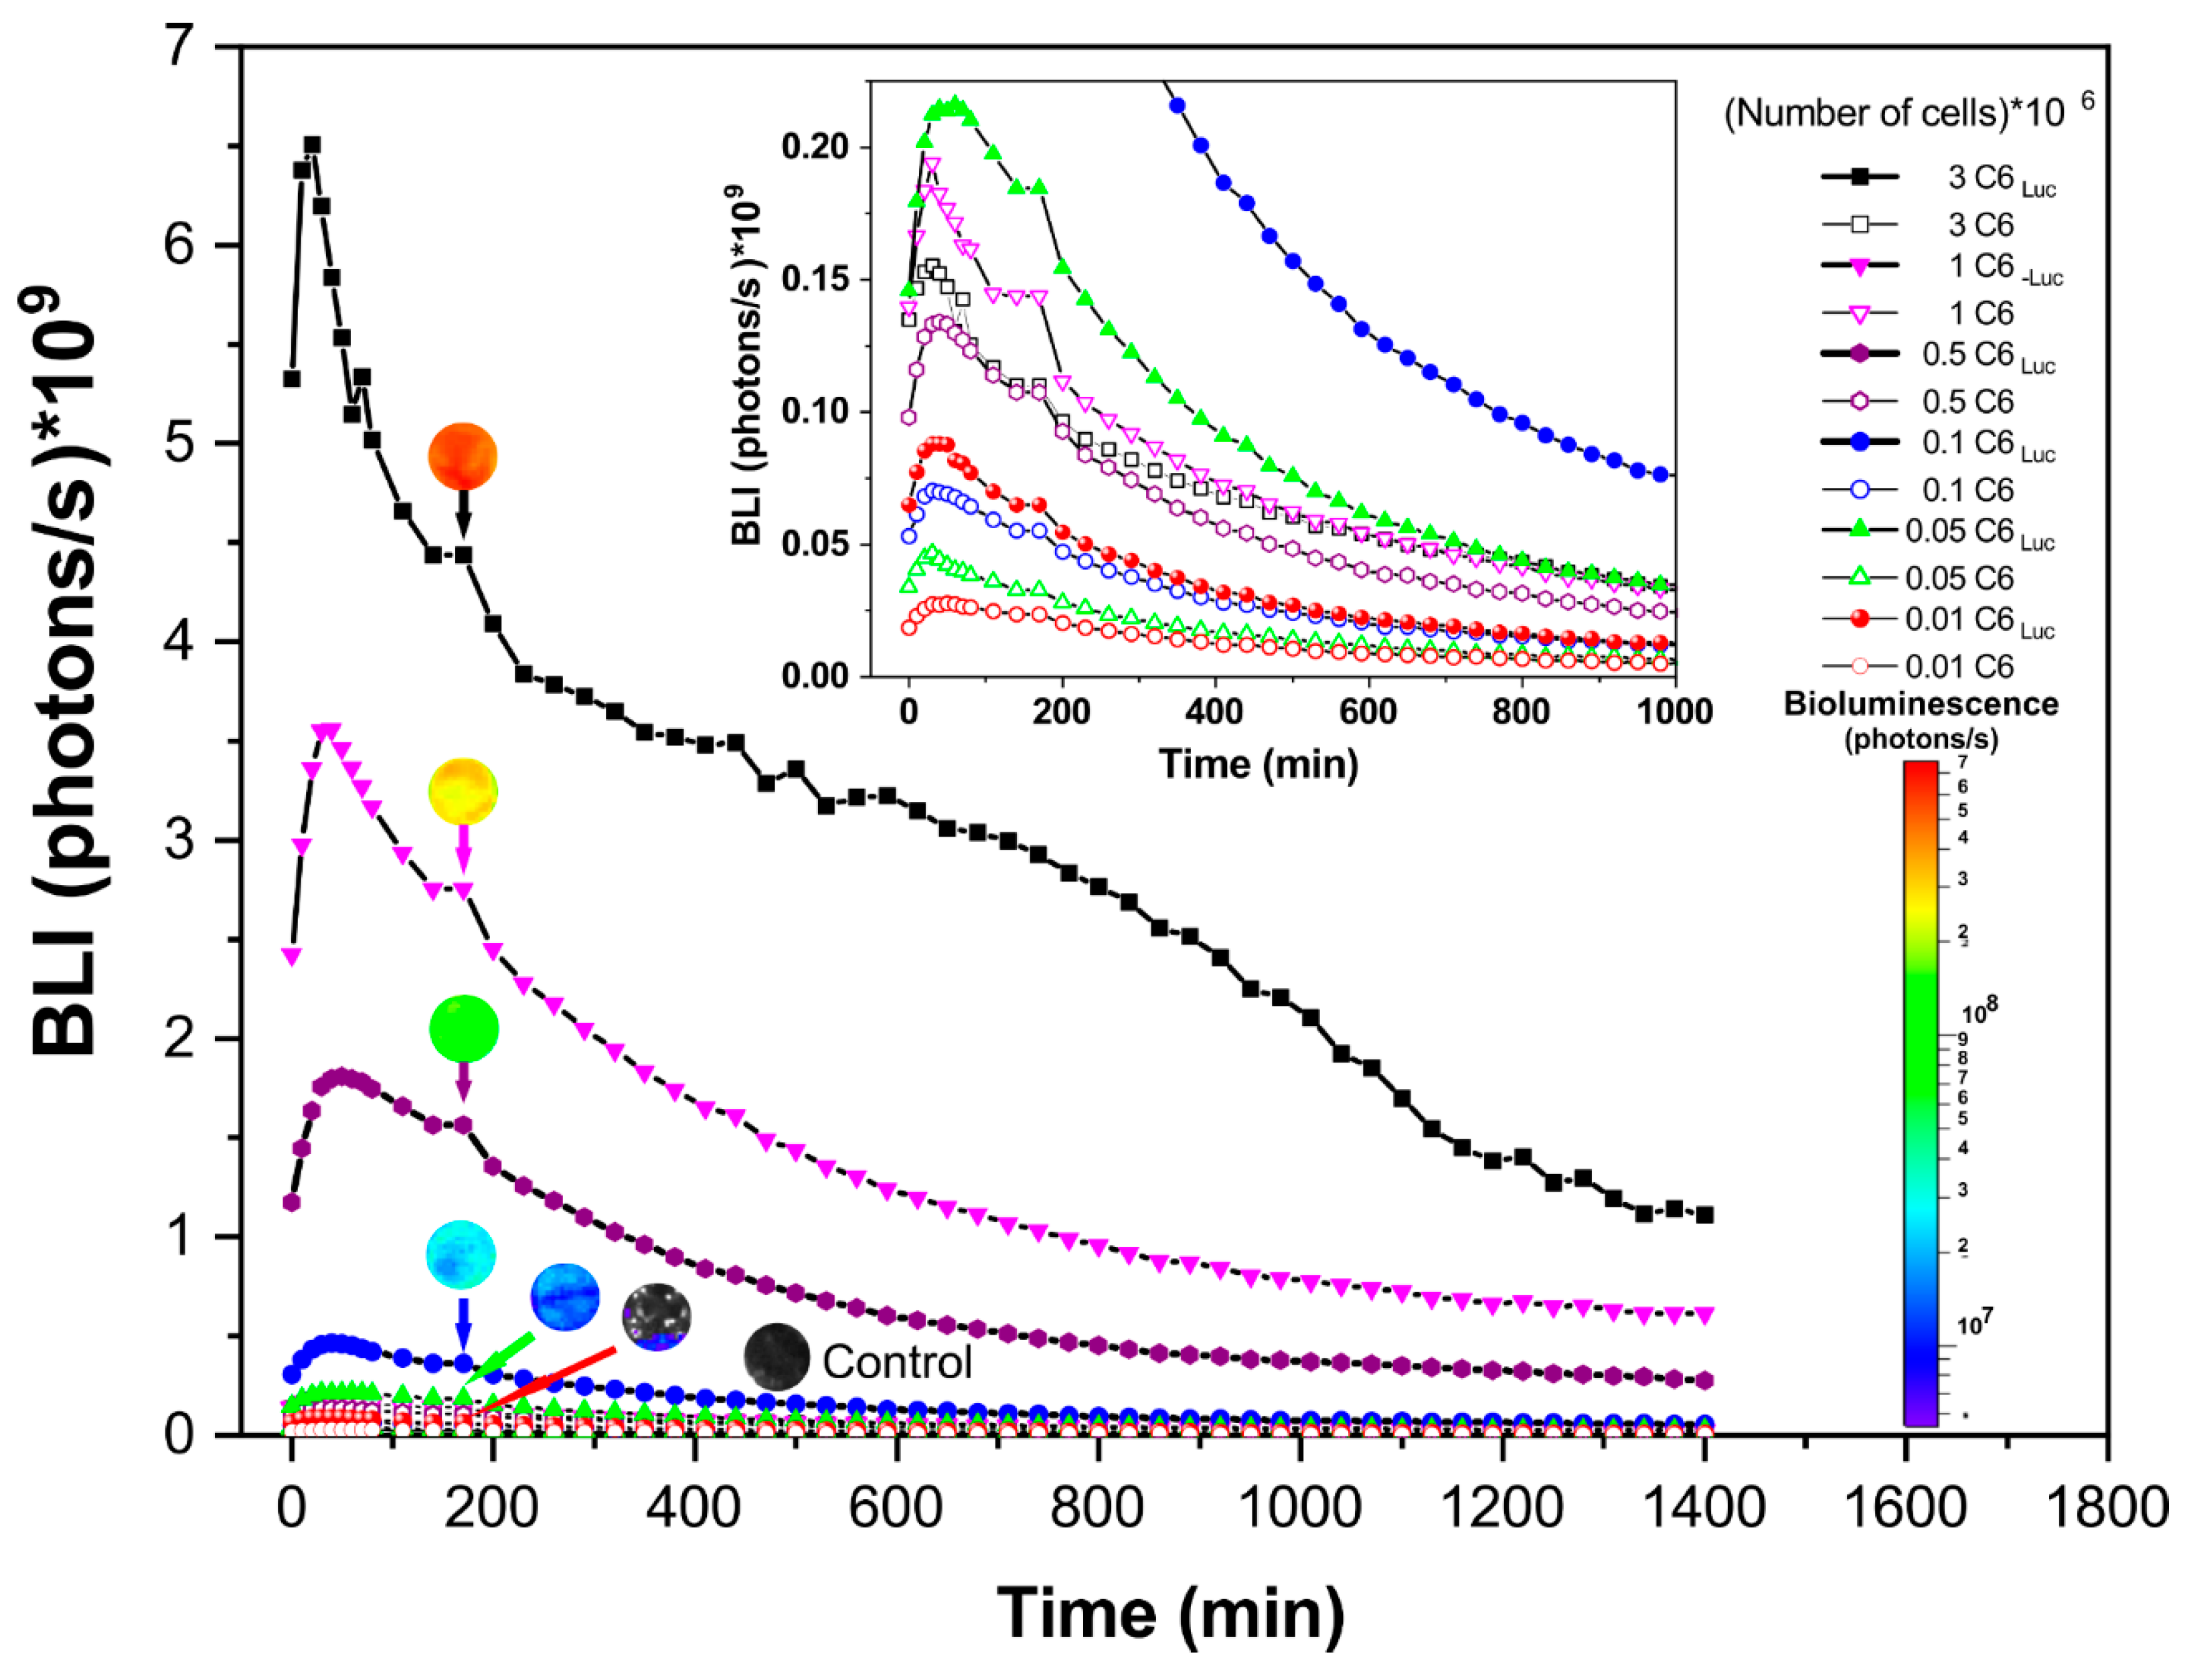
2.7. Kinetics of Bioluminescent Signal in C6Luc Cells

The kinetic curve of the C6Luc BLI signal was performed to identify the timing of the maximum signal intensity peak and sensitivity detection. For this analysis, we used several cell concentrations/well 104, 5 × 10⁴, 105, 5 × 10⁵, 106, and 3 × 10⁶ in a 48-well plate. The BLI images were acquired by IVIS® Lumina LT Series III equipment (Xenogen Corp., Alameda, CA, USA), after addition of 100 μL of D-luciferin (50 mg/mL) (XenoLight, PerkinElmer). The BLI signal intensity was detected using the automatic exposition time, with f/stop of 4, binning of 8, and the field of view of 12.9 cm with 2 min of interval between each image over 24 h. For BLI image analysis selected regions of interest (ROI) of 2.5 cm2 in each well and processed the signal using the Living Image version 4.3.1 software (IVIS Imaging System) in photons/s units.

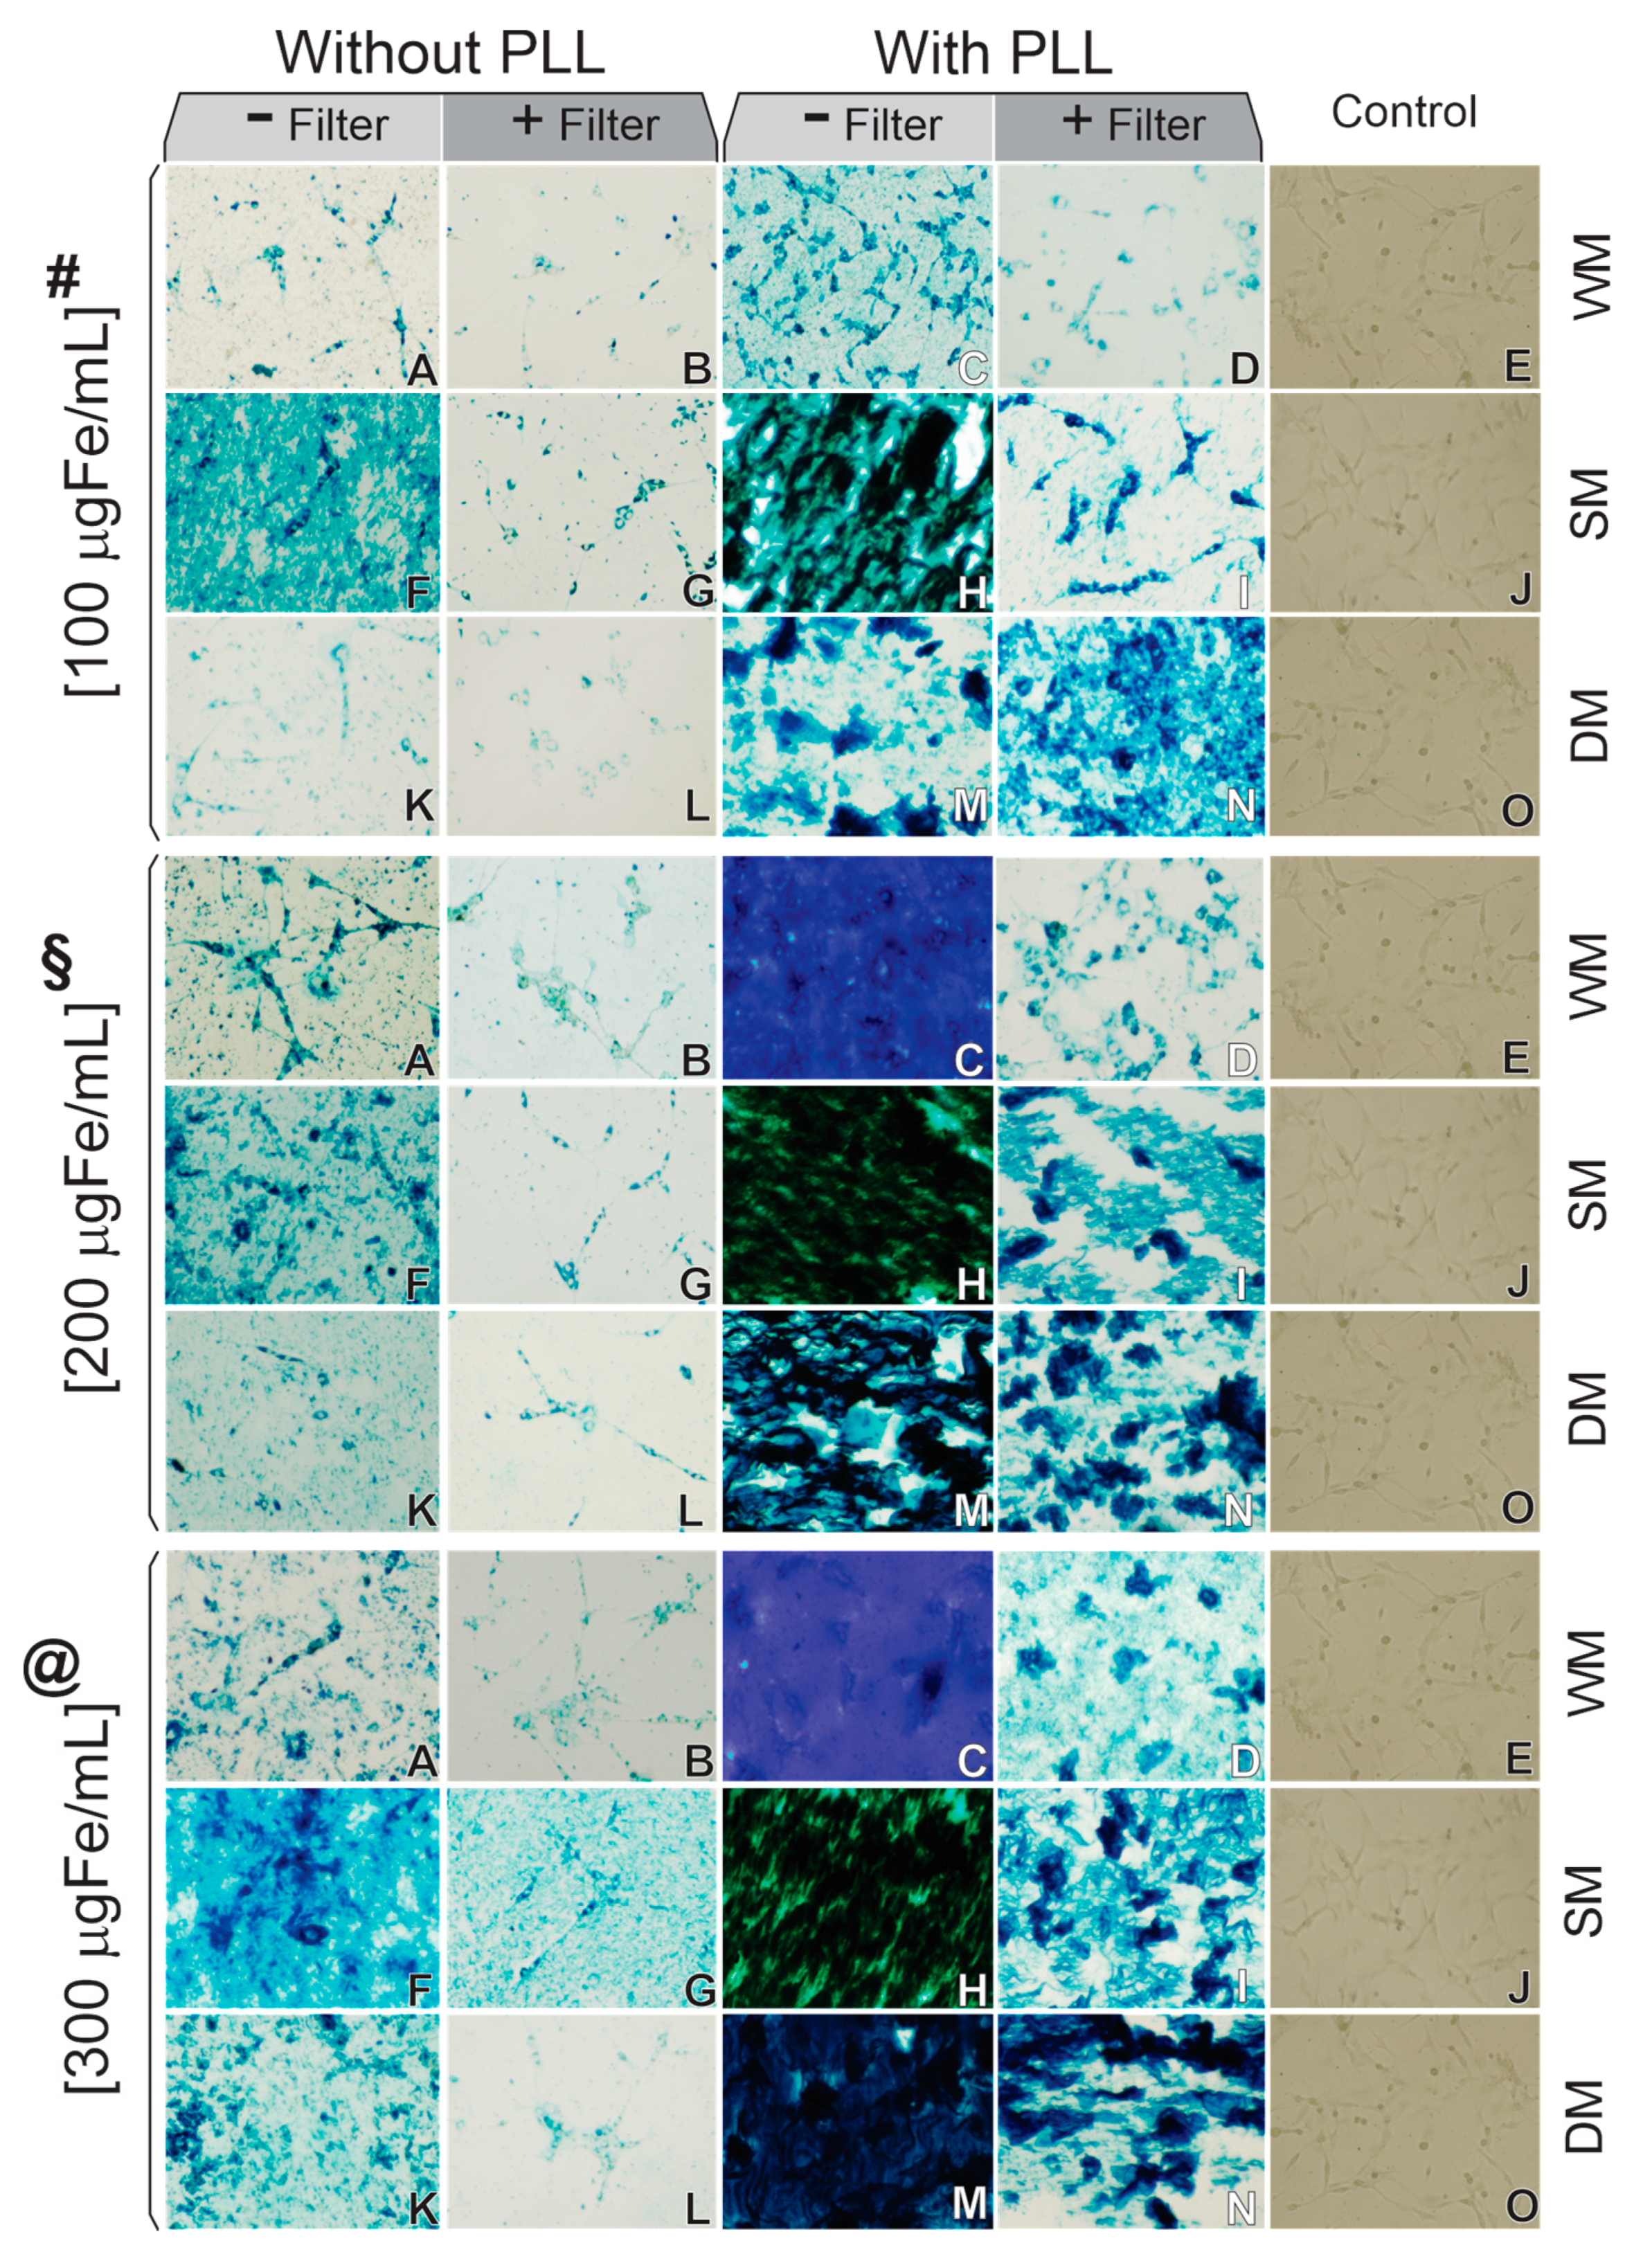
2.8. C6Luc Labeled with SPIONAmine: Strategies for Internalization

C6Luc labeling with SPIONAmine used hydrodynamic diameter with higher SAR value (¥) according to the experiment described in the Section 2.5 as illustrated in Figure 1B.
SPIONAmine best internalization strategy was determined using labeling process in different conditions such as in the presence of the static or dynamic magnetic field, using the transfection agent as PLL, and filter (Figure 1D), as also the use of three SPIONAmine concentrations. Thus, 106 cells/well plated into a 24-well plate with 2 mL of RPMI medium supplemented with 10% of FBS were cultivate until achieving a confluence of 70%, at 37 °C and 5% CO2, in an incubator FormaTM Series II (Thermo Fisher Scientific Inc. 3110, Waltham, MA, USA). Then, three different concentrations of SPIONAmine—100, 200, and 300 µgFe/mL—were used in the labeling of these cells for 18 h in the following conditions: without magnet, with static magnet positioned below the culture plate a neodymium–iron–boron magnet with 300 mT, or with dynamic magnet which the same magnet positioned below the plate culture, maintained in oscillatory horizontal movement in the frequency of 0.25 Hz, with or without filtration (0.45 μm syringe filter SARSTEDT, Nümbrecht, Germany) (Figure 1(DI–III)), and in the absence or presence of PLL at 0.75 mg/mL, with molecular weight of 300 kDa (Sigma, St. Louis, Mo, USA), due to their electrostatic interaction properties, as shown in Figure 1(DI–VI). The transfection agent complexation (PLL) with SPION for cell labeling is detailed in the Section 2.8.1.
In order to evaluate SPIONAmine internalization by C6Luc cells, these cells were washed twice with D-PBS (GIBCO® Invitrogen Corporation, CA, USA), fixed for 2 h in 4% paraformaldehyde, and stained with Prussian blue. The iron position inside the C6Luc cells, were evaluated according to an already established protocol [27,28,29]. Light field images were obtained on the FSX-100 inverted microscope OLYMPUS (Ireland, UK).

2.8.1. Complexation of SPIONAmine with Transfection Agent (PLL)

In order to facilitate the SPIONAmine internalization into C6, we used a PLL transfection agent. PLL is a positively charged amino acid polymer with a molecular weight of >300 KDa (Sigma, St. Louis, MO, USA), which favors an electrostatic interaction between cells and nanoparticles, mainly in non-phagocytic cells. PLL was complexed to SPIONAmine using a concentration of 100 µgFe/mL SPIONAmine and 0.75 mg/mL of PLL. The solution was diluted in a final volume 500 μL of RPMI supplemented with 10% FBS. Then, the solution was mixed with a vortex for 5 min and carried to ultrasound (Transonic T460/H—Elma) for 10 min at 37 °C. The zeta potential evaluation of SPIONAmine also was performed after the PLL complexation.

2.9. Evaluation of the Hydrodynamic Size Distribution and Zeta Potential of Different Colloidal Solutions Using in the Cellular Labeling

The hydrodynamic size distribution and zeta potential were evaluated in the same colloidal solutions used in cellular labeling, such as SPIONAmine+H2O, SPIONAmine+RPMI, SPIONAmine+RPMI+Filter, SPIONAmine+RPMI+PLL, SPIONAmine+RPMI+PLL+Filter, for which was applied the different strategies of internalization described in Section 2.8.
The samples were prepared with water or RPMI using the concentration of 100 µgFe/mL, with or without PLL transfection agent and filtering or not the solution.

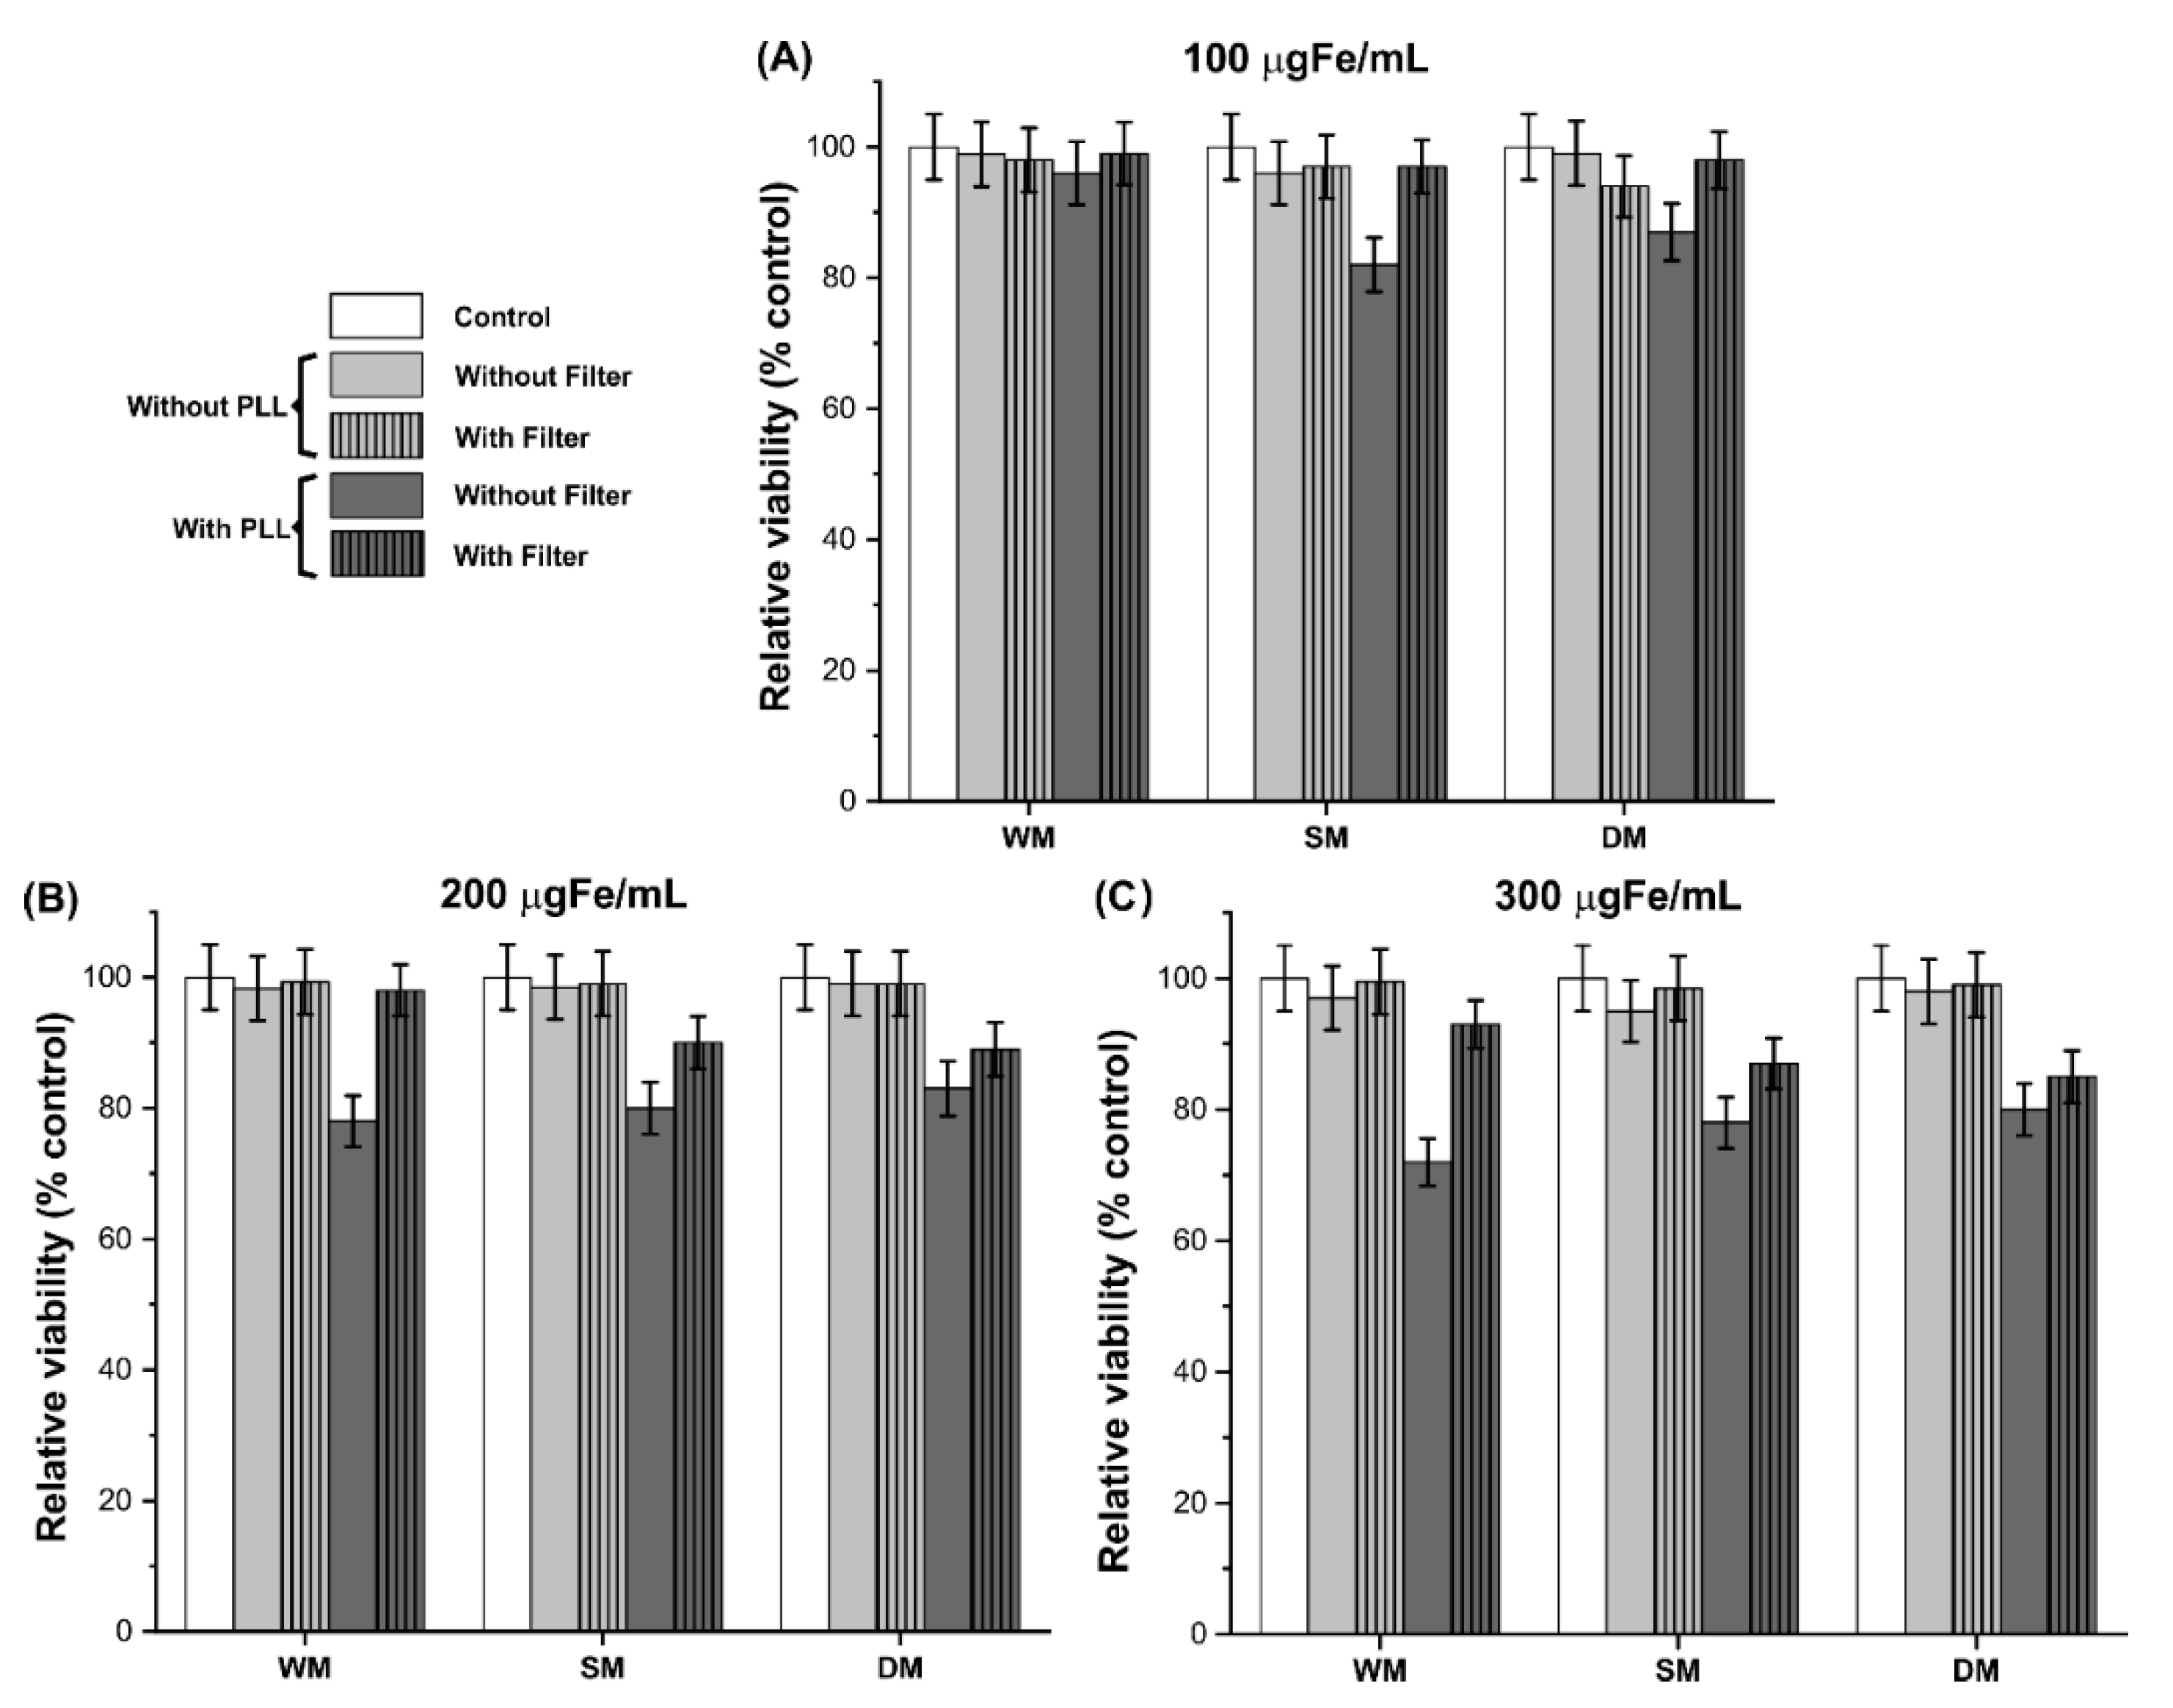
2.10. C6Luc Viability Evaluation after Labeling with SPIONAmine

C6Luc viability was evaluated using the yellow tetrazolium salt (3-(4,5-dimethylthiazol-2-yl)-2,5-diphenyltetrazolium bromide assay (MTT), C6Luc cells were grown in 96-well plates with a fresh culture medium. SPIONAmine was added to the cells and maintained in the same condition of labeling described as previously described in the Section 2.8. In addition, 100 μL of MTT reagent was added to the cells (final concentration 1 mg/mL) (Thiazolyl Blue Tetrazolium Bromide; Sigma-Aldrich) and incubated for four hours at 37 °C in 5% CO2, followed by the addition of actinomycin D (Sigma-Aldrich) used as a positive control for cell death. The concentration of cell death dose found in this assay was 0.25 μg/mL. After incubation, 100 μL of dimethyl sulfoxide (DMSO Hybri-Max—Sigma-Aldrich) was added to solubilize the formazan crystals formed. Readings were then performed in a DTX 880 Multimode Detector reader (Beckman Coulter) at 490 nm, with subtraction of plate absorbance at 650 nm. Percentage of C6Luc cells viability was calculated using the mean absorbance ratio of the samples triplicates test readings by the absorbance mean of the control wells. Thus, the cell viability is equal to the sample result divided by the control result ×100.

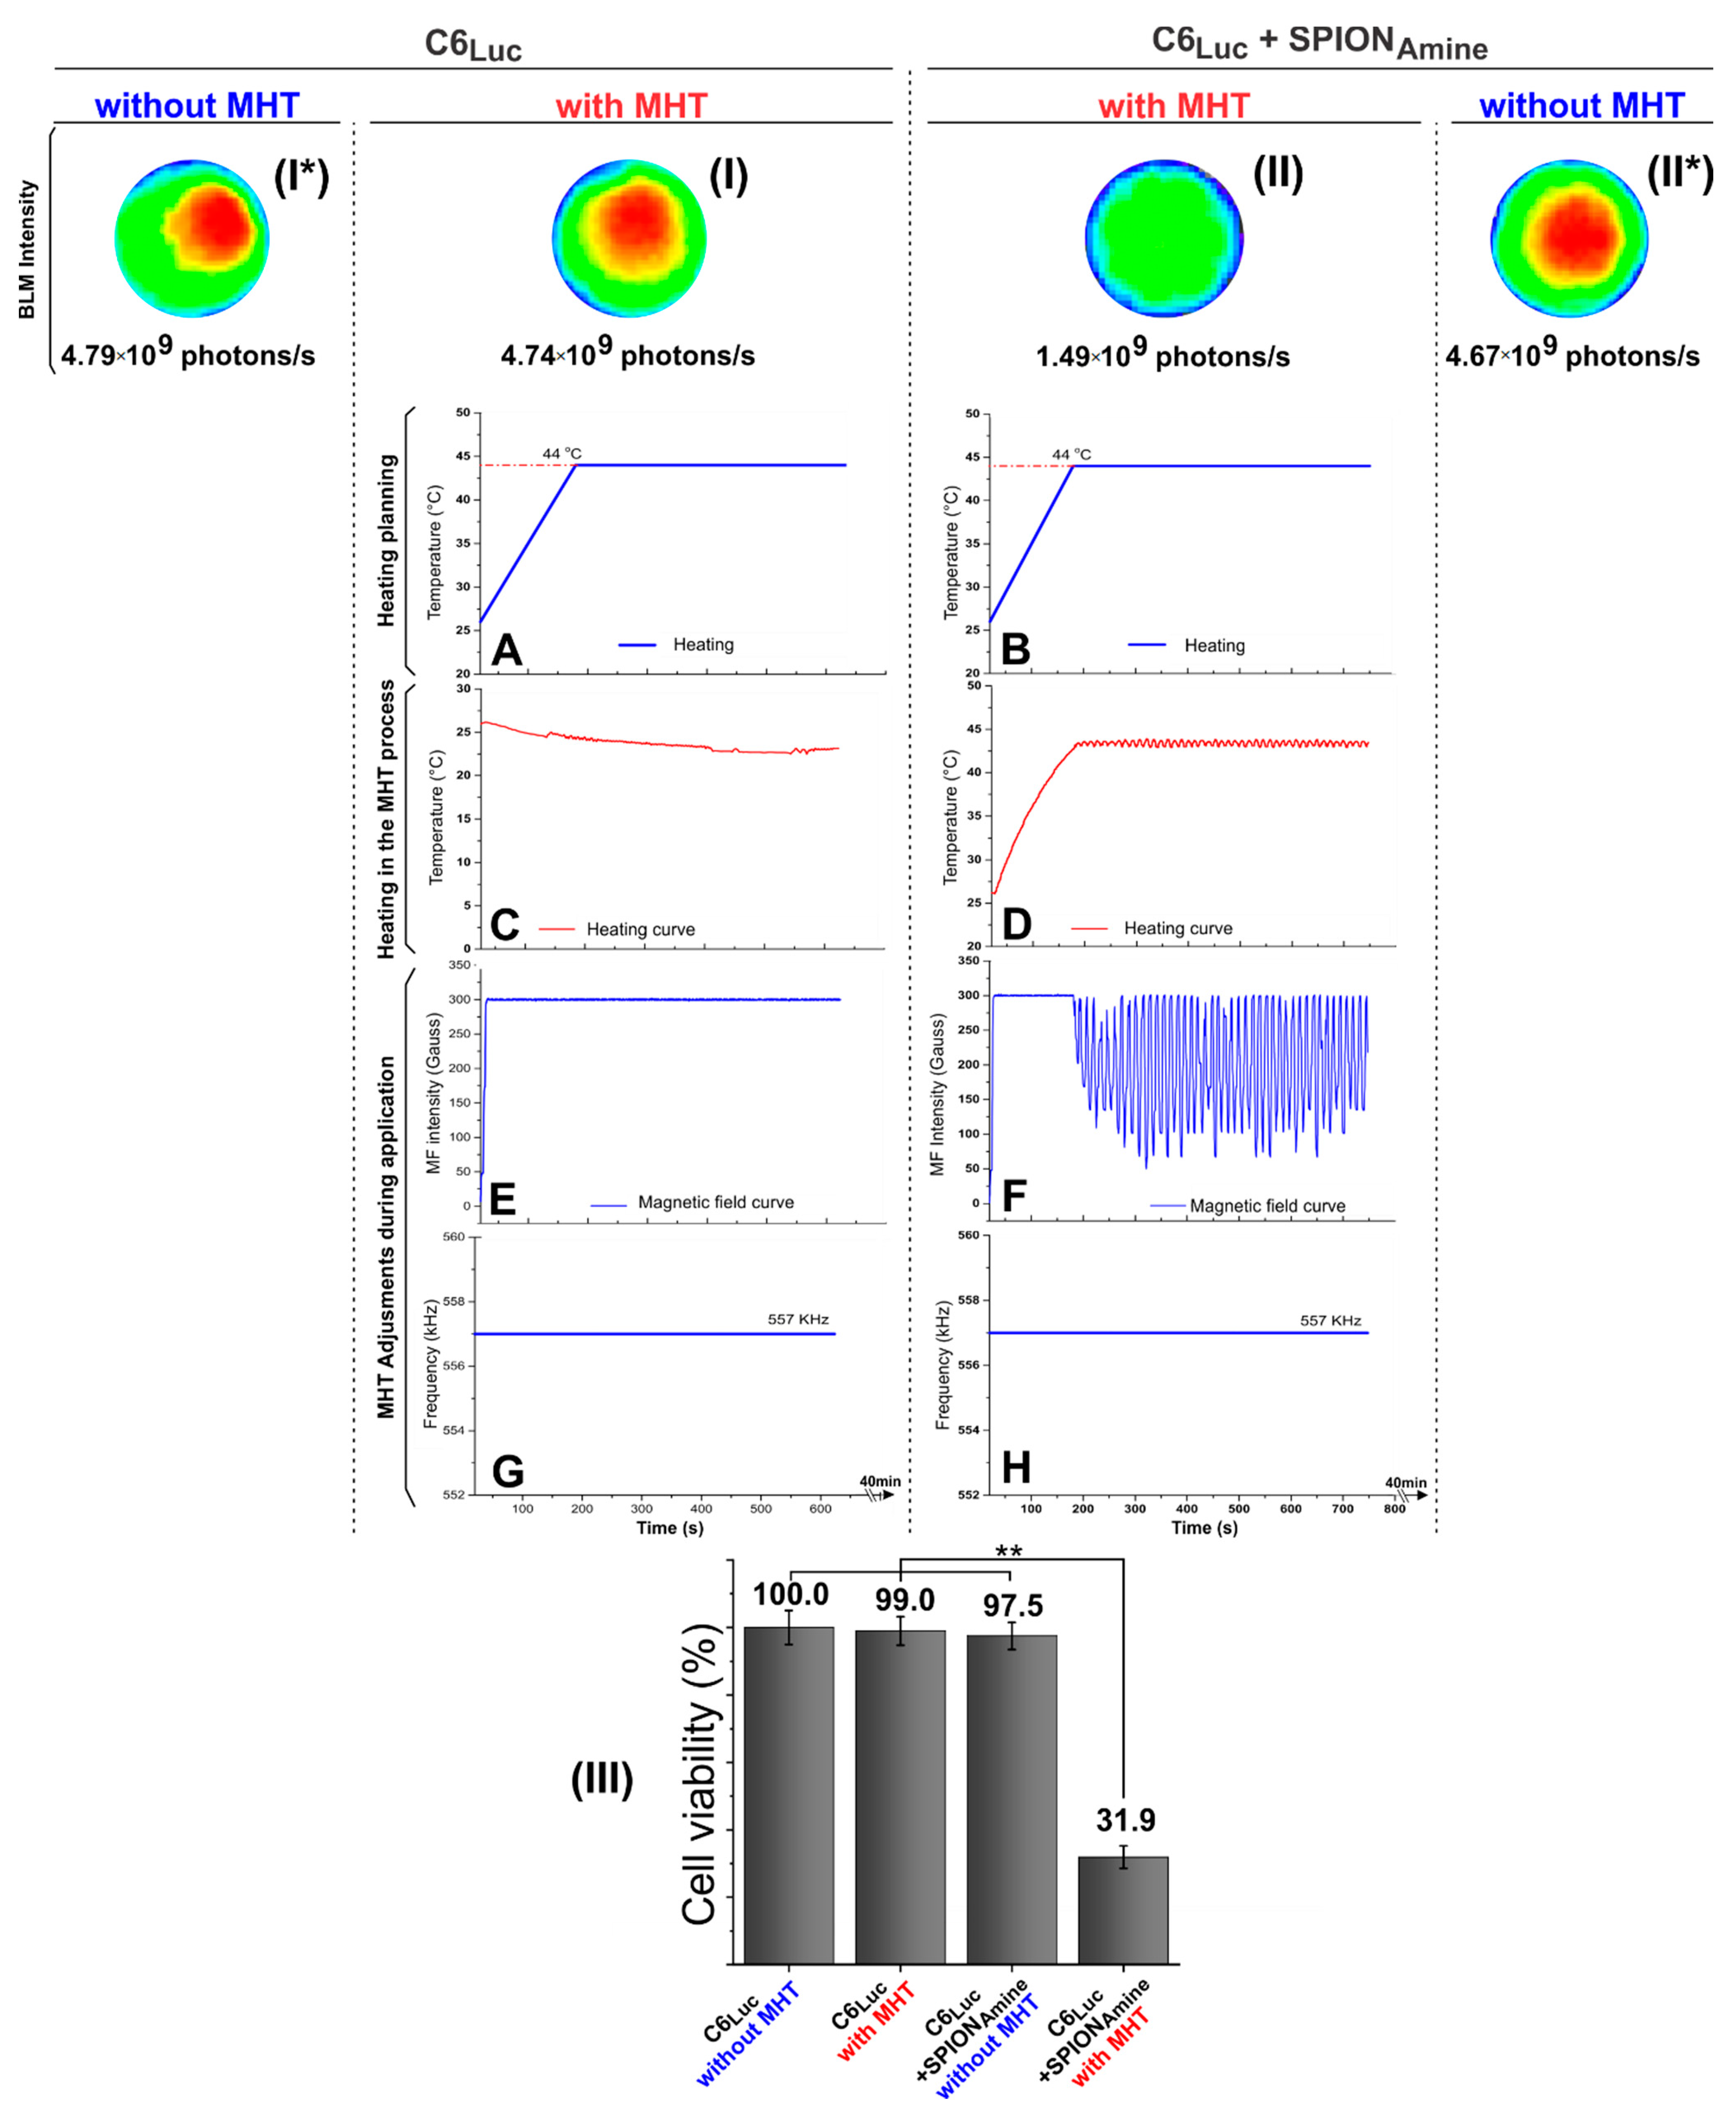
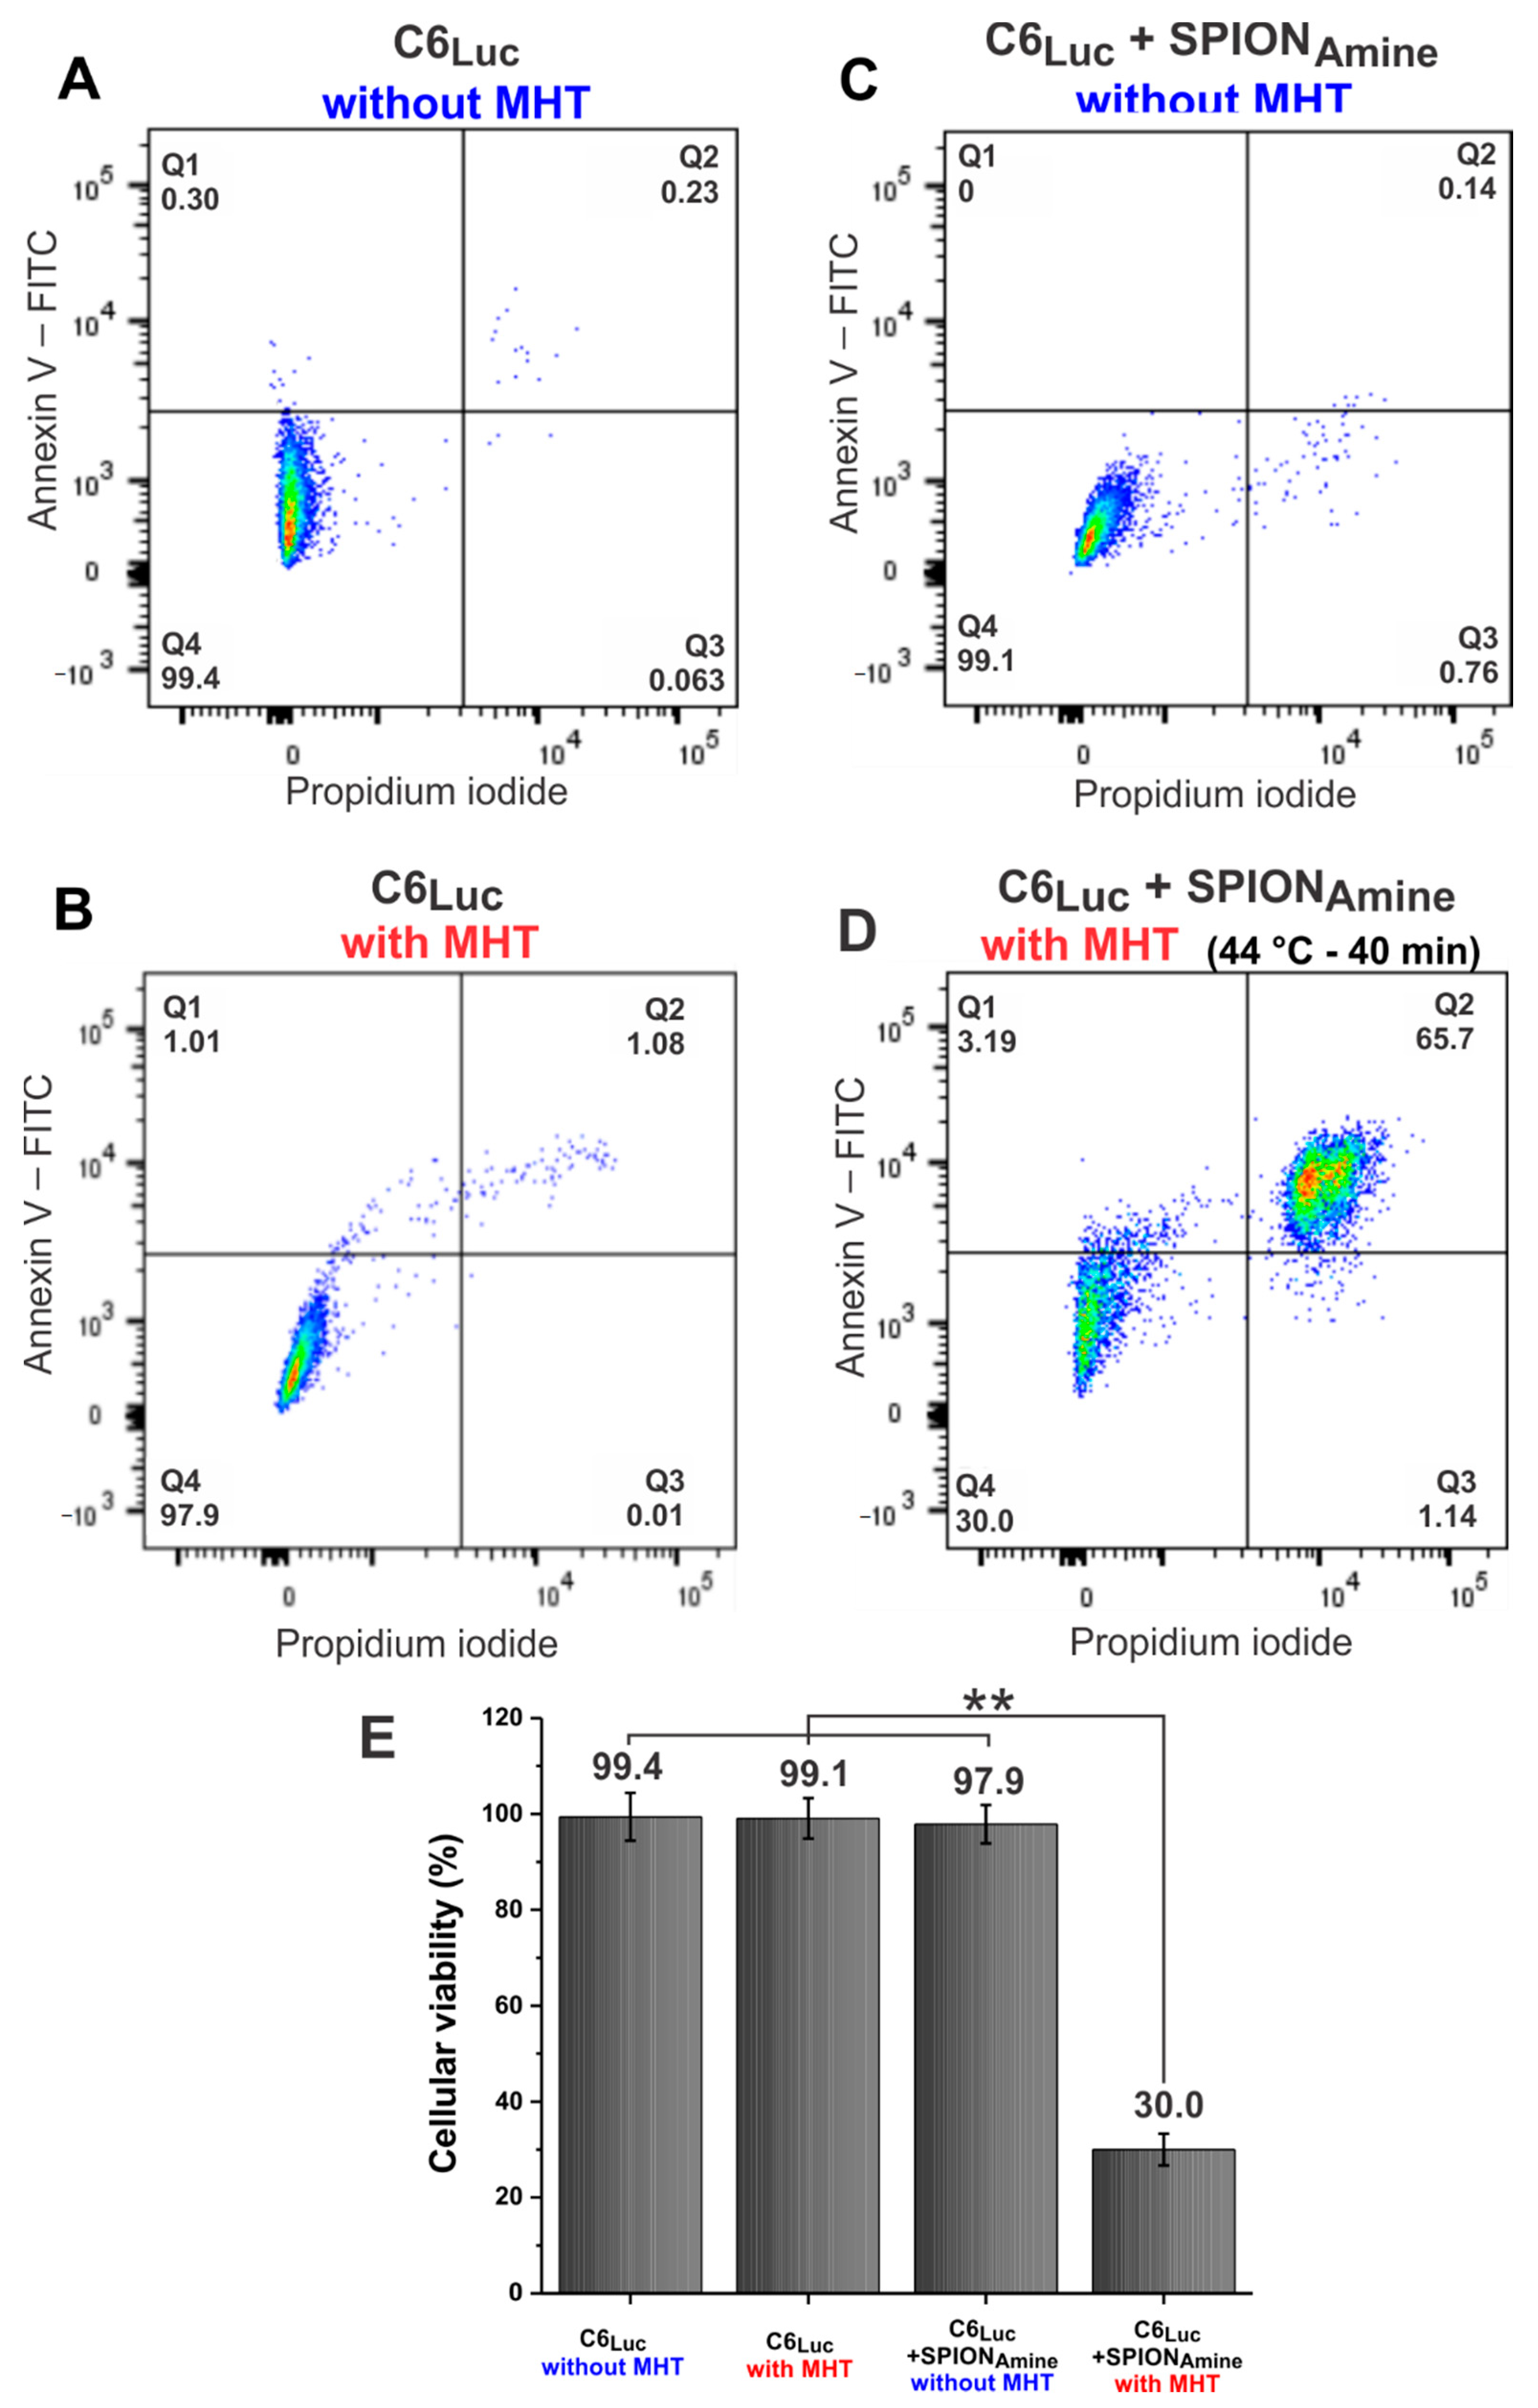
2.11. Application of Magneto Hyperthermia in C6Luc+SPIONAmine

After C6Luc labeling with SPIONAmine and the internalization and viability analysis, the best condition for MHT application was selected (Figure 1£). C6Luc cells labeled with SPIONAmine (106 cells) resuspended into RPMI (100 μL) were placed in the sample holder and MHT (300 Gauss; 557 kHz) was applied. The MHT application followed the heating planning to maintain a constant temperature of 44 °C for a period of 40 min (Figure 1E).
Sample analyses were performed in triplicate. Samples without MHT exposition were maintained as control samples. The evaluation methods were performed under the following conditions: (I *) C6Luc cells without SPIONAmine labeling and without exposure to MHT (C6Luc without MHT), (I) C6Luc cells without SPION and exposed to MHT (C6Luc with MHT); (II *) C6Luc labeled with SPIONAmine and not exposed to MHT (C6Luc + SPIONAmine without MHT) and (II) C6Luc labeled with SPIONAmine and exposed to MHT (C6Luc + SPIONAmine with MHT), as shown in Table 1.

2.12. MHT Efficiency Evaluation

The evaluation of the MHT efficiency for cell death induction to C6Luc cells was performed by BLI quantification, after a kinetic curve evaluation to find a peak for the maximum intensity signal and by flow cytometry assays using Annexin-V and propidium iodide (PI), both techniques were performed six days after the MHT therapy.
The BLI images of the C6Luc cells labeled with SPIONAmine submitted to the MHT process and respective controls (Section 2.11) were performed after addition of D-luciferin (100 μL) per well and acquired in an IVIS Lumina using the same parameters described above (Section 2.7) and respecting the time of the peak of the maximum intensity signal to initiate the images acquisition. The BLI signal was analyzed by the Living Image software in photons/s using the ROI of 2.5 cm2. The cell viability of conditions (I, II, and II *) shown in Table 1 was obtained by a relation between the C6Luc BLI intensity of each condition divided by the C6Luc BLI intensity of condition I * × 100.
The MHT technique efficiency evaluation for C6Luc cells death induction was also performed by flow cytometry. After MHT application, C6Luc cells labeled with SPIONAmine and the respective controls (106 cells) were centrifuged, washed in wash buffer, and then cells were labeled with the FITC Annexin-V and PI (Apoptosis Detection Kit I—BD Pharmingen) according to the protocol already established [30]. Briefly, cells were stained with 5 µL of Annexin-V-FITC and 5 µL of PI for 20 min in the dark at room temperature. Next, 400 µL of Annexin-V Binding Buffer was added in each tube and unstained cells and single stains (only Annexin or only PI) were used as FMO control. At least 10,000 events were acquired within 30 min after staining in the LSR-FORTESSA flow cytometer (BD Biosciences, San Jose, CA, USA). The analysis was performed using FlowJo software (BD Biosciences). The cell viability analysis follows the parameters described: viable cells did not stain for Annexin-V or PI (Annexin-V -/ PI -), cells in early stages of apoptosis stained only for Annexin-V (Annexin-V +/ PI -), cells at the latest stages of apoptosis or in necrosis stained for both Annexin-V and PI (Annexin-V +/ PI +). The analysis gates were plotted based on each tube unstained or single stained control.

2.13. Statistical Analysis

Data analysis of SAR, cellular viability process by MTT, and MHT technique efficiency by BLI and flow cytometry were presented as the mean and standard deviation. The MHT efficacy evaluation was compared by the ANOVA test, being considered statistical significance for p < 0.05. All statistical analysis was performed with the JASP software v.0.14.1 (http://www.jasp-stats.org; Accessed on 10 may 2019).

3. Results

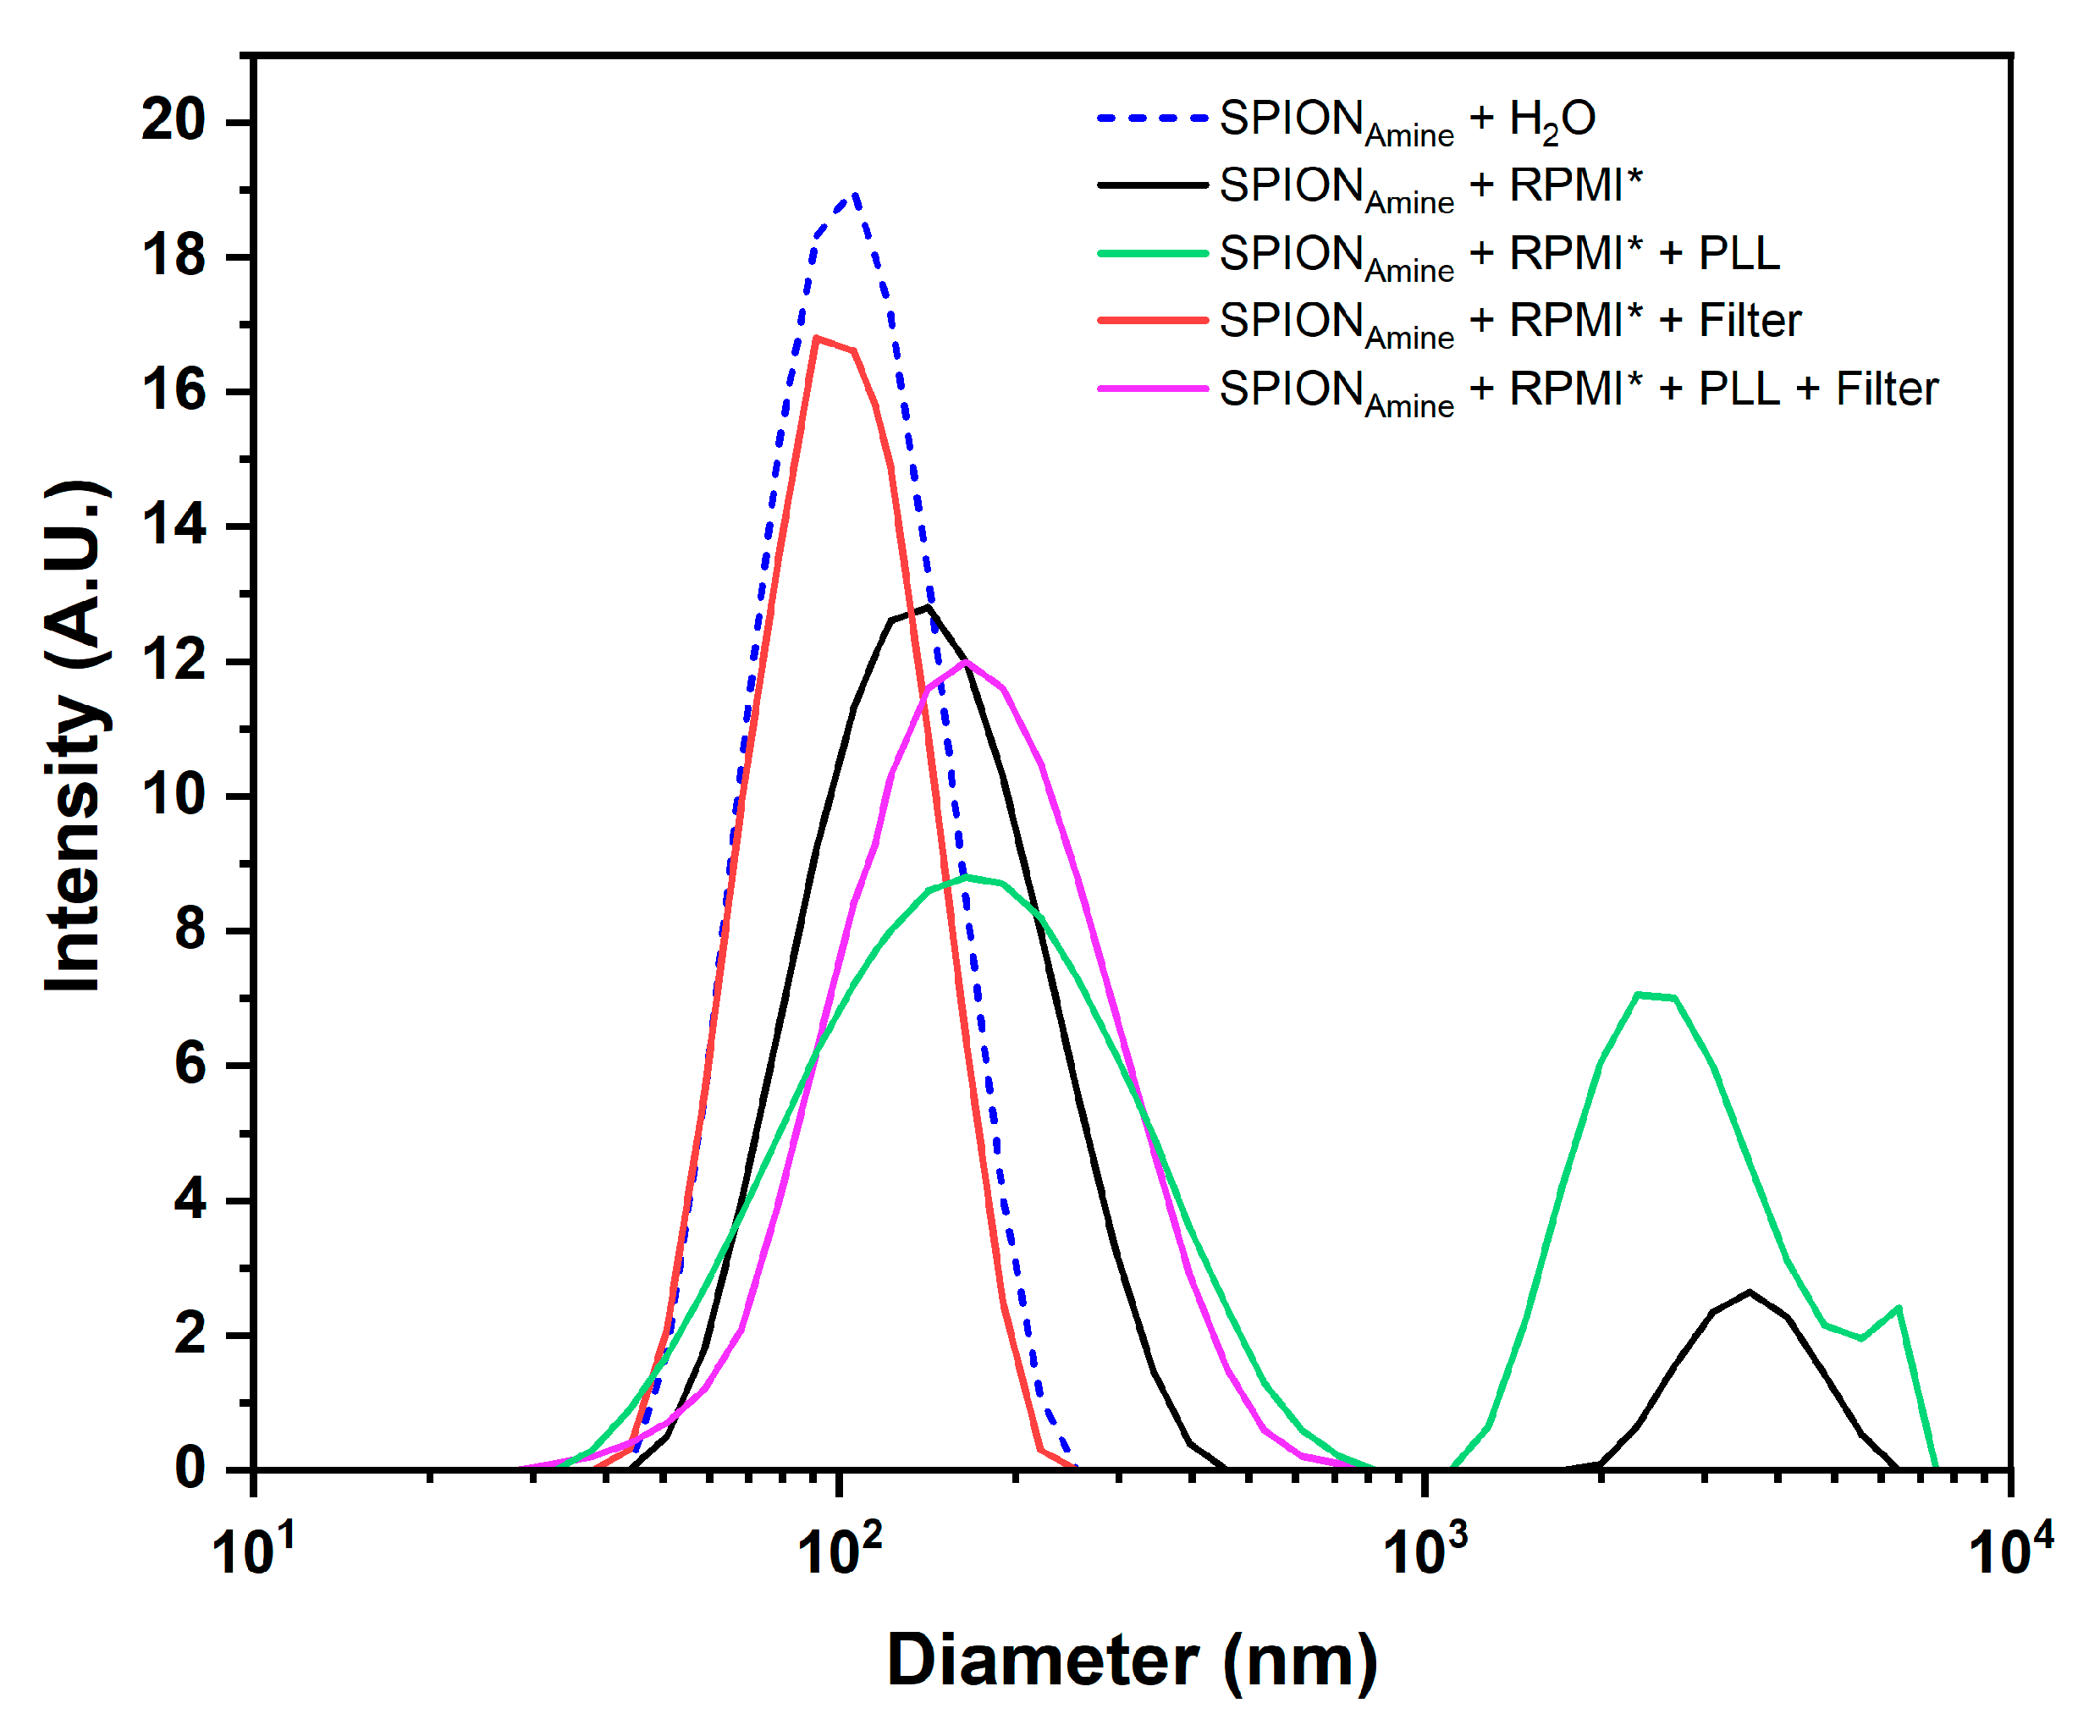
3.1. Evaluation of the Polydispersion, Heating Curves, and SAR Values of SPIONAmine

The distribution data of two SPIONAmine sizes characterization by DLS were fit to a log-normal distribution function, yielding the mean diameters of 53.8 ± 0.5 nm e 110.1 ± 0.4 nm, displayed in Figure 2A (blue and red curves). These values were compatible with manufacture data for SPIONAmine sizes (50 and 100 nm) used in the analysis.
The SPIONAmine (50 and 100 nm) displayed heating curves generated by MHT application combining the intensities and frequencies of magnetic fields parameters over time with fast increase of temperature at 150 and 300 Gauss compared to 50 Gauss, independently of the frequencies 305 and 557 kHz (Figure 2B,C). In Figure 2D, the SPIONAmine (50 and 100 nm) showed differences in heating curves regarding the best conditions of magnetic field and frequency.
The mean SAR values were higher—184.41 and 337.83 W/g for SPIONAmine 50 and 100 nm, respectively—when combining 300 Gauss of intensity with 557 kHz of frequency (Figure 2E,F, red bars). In addition, SAR value of SPIONAmine 100 nm was almost double compared to the one of inferior size for these parameters of MHT application, suggesting that the size of SPIONAmine has an important influence in heating efficiency. According to these results, 100 nm was defined as an ideal SPIONAmine size for the next phase, as represented in Figure 1.

3.2. Bioluminescent Kinetics of the C6Luc

The BLI signal intensity analysis displayed a maximum peak for BLI cell expression at 20 min, and after achieving the maximum peak of intensity a similar pattern of reduction over time was observed for all cells concentrations tested (Figure 3). The high concentration of cells showed the high amplitude of the signal which was detected only over the concentration of 5 × 10⁴ cells (Figure 3—green triangle curve). The picture inside Figure 3 indicates the cells, which the maximum peak of the BLI signal were inferior of 0.20 × 10⁹ photons/s, embracing the control samples (Figure 3—empty symbols lines) and the concentration of 1 × 10⁴ cells (Figure 3—red solid circle line).

3.3. C6Luc Labeled with SPIONAmine: Strategies of Internalization Analysis

After the selection of 100 nm SPIONAmine size according to the highest SAR value, C6Luc cells were labeled with SPIONAmine, and the prussian blue staining confirmed the SPIONAmine presence in the cell (Figure 4).
The first condition of the labeling process used three concentrations of Fe/mL (Figure 4—#,§,@) and did not use a PLL transfection agent nor filter (Figure 4A,F,K). This condition showed SPIONAmine agglomerates in the C6luc cells at 100 μgFe/mL concentration using static magnet field (Figure 4(#F)), as well as in the concentrations of 200 and 300 μgFe/mL using all types of fields, as shown in Figure 4(§A,F,K,@A,F,K), respectively.
The second condition results for all SPIONAmine concentrations (Figure 4#,§,@) without PLL and filter (Figure 4B,G,L) showed similar results independent of magnet field used (WM, SM, or DM) and also demonstrated a low loading index of iron in C6Luc labeling comparing to the fourth condition, using PLL during labeling process with filter.
In the third condition, using PLL without filter, the SPIONAmine agglomerates result was more evident, as depicted in Figure 4(#C,H,M,§C,H,M,@C,H,M)), and in fourth condition, the PLL with filter decreased the SPIONAmine agglomeration in almost all samples, as shown in Figure 4(#D,I,§D,I,N,@D,I,N). In addition, this condition showed that in static magnet field, an increase of SPIONAmine agglomeration occurred with its increased concentration, mainly for 200 and 300 μgFe/mL.
The best condition of labeling was observed in 100 μgFe/mL using PLL with filter and dynamic magnet field (Figure 4(#N)), as well as the higher amount of SPIONAmine internalized into C6Luc cells.
Therefore, through the optical microscopy image (Prussian blue staining), PLL complexed with SPIONAmine allowed better cell labeling compared to its absence, being the internalization increased in the presence of static magnetic field or dynamic magnetic field.

3.4. The Hydrodynamic Size Distribution and Zeta Potential of Different Colloidal Solutions Used in the Cellular Labeling

The polydispersion evaluation of SPIONAmine hydrodynamic size (nominal value 100 nm) resuspended in different colloidal solutions used in cellular labeling process for internalization strategies (Section 2.8) displayed SPIONAmine a hydrodynamic diameter ranging from 107 to 170 nm and a variation in zeta potential from +9.5 to +35 mV (Table 2 and Figure 5).
SPIONAmine resuspended in RPMI displayed increased hydrodynamic diameter mean (from 110.2 to 141.1 nm) and a second peak of the mean diameter of 3.60 µm (back curve of Figure 5), which may correspond to a formation of SPION clusters caused by the influence of electrolytes, proteins, and lipids contained in RPMI, as evidenced in the optical microscopy images in the first column of Figure 4.
When this colloidal suspension was filtered, the second peak was eliminated (red curve of Figure 5) and the average diameter (107.2 nm) almost reached the value of SPIONAmine resuspended in water (110.2 nm) with a slight change in the zeta potential to +14.2 mV (Table 2), evidenced by optical microscopy images with absence of agglomerations (second column of Figure 4). After the SPIONAmine complexation with PLL suspended in RPMI, the average diameter was 169.2 nm with a second peak in 2.5 µm (green curve of Figure 4), evidenced in the optical microscopy images of Figure 4 (third column) that showed higher formation of clusters compared to the labeling in the absence of PLL, and the zeta potential was +20.6 mV. In the last condition, when the filter was applied, the average diameter decreased to 156.6 nm (red curve of Figure 5) and the microscopy images of Figure 4 (fourth column) showed a marked decrease in clusters observed in the unfiltered condition (third column of Figure 4) and the highest zeta potential of +35.0 mV. Therefore, the SPIONAmine basal zeta potential measured without PLL was 10.0 ± 1.1 mV and after adding PLL and filter this value achieved 35.0 + 1.9 mV, increasing the efficiency of labeling using PLL during the process (Table 2).

3.5. Cellular Viability after Process of C6Luc Labeling with SPIONAmine

Cellular viability process by MTT (Figure 6) showed more than 94% of the viability of C6Luc labeled with 100 μgFe/mL of SPIONAmine in almost all conditions, except for conditions using PLL without filter with static (82%) or dynamic (87%) magnetic field Figure 6A.
C6Luc labeling process with 200 μgFe/mL, the viability was maintained over 98% without PLL (Figure 6B, light gray bars). However, for samples with PLL without filter, the viability was ~80% (Figure 6B, dark gray bars without vertical lines). Similar behavior occurred for 300 μgFe/mL concentration, which showed viability values over 93% for samples without PLL (Figure 6C, light gray bars), and ~75% for samples with PLL and without filter (Figure 6C, dark gray bars without vertical lines).
Accounting the SPIONAmine internalization results demonstrated in Figure 4 and cellular viability observed in Figure 6, the best condition of labeling was at 100 μgFe/mL using PLL, filter, and dynamic magnet field with 98% of viability (Figure 6A—dark gray bar with vertical lines of fill) with higher amount of SPIONAmine internalized (Figure 4(#N)).
In the three concentrations without PLL (Figure 6A–C, light gray color bars), viability values higher than 94% were observed, but low internalizations were shown by Prussian blue staining (Figure 4(#§@A,F,K) and Figure 4(B,G,L)) compared with images that used PLL (Figure 4(#§@C,H,M) and Figure 4(D,I,N)).

3.6. MHT Application and the Technique Efficiency Evaluation

MHT technique application was performed in C6Luc cells with SPIONAmine (100 μgFe/mL) in the best condition of labeling. The heating planning measured the temperature values during MHT application (Figure 7A,B), and in order to maintain the heating curves (Figure 7C,D), magnetic field intensities (Figure 7E,F) and frequency of oscillation were controlled (Figure 7G,H).
MHT technique efficiency evaluation was represented by the BLI images (Figure 7I,I*,II,II*) and cellular viability quantifications were demonstrated in Figure 7III. C6Luc submitted to MHT at an intensity of 300 Gauss and frequency of 557 kHz by 40 min (Figure 7I), did not produce an initial increase in temperature, maintaining the environmental temperature (Figure 7C). In addition, this condition did not display differences between BLI images and signals values for C6Luc with or without MHT 4.79 × 10⁹ photons/s (Figure 7I*), resulting in a decrease of only 1% in cellular viability (Figure 7III).
C6Luc labeled with SPIONAmine submitted to MHT (Figure 7II) with the same parameters describe above by 40 min (Figure 7B,D,F,H) showed a fast increase in temperature until achieving 44 °C and maintenance of therapeutic temperature, as shown in Figure 7D, resulting in the BLI signal of 1.46 × 10⁹ photons/s and a reduction of 65.6% in cellular viability compared to the control C6Luc labeled with SPIONAmine without MHT (Figure 7II*) which the BLI signal was 4.67 × 10⁹ photons/s and the cellular viability was 97.5%.
The cell viability graphic (Figure 7III) showed the viability quantification of C6Luc and C6Luc+SPIONAmine before and after MHT application using the BLI intensity signal. The groups C6Luc with or without MHT and C6Luc labeled with SPIONAmine without MHT showed high viability over time, and the last condition showed low reduction of viability caused by presence of SPION (low toxicity). In contrast, the group labeled with SPIONAmine with MHT led to a cellular viability of 31.9% resulting from the tumor cells death (high toxicity). The ANOVA test displayed a significant result for comparison between groups (p < 0.001), and this significant result (p < 0.001) remains for the comparison between C6Luc+SPIONAmine with MHT group (Figure 7II) and others (Figure 7I*,I,II*), as demonstrated in the graphic of Figure 7III.
Another cell viability analysis to evaluate the MTH efficacy was the flow cytometry (Figure 8). This figure displays several dot plots, one for each sample. The graph’s quandrants represent the cells conditions, as Q1 (cells stained for Annexin-V- initial apoptosis), Q2 (Cells stained for Annexin-V and PI-late apoptosis or necrosis), Q3 (cells stained only for PI-Necrosis), and Q4 (cells without staining—Viable cells). In accord with this analysis, it was observed that the control sample (C6Luc unlabeled) displayed viability of 99.4% (Figure 8A), MHT application in the cells labeled with SPIONAmine and without MHT application (Figure 8B,C) did not interfere in cell viability (99.1% and 97.9%, respectively). However, 69.2% reduction in cell viability was observed when the C6Luc labeled with SPIONAmine was submitted to 40 min of MHT at 44 °C, showing cell viability of 30.0% (Figure 8D), also demonstrated in the histogram (Figure 8E). The ANOVA test showed a significant result for group comparison (p < 0.001) and this significant result (p < 0.001) remains for the comparison between C6Luc+SPIONAmine with MHT group (Figure 8D) and others (Figure 8A–C), demonstrated in the graphic of Figure 8.

4. Discussion

The evaluation of nanomaterial heating efficiency on alternating magnetic field is important for therapeutic application in the tumor treatment by hyperthermia. However, this efficiency depends on the physical-chemical properties of nanoparticles, as size, distribution, magnetic characteristics biocompatibility, and aggregation of nanoparticles are related to the suspension medium and AMF parameters (oscillation frequency and intensity of magnetic field) [31,32]. Thus, the nanomaterial selected for MHT should be analyzed for these properties and parameters aiming application in vitro or in vivo [33,34,35]. The in vitro studies are important to understand the interactions of magnetic nanoparticles with tumor cells, regarding their toxicity, internalization and its influence in the efficacy on intracellular and extracellular magnet hyperthermia.
Regarding the nanomaterial, magnetite-based SPION (Fe3O4), as selected in the present study, is widely used in several biomedical applications due to its biocompatibility, high magnetic susceptibility, chemical stability, innocuousness, and high saturation magnetization [36]. The functionalization of SPION aims, in particular, to improve cell labeling, which has been demonstrated in studies in vitro with several types of cells, where SPION coated with aminosilane has increasing efficiency of nanoparticles internalization by cells without inducing cytotoxicity [37]. Yet, other strategies are applied to improve the internalization process of nanoparticles in cells.
In this study, we measured the hydrodynamic diameter of SPIONAmine, and the values found of 53.8 ± 11 nm and 110.1 ± 11 nm were closed to those provided by the manufacturer (50 and 100 nm, respectively) and corroborated other studies that used the same nanoparticles [33,34,35]. On the other hand, the maximum SAR values of SPIONAmine (50 nm) and SPIONAmine (100 nm) were 184.41 W/g and 337.83 W/g, respectively. Values that are directly proportional to the diameter of the SPION for the range of dimensions involved in this study [38]. Yuan et al., 2011 [35] characterized SPIONAmine (100 nm) in AMF with 250 kHz of frequency and 9.12 kA/m of intensity obtaining a SAR of 14,957 W/g. Our calculated SAR value was 337.83 W/g for a frequency of 557 kHz and magnetic field of 300 Gauss (≈23.93 kA/m). A comparison of SAR values is not possible due to the differences in intensity and frequency of magnetic field. However, a comparison can be performed using the intrinsic loss power (ILP) defined by the relation ILP = SAR/(f × H2) that takes into account the nanoparticles properties, excluding the influence of the intensity and AMF frequency. Therefore, the ILP of our study was 0.6812 × 10⁻⁸ Wg−1Oe−2Hz−1 and the value reported of the study by Yuan was 0.4574 × 10⁻⁸ Wg−1Oe−2Hz−1 [35], representing a small difference in values that can be attributed to the heterogeneity of the coil’s magnetic field. Consequently, our ILP value is according to the values reported in the literature [35]. A SAR value was not found in the literature for 50 nm SPIONAmine. Thus, based on our own results, and considering that this SAR value should be lower than 100 nm SPIONAmine, we chose to use the SAR value of 100 nm SPIONAmine.
As in MHT there are two heat sources depending on nanoparticle location (surrounding tissue or cells and intracellular) [39,40,41], it is important to associate both sources to optimize MHT therapy. In this sense, the present study aims to improve the nanoparticles internalization process in C6 cells using different strategies such as static and dynamic magnetic fields, as well as transfection agent such as PLL, assisted by filtering process of SPIONAmine, and it was possible to observe that SPIONAmine (100 nm) were internalized in C6 cells more efficiently using magnetic field (magnetofection), associated with the transfection agent PLL. Other studies [42,43,44,45,46,47,48] also reported the use of magnetic field aiming at a better internalization of magnetic nanoparticles. Adams et al. [42] studied the internalization of magnetic nanoparticles into cell neurospheres using the static and dynamic magnetic fields and reported increased labeling efficiency over twice when the dynamic magnetic field was used instead static magnetic field, and this enhanced internalization process not influenced cell viability. The process of internalization of SPIONAmine (100 nm) by C6 using magnetic fields in our study followed the same principle described by Adams et al. study [42], where the dynamic magnetic field helped the cell labeling process by increasing the nanoparticles contact with cells. The nanomaterial absorption by C6 cells occurs through various forms of cell endocytosis, and in dynamic magnetic field, the vertical magnetic component induces the nanoparticles sedimentation, and the horizontal magnetic component stimulates their endocytosis by cell membrane [42]. Thus, better internalization of SPIONAmine (100 nm) by C6 was obtained when the dynamic magnetic field was used, which is based on biological and physical principles described in the literature [49,50].
The transfection agent PLL increased the SPIONAmine (100 nm) internalization by cells as shown in Figure 4. This strategy was also evidenced in other studies [51,52,53,54,55,56,57,58,59]. The use of transfection agent as PLL, that is a linear polymer of lysine that bears a positive charge at neutral pH, benefits the electrostatic interaction between nanoparticles and cells [60], as PLL increases the SPIONAmine positive charge (increasing the zeta potential) leading to enhanced attraction with C6 cell membrane which is negatively charged. Cells surface negative charge is of great importance in SPION internalization, due to the presence of glycoproteins, glycolipids, and phospholipids in their plasma membrane [61], in particular, the presence of heparan sulfate proteoglycans that are facilitators of endocytosis, providing a higher negative charge in the cell plasma membrane [60]. Thus, zeta potential was measured according to SPION colloidal solution suspension and there was a correlation with important alterations in this potential (from +9.5 to +35.0 mV), and in this way the increasing in positive charge was favorable for internalization process improvement. In this sense, PLL presence enhanced nanoparticles internalization by C6 cells. This type of internalization strategy had already been used in other studies, but in other types of cells, PLL associated with SPION increased its uptake by mesenchymal stem cells [62]; it also increased internalization efficiency in neuronal stem cells [56], umbilical cord mesenchymal stem cells [57], lung cancer cells [58], glioma cancer cells (C6) [54], cancer cells of human prostate (PC3) [53], among others.
In the previously discussed internalization strategies, there is the possibility of the SPIONs clusters formation, due to interactions between nanoparticles covering layer and forces between the nanoparticles such as electrostatic forces, Van der Waals forces, steric forces, and magnetic forces modulated via the Brownian motion of particles [63]. In addition, there are influences of electrolytes, proteins, and lipids contained in biological fluids during the labeling process. This in vitro study demonstrated that these nanoparticle clusters decreased SPION uptake by cells, influencing their cytotoxicity [63,64,65], as evidenced in our results (Figure 6). For in vivo studies, it is necessary to evaluate the SPION stability in several fluids mimicking biological ones and in organ homogenates ensuring the SPION is stable for in vivo best results avoiding unexpected interferences.
After evaluating the best condition of SPION internalization, toxicity, and taking into account the best SAR value, the C6 cells were submitted to MTH process to verify the efficiency of the therapy, influenced by magnetic heating mechanisms (Néel relaxation and Brown relaxation) [66,67,68]. The MHT process can be performed using an alternating magnetic field at high frequency, low frequency, or ultra-low frequency. This study used high frequency, which mainly contributes to intracellular MHT, due to the properties of Neel relaxation, and in the extracellular MHT, both heating mechanisms are involved (Neel and Brown relaxation) [16,41,69,70,71,72]. The results demonstrated decreased cell viability of 70.0% by flow cytometry and 68.1% by BLI which correspond to intracellular and extracellular magneto hyperthermia contribution to cell cytotoxicity. In a previous study performed by this group [73], a reduction of 52% of cell viability was observed in the MHT efficiency evaluation, without the use of any internalization strategy, condition represented in the Figure 4(#A), which can be attributed to MHT extracellular activity due to low efficiency in internalization. Thus, the difference (~16%) in efficacy reduction could be attributed to the contribution of the intracellular MHT process using internalization strategies. This intracellular MHT aspect has been approached in other studies with favorable results. Chen et al. [41] have used the magnetic nanoparticles coated with polystyrene-sulfonic acid internalized into SK-Hep1 hepatocellular carcinoma cells, leading to significant decrease in cell viability. Similarly, it was evaluated in the studies by Lacovite et al. [40] and Shinkai et al. [74] through intracellular MHT in A549 and T-9 cancer cells, respectively, showing the importance of this type of MHT in the therapeutic process. Although these studies have used other types of tumor cells for the application of MHT, we chose to use the C6 cell lineage due to their histopathological and radiobiological similarities with human gliomas, such as nuclear polymorphism, mitosis high rates, tumor necrosis foci, intratumor hemorrhage, invasion of the parenchyma, and neoangiogenesis [75,76], characteristics of aggressive tumors which enable preclinical studies with novel therapeutic approaches as MHT to treat tumors that are considered lethal.
Therefore, the magnetic nanoparticles internalization into tumor cells submitted to MHT generate localized heat, probably influencing these cells’ physiological and biochemical properties, leading to functional and structural alterations driving cell lysis, as the nanoparticles captured by these cells do not undergo Brownian movement which results in decreased heating as reported in previous studies [77,78]. However, in assays with extracellular nanoparticles, the viability is significantly reduced after thermal treatment (MHT), representing the primary acute effect [79].
We can conclude that our study is favorable for antitumor treatment based on intra- and extracellular MHT effects, where the optimization of the internalization process is associated with magnetic nanoparticles characteristics potentialized by the intracellular late effect of MHT added to its extracellular acute effect. Thus, we have achieved high efficiency in the optimization of this therapeutic process.

Author Contributions

Conceptualization, J.B.M., T.K.F.S. and L.F.G.; methodology, J.B.M., T.K.F.S., M.P.N. and L.F.G.; validation, J.B.M., T.K.F.S., M.P.N., L.M. and L.F.G.; formal analysis, J.B.M., T.K.F.S., M.P.N., F.A.O., L.M. and L.F.G.; investigation, J.B.M., T.K.F.S., M.P.N., F.A.O., A.H.A., G.N.A.R., L.M. and L.F.G.; resources, L.F.G.; data curation, L.F.G.; writing—original draft preparation, J.B.M., T.K.F.S., M.P.N., F.A.O., L.P.N., A.H.A., G.N.A.R., L.M. and L.F.G.; writing—review and editing, J.B.M., T.K.F.S., M.P.N., F.A.O., L.P.N., L.M. and L.F.G.; visualization, M.P.N. and L.F.G.; supervision, L.F.G.; project administration, L.F.G.; funding acquisition, L.F.G. All authors have read and agreed to the published version of the manuscript.

Funding

This research was funded by “FAPESP 2014/14836-6, CNPq 308901/2020-7 and SisNANO 2.0/ MCTIC (442539/2019-3).

Institutional Review Board Statement

All experiments were carried out in accordance with the laws of Brazil and approved by the Ethics Research Committee of the Hospital Israelita Albert Einstein.

Informed Consent Statement

Not applicable.

Conflicts of Interest

The authors declare no conflict of interest.

References

  1. Stupp, R.; Brada, M.; van den Bent, M.J.; Tonn, J.C.; Pentheroudakis, G. High-grade glioma: ESMO Clinical Practice Guidelines for diagnosis, treatment and follow-up. Ann. Oncol. 2014, 25 (Suppl. S3), 93–101. [Google Scholar] [CrossRef]
  2. Verma, J.; Lal, S.; Van Noorden, C.J. Nanoparticles for hyperthermic therapy: Synthesis strategies and applications in glioblastoma. Int. J. Nanomed. 2014, 9, 2863–2877. [Google Scholar] [CrossRef] [Green Version]
  3. Hilger, I. In vivo applications of magnetic nanoparticle hyperthermia. Int. J. Hyperth. 2013, 29, 828–834. [Google Scholar] [CrossRef] [PubMed]
  4. Lapointe, S.; Perry, A.; Butowski, N.A. Primary brain tumours in adults. Lancet 2018, 392, 432–446. [Google Scholar] [CrossRef]
  5. Ostrom, Q.T.; Patil, N.; Cioffi, G.; Waite, K.; Kruchko, C.; Barnholtz-Sloan, J.S. CBTRUS Statistical Report: Primary Brain and Other Central Nervous System Tumors Diagnosed in the United States in 2013–2017. Neuro-Oncol. 2020, 22, iv1–iv96. [Google Scholar] [CrossRef] [PubMed]
  6. Gupta, R.; Sharma, D. Evolution of Magnetic Hyperthermia for Glioblastoma Multiforme Therapy. ACS Chem. Neurosci. 2019, 10, 1157–1172. [Google Scholar] [CrossRef] [PubMed]
  7. Batash, R.; Asna, N.; Schaffer, P.; Francis, N.; Schaffer, M. Glioblastoma Multiforme, Diagnosis and Treatment; Recent Literature Review. Curr. Med. Chem. 2017, 24, 3002–3009. [Google Scholar] [CrossRef]
  8. Mukherjee, S.; Liang, L.; Veiseh, O. Recent Advancements of Magnetic Nanomaterials in Cancer Therapy. Pharmaceutics 2020, 12, 147. [Google Scholar] [CrossRef] [PubMed] [Green Version]
  9. Cherukuri, P.; Glazer, E.S.; Curley, S.A. Targeted hyperthermia using metal nanoparticles. Adv. Drug Deliv. Rev. 2010, 62, 339–345. [Google Scholar] [CrossRef] [Green Version]
  10. Hayashi, K.; Nakamura, M.; Miki, H.; Ozaki, S.; Abe, M.; Matsumoto, T.; Sakamoto, W.; Yogo, T.; Ishimura, K. Magnetically responsive smart nanoparticles for cancer treatment with a combination of magnetic hyperthermia and remote-control drug release. Theranostics 2014, 4, 834–844. [Google Scholar] [CrossRef] [PubMed]
  11. Kuboyabu, T.; Yabata, I.; Aoki, M.; Banura, N.; Nishimoto, K.; Mimura, A.; Murase, K.J.O.J.o.M.I. Magnetic Particle Imaging for Magnetic Hyperthermia Treatment: Visualization and Quantification of the Intratumoral Distribution and Temporal Change of Magnetic Nanoparticles in Vivo. Open J. Med. Imaging 2016, 6, 64658. [Google Scholar] [CrossRef] [Green Version]
  12. Johannsen, M.; Thiesen, B.; Wust, P.; Jordan, A. Magnetic nanoparticle hyperthermia for prostate cancer. Int. J. Hyperth. 2010, 26, 790–795. [Google Scholar] [CrossRef]
  13. Maier-Hauff, K.; Rothe, R.; Scholz, R.; Gneveckow, U.; Wust, P.; Thiesen, B.; Feussner, A.; von Deimling, A.; Waldoefner, N.; Felix, R.; et al. Intracranial thermotherapy using magnetic nanoparticles combined with external beam radiotherapy: Results of a feasibility study on patients with glioblastoma multiforme. J. Neuro-Oncol. 2007, 81, 53–60. [Google Scholar] [CrossRef] [PubMed]
  14. Wankhede, M.; Bouras, A.; Kaluzova, M.; Hadjipanayis, C.G. Magnetic nanoparticles: An emerging technology for malignant brain tumor imaging and therapy. Expert Rev. Clin. Pharmacol. 2012, 5, 173–186. [Google Scholar] [CrossRef]
  15. Kobayashi, T. Cancer hyperthermia using magnetic nanoparticles. Biotechnol. J. 2011, 6, 1342–1347. [Google Scholar] [CrossRef] [PubMed]
  16. Silva, A.C.; Oliveira, T.R.; Mamani, J.B.; Malheiros, S.M.F.; Malavolta, L.; Pavon, L.F.; Sibov, T.T.; Amaro, E., Jr.; Tannús, A.; Vidoto, E.L.G.; et al. Application of hyperthermia induced by superparamagnetic iron oxide nanoparticles in glioma treatment. Int. J. Nanomed. 2011, 6, 591–603. [Google Scholar] [CrossRef] [Green Version]
  17. Roti Roti, J.L. Cellular responses to hyperthermia (40–46 degrees C): Cell killing and molecular events. Int. J. Hyperth. 2008, 24, 3–15. [Google Scholar] [CrossRef]
  18. Sato, I.; Umemura, M.; Mitsudo, K.; Kioi, M.; Nakashima, H.; Iwai, T.; Feng, X.; Oda, K.; Miyajima, A.; Makino, A.; et al. Hyperthermia generated with ferucarbotran (Resovist®) in an alternating magnetic field enhances cisplatin-induced apoptosis of cultured human oral cancer cells. J. Physiol. Sci. JPS 2014, 64, 177–183. [Google Scholar] [CrossRef]
  19. Jeun, M.; Kim, Y.J.; Park, K.H.; Paek, S.H.; Bae, S. Physical contribution of Néel and Brown relaxation to interpreting intracellular hyperthermia characteristics using superparamagnetic nanofluids. J. Nanosci. Nanotechnol. 2013, 13, 5719–5725. [Google Scholar] [CrossRef]
  20. Torres, T.E.; Lima, E.; Calatayud, M.P.; Sanz, B.; Ibarra, A.; Fernández-Pacheco, R.; Mayoral, A.; Marquina, C.; Ibarra, M.R.; Goya, G.F. The relevance of Brownian relaxation as power absorption mechanism in Magnetic Hyperthermia. Sci. Rep. 2019, 9, 3992. [Google Scholar] [CrossRef] [Green Version]
  21. Pourgholi, F.; Hajivalili, M.; Farhad, J.N.; Kafil, H.S.; Yousefi, M. Nanoparticles: Novel vehicles in treatment of Glioblastoma. Biomed. Pharmacother. Biomed. Pharmacother. 2016, 77, 98–107. [Google Scholar] [CrossRef] [PubMed]
  22. Usov, N.A.; Nesmeyanov, M.S.; Tarasov, V.P. Magnetic Vortices as Efficient Nano Heaters in Magnetic Nanoparticle Hyperthermia. Sci. Rep. 2018, 8, 1224. [Google Scholar] [CrossRef] [PubMed]
  23. Vilas-Boas, V.; Carvalho, F.; Espiña, B. Magnetic Hyperthermia for Cancer Treatment: Main Parameters Affecting the Outcome of In Vitro and In Vivo Studies. Molecules 2020, 25, 2874. [Google Scholar] [CrossRef] [PubMed]
  24. Da Silva, H.R.; Mamani, J.B.; Nucci, M.P.; Nucci, L.P.; Kondo, A.T.; Fantacini, D.M.C.; de Souza, L.E.B.; Picanço-Castro, V.; Covas, D.T.; Kutner, J.M.; et al. Triple-modal imaging of stem-cells labeled with multimodal nanoparticles, applied in a stroke model. World J. Stem Cells 2019, 11, 100–123. [Google Scholar] [CrossRef] [PubMed]
  25. Kuroda, H.; Kutner, R.H.; Bazan, N.G.; Reiser, J. Simplified lentivirus vector production in protein-free media using polyethylenimine-mediated transfection. J. Virol. Methods 2009, 157, 113–121. [Google Scholar] [CrossRef]
  26. Fantacini, D.M.C.; Picanço-Castro, V. Production of Recombinant Factor VIII in Human Cell Lines. Methods Mol. Biol. 2018, 1674, 63–74. [Google Scholar] [CrossRef]
  27. Oliveira, F.A.; Nucci, M.P.; Mamani, J.B.; Alves, A.H.; Rego, G.N.A.; Kondo, A.T.; Hamerschlak, N.; Junqueira, M.S.; de Souza, L.E.B.; Gamarra, L.F. Multimodal Tracking of Hematopoietic Stem Cells from Young and Old Mice Labeled with Magnetic–Fluorescent Nanoparticles and Their Grafting by Bioluminescence in a Bone Marrow Transplant Model. Biomedicines 2021, 9, 752. [Google Scholar] [CrossRef]
  28. Rego, G.N.A.; Nucci, M.P.; Mamani, J.B.; Oliveira, F.A.; Marti, L.C.; Filgueiras, I.S.; Ferreira, J.M.; Real, C.C.; Faria, D.P.; Espinha, P.L.; et al. Therapeutic Efficiency of Multiple Applications of Magnetic Hyperthermia Technique in Glioblastoma Using Aminosilane Coated Iron Oxide Nanoparticles: In Vitro and In Vivo Study. Int. J. Mol. Sci. 2020, 21, 958. [Google Scholar] [CrossRef] [Green Version]
  29. Sibov, T.T.; Pavon, L.F.; Miyaki, L.A.; Mamani, J.B.; Nucci, L.P.; Alvarim, L.T.; Silveira, P.H.; Marti, L.C.; Gamarra, L. Umbilical cord mesenchymal stem cells labeled with multimodal iron oxide nanoparticles with fluorescent and magnetic properties: Application for in vivo cell tracking. Int. J. Nanomed. 2014, 9, 337–350. [Google Scholar] [CrossRef] [Green Version]
  30. Alvieri, F.; Mamani, J.B.; Nucci, M.P.; Oliveira, F.A.; Filgueiras, I.S.; Rego, G.N.A.; de Barboza, M.F.; da Silva, H.R.; Gamarra, L.F. Methods of Granulocyte Isolation from Human Blood and Labeling with Multimodal Superparamagnetic Iron Oxide Nanoparticles. Molecules 2020, 25, 765. [Google Scholar] [CrossRef] [Green Version]
  31. Morales, I.; Costo, R.; Mille, N.; Silva, G.B.D.; Carrey, J.; Hernando, A.; Presa, P. High Frequency Hysteresis Losses on γ-Fe₂O₃ and Fe₃O₄: Susceptibility as a Magnetic Stamp for Chain Formation. Nanomaterials 2018, 8, 970. [Google Scholar] [CrossRef] [Green Version]
  32. Golovin, Y.I.; Klyachko, N.L.; Majouga, A.G.; Sokolsky, M.; Kabanov, A.V. Theranostic multimodal potential of magnetic nanoparticles actuated by non-heating low frequency magnetic field in the new-generation nanomedicine. J. Nanopart. Res. 2017, 19, 63. [Google Scholar] [CrossRef]
  33. Rivet, C.J.; Yuan, Y.; Borca-Tasciuc, D.A.; Gilbert, R.J. Altering iron oxide nanoparticle surface properties induce cortical neuron cytotoxicity. Chem. Res. Toxicol. 2012, 25, 153–161. [Google Scholar] [CrossRef] [PubMed] [Green Version]
  34. Yuan, Y.; Rende, D.; Altan, C.L.; Bucak, S.; Ozisik, R.; Borca-Tasciuc, D.A. Effect of surface modification on magnetization of iron oxide nanoparticle colloids. Langmuir ACS J. Surf. Colloids 2012, 28, 13051–13059. [Google Scholar] [CrossRef] [PubMed]
  35. Yuan, Y.; Tasciuc, D.-A.B. Comparison between experimental and predicted specific absorption rate of functionalized iron oxide nanoparticle suspensions. J. Magn. Magn. Mater. 2011, 323, 2463–2469. [Google Scholar] [CrossRef]
  36. Ganapathe, L.S.; Mohamed, M.A.; Mohamad Yunus, R.; Berhanuddin, D.D. Magnetite (Fe3O4) Nanoparticles in Biomedical Application: From Synthesis to Surface Functionalisation. Magnetochemistry 2020, 6, 68. [Google Scholar] [CrossRef]
  37. Zhu, X.M.; Wang, Y.X.; Leung, K.C.; Lee, S.F.; Zhao, F.; Wang, D.W.; Lai, J.M.; Wan, C.; Cheng, C.H.; Ahuja, A.T. Enhanced cellular uptake of aminosilane-coated superparamagnetic iron oxide nanoparticles in mammalian cell lines. Int. J. Nanomed. 2012, 7, 953–964. [Google Scholar] [CrossRef] [Green Version]
  38. Mohapatra, J.; Zeng, F.; Elkins, K.; Xing, M.; Ghimire, M.; Yoon, S.; Mishra, S.R.; Liu, J.P. Size-dependent magnetic and inductive heating properties of Fe3O4 nanoparticles: Scaling laws across the superparamagnetic size. Phys. Chem. Chem. Phys. 2018, 20, 12879–12887. [Google Scholar] [CrossRef]
  39. Dias, C.S.B.; Hanchuk, T.D.M.; Wender, H.; Shigeyosi, W.T.; Kobarg, J.; Rossi, A.L.; Tanaka, M.N.; Cardoso, M.B.; Garcia, F. Shape Tailored Magnetic Nanorings for Intracellular Hyperthermia Cancer Therapy. Sci. Rep. 2017, 7, 14843. [Google Scholar] [CrossRef] [Green Version]
  40. Iacovita, C.; Fizeșan, I.; Pop, A.; Scorus, L.; Dudric, R.; Stiufiuc, G.; Vedeanu, N.; Tetean, R.; Loghin, F.; Stiufiuc, R.; et al. In Vitro Intracellular Hyperthermia of Iron Oxide Magnetic Nanoparticles, Synthesized at High Temperature by a Polyol Process. Pharmaceutics 2020, 12, 424. [Google Scholar] [CrossRef]
  41. Chen, B.W.; Chiu, G.W.; He, Y.C.; Huang, C.Y.; Huang, H.T.; Sung, S.Y.; Hsieh, C.L.; Chang, W.C.; Hsu, M.S.; Wei, Z.H.; et al. Extracellular and intracellular intermittent magnetic-fluid hyperthermia treatment of SK-Hep1 hepatocellular carcinoma cells based on magnetic nanoparticles coated with polystyrene sulfonic acid. PLoS ONE 2021, 16, e0245286. [Google Scholar] [CrossRef]
  42. Adams, C.F.; Pickard, M.R.; Chari, D.M. Magnetic nanoparticle mediated transfection of neural stem cell suspension cultures is enhanced by applied oscillating magnetic fields. Nanomed. Nanotechnol. Biol. Med. 2013, 9, 737–741. [Google Scholar] [CrossRef]
  43. Cores, J.; Caranasos, T.G.; Cheng, K. Magnetically Targeted Stem Cell Delivery for Regenerative Medicine. J. Funct. Biomater. 2015, 6, 526–546. [Google Scholar] [CrossRef] [Green Version]
  44. Harrison, R.; Markides, H.; Morris, R.H.; Richards, P.; El Haj, A.J.; Sottile, V. Autonomous magnetic labelling of functional mesenchymal stem cells for improved traceability and spatial control in cell therapy applications. J. Tissue Eng. Regen. Med. 2017, 11, 2333–2348. [Google Scholar] [CrossRef] [PubMed]
  45. Kumar, A.; Jena, P.K.; Behera, S.; Lockey, R.F.; Mohapatra, S.; Mohapatra, S. Multifunctional magnetic nanoparticles for targeted delivery. Nanomed. Nanotechnol. Biol. Med. 2010, 6, 64–69. [Google Scholar] [CrossRef] [PubMed] [Green Version]
  46. Uzhytchak, M.; Lynnyk, A.; Zablotskii, V.; Dempsey, N.M.; Dias, A.; Bonfim, M.; Lunova, M.; Jirsa, M.; Kubinová, Š.; Lunov, O.; et al. The use of pulsed magnetic fields to increase the uptake of iron oxide nanoparticles by living cells. Appl. Phys. Lett. 2017, 111, 243703. [Google Scholar] [CrossRef]
  47. Prijic, S.; Scancar, J.; Romih, R.; Cemazar, M.; Bregar, V.B.; Znidarsic, A.; Sersa, G. Increased cellular uptake of biocompatible superparamagnetic iron oxide nanoparticles into malignant cells by an external magnetic field. J. Membr. Biol. 2010, 236, 167–179. [Google Scholar] [CrossRef] [PubMed] [Green Version]
  48. Dejardin, T.; de la Fuente, J.; del Pino, P.; Furlani, E.P.; Mullin, M.; Smith, C.A.; Berry, C.C. Influence of both a static magnetic field and penetratin on magnetic nanoparticle delivery into fibroblasts. Nanomedicine 2011, 6, 1719–1731. [Google Scholar] [CrossRef]
  49. Furlani, E.P. Magnetic Biotransport: Analysis and Applications. Materials 2010, 3, 2412–2446. [Google Scholar] [CrossRef] [Green Version]
  50. Son, S.; Liang, M.S.; Lei, P.; Xue, X.; Furlani, E.P.; Andreadis, S.T. Magnetofection Mediated Transient NANOG Overexpression Enhances Proliferation and Myogenic Differentiation of Human Hair Follicle Derived Mesenchymal Stem Cells. Bioconjug. Chem. 2015, 26, 1314–1327. [Google Scholar] [CrossRef] [Green Version]
  51. Albukhaty, S.; Naderi-Manesh, H.; Tiraihi, T.; Sakhi Jabir, M. Poly-l-lysine-coated superparamagnetic nanoparticles: A novel method for the transfection of pro-BDNF into neural stem cells. Artif. Cells Nanomed. Biotechnol. 2018, 46, S125–S132. [Google Scholar] [CrossRef] [PubMed] [Green Version]
  52. Huang, L.; Xia, B.; Liu, Z.; Cao, Q.; Huang, J.; Luo, Z. Superparamagnetic Iron Oxide Nanoparticle-Mediated Forces Enhance the Migration of Schwann Cells Across the Astrocyte-Schwann Cell Boundary In vitro. Front. Cell Neurosci. 2017, 11, 83. [Google Scholar] [CrossRef] [PubMed] [Green Version]
  53. Jiang, J.; Chen, Y.; Zhu, Y.; Yao, X.; Qi, J. Efficient in vitro labeling of human prostate cancer cells with superparamagnetic iron oxide nanoparticles. Cancer Biother. Radiopharm. 2011, 26, 461–467. [Google Scholar] [CrossRef]
  54. Mamani, J.B.; Pavon, L.F.; Miyaki, L.A.; Sibov, T.T.; Rossan, F.; Silveira, P.H.; Cárdenas, W.H.; Amaro Junior, E.; Gamarra, L.F. Intracellular labeling and quantification process by magnetic resonance imaging using iron oxide magnetic nanoparticles in rat C6 glioma cell line. Einstein 2012, 10, 216–221. [Google Scholar] [CrossRef] [PubMed]
  55. McBain, S.C.; Yiu, H.H.P.; Dobson, J. Magnetic nanoparticles for gene and drug delivery. Int. J. Nanomed. 2008, 3, 169–180. [Google Scholar] [CrossRef] [Green Version]
  56. Pongrac, I.M.; Dobrivojević, M.; Ahmed, L.B.; Babič, M.; Šlouf, M.; Horák, D.; Gajović, S. Improved biocompatibility and efficient labeling of neural stem cells with poly(L-lysine)-coated maghemite nanoparticles. Beilstein J. Nanotechnol. 2016, 7, 926–936. [Google Scholar] [CrossRef] [Green Version]
  57. Sibov, T.T.; Miyaki, L.A.M.; Mamani, J.B.; Marti, L.C.; Sardinha, L.R.; Pavon, L.F.; Oliveira, D.M.d.; Cardenas, W.H.; Gamarra, L.F. Evaluation of umbilical cord mesenchymal stem cell labeling with superparamagnetic iron oxide nanoparticles coated with dextran and complexed with Poly-L-lysine. Einstein 2012, 10, 180–188. [Google Scholar] [CrossRef] [PubMed] [Green Version]
  58. Wang, X.; Zhang, H.; Jing, H.; Cui, L. Highly Efficient Labeling of Human Lung Cancer Cells Using Cationic Poly-l-lysine-Assisted Magnetic Iron Oxide Nanoparticles. Nano-Micro Lett. 2015, 7, 374–384. [Google Scholar] [CrossRef] [Green Version]
  59. Song, M.; Moon, W.K.; Kim, Y.; Lim, D.; Song, I.C.; Yoon, B.W. Labeling efficacy of superparamagnetic iron oxide nanoparticles to human neural stem cells: Comparison of ferumoxides, monocrystalline iron oxide, cross-linked iron oxide (CLIO)-NH2 and tat-CLIO. Korean J. Radiol. 2007, 8, 365–371. [Google Scholar] [CrossRef] [Green Version]
  60. Siow, W.X.; Chang, Y.-T.; Babič, M.; Lu, Y.-C.; Horák, D.; Ma, Y.-H. Interaction of poly-l-lysine coating and heparan sulfate proteoglycan on magnetic nanoparticle uptake by tumor cells. Int. J. Nanomed. 2018, 13, 1693–1706. [Google Scholar] [CrossRef] [Green Version]
  61. Rueda-Gensini, L.; Cifuentes, J.; Castellanos, M.C.; Puentes, P.R.; Serna, J.A.; Muñoz-Camargo, C.; Cruz, J.C. Tailoring Iron Oxide Nanoparticles for Efficient Cellular Internalization and Endosomal Escape. Nanomaterials 2020, 10, 1816. [Google Scholar] [CrossRef]
  62. Babic, M.; Horák, D.; Trchová, M.; Jendelová, P.; Glogarová, K.; Lesný, P.; Herynek, V.; Hájek, M.; Syková, E. Poly(L-lysine)-modified iron oxide nanoparticles for stem cell labeling. Bioconjug. Chem. 2008, 19, 740–750. [Google Scholar] [CrossRef]
  63. Moore, T.L.; Rodriguez-Lorenzo, L.; Hirsch, V.; Balog, S.; Urban, D.; Jud, C.; Rothen-Rutishauser, B.; Lattuada, M.; Petri-Fink, A. Nanoparticle colloidal stability in cell culture media and impact on cellular interactions. Chem. Soc. Rev. 2015, 44, 6287–6305. [Google Scholar] [CrossRef] [PubMed] [Green Version]
  64. Sharma, G.; Kodali, V.; Gaffrey, M.; Wang, W.; Minard, K.R.; Karin, N.J.; Teeguarden, J.G.; Thrall, B.D. Iron oxide nanoparticle agglomeration influences dose rates and modulates oxidative stress-mediated dose-response profiles in vitro. Nanotoxicology 2014, 8, 663–675. [Google Scholar] [CrossRef] [Green Version]
  65. Shukla, S.; Jadaun, A.; Arora, V.; Sinha, R.K.; Biyani, N.; Jain, V.K. In vitro toxicity assessment of chitosan oligosaccharide coated iron oxide nanoparticles. Toxicol. Rep. 2015, 2, 27–39. [Google Scholar] [CrossRef] [PubMed] [Green Version]
  66. Fortin, J.P.; Gazeau, F.; Wilhelm, C. Intracellular heating of living cells through Néel relaxation of magnetic nanoparticles. Eur. Biophys. J. EBJ 2008, 37, 223–228. [Google Scholar] [CrossRef]
  67. Wang, X.; Gu, H.; Yang, Z. The heating effect of magnetic fluids in an alternating magnetic field. J. Magn. Magn. Mater. 2005, 293, 334–340. [Google Scholar] [CrossRef]
  68. Hergt, R.; Hiergeist, R.; Hilger, I.; Kaiser, W.A.; Lapatnikov, Y.; Margel, S.; Richter, U. Maghemite nanoparticles with very high AC-losses for application in RF-magnetic hyperthermia. J. Magn. Magn. Mater. 2004, 270, 345–357. [Google Scholar] [CrossRef]
  69. Fortin, J.-P.; Wilhelm, C.; Servais, J.; Ménager, C.; Bacri, J.-C.; Gazeau, F. Size-Sorted Anionic Iron Oxide Nanomagnets as Colloidal Mediators for Magnetic Hyperthermia. J. Am. Chem. Soc. 2007, 129, 2628–2635. [Google Scholar] [CrossRef]
  70. Cheng, D.; Li, X.; Zhang, G.; Shi, H. Morphological effect of oscillating magnetic nanoparticles in killing tumor cells. Nanoscale Res. Lett. 2014, 9, 195. [Google Scholar] [CrossRef] [Green Version]
  71. Mansell, R.; Vemulkar, T.; Petit, D.C.M.C.; Cheng, Y.; Murphy, J.; Lesniak, M.S.; Cowburn, R.P. Magnetic particles with perpendicular anisotropy for mechanical cancer cell destruction. Sci. Rep. 2017, 7, 4257. [Google Scholar] [CrossRef]
  72. Leulmi, S.; Chauchet, X.; Morcrette, M.; Ortiz, G.; Joisten, H.; Sabon, P.; Livache, T.; Hou, Y.; Carrière, M.; Lequien, S.; et al. Triggering the apoptosis of targeted human renal cancer cells by the vibration of anisotropic magnetic particles attached to the cell membrane. Nanoscale 2015, 7, 15904–15914. [Google Scholar] [CrossRef]
  73. Rego, G.N.d.A.; Mamani, J.B.; Souza, T.K.F.; Nucci, M.P.; Silva, H.R.d.; Gamarra, L.F. Avaliação terapêutica da técnica de magneto-hipertermia utilizando nanopartículas de Fe3O4 recobertas com aminosilana em modelo animal de glioblastoma. Einstein 2019, 1–17. [Google Scholar] [CrossRef] [Green Version]
  74. Shinkai, M.; Yanase, M.; Honda, H.; Wakabayashi, T.; Yoshida, J.; Kobayashi, T. Intracellular hyperthermia for cancer using magnetite cationic liposomes: In vitro study. Jpn. J. Cancer Res. 1996, 87, 1179–1183. [Google Scholar] [CrossRef] [PubMed]
  75. Barth, R.F.; Kaur, B. Rat brain tumor models in experimental neuro-oncology: The C6, 9L, T9, RG2, F98, BT4C, RT-2 and CNS-1 gliomas. J. Neuro-Oncol. 2009, 94, 299–312. [Google Scholar] [CrossRef] [PubMed] [Green Version]
  76. Silva, A.C.d.; Cabral, F.R.; Mamani, J.B.; Malheiros, J.M.; Polli, R.S.; Tannus, A.; Vidoto, E.; Martins, M.J.; Sibov, T.T.; Pavon, L.F.; et al. Tumor growth analysis by magnetic resonance imaging of the C6 glioblastoma model with prospects for the assessment of magnetohyperthermia therapy. Einstein 2012, 10, 11–15. [Google Scholar] [CrossRef] [Green Version]
  77. Gordon, R.T.; Hines, J.R.; Gordon, D. Intracellular hyperthermia. A biophysical approach to cancer treatment via intracellular temperature and biophysical alterations. Med. Hypotheses 1979, 5, 83–102. [Google Scholar] [CrossRef]
  78. Sanz, B.; Calatayud, M.P.; Torres, T.E.; Fanarraga, M.L.; Ibarra, M.R.; Goya, G.F. Magnetic hyperthermia enhances cell toxicity with respect to exogenous heating. Biomaterials 2017, 114, 62–70. [Google Scholar] [CrossRef] [Green Version]
  79. Palzer, J.; Mues, B.; Goerg, R.; Aberle, M.; Rensen, S.S.; Olde Damink, S.W.M.; Vaes, R.D.W.; Cramer, T.; Schmitz-Rode, T.; Neumann, U.P.; et al. Magnetic Fluid Hyperthermia as Treatment Option for Pancreatic Cancer Cells and Pancreatic Cancer Organoids. Int. J. Nanomed. 2021, 16, 2965–2981. [Google Scholar] [CrossRef]
Figure 1. Experimental design. The first stage (AC): (A) Aminosilane-coated SPION; (B) Calculation of the SPIONAmine SAR according to magnetic field intensity, frequency, and SPIONAmine diameter; (C) C6 cells after transfection of luciferase and (¥) Selection of the SPIONAmine with the best SAR value. The second stage: (D) Internalization strategies (I–VI) of the SPIONAmine into the C6 cells in (#) three different concentrations (100, 200, and 300 µgFe/mL), with and without filtration, and also with and without magnetic field (static or dynamic) and combined or not with poly-L-lysine (PLL) transfection agent; (£) Selection the C6 cell labeled with SPIONAmine resulting from the best strategy of internalization. The third stage: (E) MHT assay in vitro. The fourth stage: (F) evaluation of MHT therapy efficiency.
Pharmaceutics 13 01219 g001
Figure 2. Evaluation of the SPIONAmine 50 and 100 nm features for MHT: (A) SPIONAmine size distribution characterization by DLS, SPIONAmine of 50 nm (blue) and 100 nm (red); (B,C) Heating curves acquired using the following values of magnetic field: 50 Gauss (black), 150 Gauss (blue), and 300 Gauss (red) curves combined with the frequencies 305 kHz (dashed line) and 557 kHz (continuous line); (D) Heating curves of SPIONAmine of 50 nm (red dashed line) and 100 nm (back continuous line) in the best condition of magnetic field and frequency; (E,F) Graphic in bars of mean SAR values of the SPIONAmine of 50 nm and 100 nm, respectively, analyzing each one of the three parameters of magnetic field with each frequency.
Pharmaceutics 13 01219 g002
Figure 3. Bioluminescent Kinetics of the C6Luc according to cell concentrations (represented by lines with solid symbols) and the respective controls (represented by lines with empty symbols). The inside figure shows the BLI signal inferior of 0.20 × 10⁹ photons/s. The BLI signal intensity was represented by color score bar (inferior right corner) and the correspondent BLI intensity of the C6Luc cells concentrations and control were represented using a ROI at 180 min.
Pharmaceutics 13 01219 g003
Figure 4. Microscopy optical image of 6Luc labeled with SPIONAmine of 100 nm with following strategies of internalization: 100 (#), 200 (§), or 300 (@) μgFe/mL of SPIONAmine concentration; without PLL transfection agent and without filter (A,F,K); without PLL and with filter (B,G,L); with PLL and without filter (C,H,M); with PLL and with filter (D,I,N); control conditions (E,J,O); without magnet field (AE), with static magnet field (FJ), and with dynamic magnet field (KO). Abbreviations: PLL: Polylysine; WM: without magnet; SM: static magnet; DM: dynamic magnet. The images are shown in 10× magnification.
Pharmaceutics 13 01219 g004
Figure 5. Evaluation of the SPIONAmine polydispersity resuspended in different colloidal solutions used in cellular labeling, in the presence of the transecting agent and the filtering process by the technique of dynamic light scattering. * RPMI culture medium supplemented with 10% fetal bovine serum.
Pharmaceutics 13 01219 g005
Figure 6. MTT assay for cellular viability evaluation after process of C6Luc labeling with SPIONAmine for concentrations: of 100 (A), 200 (B) and 300 μgFe/mL (C). Control conditions are demonstrated by the white bars, without PLL condition in light grey bars and with PLL condition in dark grey bars. The conditions that combined the use of filter were represented by bars with fill of vertical lines. Abbreviations: WM: without magnet; SM: static magnet; DM: dynamic magnet.
Pharmaceutics 13 01219 g006
Figure 7. MHT technique efficiency evaluation. (I) C6Luc submitted to MHT; (I*) C6Luc did not submit to MHT; (II) C6Luc labeled with 100 μgFe/mL SPIONAmine submitted to MHT; (II*) C6Luc labeled with 100 μgFe/mL SPIONAmine did not submit to MHT; (III) the cellular viability quantification using the BLI intensity signal for each condition. MHT applications in C6Luc and in C6Luc labeled with SPIONAmine, where (A,B) heating planning curve, (C,D) C6Luc heating curve, (E,F) Magnetic field curve, (G,H) frequency of field during MHT. ** p < 0.001 compared with (II) group. Abbreviations: MHT: Magnetic hyperthermia therapy, Luc: Luciferase, min: minutes, SPION: superparamagnetic iron oxide nanoparticles, MF: magnetic field.
Pharmaceutics 13 01219 g007
Figure 8. C6Luc cells viability analysis by flow cytometry. (A) C6Luc without MHT application; (B) C6Luc submitted to MHT; (C) C6Luc labeled with 100 μgFe/mL SPIONAmine without MHT application; (D) C6Luc labeled with 100 μgFe/mL SPIONAmine submitted to MHT at 44 °C; and (E) cell viability in each experimental group. ** p < 0.001 compared with (D) group. Abbreviations: MHT: Magnetic hyperthermia therapy, Luc: Luciferase, min: minutes, SPION: superparamagnetic iron oxide nanoparticles, FITC: Fluorescein isothiocyanate. Q1: early necrotic cells (AnxV+/PI-); Q2: necrotic or late apoptotic cells (AnxV+/PI+); Q3: necrotic cells (AnxV-/PI+); Q4: viable cells (AnxV-/PI-).
Pharmaceutics 13 01219 g008
Table 1. Conditions for MHT in vitro application.
ConditionC6LucSPIONAmineMHT
I *+--
I+-+
II *++-
II+++
I *, II * controls samples without MHT exposition.
Table 2. Hydrodynamic diameter values around 100 nm obtained from the polydispersion graphs in each condition of SPIONAmine colloidal suspension used in the cell labeling process.
ConditionsHydrodynamic Diameter (nm)Zeta Potential (mV)
SPIONAmine+H2O110.2 ± 0.4+9.5 ± 1.0
SPIONAmine+RPMI141.1 ± 0.5+10.0 ± 1.1
SPIONAmine+RPMI+Filter107.2 ± 0.3+14.2 ± 1.6
SPIONAmine+RPMI+PLL169.2 ± 0.6+20.6 ± 1.2
SPIONAmine+RPMI+PLL+Filter156.6 ± 0.6+35.0 ± 1.9
Publisher’s Note: MDPI stays neutral with regard to jurisdictional claims in published maps and institutional affiliations.

