
Pre-Formulation Studies: Physicochemical Characteristics and In Vitro Release Kinetics of Insulin from Selected Hydrogels †

 , ,
, ,
Abstract
:1. Introduction
2. Materials and Methods
2.1. Materials
2.2. Preparation of Hydrogels
2.3. Stability Studies
2.4. Insulin Release In Vitro
2.5. Release Kinetics
2.6. Dissolution Profiles Comparison
2.7. Measurement of Rheological Parameters
2.8. Texture Analysis
2.9. Circular Dichroism (CD), Emission, and Absorption Spectra Measurements
2.10. Statistical Analysis
3. Results
4. Discussion
5. Conclusions
Author Contributions
Funding
Institutional Review Board Statement
Informed Consent Statement
Data Availability Statement
Conflicts of Interest
References
- Gerich, J.E. Is Reduced First-Phase Insulin Release the Earliest Detectable Abnormality in Individuals Destined to Develop Type 2 Diabetes? Diabetes 2002, 51, S117–S121. [Google Scholar] [CrossRef] [PubMed] [Green Version]
- Rho, H.S.; Veltkamp, H.W.; Hanke, A.T.; Ottens, M.; Breukers, C.; Habibović, P.; Gardeniers, H. Systematic Investigation of Insulin Fibrillation on a Chip. Molecules 2020, 25, 1380. [Google Scholar] [CrossRef] [Green Version]
- Chang, S.G.; Choi, K.D.; Jang, S.H.; Shin, H.C. Role of disulfide bonds in the structure and activity of human insulin. Mol. Cells 2003, 16, 323–330. [Google Scholar]
- Rachdaoui, N. Insulin: The Friend and the Foe in the Development of Type 2 Diabetes Mellitus. Int. J. Mol. Sci. 2020, 21, 1770. [Google Scholar] [CrossRef] [Green Version]
- Haeusler, R.A.; McGraw, T.E.; Accili, D. Biochemical and cellular properties of insulin receptor signalling. Nat. Rev. Mol. Cell. Biol. 2018, 19, 31–44. [Google Scholar] [CrossRef]
- Quitério, M.; Simões, S.; Ascenso, A.; Carvalheiro, M.; Leandro, A.P.; Correia, I.; Viana, A.S.; Faísca, P.; Ascensão, L.; Molpeceres, J.; et al. Development of a Topical Insulin Polymeric Nanoformulation for Skin Burn Regeneration: An Experimental Approach. Int. J. Mol. Sci. 2021, 22, 4087. [Google Scholar] [CrossRef] [PubMed]
- Abdelkader, D.H.; Osman, M.A.; Elgizawy, S.A.; Faheem, A.M.; McCarron, P.A. The Role of Insulin in Wound Healing Process: Mechanism of Action and Pharmaceutical Applications. J. Anal. Pharm. Res. 2016, 2, 7. [Google Scholar] [CrossRef]
- Shukla, S.K.; Sharma, A.K.; Gupta, V.; Yashavarddhan, M.H. Pharmacological control of inflammation in wound healing. J. Tissue Viability 2019, 28, 218–222. [Google Scholar] [CrossRef]
- Pendsey, S.P. Understanding diabetic foot. Int. J. Diabetes Dev. Ctries 2010, 28, 519–526. [Google Scholar] [CrossRef] [Green Version]
- Whitaker, I.S.; Twine, C.; Whitaker, M.J.; Welck, M.; Brown, C.S.; Shandall, A. Larval therapy from antiquity to the present day: Mechanisms of action, clinical applications and future potential. Postgrad. Med. J. 2007, 83, 409–413. [Google Scholar] [CrossRef] [Green Version]
- Dehkordi, A.N.; Babaheydari, F.M.; Chehelgerdi, M.; Dehkordi, S.R. Skin tissue engineering: Wound healing based on stem-cell-based therapeutic strategies. Stem. Cell. Res. Ther. 2019, 10, 111. [Google Scholar] [CrossRef] [PubMed] [Green Version]
- Abdelkader, D.H.; Osman, M.A.; El-Gizawy, S.A.; Hawthorne, S.J.; Faheem, A.M.; McCarron, P.A. Effect of poly(ethylene glycol) on insulin stability and cutaneous cell proliferation in vitro following cytoplasmic delivery of insulin-loaded nanoparticulate carriers-A potential topical wound management approach. Eur. J. Pharm. Sci. 2018, 14, 372–384. [Google Scholar] [CrossRef]
- Goenka, G.; Athavale, V.S.; Nirhale, D.S.; Deshpande, N.; Agrawal, K.; Calcuttawala, M. Role of topical use of insulin in healing of chronic ulcer. Med. J. DY Patil. Univ. 2014, 7, 579–583. [Google Scholar] [CrossRef]
- Besson, J.C.F.; Hernandes, L.; Campos, J.M.; Morikawa, K.A.; Bersani-Amado, C.A.; Matioli, G. Insulin complexed with cyclodextrins stimulates epithelialization and neovascularization of skin wound healing in rats. Injury 2017, 48, 2417–2425. [Google Scholar] [CrossRef]
- Lima, M.H.; Saad, M. Processo de Obtenção de Uma Preparação Farmacêutica, Preparação Farmacêutica e Seu Uso Como Medicamento para Lesões Ulceradas. BRPI0705370 B1 12 October 2007. [Google Scholar]
- Lima, M.H.M.; Caricilli, A.M.; de Abreu, L.L.; Araújo, E.P.; Pelegrinelli, F.F.; Thirone, A.C.P.; Tsukumo, D.M.; Pessoa, A.F.M.; dos Santos, M.F.; de Moraes, M.A.; et al. Topical Insulin Accelerates Wound Healing in Diabetes by Enhancing the AKT and ERK Pathways: A Double-Blind Placebo-Controlled Clinical Trial. PLoS ONE 2012, 7, e36974. [Google Scholar] [CrossRef] [Green Version]
- Zhao, L.; Niu, L.; Liang, H.; Tan, H.; Liu, C.; Zhu, F. pH and glucose dual-responsive injectable hydrogels with insulin and fibroblasts as bioactive dressings for diabetic wound healing. ACS Appl. Mater. Interfaces 2017, 9, 37563–37574. [Google Scholar] [CrossRef]
- Sridharan, K.; Sivaramakrishnan, G. Efficacy of topical insulin in wound healing: A preliminary systematic review and meta-analysis of randomized controlled trials. Wound Repair Regen. 2017, 25, 279–287. [Google Scholar] [CrossRef] [PubMed]
- Lim, J.Y.C.; Goh, S.S.; Loh, X.J. Bottom-Up Engineering of Responsive Hydrogel Materials for Molecular Detection and Biosensing. ACS Mater. Lett. 2020, 2, 918–950. [Google Scholar] [CrossRef]
- Ravaine, V.; Ancla, C.; Catargi, B. Chemically controlled closed-loop insulin delivery. J. Control. Release 2008, 132, 2–11. [Google Scholar] [CrossRef]
- Matsumoto, A.; Tanaka, M.; Matsumoto, H.; Ochi, K.; Moro-Oka, Y.; Kuwata, H.; Yamada, H.; Shirakawa, I.; Miyazawa, T.; Ishii, H.; et al. Synthetic “smart gel” provides glucose-responsive insulin delivery in diabetic mice. Sci. Adv. 2017, 3, eaaq0723. [Google Scholar] [CrossRef] [PubMed] [Green Version]
- Doostmohammadi, M.; Ameri, A.; Mohammadinejad, R.; Dehghannoudeh, N.; Banat, I.M.; Ohadi, M.; Dehghannoudeh, G. (2019). Hydrogels For Peptide Hormones Delivery: Therapeutic And Tissue Engineering Applications. Drug. Des. Devel. Ther. 2019, 13, 3405–3418. [Google Scholar] [CrossRef] [PubMed] [Green Version]
- Jacyna, B.; Maciejewski, B.; Sznitowska, M. Hydrożele w recepturze aptecznej leków dermatologicznych. Farm. Pol. 2020, 76, 57–62. [Google Scholar] [CrossRef]
- Polskie Towarzystwo Farmaceutyczne. Polish Pharmacopoeia XI; Polskie Towarzystwo Farmaceutyczne: Warszawa, Poland, 2017. [Google Scholar]
- Meng, Z.; Ancey, C. The effects of slide cohesion on impulse-wave formation. Exp. Fluids 2019, 60, 151. [Google Scholar] [CrossRef]
- Timofeev, V.I.; Baidus, A.N.; Kislitsyn, Y.A.; Kuranova, I.P. Structure of Human Insulin. PDB Id: 3E7Y. To Be Published. Available online: https://www.rcsb.org/structure/3e7y (accessed on 25 July 2021).
- Quality of biotechnological products: Stability testing of biotechnological/biological products. Annex to the ICH Harmonised Tripartite Guideline for the Stability Testing of New Drug Substances and Products. Dev. Biol. Stand. 1998, 93, 211–219.
- U.S. Pharmacopeial Convention. United States Pharmacopeia, 32; U.S. Pharmacopeial Convention: Rockville, MD, USA, 2009; Volume 2, pp. 2282–2284. [Google Scholar]
- Cardia, M.C.; Carta, A.R.; Caboni, P.; Maccioni, A.M.; Erbì, S.; Boi, L.; Meloni, M.C.; Lai, F.; Sinico, C. Trimethyl Chitosan Hydrogel Nanoparticles for Progesterone Delivery in Neurodegenerative Disorders. Pharmaceutics 2019, 11, 657. [Google Scholar] [CrossRef] [Green Version]
- Shehata, T.M.; Nair, A.B.; Al-Dhubiab, B.E.; Shah, J.; Jacob, S.; Alhaider, I.A.; Attimarad, M.; Elsewedy, H.S.; Ibrahim, M.M. Vesicular Emulgel Based System for Transdermal Delivery of Insulin: Factorial Design and in Vivo Evaluation. Appl. Sci. 2020, 10, 5341. [Google Scholar] [CrossRef]
- Mumuni, A.M.; Calister, E.U.; Aminu, N.; Franklin, C.K.; Musiliu Oluseun, A.; Usman, M.; Abdulmumuni, B.; James, Y.O.; Ofokansi, C.K.; Anthony, A.A.; et al. Mucin-Grafted Polyethylene Glycol Microparticles Enable Oral Insulin Delivery for Improving Diabetic Treatment. Appl. Sci. 2020, 10, 2649. [Google Scholar] [CrossRef] [Green Version]
- Zhang, Y.; Huo, M.; Zhou, J.; Zou, A.; Li, W.; Yao, C.; Xie, S. DDSolver: An add-in program for modeling and comparison of drug dissolution profiles. AAPS J. 2010, 12, 263–271. [Google Scholar] [CrossRef] [PubMed] [Green Version]
- Verrez-Bagnis, V.; Bouchet, B.; Gallant, D.J. Relationship between the starch granule structure and the textural properties of heat–induced surimi gel. Food Struct. 1993, 12, 309–320. [Google Scholar]
- Szczesniak, A.S. Texture is a sensory property. Food Qual. Pref. 2002, 13, 215–225. [Google Scholar] [CrossRef]
- Siemiradzka, W.; Dolińska, B.; Ryszka, F. Development and Study of Semi-Solid Preparations Containing the Model Substance Corticotropin (ACTH): Convenience Application in Neurodegenerative Diseases. Molecules 2020, 25, 1824. [Google Scholar] [CrossRef]
- Siemiradzka, W.; Dolińska, B.; Ryszka, F. Influence of Concentration on Release and Permeation Process of Model Peptide Substance-Corticotropin-From Semisolid Formulations. Molecules 2020, 25, 2767. [Google Scholar] [CrossRef] [PubMed]
- Kelly, S.M.; Jess, T.J.; Price, N.C. How to study proteins by circular dichroism. Biochim. Biophys. Acta 2005, 1751, 119–139. [Google Scholar] [CrossRef] [PubMed]
- Saifullah, M.; Yusof, Y.A.; Chin, N.L.; Aziz, M.G.; Mohammed, M.A.P.; Aziz, N.A. Dissolution profiling and its comparison of natural fruit powder effervescent tablets. J. Food Eng. 2016, 178, 60–70. [Google Scholar] [CrossRef]
- Bom, S.; Santos, C.; Barros, R.; Martins, A.M.; Paradiso, P.; Cláudio, R.; Pinto, P.C.; Ribeiro, H.M.; Marto, J. Effects of Starch Incorporation on the Physicochemical Properties and Release Kinetics of Alginate-Based 3D Hydrogel Patches for Topical Delivery. Pharmaceutics 2020, 12, 719. [Google Scholar] [CrossRef] [PubMed]
- Destruel, P.L.; Zeng, N.; Brignole-Baudouin, F.; Douat, S.; Seguin, J.; Olivier, E.; Dutot, M.; Rat, P.; Dufaÿ, S.; Dufaÿ-Wojcicki, A.; et al. In Situ Gelling Ophthalmic Drug Delivery System for the Optimization of Diagnostic and Preoperative Mydriasis: In Vitro Drug Release, Cytotoxicity and Mydriasis Pharmacodynamics. Pharmaceutics 2020, 12, 360. [Google Scholar] [CrossRef] [PubMed] [Green Version]
- Kim, J.Y.; Song, J.Y.; Lee, E.J.; Park, S.K. Rheological properties and microstructures of Carbopol gel network system. Colloid Polym. Sci. 2003, 281, 614–623. [Google Scholar] [CrossRef]
- Islam, M.T.; Rodríguez-Hornedo, N.; Ciotti, S.; Ackermann, C. Rheological characterization of topical carbomer gels neutralized to different pH. Pharm. Res. 2004, 21, 1192–1199. [Google Scholar] [CrossRef] [Green Version]
- Kieweg, S.L.; Geonnotti, A.R.; Katz, D.F. Gravity-induced coating flows of vaginal gel formulations: In vitro experimental analysis. J. Pharm. Sci. 2004, 93, 2941–2952. [Google Scholar] [CrossRef] [PubMed]
- Isaac, V.L.B.; Moraes, J.D.D.; Chiari, B.G.; Guglielmi, D.A.S.; Cefali, L.C.; Rissi, N.C.; Corrêa, M.A. Determination of the real influence of the addition of four thickening agents in creams using rheological measurements. J. Dispers. Sci. Technol. 2013, 34, 532–538. [Google Scholar] [CrossRef]
- Nazaré, A.C.; de Faria, C.M.; Chiari, B.G.; Petrônio, M.S.; Regasini, L.O.; Silva, D.H.; Corrêa, M.A.; Isaac, V.L.; da Fonseca, L.M.; Ximenes, V.F. Ethyl ferulate, a component with anti-inflammatory properties for emulsion-based creams. Molecules 2014, 19, 8124–8139. [Google Scholar] [CrossRef] [PubMed] [Green Version]
- Lee, C.H.; Moturi, V.; Lee, Y. Thixotropic property in pharmaceutical formulations. J. Control. Release 2009, 136, 88–98. [Google Scholar] [CrossRef] [PubMed]
- Carvalho, F.C.; Calixto, G.; Hatakeyama, I.N.; Luz, G.M.; Gremião, M.P.; Chorilli, M. Rheological, mechanical, and bioadhesive behavior of hydrogels to optimize skin delivery systems. Drug Dev. Ind. Pharm. 2013, 39, 1750–1757. [Google Scholar] [CrossRef]
- Bansal, K.; Rawat, M.K.; Jain, A.; Rajput, A.; Chaturvedi, T.P.; Singh, S. Development of satranidazole mucoadhesive gel for the treatment of periodontitis. AAPS Pharmscitech 2009, 10, 716–723. [Google Scholar] [CrossRef] [PubMed] [Green Version]
- Can, A.S.; Erdal, M.S.; Güngör, S.; Özsoy, Y. Optimization and Characterization of Chitosan Films for Transdermal Delivery of Ondansetron. Molecules 2013, 18, 5455–5471. [Google Scholar] [CrossRef] [Green Version]
- Shaw, G.S.; Uvanesh, K.; Gautham, S.N.; Singh, V.; Pramanik, K.; Banerjee, I.; Kumar, N.; Pal, K. Development and characterization of gelatin-tamarind gum/carboxymethyl tamarind gum based phase-separated hydrogels: A comparative study. Des. Monomers Polym. 2015, 18, 1–17. [Google Scholar] [CrossRef] [Green Version]
- Singh, V.K.; Yadav, I.; Kulanthaivel, S.; Roy, B.; Giri, S.; Maiti, T.; Banerjee, I.; Pal, K. Groundnut oil based emulsion gels for passive and iontophoretic delivery of therapeutics. Des. Monomers Polym. 2016, 19, 1–12. [Google Scholar] [CrossRef] [Green Version]
- Xia, H.; Ren, M.; Zou, Y.; Qin, S.; Zeng, C. Novel Biocompatible Polysaccharide-Based Eutectogels with Tunable Rheological, Thermal, and Mechanical Properties: The Role of Water. Molecules 2020, 25, 3314. [Google Scholar] [CrossRef] [PubMed]
- Couto, J.; Figueirinha, A.; Batista, M.T.; Paranhos, A.; Nunes, C.; Gonçalves, L.M.; Marto, J.; Fitas, M.; Pinto, P.; Ribeiro, H.M.; et al. Fragaria vesca L. Extract: A Promising Cosmetic Ingredient with Antioxidant Properties. Antioxidants 2020, 9, 154. [Google Scholar] [CrossRef] [Green Version]
- Li, Y.; Jia, B.; Wand, H.; Li, N.; Chen, G.; Lin, Y.; Gao, W. The interaction of 2-mercaptobenzimidazole with human serum albumin as determined by spectroscopy, atomic force microscopy and molecular modeling. Colloids Surf. 2013, 104, 311–317. [Google Scholar] [CrossRef]
- Tal-Figiel, B.; Figiel, W.; Kwiecień, M. Pomiary oscylacyjne leczniczych układów żelowych. Inz. Aparatura Chem. 2013, 52, 579–580. [Google Scholar]
- Hurler, J.; Engesland, A.; Poorahmary Kermany, B.; Škalko-Basnet, N. Improved texture analysis for hydrogel characterization: Gel cohesiveness, adhesiveness, and hardness. J. Appl. Polym. Sci. 2012, 125, 180–188. [Google Scholar] [CrossRef]
- Suhail, M.; Wu, P.-C.; Minhas, M.U. Using Carbomer-Based Hydrogels for Control the Release Rate of Diclofenac Sodium: Preparation and In Vitro Evaluation. Pharmaceuticals 2020, 13, 399. [Google Scholar] [CrossRef] [PubMed]
- Vaidya, A.P.; Wigent, R.J.; Moore, J.C.; Schwartz, J.B. Protective effect of Carbopol on enzymatic degradation of a peptide-like substrate. I: Effect of various concentrations and grades of Carbopol and other reaction variables on trypsin activity. Pharm. Dev. Technol. 2007, 12, 89–96. [Google Scholar] [CrossRef]
- Zinov’ev, E.V.; Ivakhniuk, G.K.; Dadaian, K.A.; Lagvilava, T.O. [Wound-healing effect of carbopol hydrogels in rats with alloxan diabetes model]. Eksp. Klin. Farmakol. 2014, 77, 20–25. [Google Scholar] [PubMed]
- Jee, J.P.; Pangeni, R.; Jha, S.K.; Byun, Y.; Park, J.W. Preparation and in vivo evaluation of a topical hydrogel system incorporating highly skin-permeable growth factors, quercetin, and oxygen carriers for enhanced diabetic wound-healing therapy. Int. J. Nanomed. 2019, 14, 5449–5475. [Google Scholar] [CrossRef] [PubMed] [Green Version]
- Hui, Q.; Zhang, L.; Yang, X.; Yu, B.; Huang, Z.; Pang, S.; Zhou, Q.; Yang, R.; Li, W.; Hu, L.; et al. Higher Biostability of rh-aFGF-Carbomer 940 Hydrogel and Its Effect on Wound Healing in a Diabetic Rat Model. ACS Biomater. Sci. Eng. 2018, 4, 1661–1668. [Google Scholar] [CrossRef]
- Meng, Z.; Hu, Y.; Ancey, C. Using a Data Driven Approach to Predict Waves Generated by Gravity Driven Mass Flows. Water 2020, 12, 600. [Google Scholar] [CrossRef] [Green Version]
- Jiménez, M.M.; Fresno, M.J.; Ramírez, A. The influence of cosolvent polarity on the flow properties of hydroalcoholic gels: Empirical models. Chem. Pharm. Bull. (Tokyo) 2005, 53, 1097–1102. [Google Scholar] [CrossRef] [Green Version]
- Państwowy Zakład Wydawnictw Lekarskich. Polish Pharmacopoeia VI; Państwowy Zakład Wydawnictw Lekarskich: Warszawa, Poland, 2002. [Google Scholar]
- Peng, Z.; Chen, F. Synthesis and properties of temperature-sensitive hydrogel based on hydroxyethyl cellulose. Int. J. Polym. Mater. 2010, 59, 450–461. [Google Scholar] [CrossRef]
- Gold, G.T.; Varma, D.M.; Taub, P.J.; Nicoll, S.B. Development of crosslinked methylcellulose hydrogels for soft tissue augmentation using an ammonium persulfate-ascorbic acid redox system. Carbohydr. Polym. 2015, 134, 497–507. [Google Scholar] [CrossRef] [Green Version]
- Stalling, S.S.; Akintoye, S.O.; Nicoll, S.B. Development of photocrosslinked methylcellulose hydrogels for soft tissue reconstruction. Acta Biomater. 2009, 5, 1911–1918. [Google Scholar] [CrossRef]
- Lan, B.; Zhang, L.; Yang, L.; Wu, J.; Li, N.; Pan, C.; Wang, X.; Zeng, L.; Yan, L.; Yang, C.; et al. Sustained delivery of MMP-9 siRNA via thermosensitive hydrogel accelerates diabetic wound healing. J. Nanobiotechnol. 2021, 19, 130. [Google Scholar] [CrossRef]
- Naomi, R.; Fauzi, M.B. Cellulose/Collagen Dressings for Diabetic Foot Ulcer: A Review. Pharmaceutics 2020, 12, 881. [Google Scholar] [CrossRef] [PubMed]
- Federici, A.; Federici, G.; Milani, M. Use of a urea, arginine and carnosine cream versus a standard emollient glycerol cream for treatment of severe xerosis of the feet in patients with type 2 diabetes: A randomized, 8 month, assessor-blinded, controlled trial. Curr. Med. Res. Opin. 2015, 31, 1063–1069. [Google Scholar] [CrossRef]
- Jaworska, M.; Vogt, O. Pochodne sorbitolu i celulozy jako czynniki żelujące. Chemik 2013, 67, 242–249. [Google Scholar]
- Kulawik-Pióro, A.; Pogorzelska, K. Rola pochodnych celulozy w wytwarzaniu żeli kosmetycznych. Inz. Ap. Chem. 2015, 54, 40–41. [Google Scholar]
- Tan, Y.T.F.; Peh, K.K.; Al-Hambali, O. Effect of carbopol and polyvinylpyrrolidone on the mechanical, rheological, and release properties of bioadhesive polyethylene glycol gels. AAPS Pharmscitech 2000, 1, 69–78. [Google Scholar] [CrossRef] [PubMed]
- Kołodziejczyk, M.K.; Kołodziejska, J. Niskolepki hydrożel ma bazie karbopolu jako optymalna forma leku z ketoprofenem. eReumatol News 2015, 6, 2–5. [Google Scholar]
- Moon, H.J.; Park, M.H.; Joo, M.K.; Jeong, B. Temperature-responsive compounds as in situ gelling biomedical materials. Chem. Soc. Rev. 2012, 41, 4860–4883. [Google Scholar] [CrossRef] [PubMed]
- Park, C.H.; Jeong, L.; Cho, D.; Kwon, O.H.; Park, W.H. Effect of methylcellulose on the formation and drug release behavior of silk fibroin hydrogel. Carbohydr. Polym. 2013, 98, 1179–1185. [Google Scholar] [CrossRef] [PubMed]
- Bao, Q.; Burgess, D.J. Perspectives on Physicochemical and In Vitro Profiling of Ophthalmic Ointments. Pharm. Res. 2018, 35, 234. [Google Scholar] [CrossRef]
- Li, W.; Gao, F.; Kan, J.; Deng, J.; Wang, B.; Hao, S. Synthesis and fabrication of a keratin-conjugated insulin hydrogel for the enhancement of wound healing. Colloids Surf. B 2019, 175, 436–444. [Google Scholar] [CrossRef] [PubMed]
- Moura, L.I.; Dias, A.M.; Leal, E.C.; Carvalho, L.; de Sousa, H.C.; Carvalho, E. Chitosan-based dressings loaded with neurotensin—An efficient strategy to improve early diabetic wound healing. Acta Biomater. 2014, 10, 843–857. [Google Scholar] [CrossRef] [PubMed] [Green Version]
- Xu, Y.; Zhang, X.; Zhang, Y.; Ye, J.; Wang, H.L.; Xia, X.; Liu, Y. Mechanisms of deformable nanovesicles based on insulin-phospholipid complex for enhancing buccal delivery of insulin. Int. J. Nanomed. 2018, 9, 7319–7331. [Google Scholar] [CrossRef] [Green Version]
- Maciążek–Jurczyk, M.; Morak–Młodawska, B.; Jeleń, M.; Kopeć, W.; Szkudlarek, A.; Owczarzy, A.; Kulig, K.; Rogóż, W.; Pożycka, J. The Influence of Oxidative Stress on Serum Albumin Structure as a Carrier of Selected Diazaphenothiazine with Potential Anticancer Activity. Pharmaceuticals 2021, 14, 285. [Google Scholar] [CrossRef] [PubMed]
- Maciążek-Jurczyk, M.; Janas, K.; Pożycka, J.; Szkudlarek, A.; Rogóż, W.; Owczarzy, A.; Kulig, K. Human Serum Albumin Aggregation/Fibrillation and its Abilities to Drugs Binding. Molecules. 2020, 25, 618. [Google Scholar] [CrossRef] [PubMed] [Green Version]
- Balestrieri, C.; Colonna, G.; Giovane, A.; Irace, G.; Servillo, L. Second–derivative Spectroscopy of Proteins. A Method for the Quantitative Determination of Aromatic Aminoacids in Proteins. Eur. J. Biochem. 1978, 90, 433–440. [Google Scholar] [CrossRef]
- Raza, F.; Zafar, H.; Zhu, Y.; Ren, Y.; Ullah, A.; Khan, A.U.; He, X.; Han, H.; Aquib, M.; Boakye-Yiadom, K.O.; et al. A Review on Recent Advances in Stabilizing Peptides/Proteins upon Fabrication in Hydrogels from Biodegradable Polymers. Pharmaceutics 2018, 10, 16. [Google Scholar] [CrossRef] [PubMed] [Green Version]


| Components | H1 | H2 | H3 | H4 |
|---|---|---|---|---|
| Content [g] | ||||
| Carbopol® Ultrez™ 10 | 0.5 | - | - | - |
| Carbopol® Ultrez™ 30 | - | 0.5 | - | - |
| Methyl cellulose | - | - | 4 | - |
| Wheat starch | - | - | - | 14 |
| Glycerol 86% | - | - | - | 73 |
| Ethanol 95% | - | - | - | 1 |
| Purified water | up to 100 | up to 100 | up to 100 | 12 |
| Kinetics Models | Parameters | Formula Code | |||
|---|---|---|---|---|---|
| H1-INS | H2-INS | H3-INS | H4-INS | ||
| Zero Order model | R2 | 0.5976 | 0.3617 | 0.4067 | 0.2224 |
| k0 (%min−1) | 0.424 | 0.396 | 0.170 | 0.142 | |
| AIC | 91.84 | 93.10 | 253.55 | 208.88 | |
| First Order model | R2 | 0.9425 | 0.8702 | 0.8354 | 0.7288 |
| k1 (min−1) | 0.007 | 0.007 | 0.004 | 0.003 | |
| AIC | 68.50 | 73.99 | 217.64 | 183.59 | |
| Higuchi model | R2 | 0.9548 | 0.9564 | 0.9617 | 0.9044 |
| kH (%min−1/2) | 5.191 | 4.883 | 3.536 | 2.964 | |
| AIC | 65.59 | 60.89 | 176.86 | 158.58 | |
| Korsmeyer-Peppas model | R2 | 0.9472 | 0.9540 | 0.9929 | 0.9290 |
| kkp (min−n) | 4.183 | 5.478 | 6.351 | 5.023 | |
| n | 0.545 | 0.476 | 0.399 | 0.410 | |
| AIC | 69.46 | 62.39 | 130.75 | 152.38 | |
| Formula Code | f1 | f2 | Dissolution Profile |
|---|---|---|---|
| H1-INS vs. H2-INS | 7.69 | 68.29 | Similar |
| H1-INS vs. H3-INS | 17.20 | 46.65 | Dissimilar |
| H1-INS vs. H4-INS | 29.20 | 37.60 | Dissimilar |
| H2-INS vs. H3-INS | 15.70 | 49.60 | Dissimilar |
| H2-INS vs. H4-INS | 29.31 | 40.49 | Dissimilar |
| H3-INS vs. H4-INS | 19.91 | 49.38 | Dissimilar |
| Formula Code | η (30 s−1) (mPa × s) | η (50 s−1) (mPa × s) | η (100 s−1) (mPa × s) |
|---|---|---|---|
| 25 ± 1 °C | |||
| H1-INS | 4447 ± 1378 | 2920 ± 272.1 | 2059 ± 623.9 |
| H2-INS | 3826 ± 133.8 | 3195 ± 310.2 | 2023 ± 41.6 |
| H3-INS | 4456 ± 2285 | 3621 ± 1472 | 1921 ± 586.6 |
| H4-INS | 4310 ± 2574 | 3263 ± 999 | 2465 ± 743.3 |
| 32 ± 1 °C | |||
| H1-INS | 4003 ± 1252 | 2901 ± 893.9 | 1917 ± 584.3 |
| H2-INS | 3678 ± 459.3 | 2692 ± 834.8 | 1962 ± 596 |
| H3-INS | 4037 ± 594.9 | 2995 ± 923.1 | 1894 ± 558.6 |
| H4-INS | 3707 ± 867.2 | 3146 ± 963.7 | 1898 ± 578 |
| Formula Code | Herschel–Bulkley | Ostwald-de Waele | Bingham | Casson | |||||||
|---|---|---|---|---|---|---|---|---|---|---|---|
| τ0 | n | K | R2 | n | K | R2 | τ0 | R2 | τ0 | R2 | |
| 25 ± 1 °C | |||||||||||
| H1-INS | 1.6 | 0.520 | 18.50 | 0.994 | 0.520 | 18.5 | 0.993 | 58.464 | 0.970 | 26.713 | 0.985 |
| H2-INS | 34.8 | 0.681 | 8.54 | 0.997 | 0.480 | 24.5 | 0.989 | 65.148 | 0.992 | 32.777 | 0.995 |
| H3-INS | 4.6 | 0.783 | 9.40 | 0.998 | 0.754 | 10.8 | 0.997 | 38.984 | 0.996 | 8.881 | 0.997 |
| H4-INS | 52.0 | 0.990 | 2.86 | 0.993 | 0.604 | 18.9 | 0.968 | 48.746 | 0.990 | 18.975 | 0.984 |
| 32 ± 1 °C | |||||||||||
| H1-INS | 6.2 | 0.523 | 19.20 | 0.999 | 0.494 | 22.4 | 0.998 | 65.985 | 0.977 | 31.906 | 0.992 |
| H2-INS | 34.4 | 0.719 | 7.70 | 0.995 | 0.513 | 22.4 | 0.987 | 63.299 | 0.991 | 29.541 | 0.993 |
| H3-INS | 14.2 | 0.836 | 6.85 | 0.999 | 0.737 | 11.1 | 0.997 | 39.174 | 0.993 | 9.343 | 0.997 |
| H4-INS | 39.6 | 0.940 | 3.31 | 0.998 | 0.615 | 15.8 | 0.980 | 43.424 | 0.995 | 16.133 | 0.993 |
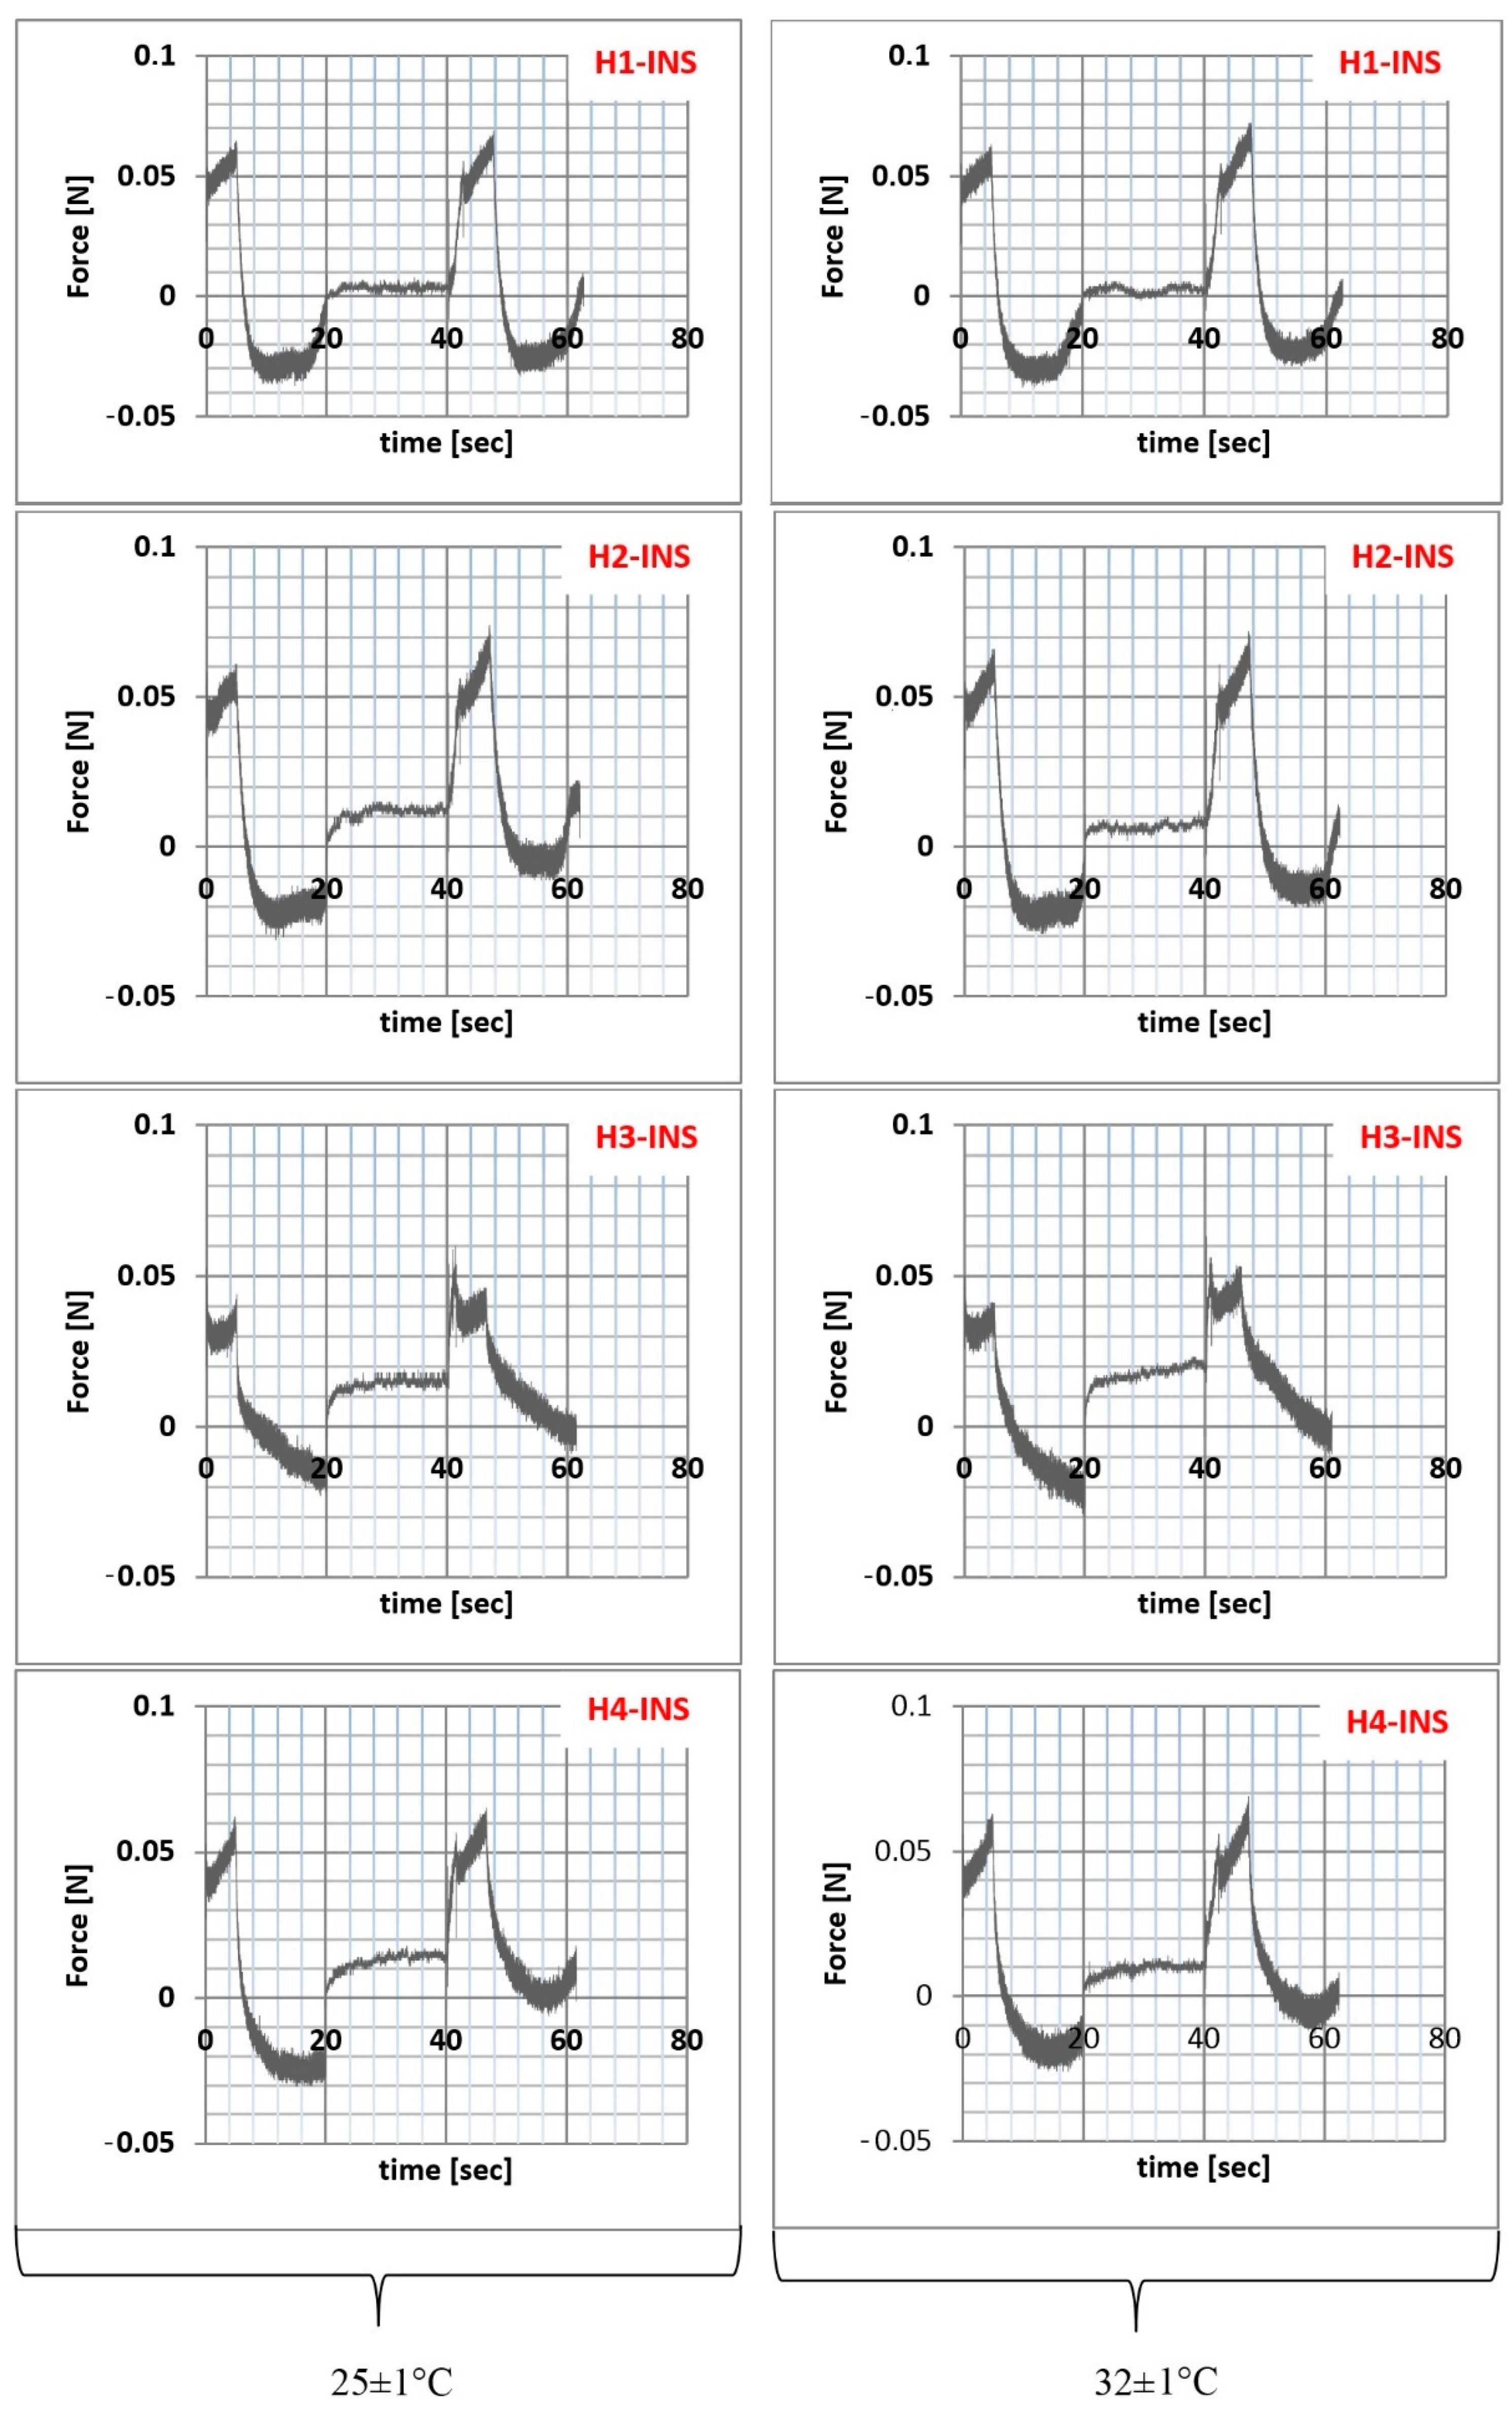
| Formula Code | Relaxation (%) | Hardness1 (N/m2) | Hardness2 (N/m2) | Cohesiveness | Adhesiveness (mJ) | Elasticity |
|---|---|---|---|---|---|---|
| 25 ± 1 °C | ||||||
| H1-INS | 54.2% ± 1.02 a | 0.061 ± 0.02 a | 0.069 ± 0.04 b | 1.087 ± 0.02 a | 0.3 ± 0.01 a | 0.959 ± 0.06 c |
| H2-INS | 58.0% ± 0.58 a | 0.061 ± 0.01 a | 0.074 ± 0.02 b | 1.638 ± 0.04 b | 0.3 ± 0.02 a | 0.696 ± 0.03 b |
| H3-INS | 72.7% ± 0.67 b | 0.042 ± 0.03 b | 0.054 ± 0.03 a | 2.820 ± 0.02 d | 0.1 ± 0.01 a | 0.499 ± 0.04 a |
| H4-INS | 56.5% ± 0.55 a | 0.060 ± 0.01 a | 0.063 ± 0.02 b | 2.080 ± 0.06 c | 0.3 ± 0.02 a | 0.555 ± 0.02 a |
| 32 ± 1 °C | ||||||
| H1-INS | 50.4% ± 1.05 b | 0.060 ± 0.01 a | 0.068 ± 0.02 b | 1.119 ± 0.06 a | 0.3 ± 0.02 a | 0.996 ± 0.05 c |
| H2-INS | 42.0% ± 0.34 a | 0.063 ± 0.02 a | 0.071 ± 0.01 b | 1.281 ± 0.03 a | 0.3 ± 0.02 a | 0.823 ± 0.04 b |
| H3-INS | 74.9% ± 1.00 d | 0.040 ± 0.02 b | 0.047 ± 0.02 a | 3.468 ± 0.04 b | 0.2 ± 0.01 a | 0.426 ± 0.03 a |
| H4-INS | 63.2% ± 0.95 c | 0.062 ± 0.03 a | 0.067 ± 0.03 b | 1.292 ± 0.05 a | 0.2 ± 0.01 a | 0.836 ± 0.04 b |
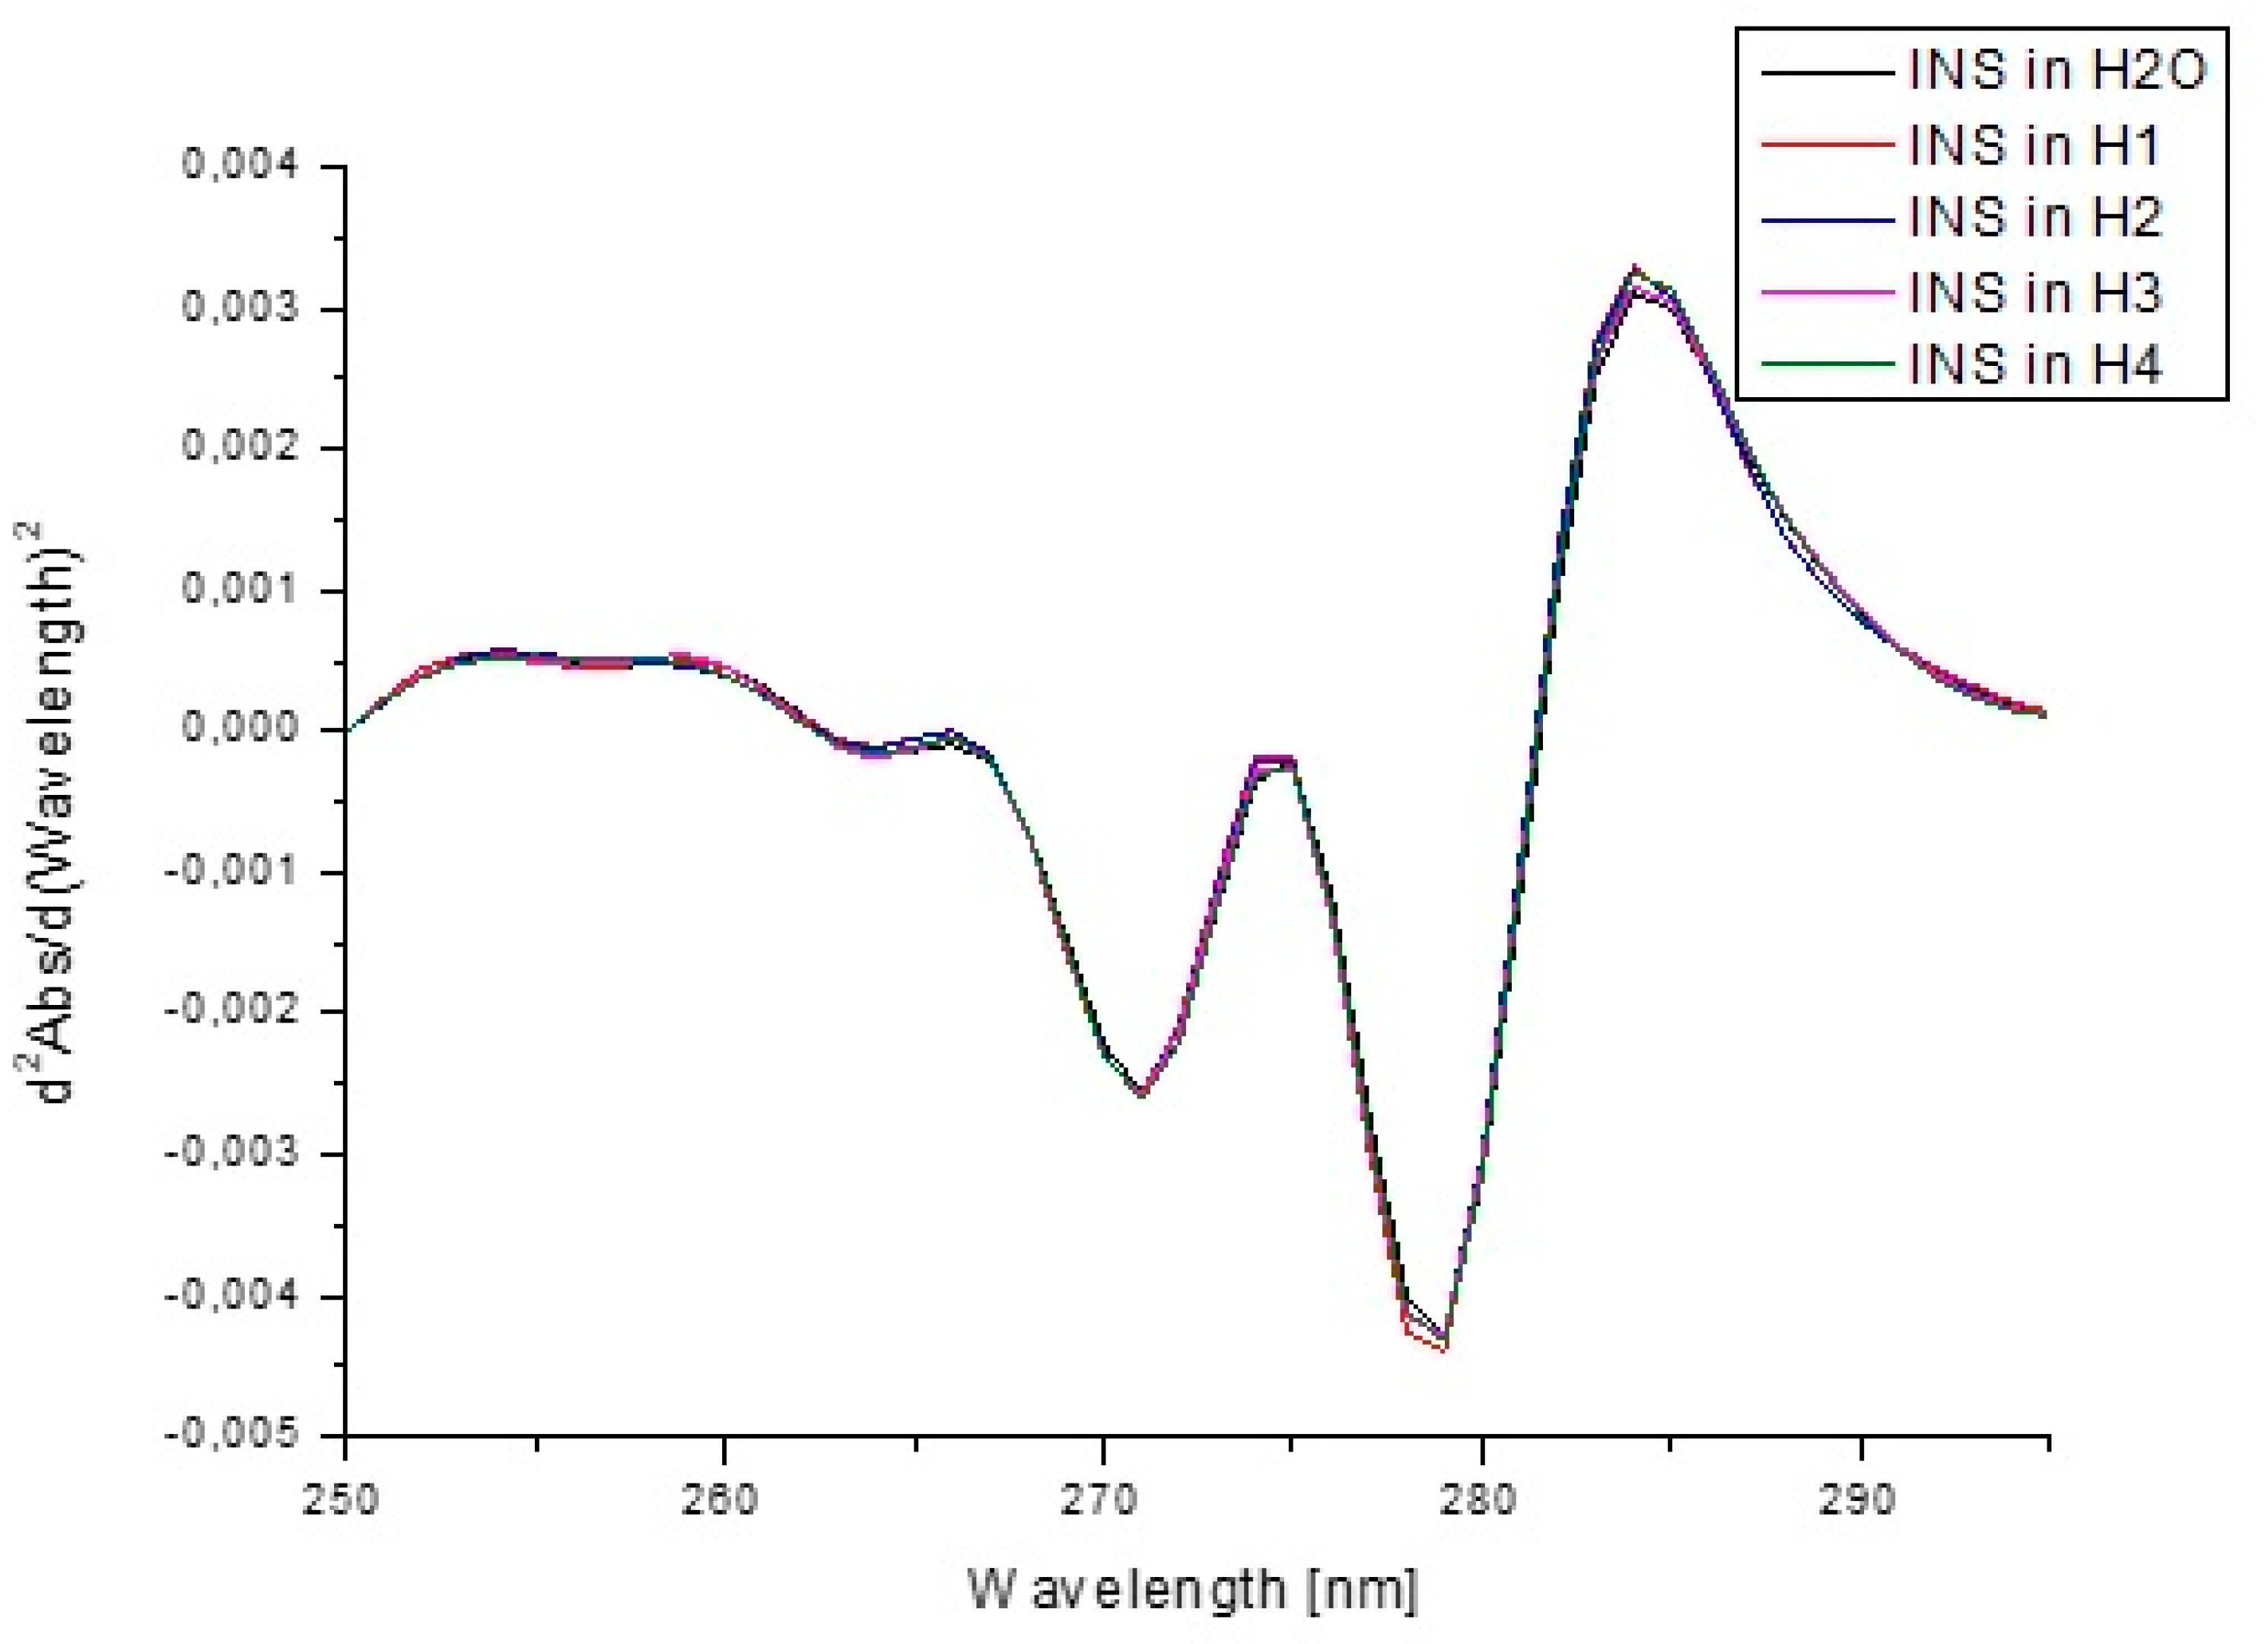
| Form of Insulin | (θ)mre (deg·cm2·dmol−1) | (θ)mre (deg·cm2·dmol−1) | % α-Helix | % β-Sheet | % Random |
|---|---|---|---|---|---|
| INS in H2O | at 209.4 nm −12529.96 | at 219.6 nm −10377.76 | 44.8 | 47.0 | 8.2 |
| INS in H1 | at 210 nm −8808.33 | at 223.8 nm −8335.91 | 26.6 | 52.5 | 20.9 |
| INS in H2 | at 213.0 nm −4742.83 | at 224.2 nm −5360.92 | 28.6 | 55.0 | 16.5 |
| INS in H3 | at 209.6 nm −13245.26 | at 222.0 nm −11572.65 | 52.1 | 47.9 | 0 |
| INS in H4 | at 209.8 nm −13035.82 | at 223.2 nm −11531.60 | 44.9 | 48.3 | 6.8 |
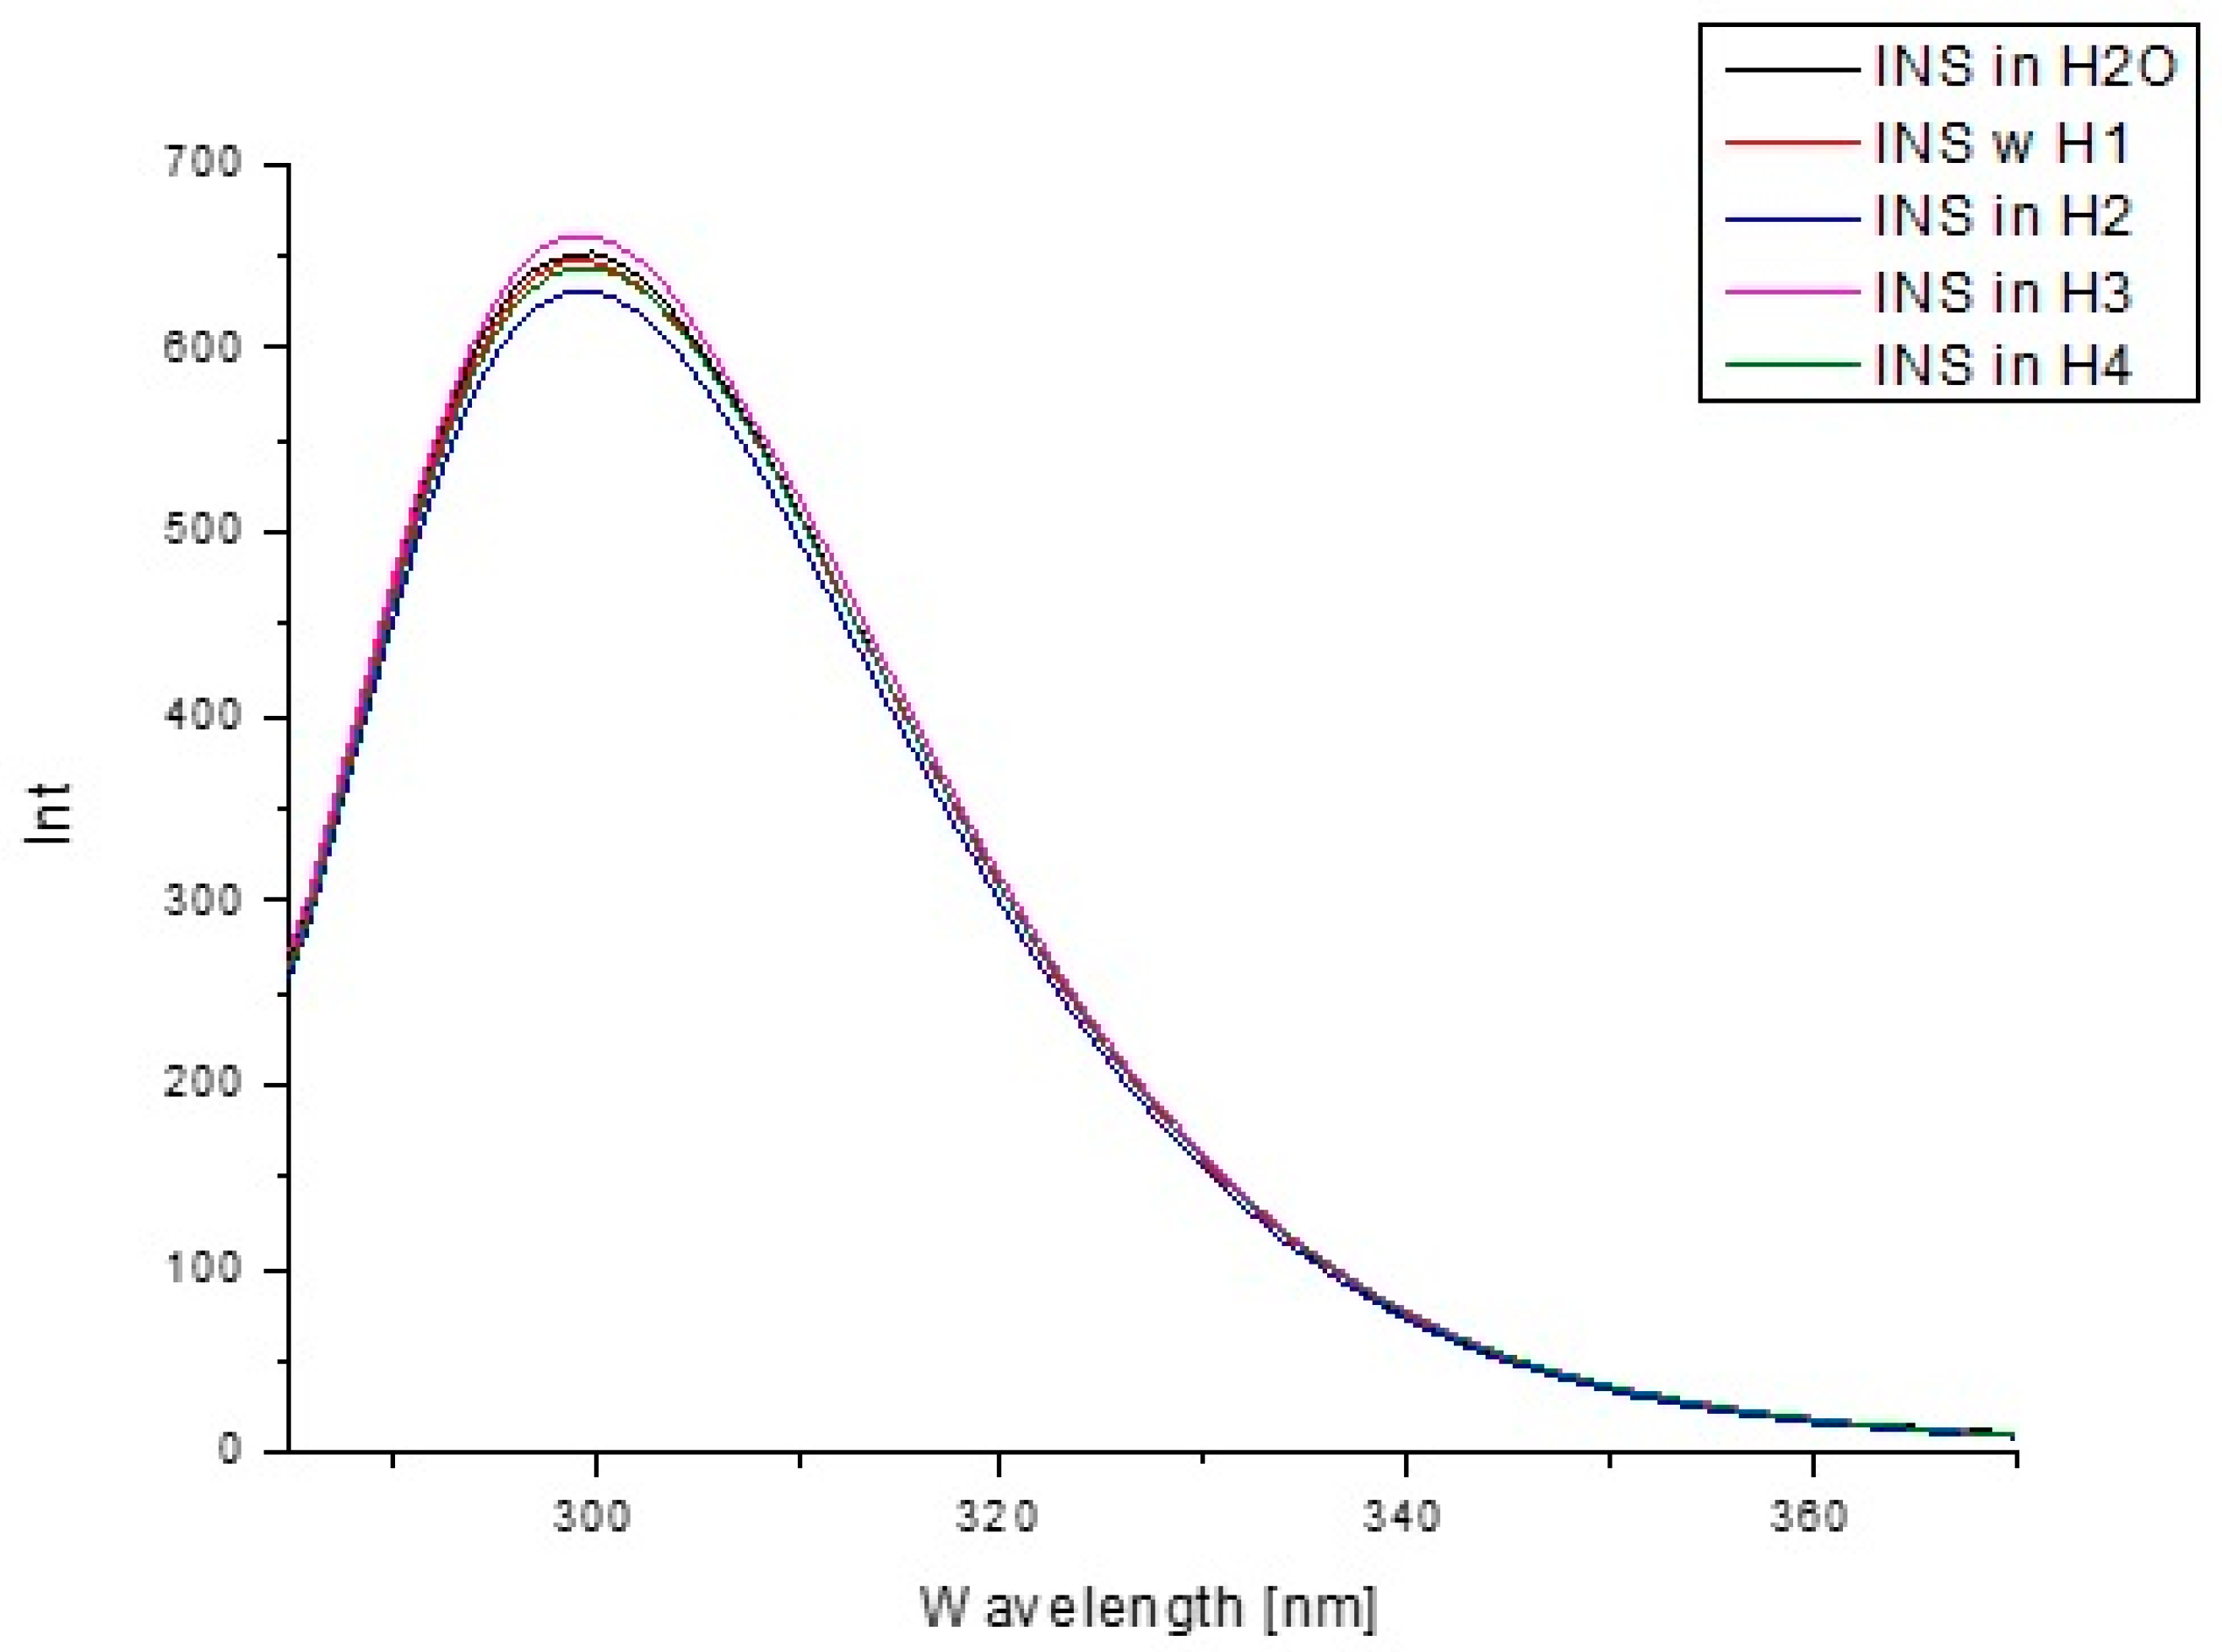
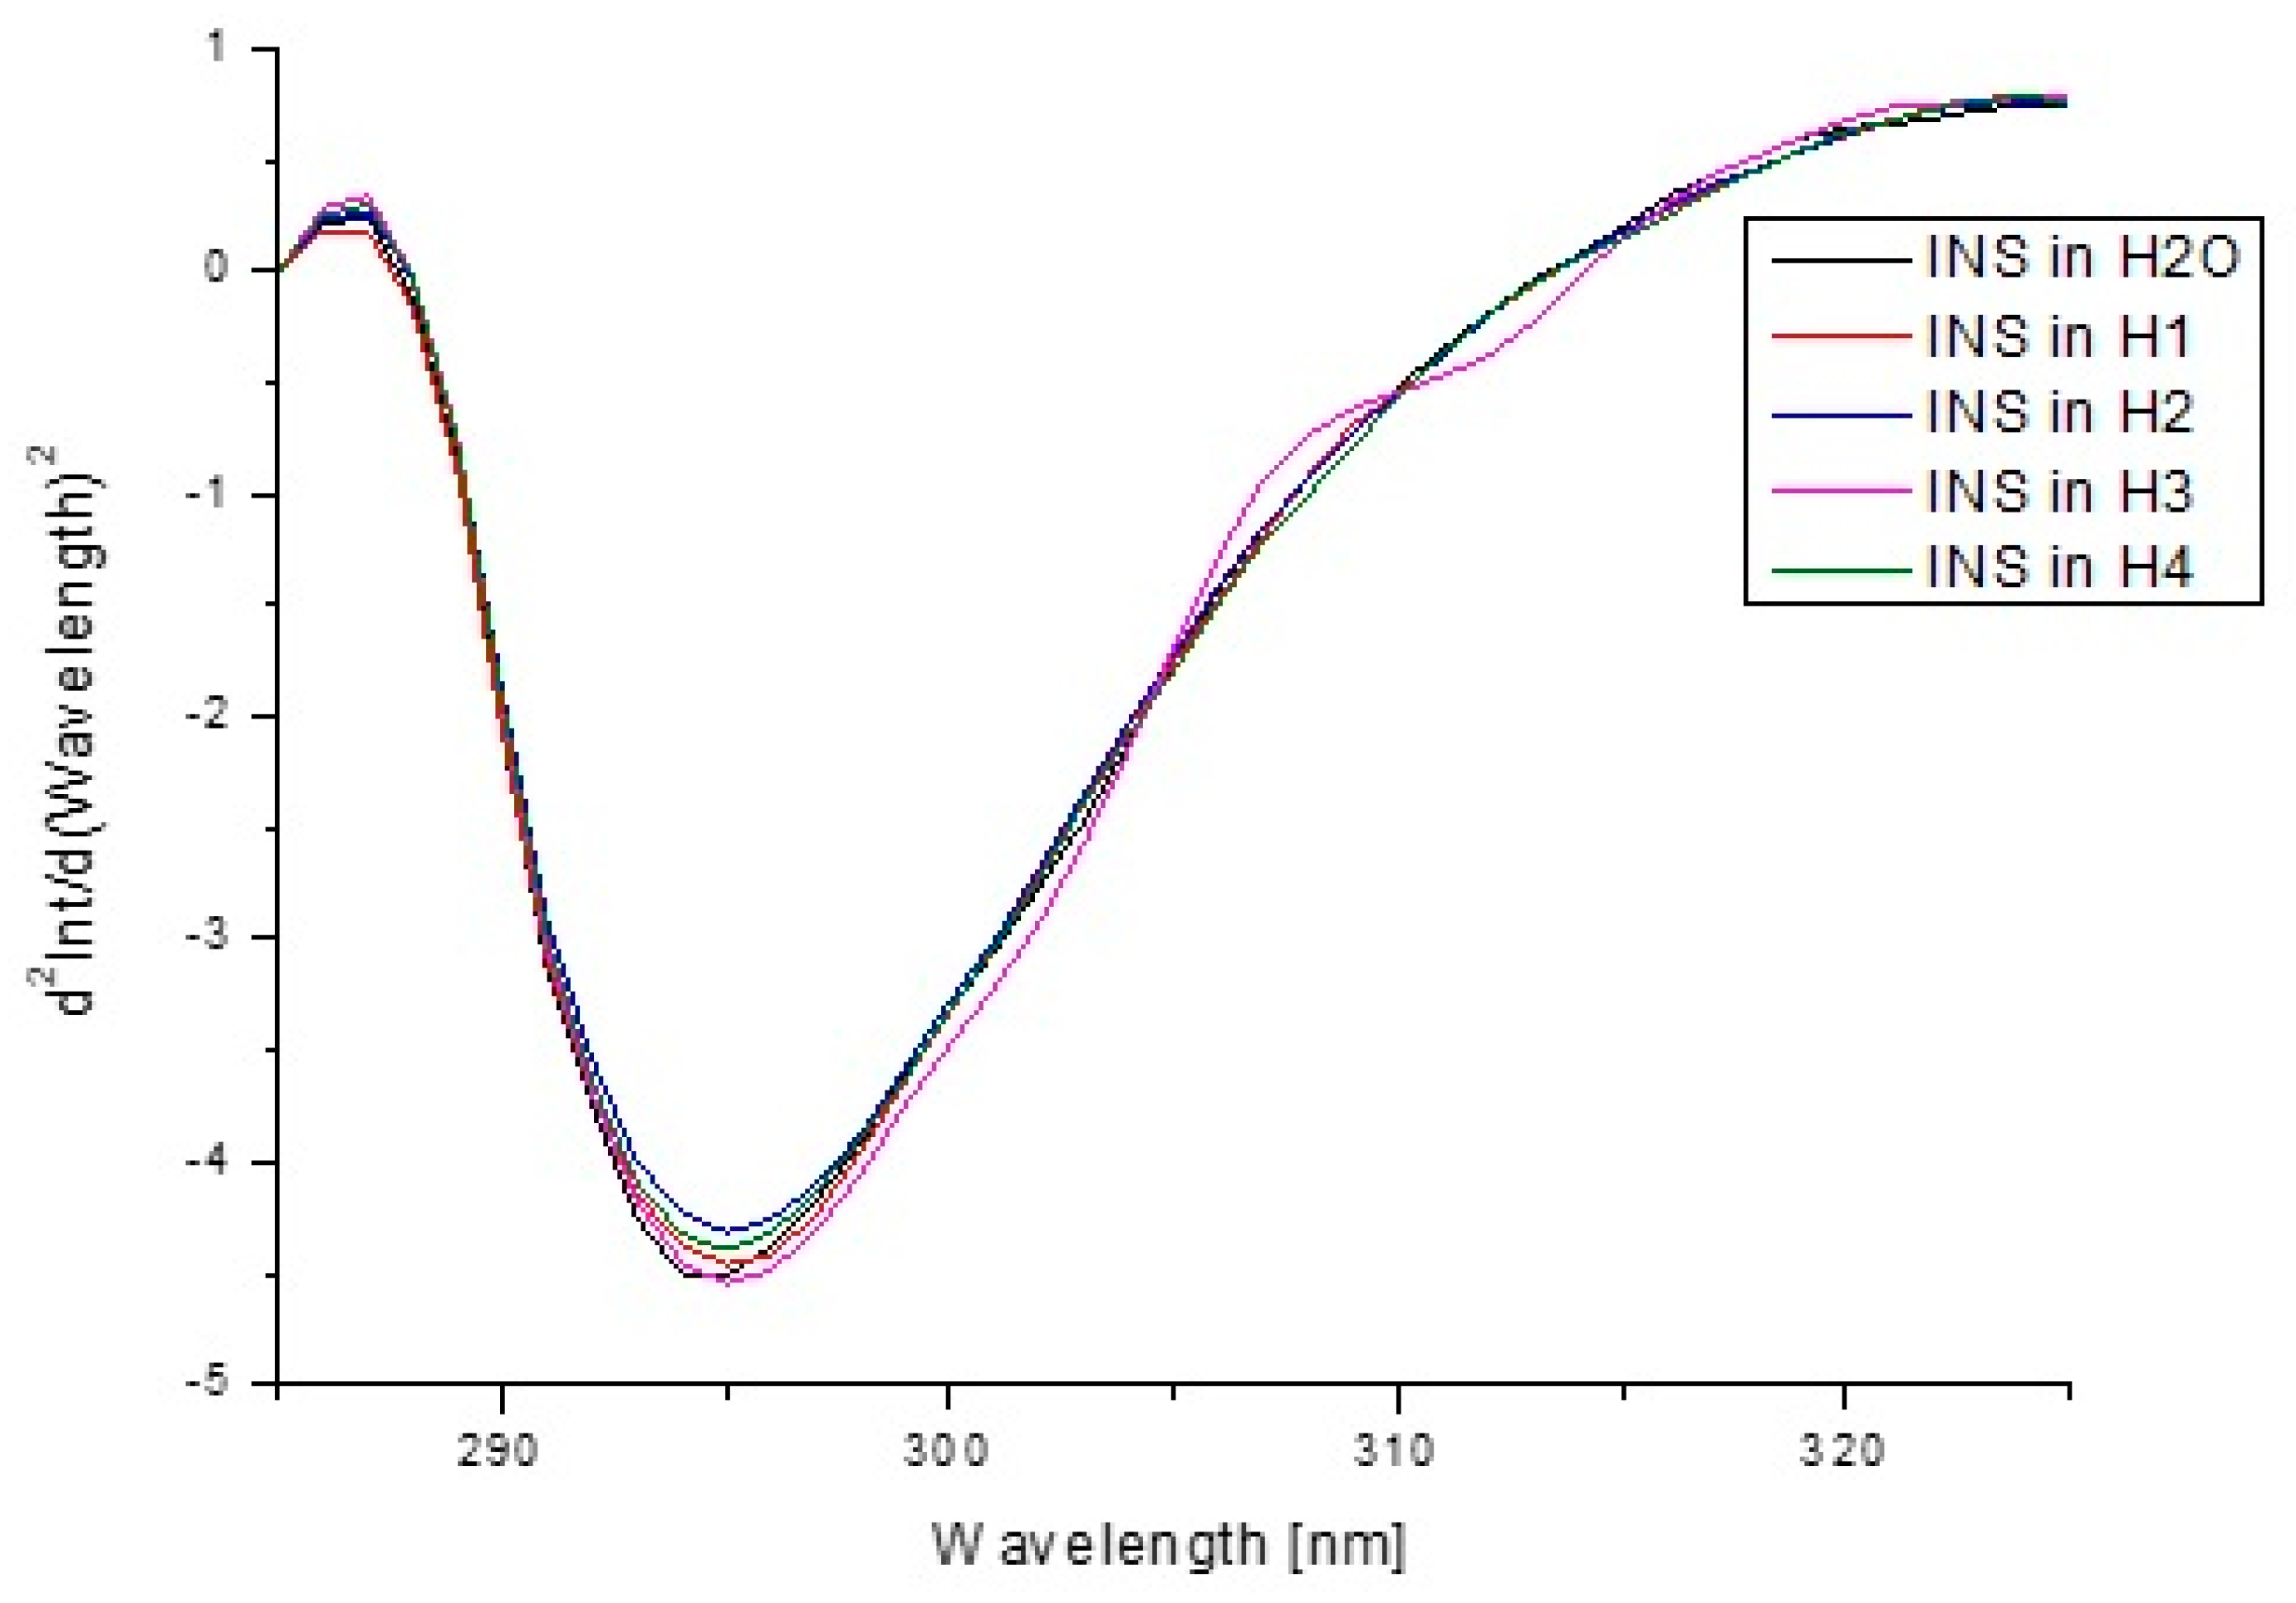
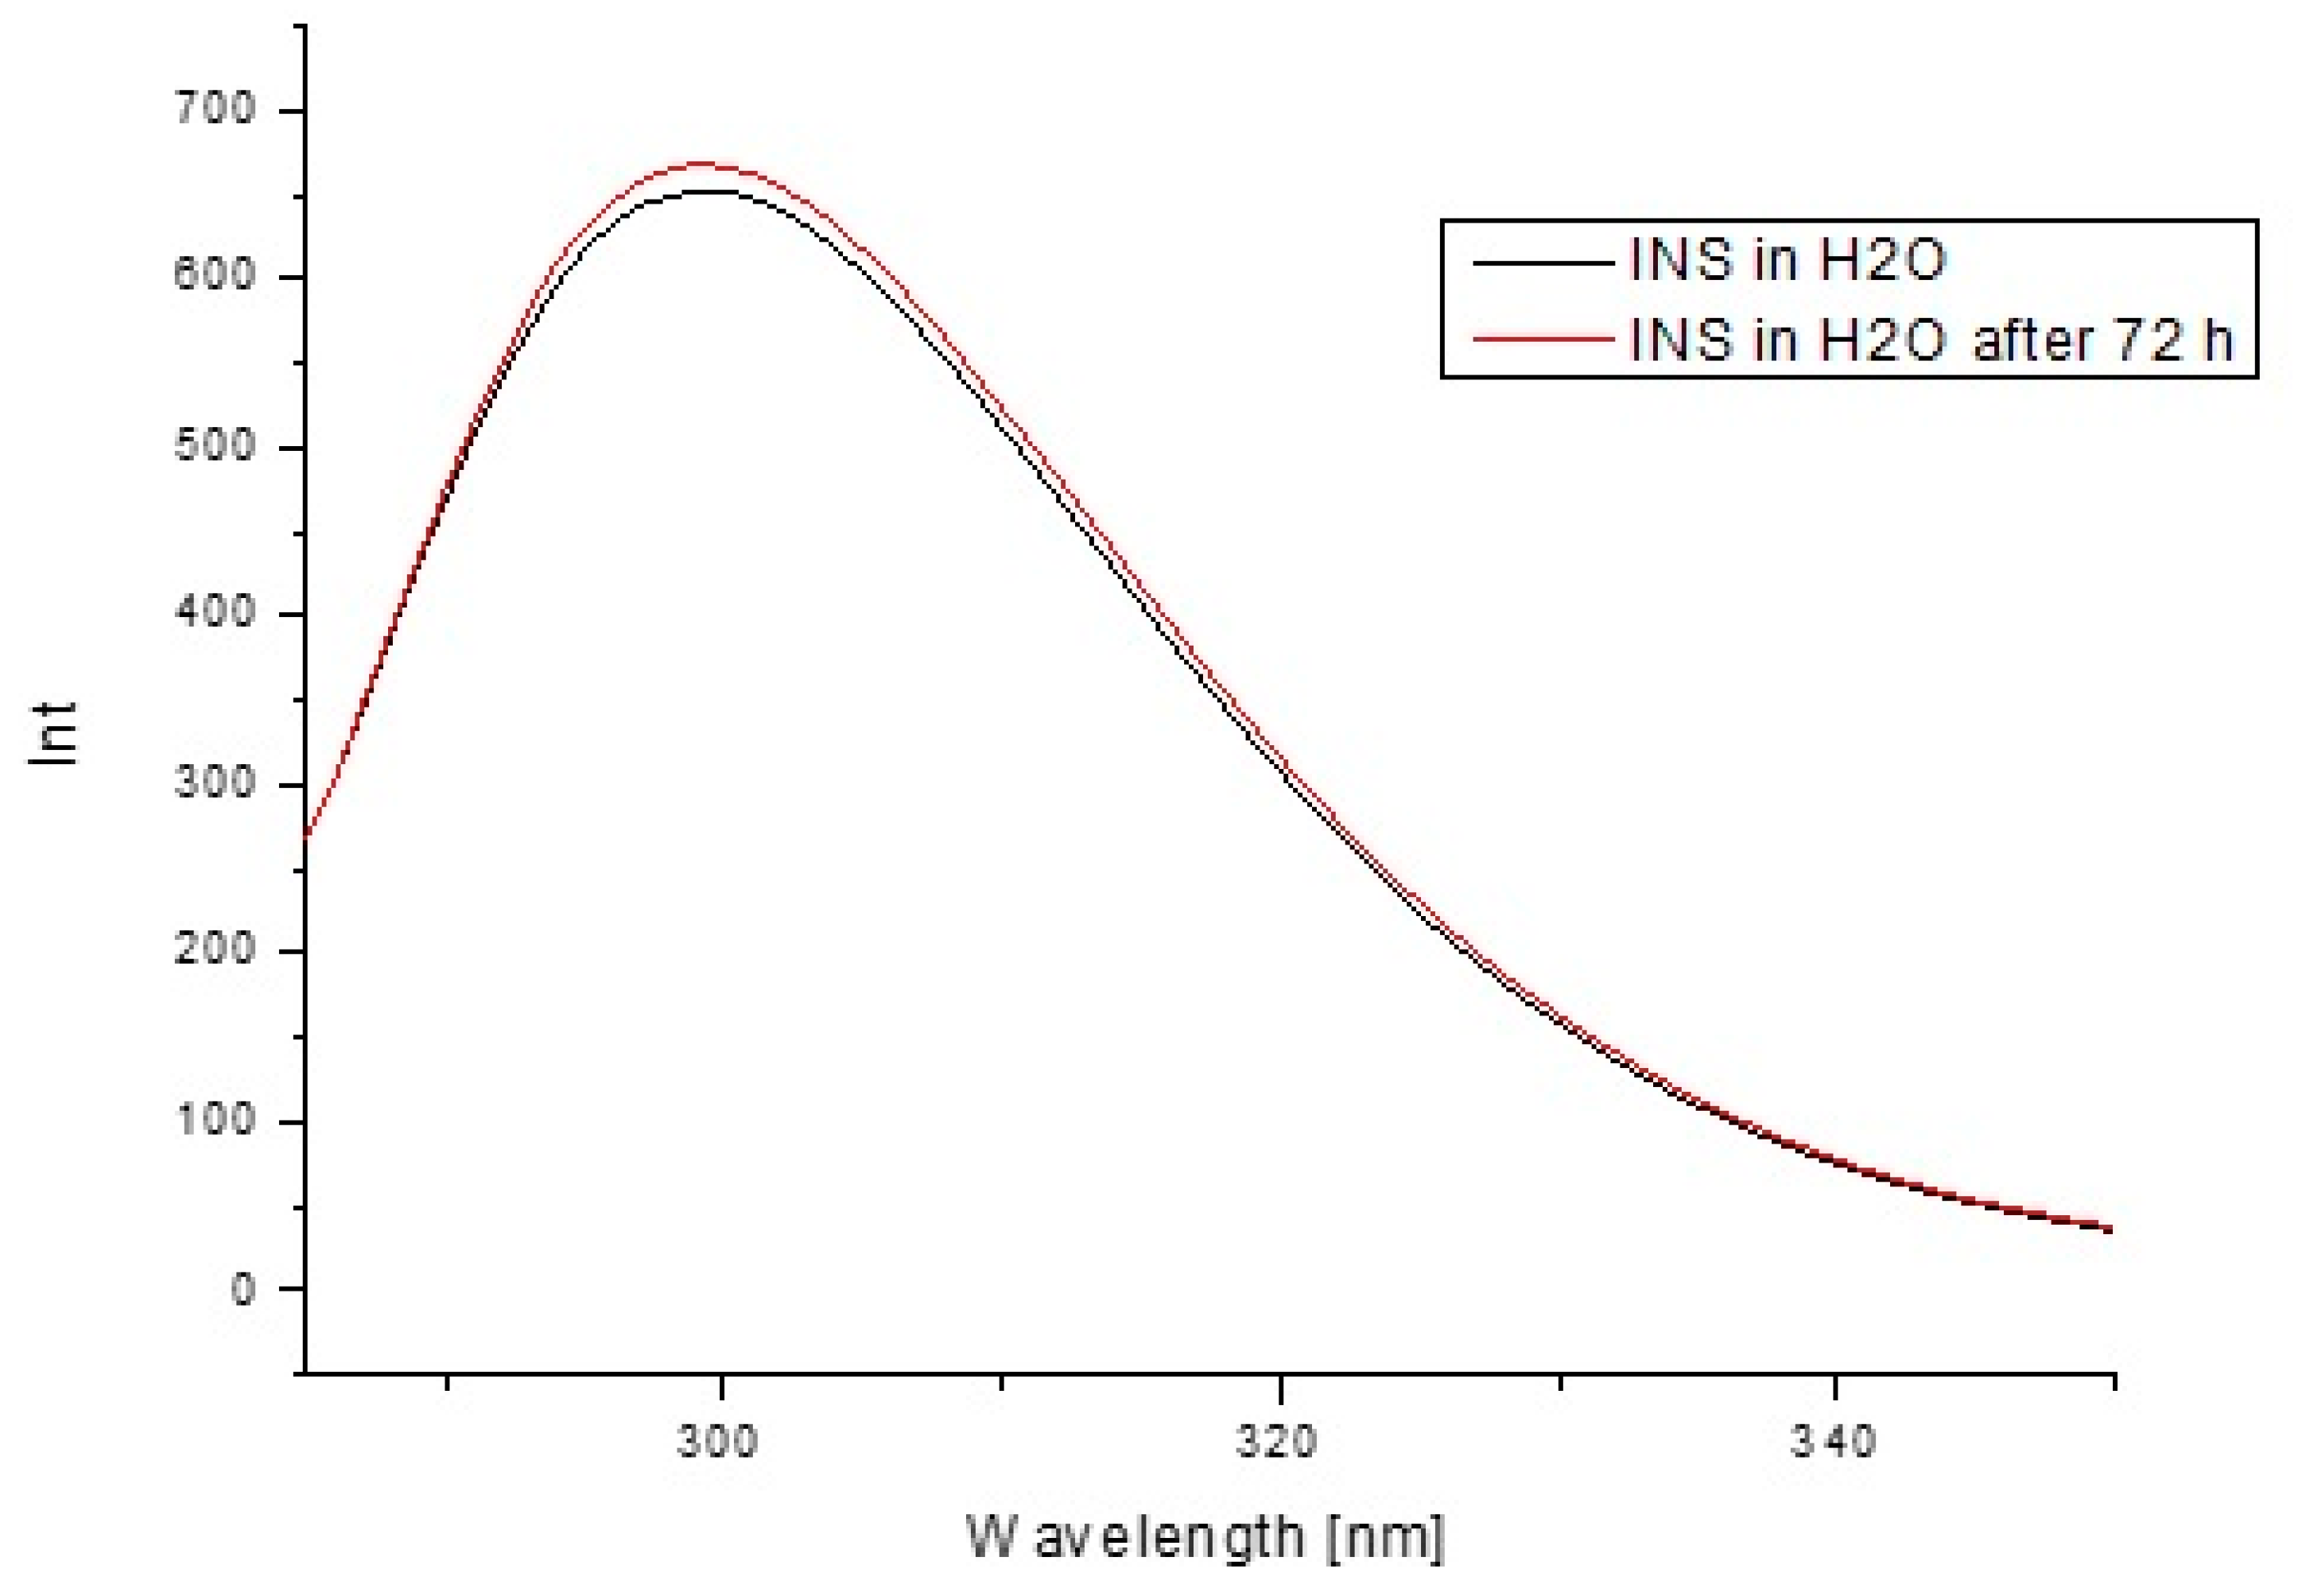
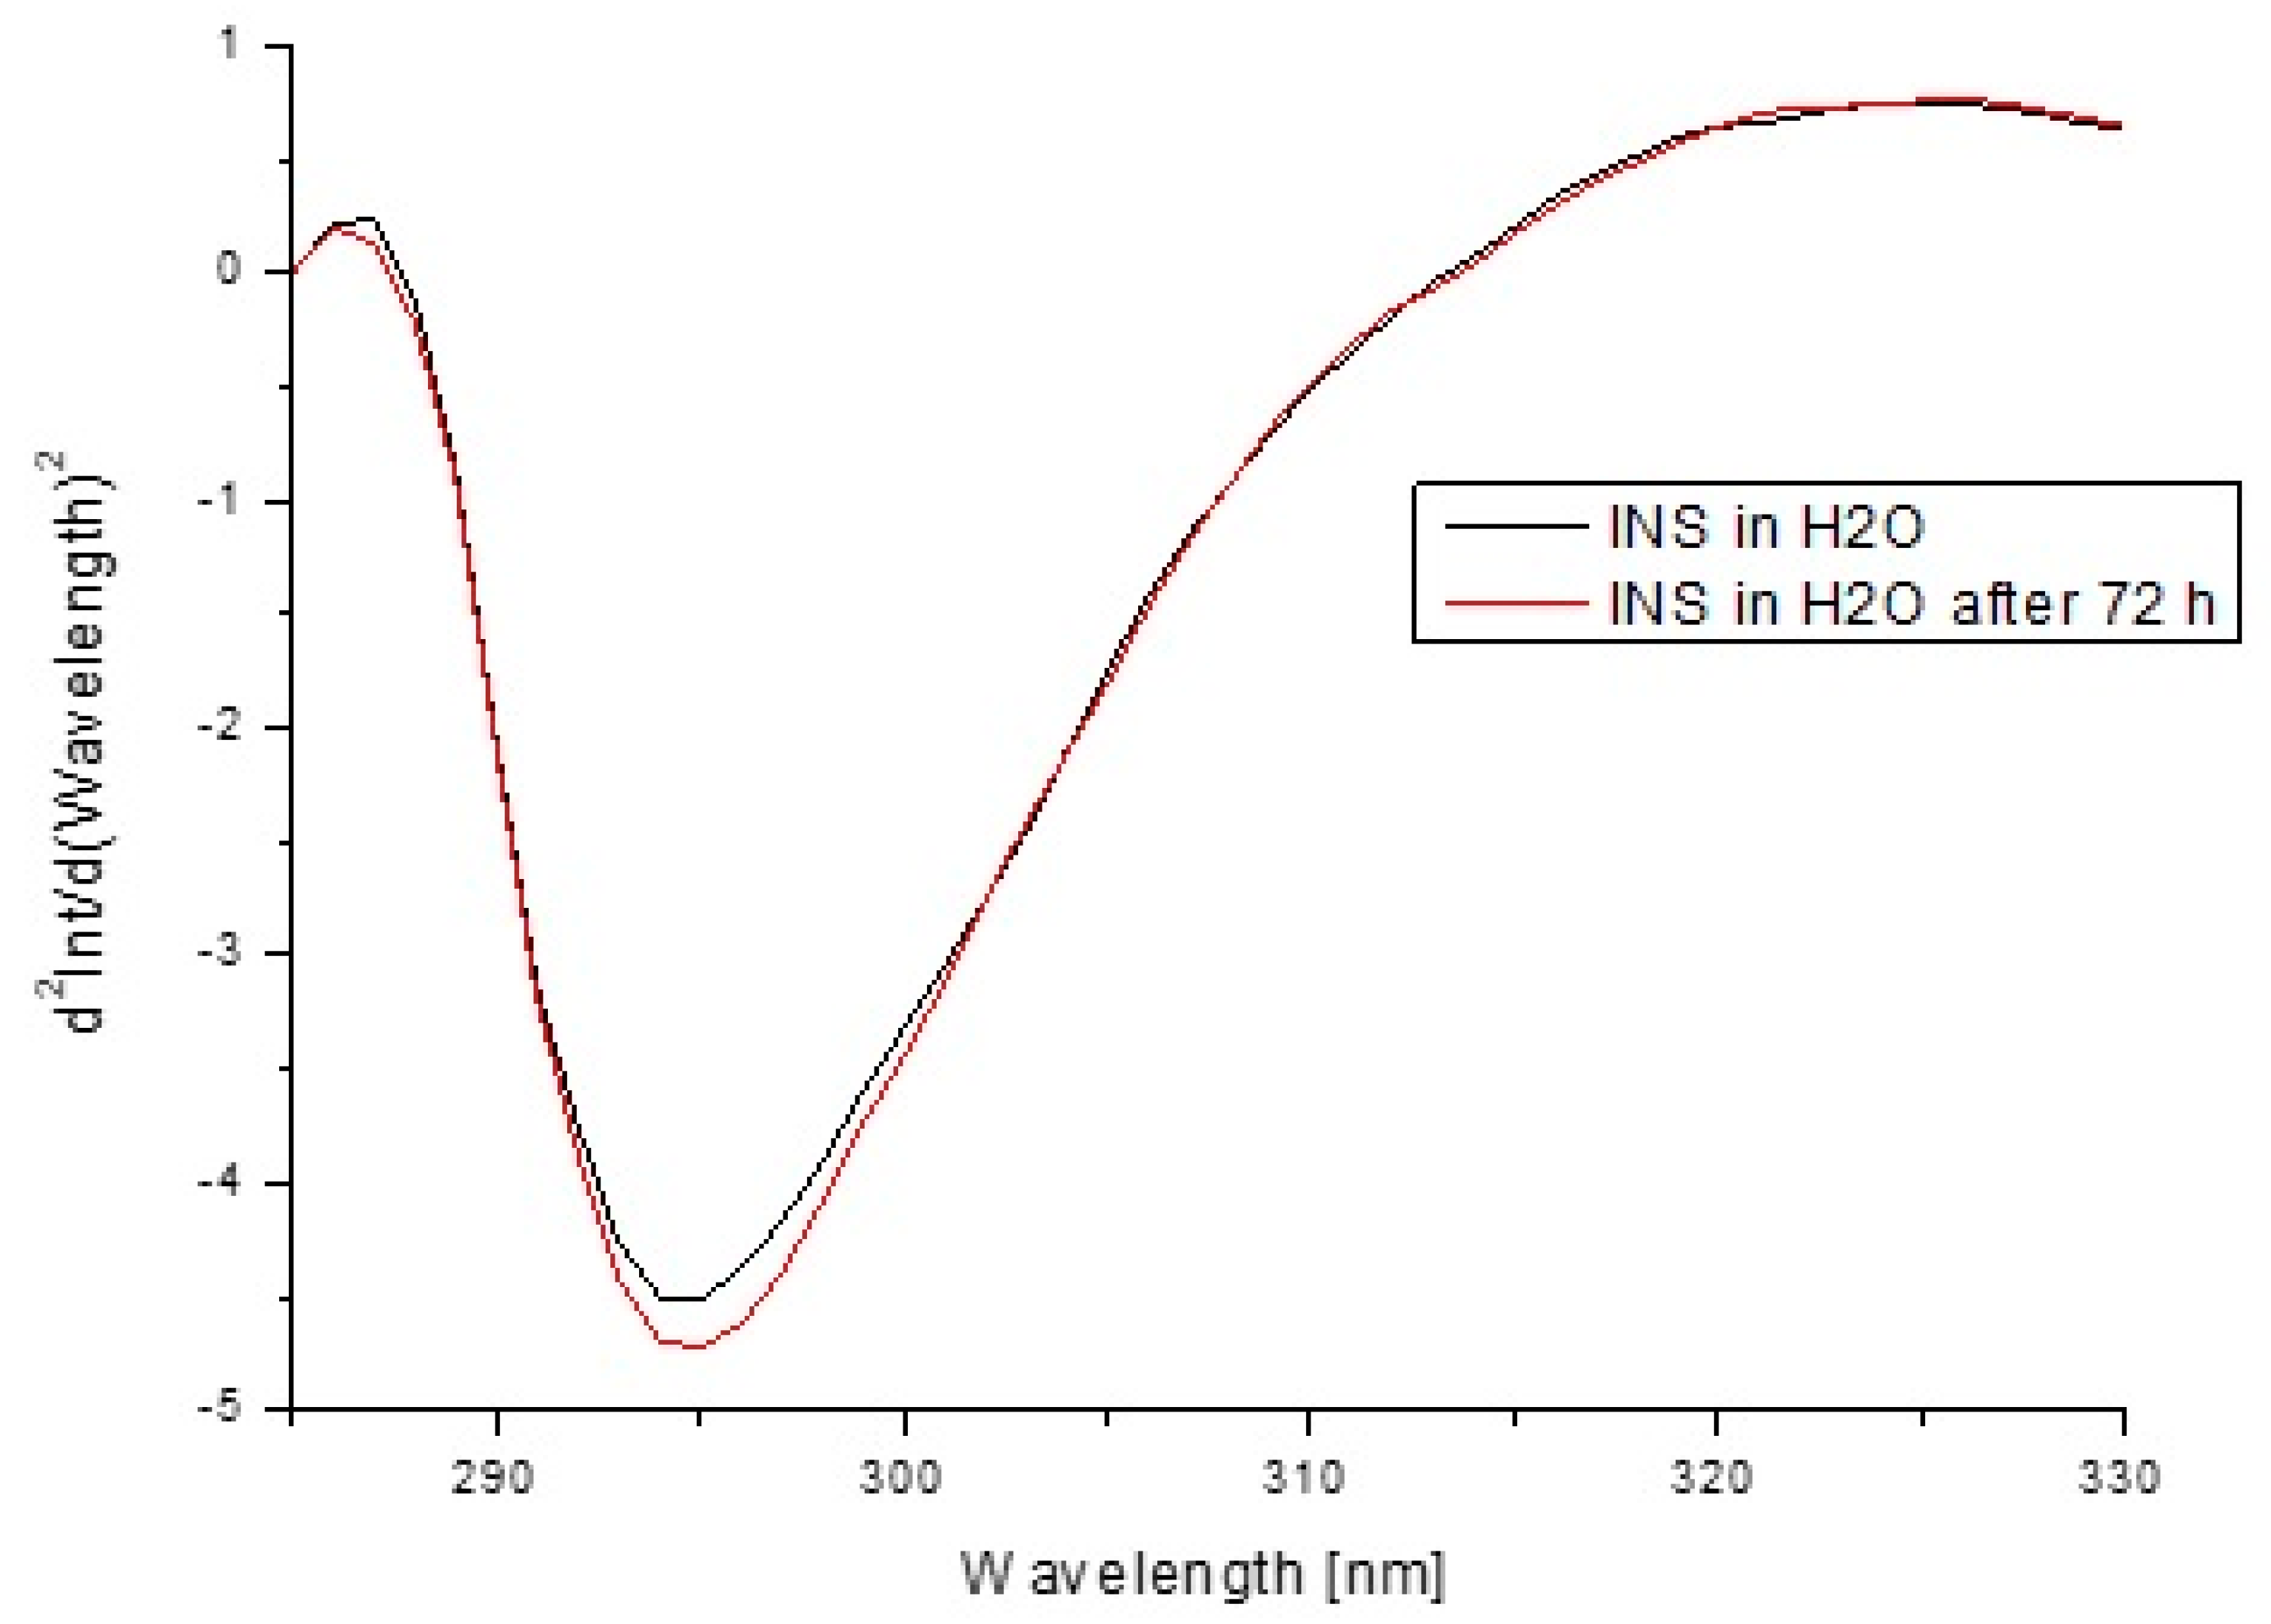
| Form of Insulin | Fluorescence Intensity (Int) at λmax | at λmax (295 nm) | |
|---|---|---|---|
| INS in H2O | 652.175 λmax 300 nm | 0.916 | −4.51215 |
| INS in H1 | 648.642 λmax 299 nm | 0.910 | −4.46256 |
| INS in H2 | 631.685 λmax 299 nm | 0.906 | −4.31653 |
| INS in H3 | 661.318 λmax 299 nm | 0.908 | −4.54568 |
| INS in H4 | 644.559 λmax 299 nm | 0.899 | −4.39367 |
Publisher’s Note: MDPI stays neutral with regard to jurisdictional claims in published maps and institutional affiliations. |
© 2021 by the authors. Licensee MDPI, Basel, Switzerland. This article is an open access article distributed under the terms and conditions of the Creative Commons Attribution (CC BY) license (https://creativecommons.org/licenses/by/4.0/).
Share and Cite
Ostróżka-Cieślik, A.; Maciążek-Jurczyk, M.; Pożycka, J.; Dolińska, B. Pre-Formulation Studies: Physicochemical Characteristics and In Vitro Release Kinetics of Insulin from Selected Hydrogels. Pharmaceutics 2021, 13, 1215. https://doi.org/10.3390/pharmaceutics13081215
Ostróżka-Cieślik A, Maciążek-Jurczyk M, Pożycka J, Dolińska B. Pre-Formulation Studies: Physicochemical Characteristics and In Vitro Release Kinetics of Insulin from Selected Hydrogels. Pharmaceutics. 2021; 13(8):1215. https://doi.org/10.3390/pharmaceutics13081215
Chicago/Turabian StyleOstróżka-Cieślik, Aneta, Małgorzata Maciążek-Jurczyk, Jadwiga Pożycka, and Barbara Dolińska. 2021. "Pre-Formulation Studies: Physicochemical Characteristics and In Vitro Release Kinetics of Insulin from Selected Hydrogels" Pharmaceutics 13, no. 8: 1215. https://doi.org/10.3390/pharmaceutics13081215