
Anticancer Diiron Vinyliminium Complexes: A Structure–Activity Relationship Study

 , , , , , and
Abstract
:
1. Introduction
2. Experimental
2.1. Materials and Methods
2.2. Synthesis and Characterization of Diiron Complexes


2.3. X-ray Crystallography
2.4. Solubility and Stability in Water and Determination of Octanol–Water Partition Coefficients
- (a)
- Solubility in D2O. A suspension of the selected diiron compound (3–5 mg) in a D2O solution (ca. 1 mL) containing Me2SO2 (3.36 × 10⁻³ M) as internal standard [57] was vigorously stirred at 21 °C for 1.5 h. The resulting saturated solution was filtered over celite, transferred into an NMR tube and then analyzed by 1H NMR spectroscopy (delay time = 3 s; number of scans = 20). The concentration (solubility) was calculated by the relative integral (related to Cp and/or NMe signals) with respect to Me2SO2 (δ = 3.14 ppm).
- (b)
- Stability in DMSO-d6/D2O solution. The selected diiron compound (ca. 4 mg) was added of 1 mL of D2O (3a,c) or DMSO-d6/D2O (2:1 v/v) mixture (2a,c, 3b, 4a–c, 5a–c, 6a–c, 7), containing Me2SO2 (3.36 × 10⁻³ M). The resulting mixture was stirred for 30 min and then filtered over celite; the filtrated solution was transferred into an NMR tube. The sample was analyzed by 1H NMR (time = 0) and then heated at 37 °C for 72 h. After cooling to room temperature, the solution was separated from a small amount of solid by filtration over celite, and the new 1H NMR spectrum was recorded (delay time = 3 s; number of scans = 20). In every case, no newly formed organometallic species was detected. The amount of starting material in solution (% with respect to the initial spectrum) was calculated by the relative integral (vs. Cp and/or NMe signals) with respect to Me2SO2 as internal standard. Data related to the spectra recorded at time = 0 are reported in the following.
- (c)
- Octanol–water partition coefficients (Log Pow). Partition coefficients (Pow; IUPAC: KD partition constant [58]), defined as Pow = corg/caq, where corg and caq are molar concentrations of the selected compound in the organic and aqueous phase, respectively, were determined by the shake-flask method and UV–Vis measurements [36,59,60]. Deionized water and 1-octanol were vigorously stirred for 24 h to enable saturation of both phases, then separated by centrifugation. A stock solution of the selected diiron compound (ca. 2 mg; 2a–c, 3b, 4a–c, 5a, 5c, 6b,c, 7) was prepared by first adding acetone (50 μL, to help solubilization), followed by water-saturated octanol (2.5 mL). The solution was diluted with water-saturated octanol (ca. 1:3 v/v ratio, cFe2 ≈ 10−4 M, so that 1.5 ≤ A ≤ 2.0 at λmax) and the UV–Vis spectrum was recorded (A0org). An aliquot of the solution (Vorg = 1.2 mL) was transferred into a test tube and octanol-saturated water (Vorg = Vaq = 1.2 mL) was added. The mixture was vigorously stirred for 15 min at 21 °C and then centrifuged (5000 rpm, 10 min). The UV–Vis spectrum of the organic phase was recorded (Aforg) and the partition coefficient was calculated as Pow = Aforg/(A0org − Aforg), where A0org and Aforg are the absorbance in the organic phase before and after partition with the aqueous phase, respectively [59]. An inverse procedure was followed for 3a, 3c, 5b and 6a, starting from a solution of the compound in octanol-saturated water. The partition coefficient was calculated as Pow = (A0aq − Afaq)/Afaq where A0aq and Afaq are the absorbance in the aqueous phase before and after partition with the organic phase, respectively. The wavelength of the maximum absorption of each compound (ca. 300 nm) was used for UV–Vis quantitation. The procedure was repeated three times for each sample (from the same stock solution); results are given as mean ± standard deviation. Naphthoquinone was used as a reference compound (Log P = 1.8 ± 0.2; literature [61]: 1.71).
2.5. Cell Culture and Cytotoxicity Studies
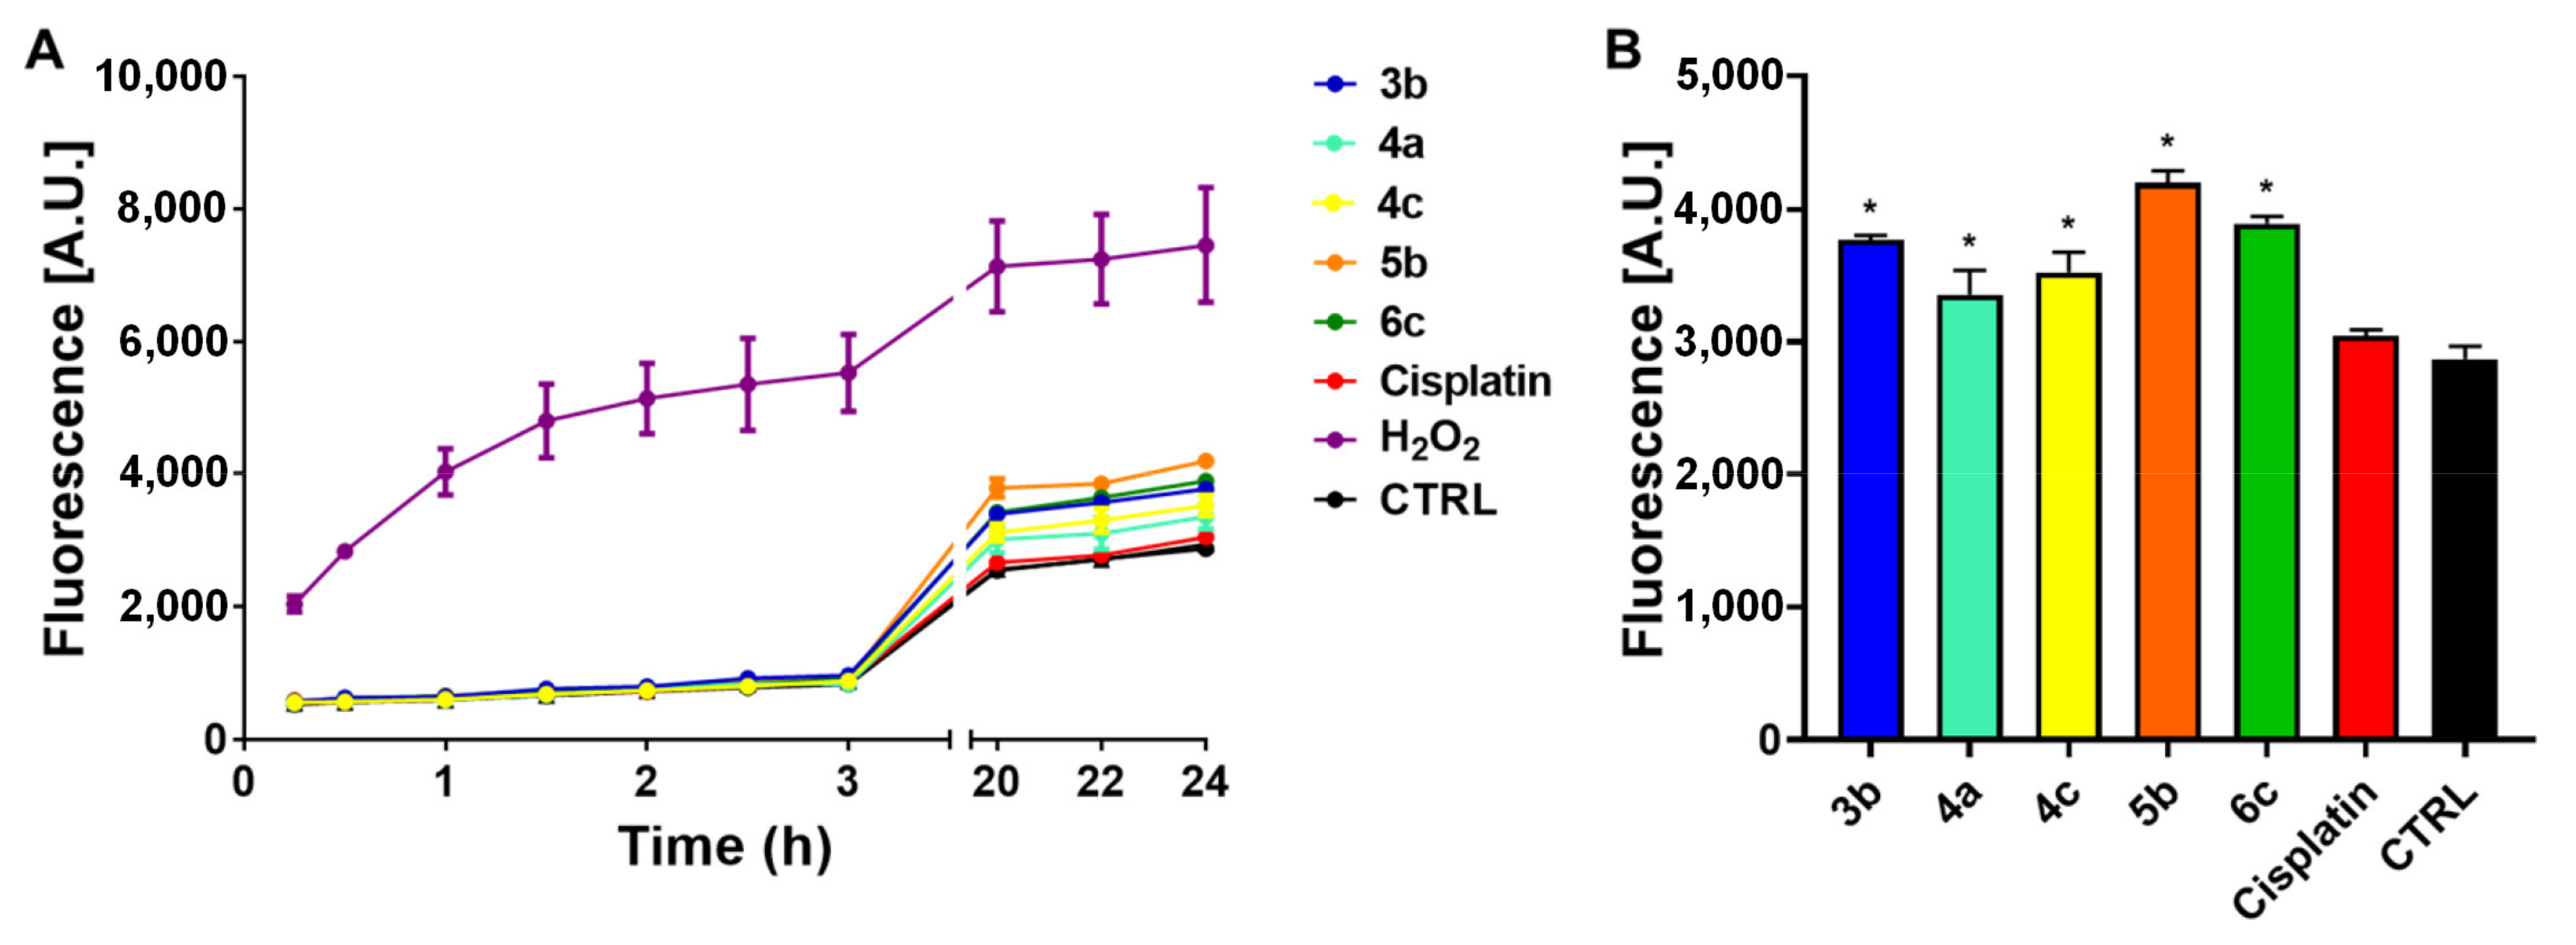
2.6. ROS Determination
2.7. Biomolecules Binding Studies
- (a)
- Sample preparation. Cytochrome c (Cyt c) was commercially available and used as received; the TrxR dodecapeptide (TrxR-pept) was synthesized as reported in the literature [63,64]. The stock solutions of the selected iron-based complexes were prepared in DMSO up to a final concentration of 10−2 M. The stock solution of TrxR-pept was prepared in LC-MS grade water by dissolving the required amount of lyophilized peptide to reach a final concentration of 10−3 M. The stock solution of Cyt c 10−3 M was prepared by dissolving the required amount of protein in 2 mM ammonium acetate solution at pH 6.8. In the interaction tests with TrxR-pept, opportune aliquots of each complex and TrxR-pept stock solutions were mixed and diluted with LC-MS grade water to 10−4 M final concentration and a TrxR-pept/complex ratio of 1:1. For each iron-based complex/Cyt c pair, appropriate aliquots of the respective stock solutions were mixed and subsequently diluted with 2 mM ammonium acetate solution (pH 6.8) to a final protein concentration of 10−4 M and a protein-to-metal molar ratio of 1:2. All the sample mixtures were incubated for 24 h at 37 °C. Subsequently, opportune dilutions were performed as detailed:
- –
- the TrxR-pept containing solutions were further diluted with LC-MS grade water to a final TrxR-pept concentration of 10−5 M and added with 0.1% v/v of formic acid just before infusion in the mass spectrometer;
- –
- the protein-containing solutions were diluted with 2 mM ammonium acetate solution (pH 6.8) to a final protein concentration of 10−6 M and added with 0.1% v/v of formic acid just before infusion.
- (b)
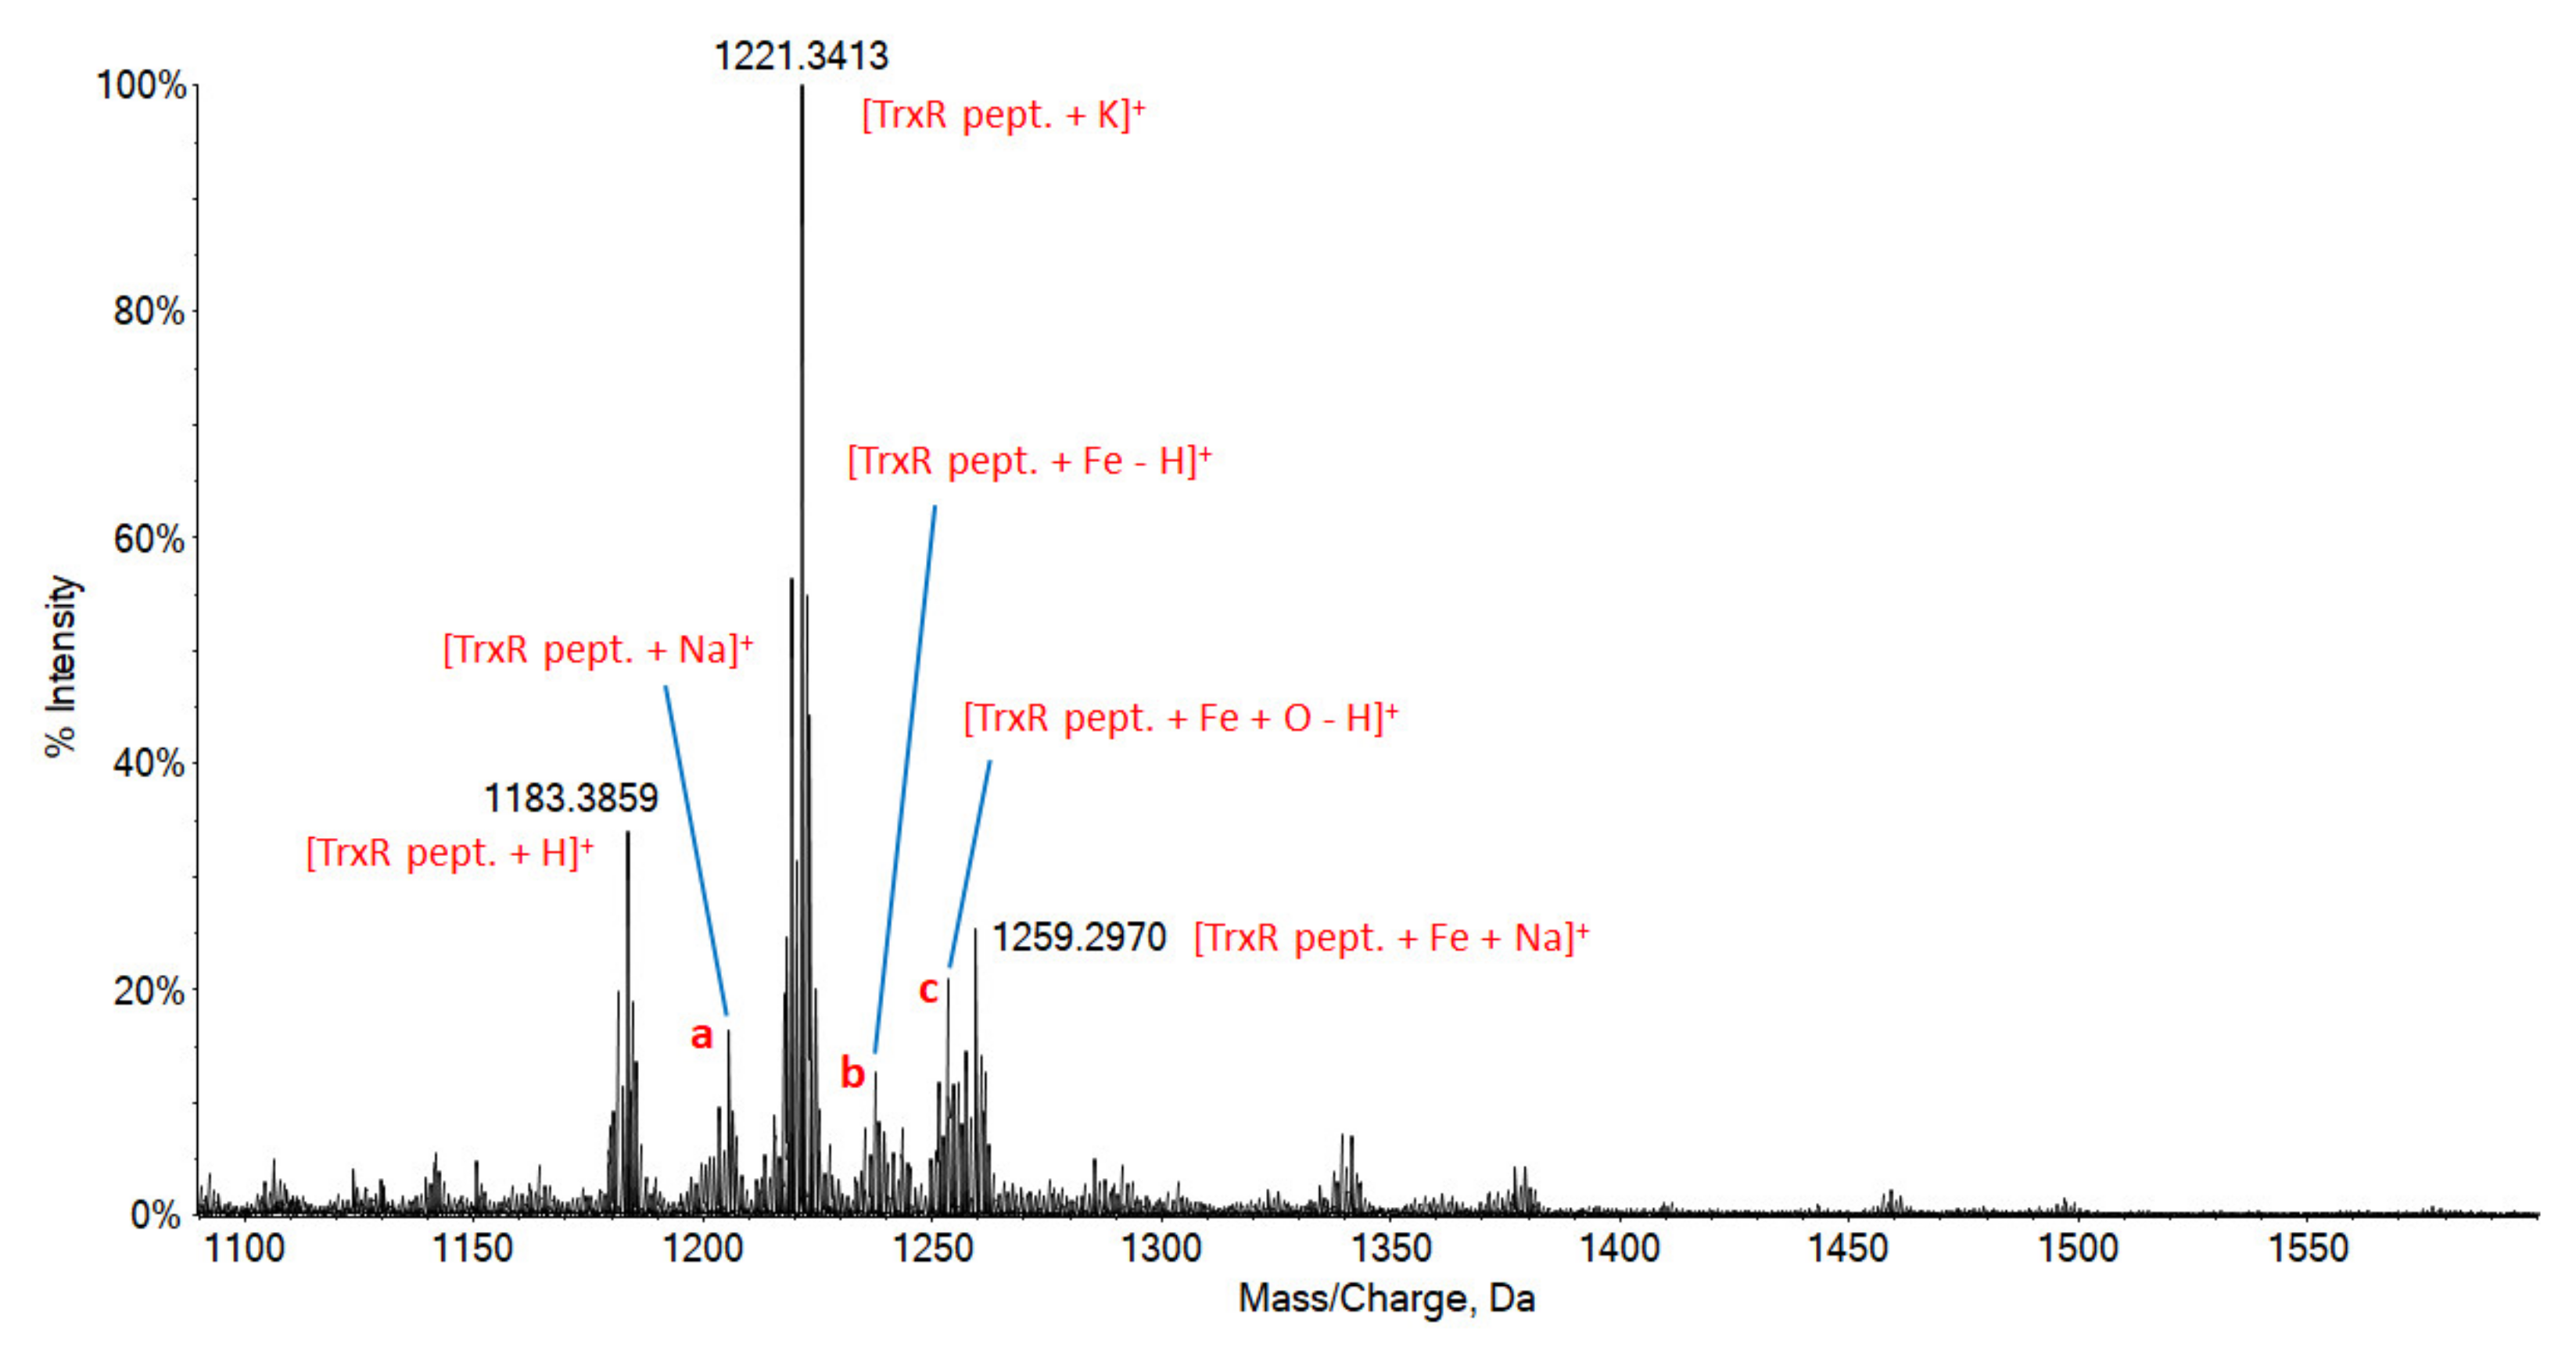
- ESI-MS instrumental parameters. The ESI mass spectra were acquired using a TripleTOF® 5600+ high-resolution mass spectrometer (Sciex, Framingham, MA, USA), with a DuoSpray® interface operating with an ESI probe. Respective ESI mass spectra were acquired through direct infusion at 7 μL min−1 flow rate. The ESI source parameters were optimized for each biomolecule and were as follows: for TrxR dodecapeptide positive polarity, ionspray voltage floating 5500 V, temperature 0, ion source gas 1 (GS1) 35 L min−1; ion source gas 2 (GS2) 0; curtain gas (CUR) 20 L min−1, declustering potential (DP) 300 V, collision energy (CE) 10 V, range 1070–1600 m/z; for Cyt c positive polarity, ionspray voltage floating 5500 V, temperature 0, ion source gas 1 (GS1) 35 L min−1; ion source gas 2 (GS2) 0; curtain gas (CUR) 20 L min−1, declustering potential (DP) 180 V, collision energy (CE) 10 V, range 500–1800 m/z. For acquisition, Analyst TF software 1.7.1 (Sciex, Framingham, MA, USA) was used and deconvoluted spectra were obtained by using the Bio Tool Kit micro-application v.2.2 embedded in PeakViewTM software v.2.2 (Sciex, Framingham, MA, USA).
3. Results and Discussion
3.1. Synthesis and Structural Characterization of Diiron Complexes
3.2. Solubility and Stability in Water and Determination of Octanol–Water Partition Coefficients
3.3. Cytotoxicity
3.4. ROS Production
3.5. Protein Binding Studies
4. Conclusions
Supplementary Materials
Author Contributions
Funding
Institutional Review Board Statement
Informed Consent Statement
Data Availability Statement
Acknowledgments
Conflicts of Interest
References and Notes
- Gibson, D. Platinum(IV) anticancer agents; are we en route to the holy grail or to a dead end? J. Inorg. Biochem. 2021, 217, 111353. [Google Scholar] [CrossRef]
- Johnstone, T.C.; Suntharalingam, K.; Lippard, S.J. The Next Generation of Platinum Drugs: Targeted Pt(II) Agents, Nanoparticle Delivery, and Pt(IV) Prodrugs. Chem. Rev. 2016, 116, 3436–3486. [Google Scholar] [CrossRef] [Green Version]
- Murray, B.S.; Dyson, P.J. Recent progress in the development of organometallics for the treatment of cancer. Curr. Opin. Chem. Biol. 2020, 56, 28–34. [Google Scholar] [CrossRef] [PubMed]
- Chellan, P.; Sadler, P.J. Enhancing the Activity of Drugs by Conjugation to Organometallic Fragments. Chem. Eur. J. 2020, 26, 8676–8688. [Google Scholar] [CrossRef] [PubMed]
- Štarha, P.; Trávníček, Z. Non-platinum complexes containing releasable biologically active ligands. Coord. Chem. Rev. 2019, 395, 130–145. [Google Scholar] [CrossRef]
- Bratsos, I.; Gianferrara, T.; Alessio, E.; Hartinger, C.G.; Jakupec, M.A.; Keppler, B.K. Ruthenium and Other Non-Platinum Anticancer Compounds. In Bioinorganic Medicinal Chemistry; Alessio, E., Ed.; Wiley-VCH: Weinheim, Germany, 2011; pp. 151–174. [Google Scholar]
- Boros, E.; Dyson, P.J.; Gasser, G. Classification of Metal-Based Drugs according to Their Mechanisms of Action. Chem 2020, 6, 41–60. [Google Scholar] [CrossRef]
- Anthony, E.J.; Bolitho, E.M.; Bridgewater, H.E.; Carter, O.W.L.; Donnelly, J.M.; Imberti, C.; Lant, E.C.; Lermyte, F.; Needham, R.J.; Palau, M.; et al. Metallodrugs are unique: Opportunities and challenges of discovery and development. Chem. Sci. 2020, 11, 12888–12917. [Google Scholar] [CrossRef]
- Haas, K.L.; Franz, K.J. Application of Metal Coordination Chemistry To Explore and Manipulate Cell Biology. Chem. Rev. 2009, 109, 4921–4960. [Google Scholar] [CrossRef] [Green Version]
- Riddell, I.A.; Lippard, S.J. Cisplatin and Oxaliplatin: Our Current Understanding of Their Actions. Met. Ions Life Sci. 2018, 18, 1–42. [Google Scholar]
- Yu, C.; Wang, Z.; Sun, Z.; Zhang, L.; Zhang, W.; Xu, Y.; Zhang, J.-J. Platinum-Based Combination Therapy: Molecular Rationale, Current Clinical Uses, and Future Perspectives. J. Med. Chem. 2020, 63, 13397–13412. [Google Scholar] [CrossRef] [PubMed]
- Green, A.J.; Planchart, A. The neurological toxicity of heavy metals: A fish perspective. CBPC 2018, 208, 12–19. [Google Scholar] [CrossRef] [PubMed]
- Campbell, J.M.; Bateman, E.; Peters, M.D.J.; Bowen, J.M.; Keefe, D.M.; Stephenson, M.D. Fluoropyrimidine and platinum toxicity pharmacogenetics: An umbrella review of systematic reviews and meta-analyses. Pharmacogenomics 2016, 17, 435–451. [Google Scholar] [CrossRef] [PubMed]
- Oun, R.; Moussa, Y.E.; Wheate, N.J. The side effects of platinum-based chemotherapy drugs: A review for chemists. Dalton Trans. 2018, 47, 6645–6653. [Google Scholar] [CrossRef] [PubMed]
- Siddik, Z.H. Cisplatin: Mode of cytotoxic action and molecular basis of resistance. Oncogene 2003, 22, 7265–7279. [Google Scholar] [CrossRef] [Green Version]
- Goldstein, R.S.; Mayor, G.H. Minireview. The nephrotoxicity of cisplatin. Life Sci. 1983, 32, 685–690. [Google Scholar] [CrossRef]
- Sanchez, M.; Sabio, L.; Galvez, N.; Capdevila, M.; Dominguez-Vera, J.M. Iron chemistry at the service of life. IUBMB Life 2017, 69, 382–388. [Google Scholar] [CrossRef] [Green Version]
- Crichton, R. Iron Metabolism-From Molecular Mechanisms to Clinical Consequences, 4th ed.Wiley: Hoboken, NJ, USA, 2016. [Google Scholar]
- Wani, W.A.; Baig, U.; Shreaz, S.; Shiekh, R.A.; Iqbal, P.F.; Jameel, E.; Ahmad, A.; Mohd-Setapar, S.H.; Mushtaque, M.; Hun, L.T. Recent advances in iron complexes as potential anticancer agents. New J. Chem. 2016, 40, 1063–1090. [Google Scholar] [CrossRef]
- Basu, U.; Roy, M.; Chakravarty, A.R. Recent advances in the chemistry of iron-based chemotherapeutic agents. Coord. Chem. Rev. 2020, 417, 213339. [Google Scholar] [CrossRef]
- Simenel, A.A.; Morozova, E.A.; Snegur, L.V.; Zykova, S.I.; Kachala, V.V.; Ostrovskaya, L.A.; Bluchterova, N.V.; Fomina, M.M. Simple route to ferrocenylalkyl nucleobases. Antitumor activity in vivo. Appl. Organomet. Chem. 2009, 23, 219–224. [Google Scholar] [CrossRef]
- Simenel, A.A.; Samarina, S.V.; Snegur, L.V.; Starikova, Z.A.; Ostrovskaya, L.A.; Bluchterova, N.V.; Fomina, M.M. o-Carboxybenzoylferrocene. Bioactivity and chemical Modifications. Appl. Organomet. Chem. 2008, 22, 276–280. [Google Scholar] [CrossRef]
- Wani, W.A.; Jameel, E.; Baig, U.; Mumtazuddin, S.; Hun, L.T. Ferroquine and its derivatives: New generation of antimalarial agents. Eur. J. Med. Chem. 2015, 101, 534–551. [Google Scholar] [CrossRef] [PubMed]
- Peter, S.; Aderibigbe, B.A. Ferrocene-based compounds with antimalaria/anticancer activity. Molecules 2019, 24, 3604. [Google Scholar] [CrossRef] [Green Version]
- Patra, M.; Gasser, G. The medicinal chemistry of ferrocene and its derivatives. Nat. Chem. Rev. 2017, 1, 0066. [Google Scholar] [CrossRef]
- Sansook, S.; Hassell-Hart, S.; Ocasio, C.; Spencer, J. Ferrocenes in medicinal chemistry; a personal perspective. J. Organomet. Chem. 2020, 905, 121017. [Google Scholar] [CrossRef]
- Braga, S.S.; Silva, A.M.S. A New Age for Iron: Antitumoral Ferrocenes. Organometallics 2013, 32, 5626–5639. [Google Scholar] [CrossRef]
- Jaouen, G.; Vessieres, A.; Top, S. Ferrocifen type anti cancer drugs. Chem. Soc. Rev. 2015, 44, 8802–8817. [Google Scholar] [CrossRef] [Green Version]
- Wang, Y.; Dansette, P.M.; Pigeon, P.; Top, S.; McGlinchey, M.J.; Mansuy, D.; Jaouen, G. A new generation of ferrociphenols leads to a great diversity of reactive metabolites, and exhibits remarkable antiproliferative properties. Chem. Sci. 2018, 9, 70–78. [Google Scholar] [CrossRef] [PubMed] [Green Version]
- Gibson, D. The mechanism of action of platinum anticancer agents—What do we really know about it? Dalton Trans. 2009, 10681–10689. [Google Scholar] [CrossRef]
- Marchetti, F. Constructing Organometallic Architectures from Aminoalkylidyne Diiron Complexes. Eur. J. Inorg. Chem. 2018, 3987–4003. [Google Scholar] [CrossRef] [Green Version]
- Busetto, L.; Marchetti, F.; Mazzoni, R.; Salmi, M.; Zacchini, S.; Zanotti, V. [3+2+1] cycloaddition involving alkynes, CO and bridging vinyliminium ligands in diiron complexes: A dinuclear version of the Dötz reaction? Chem. Commun. 2010, 46, 3327–3329. [Google Scholar] [CrossRef]
- Marchetti, F.; Zacchini, S.; Zanotti, V. Photochemical Alkyne Insertions into the Iron − Thiocarbonyl Bond of [Fe2(CS)(CO)3(Cp)2]. Organometallics 2016, 35, 2630–2637. [Google Scholar] [CrossRef]
- Marchetti, F.; Zacchini, S.; Zanotti, V. Carbon monoxide–isocyanide coupling promoted by acetylide addition to a diiron complex. Chem. Commun. 2015, 51, 8101–8104. [Google Scholar] [CrossRef] [PubMed]
- Boni, A.; Funaioli, T.; Marchetti, F.; Pampaloni, G.; Pinzino, C.; Zacchini, S. Reversible Reductive Dimerization of Diiron μ-Vinyl Complex via C-C Coupling: Characterization and Reactivity of the Intermediate Radical Species. Organometallics 2011, 30, 4115–4122. [Google Scholar] [CrossRef]
- Agonigi, G.; Biancalana, L.; Lupo, M.G.; Montopoli, M.; Ferri, N.; Zacchini, S.; Binacchi, F.; Biver, T.; Campanella, B.; Pampaloni, G.; et al. Exploring the Anticancer Potential of Diiron Bis-cyclopentadienyl Complexes with Bridging Hydrocarbyl Ligands: Behavior in Aqueous Media and In Vitro Cytotoxicity. Organometallics 2020, 39, 645–657. [Google Scholar] [CrossRef]
- Biancalana, L.; De Franco, M.; Ciancaleoni, G.; Zacchini, S.; Pampaloni, G.; Gandin, V.; Marchetti, F. Easily Available and Amphiphilic Diiron Cyclopentadienyl Complexes Exhibit In Vitro Anticancer Activity in 2D and 3D Human Cancer Cells via Redox Modulation Triggered by CO Release. Chem. Eur. J. 2021, 27, 10169–10185. [Google Scholar] [CrossRef]
- Schoch, S.; Batchelor, L.K.; Funaioli, T.; Ciancaleoni, G.; Zacchini, S.; Braccini, S.; Chiellini, F.; Biver, T.; Pampaloni, G.; Dyson, P.J.; et al. Diiron Complexes with a Bridging Functionalized Allylidene Ligand: Synthesis, Structural Aspects, and Cytotoxicity. Organometallics 2020, 39, 361–373. [Google Scholar] [CrossRef]
- Rocco, D.; Batchelor, L.K.; Agonigi, G.; Braccini, S.; Chiellini, F.; Schoch, S.; Biver, T.; Funaioli, T.; Zacchini, S.; Biancalana, L.; et al. Anticancer Potential of Diiron Vinyliminium Complexes. Chem. Eur. J. 2019, 25, 14801–14816. [Google Scholar] [CrossRef] [PubMed]
- Agonigi, G.; Batchelor, L.K.; Ferretti, E.; Schoch, S.; Bortoluzzi, M.; Braccini, S.; Chiellini, F.; Biancalana, L.; Zacchini, S.; Pampaloni, G.; et al. Mono-, Di- and Tetra-iron Complexes with Selenium or Sulphur Functionalized Vinyliminium Ligands: Synthesis, Structural Characterization and Antiproliferative Activity. Molecules 2020, 25, 1656. [Google Scholar] [CrossRef] [Green Version]
- Mazzoni, R.; Salmi, M.; Zanotti, V. C-C Bond Formation in Diiron Complexes. Chem. Eur. J. 2012, 18, 10174–10194. [Google Scholar] [CrossRef] [PubMed]
- Ritleng, V.; Chetcuti, M.J. Hydrocarbyl Ligand Transformations on Heterobimetallic Complexes. Chem. Rev. 2007, 107, 797–858. [Google Scholar] [CrossRef]
- García, M.E.; García-Vivó, D.; Ramos, A.; Ruiz, M.A. Phosphinidene-bridged binuclear complexes. Coord. Chem. Rev. 2017, 330, 1–36. [Google Scholar] [CrossRef] [Green Version]
- Ciancaleoni, G.; Zacchini, S.; Zanotti, V.; Marchetti, F. DFT Mechanistic Insights into the Alkyne Insertion Reaction Affording Diiron μ-Vinyliminium Complexes and New Functionalization Pathways. Organometallics 2018, 37, 3718–3731. [Google Scholar] [CrossRef]
- Rocco, D.; Busto, N.; Pérez-Arnaiz, C.; Biancalana, L.; Zacchini, S.; Pampaloni, G.; Garcia, B.; Marchetti, F. Antiproliferative and bactericidal activity of diiron and monoiron cyclopentadienyl carbonyl complexes comprising a vinyl-aminoalkylidene unit. Appl. Organomet. Chem. 2020, 34, e5923. [Google Scholar] [CrossRef]
- Schoch, S.; Mouna, H.; Pereira, S.A.P.; Saraiva, M.L.M.F.S.; Braccini, S.; Chiellini, F.; Biver, T.; Zacchini, S.; Pampaloni, G.; Dyson, P.J.; et al. A Simple Strategy to Incorporate Bioactive Fragments in Anticancer Diiron Bis-Cyclopentadienyl Complexes. Organometallics 2021. [Google Scholar] [CrossRef]
- Agonigi, G.; Bortoluzzi, M.; Marchetti, F.; Pampaloni, G.; Zacchini, S.; Zanotti, V. Regioselective Nucleophilic Additions to Diiron Carbonyl Complexes Containing a Bridging Aminocarbyne Ligand: A Synthetic, Crystallographic and DFT Study. Eur. J. Inorg. Chem. 2018, 960–971. [Google Scholar] [CrossRef]
- Menges, F. “Spectragryph—Optical Spectroscopy Software”, Version 1.2.5, @2016–2017. Available online: http://www.effemm2.de/spectragryph.
- Fulmer, G.R.; Miller, A.J.M.; Sherden, N.H.; Gottlieb, H.E.; Nudelman, A.; Stoltz, B.M.; Bercaw, J.E.; Goldberg, K.I. NMR Chemical Shifts of Trace Impurities: Common Laboratory Solvents, Organics, and Gases in Deuterated Solvents Relevant to the Organometallic Chemist. Organometallics 2010, 29, 2176–2179. [Google Scholar] [CrossRef] [Green Version]
- Willker, W.; Leibfritz, D.; Kerssebaum, R.; Bermel, W. Gradient selection in inverse heteronuclear correlation spectroscopy. Magn. Reson. Chem. 1993, 31, 287–292. [Google Scholar] [CrossRef]
- Albano, V.G.; Busetto, L.; Monari, M.; Zanotti, V. Reactions of acetonitrile di-iron μ-aminocarbyne complexes; synthesis and structure of [Fe2(μ-CNMe2)(μ-H)(CO)2(Cp)2]. J. Organomet. Chem. 2000, 606, 163–168. [Google Scholar] [CrossRef]
- Busetto, L.; Marchetti, F.; Zacchini, S.; Zanotti, V. Unprecedented Zwitterionic Iminium-Chalcogenide Bridging Ligands in Diiron Complexes. Organometallics 2006, 25, 4808–4816. [Google Scholar] [CrossRef]
- IR Data of Acetonitrile Adducts (ῦ/cm−1, Acetonitrile Solution): 1984vs (CO), 1817s (μ-CO), 1531w-m (μ-CN) (from 1a); 1984vs (CO), 1813s (μ-CO), 1571m (μ-CN) (from 1b); 1981vs (CO), 1812s (μ-CO), 1551w (μ-CN) (from 1c); 1984vs (CO), 1814s (μ-CO), 1563w-m (μ-CN) (from 1d) [51]; 1984vs (CO), 1814s (μ-CO) (from 1e) [52]; 1986vs (CO), 1815s (μ-CO), 1527w (μ-CN) (from 1f)
- Sheldrick, G.M. SADABS-2008/1—Bruker AXS Area Detector Scaling and Absorption Correction; Bruker AXS: Madison, WI, USA, 2008. [Google Scholar]
- Sheldrick, G.M. Crystal structure refinement with SHELXL. Acta Crystallogr. C 2015, 71, 3–8. [Google Scholar] [CrossRef]
- Spek, A.L. PLATON, A Multipurpose Crystallographic Tool; Utrecht University: Utrecht, The Netherlands, 2005. [Google Scholar]
- Rundlöf, T.; Mathiasson, M.; Bekiroglu, S.; Hakkarainen, B.; Bowden, T.; Arvidsson, T. Survey and qualification of internal standards for quantification by 1H NMR spectroscopy. J. Pharm. Biomed. Anal. 2010, 52, 645–651. [Google Scholar] [CrossRef]
- Rice, N.M.; Irving, H.M.N.H.; Leonard, M.A. Nomenclature for liquid-liquid distribution (solvent extraction). Pure Appl. Chem. 1993, 65, 2373–2396. [Google Scholar] [CrossRef]
- OECD Guidelines for Testing of Chemicals; OECD: Paris, France, 1995; Volume 107.
- Dearden, J.C.; Bresnen, G.M. The Measurement of Partition Coefficients. Quant. Struct. Act. Relat. 1988, 7, 133–144. [Google Scholar] [CrossRef]
- Currie, D.J.; Lough, C.E.; Silver, R.F.; Holmes, H.L. Partition Coefficients Of Some Conjugated Heteroenoid Compounds and 1,4-Naphthoquinones. Can. J. Chem. 1966, 44, 1035–1043. [Google Scholar] [CrossRef]
- Rosenkranz, A.R.; Schmaldienst, S.; Stuhlmeier, K.M.; Chen, W.; Knapp, W.; Zlabinger, G.J. A microplate assay for the detection of oxidative products using 2′,7′-dichlorofluorescin-diacetate. J. Immunol. Methods 1992, 156, 39–45. [Google Scholar] [CrossRef]
- Fabbrini, M.G.; Cirri, D.; Pratesi, A.; Ciofi, L.; Marzo, T.; Guerri, A.; Nistri, S.; Dell’Accio, A.; Gamberi, T.; Severi, M.; et al. A Fluorescent Silver(I) Carbene Complex with Anticancer Properties: Synthesis, Characterization, and Biological Studies. ChemMedChem 2019, 14, 182–188. [Google Scholar] [CrossRef] [PubMed] [Green Version]
- Zoppi, C.; Massai, L.; Cirri, D.; Gabbiani, C.; Pratesi, A.; Messori, L. Protein metalation by two structurally related gold(I) carbene complexes: An ESI MS study. Inorg. Chim. Acta 2021, 520, 120297. [Google Scholar] [CrossRef]
- Albano, V.G.; Busetto, L.; Marchetti, F.; Monari, M.; Zacchini, S.; Zanotti, V. Stereochemistry of the insertion of disubstituted alkynes into the metal aminocarbyne bond in diiron complexes. J. Organomet. Chem. 2004, 689, 528–538. [Google Scholar] [CrossRef]
- Albano, V.G.; Busetto, L.; Marchetti, F.; Monari, M.; Zacchini, S.; Zanotti, V. Diiron μ-Vinyliminium Complexes from Acetylene Insertion into a Metal—Aminocarbyne Bond. Organometallics 2003, 22, 1326–1331. [Google Scholar] [CrossRef]
- Zhao, J.; Gou, S.; Liu, F. Potent Anticancer Activity and Possible Low Toxicity of Platinum(II) Complexes with Functionalized 1,1-Cyclobutanedicarboxylate as a Leaving Ligand. Chem. Eur. J. 2014, 20, 15216–15225. [Google Scholar] [CrossRef]
- Gust, R.; Krauser, R.; Schmid, B.; Schönenberger, H. Breast cancer inhibiting diastereomeric diacetato[1,2-bis(4-fluorophenyl)ethylenediamine]platinum(II) derivatives: Synthesis and studies on the relationship between reactivity and antitumor activity. Inorg. Chim. Acta 1996, 250, 203–218. [Google Scholar] [CrossRef]
- Gust, R.; Krauser, R.; Schmid, B.; Schönenberger, H. Synthesis and Antitumor Activity of [1,2-Bis(4-fluorophenyl)ethylenediamine][dicarboxylato]platinum(II) Complexes. Arch. Pharm. Pharm. Med. Chem. 1998, 331, 27–35. [Google Scholar] [CrossRef]
- Marloye, M.; Berger, G.; Gelbcke, M.; Dufrasne, F. A survey of the mechanisms of action of anticancer transition metal complexes. Future Med. Chem. 2016, 8, 2263–2286. [Google Scholar] [CrossRef] [PubMed]
- We Previously Found that the Precipitate Formed upon Maintaining Various Complexes Based on the {Fe2Cp2(CO)x} Core (x = 2 or 3) in Aqueous Solution Always Corresponds to Some Form of iron(III) oxide [37, 39]
- Marchetti, F.; Di Nicola, C.; Pettinari, R.; Pettinari, C.; Aiello, I.; La Deda, M.; Candreva, A.; Morelli, S.; De Bartolo, L.; Crispini, A. Zinc(II) Complexes of Acylpyrazolones Decorated with a Cyclohexyl Group Display Antiproliferative Activity Against Human Breast Cancer Cells. Eur. J. Inorg. Chem. 2020, 1027–1039. [Google Scholar] [CrossRef]
- Akhmetova, V.R.; Akhmadiev, N.S.; Abdullin, M.F.; Dzhemileva, L.U.; Dyakonov, V.A. Synthesis of new N,N-Pd(Pt) complexes based on sulfanyl pyrazoles, and investigation of their in vitro anticancer activity. RSC Adv. 2020, 10, 15116–15123. [Google Scholar] [CrossRef] [Green Version]
- Zanda, E.; Busto, N.; Biancalana, L.; Zacchini, S.; Biver, T.; Garcia, B.; Marchetti, F. Anticancer and antibacterial potential of robust Ruthenium(II) arene complexes regulated by choice of α-diimine and halide ligands. Chem. Biol. Interact. 2021, 344, 109522. [Google Scholar] [CrossRef] [PubMed]
- Scalcon, V.; Salmain, M.; Folda, A.; Top, S.; Pigeon, P.; Shirley, L.H.Z.; Jaouen, G.; Bindoli, A.; Vessières, A.; Rigobello, M.P. Tamoxifen-like metallocifens target the thioredoxin system determining mitochondrial impairment leading to apoptosis in Jurkat cells. Metallomics 2017, 9, 949–959. [Google Scholar] [CrossRef] [Green Version]
- Casini, A.; Mastrobuoni, G.; Ang, W.H.; Gabbiani, C.; Pieraccini, G.; Moneti, G.; Dyson, P.J.; Messori, L. ESI–MS Characterisation of Protein Adducts of Anticancer Ruthenium(II)-Arene PTA (RAPTA) Complexes. ChemMedChem 2007, 2, 631–635. [Google Scholar] [CrossRef]
- Pratesi, A.; Cirri, D.; Ciofi, L.; Messori, L. Reactions of Auranofin and Its Pseudohalide Derivatives with Serum Albumin Investigated through ESI-Q-TOF MS. Inorg. Chem. 2018, 57, 10507–10510. [Google Scholar] [CrossRef]
- Pelosi, C.; Saitta, F.; Zerino, C.; Canil, G.; Biver, T.; Pratesi, A.; Duce, C.; Fessas, D.; Gabbiani, C.; Tiné, M.R. Thermodynamic Evaluation of the Interactions between Anticancer Pt(II) Complexes and Model Proteins. Molecules 2021, 26, 2376. [Google Scholar] [CrossRef]
- Zoppi, C.; Messori, L.; Pratesi, A. ESI MS studies highlight the selective interaction of Auranofin with protein free thiols. Dalton Trans. 2020, 49, 5906–5913. [Google Scholar] [CrossRef]
- Massai, L.; Zoppi, C.; Cirri, D.; Pratesi, A.; Messori, L. Reactions of Medicinal Gold(III) Compounds With Proteins and Peptides Explored by Electrospray Ionization Mass Spectrometry and Complementary Biophysical Methods. Front. Chem. 2020, 8, 581648. [Google Scholar] [CrossRef] [PubMed]
- Massai, L.; Pratesi, A.; Bogojeski, J.; Banchini, M.; Pillozzi, S.; Messori, L.; Bugarčić, Ž.D. Antiproliferative properties and biomolecular interactions of three Pd(II) and Pt(II) complexes. J. Inorg. Biochem. 2016, 165, 1–6. [Google Scholar] [CrossRef] [PubMed]
- Pratesi, A.; Gabbiani, C.; Michelucci, E.; Ginanneschi, M.; Papini, A.M.; Rubbiani, R.; Ott, I.; Messori, L. Insights on the mechanism of thioredoxin reductase inhibition by gold N-heterocyclic carbene compounds using the synthetic linear selenocysteine containing C-terminal peptide hTrxR(488-499): An ESI-MS investigation. J. Inorg. Biochem. 2014, 136, 161–169. [Google Scholar] [CrossRef]
- Tŏpala, T.; Pascual-Álvarez, A.; Moldes-Tolosa, M.Á.; Bodoki, A.; Castiñei ras, A.; Torres, J.; del Pozo, C.; Borrás, J.; Alzuet-Piña, G. New sulfonamide complexes with essential metal ions [Cu(II), Co(II), Ni(II) and Zn(II)]. Effect of the geometry and the metal ion on DNA binding and nuclease activity. BSA protein interaction. J. Inorg. Biochem. 2020, 202, 110823. [Google Scholar] [CrossRef] [PubMed]
- Elsadek, B.; Kratz, F. Impact of albumin on drug delivery-New applications on the horizon. J. Control. Release 2012, 157, 4–28. [Google Scholar] [CrossRef] [PubMed]


| 2c | 3a | |
|---|---|---|
| Formula | C32H30F3Fe2NO5S | C21H22F3Fe2NO5S |
| FW | 709.33 | 569.15 |
| T, K | 100(2) | 100(2) |
| λ, Å | 0.71073 | 0.71073 |
| Crystal system | Monoclinic | Monoclinic |
| Space group | P21/c | P21/c |
| a, Å | 17.2348(14) | 9.9306(6) |
| b, Å | 8.9679(7) | 12.5791(7) |
| c, Å | 19.8255(14) | 17.5345(10) |
| β,° | 104.380(3) | 90.604(2) |
| Cell volume, Å3 | 2968.2(4) | 2190.3(2) |
| Z | 4 | 4 |
| Dc, g∙cm−3 | 1.587 | 1.726 |
| μ, mm−1 | 1.110 | 1.480 |
| F(000) | 1456 | 1160 |
| Crystal size, mm | 0.18 × 0.15 × 0.11 | 0.21 × 0.18 × 0.13 |
| θ limits,° | 2.121–25.081 | 1.993–25.994 |
| Reflections collected | 28,217 | 39,294 |
| Independent reflections | 5184 [Rint = 0.0817] | 4267 [Rint = 0.1414] |
| Data/restraints/parameters | 5184/1041/513 | 4267/0/300 |
| Goodness on fit on F2 | 1.283 | 1.142 |
| R1 (I > 2σ(I)) | 0.1207 | 0.0480 |
| wR2 (all data) | 0.2512 | 0.0964 |
| Largest diff. peak and hole, e Å−3 | 0.679/−1.156 | 0.607/−0.504 |
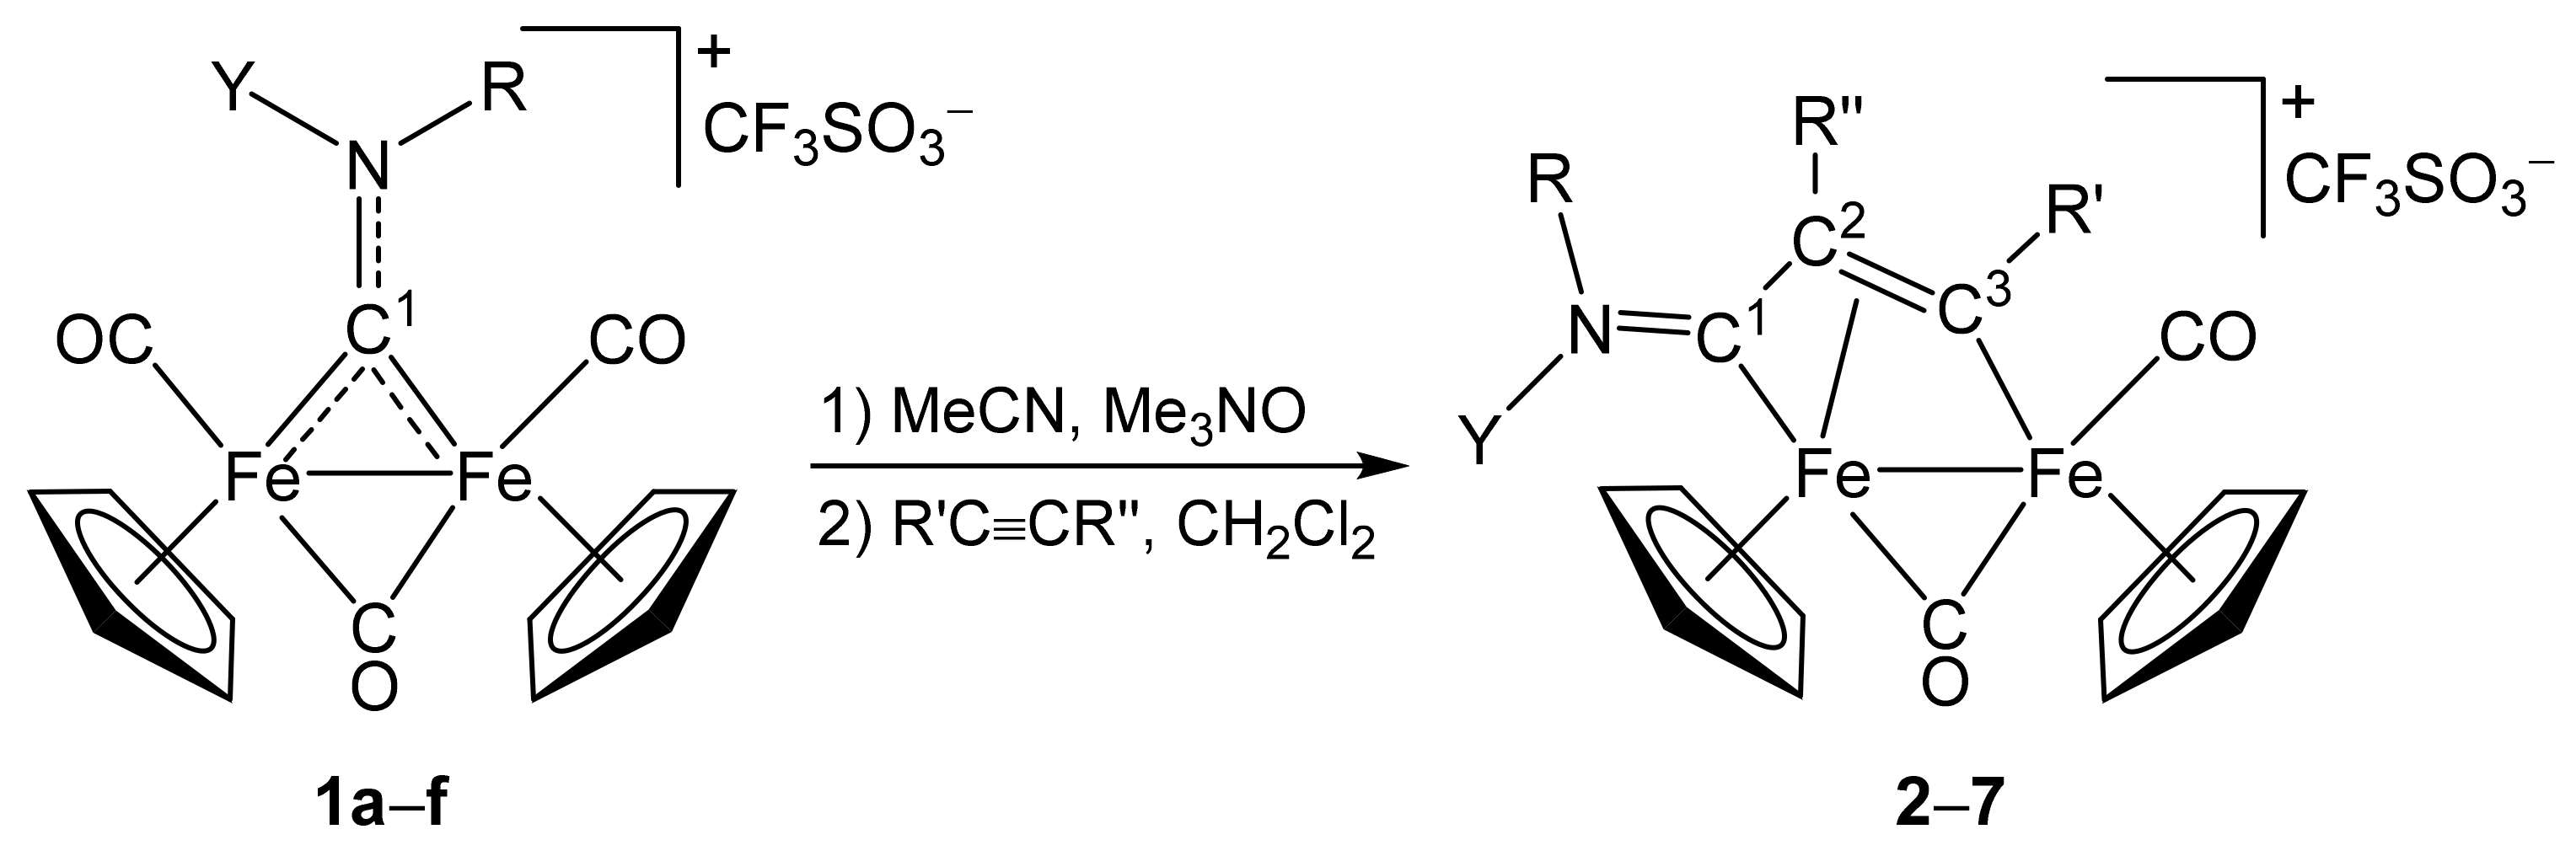
| Precursor | R | Y | R′ | R″ | Product |
|---|---|---|---|---|---|
| 1a | CH2Ph | CH2Ph | Me | H | 2a |
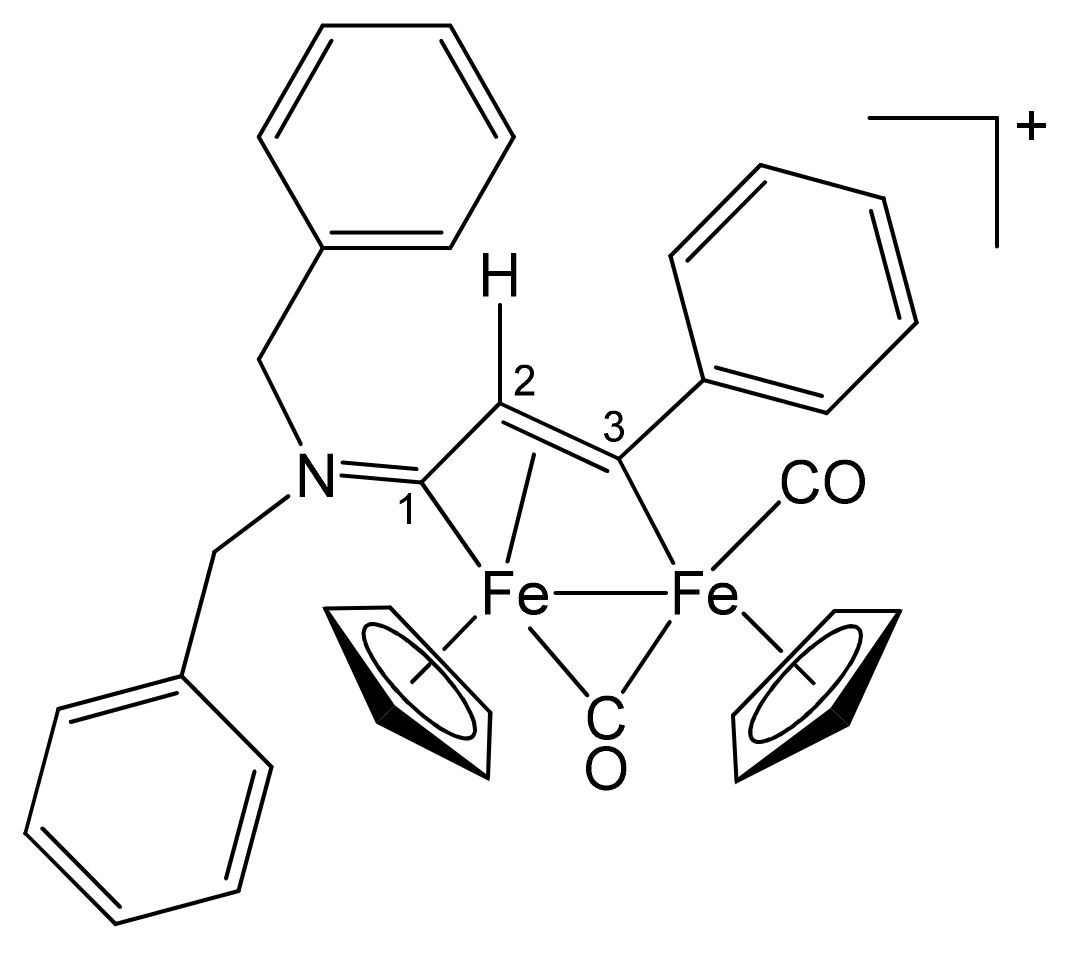
| 1a | CH2Ph | CH2Ph | Ph | H | 2b |
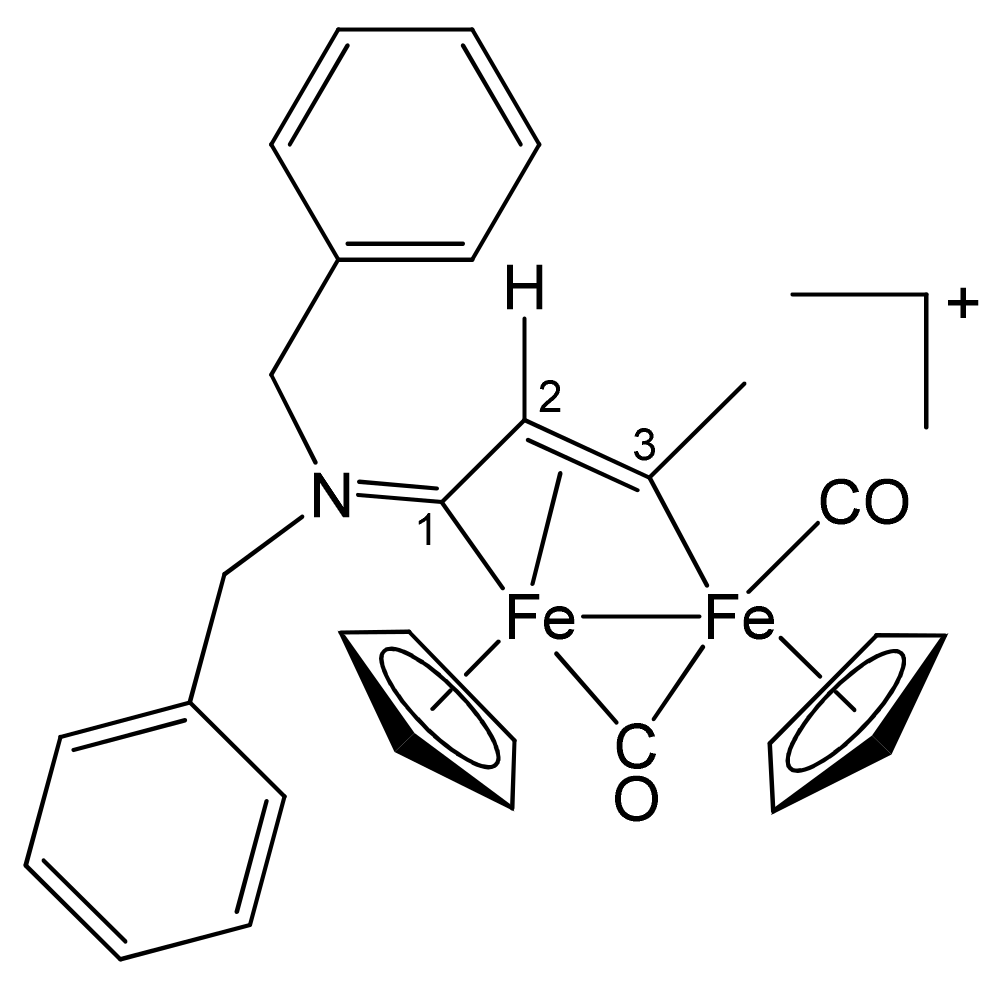
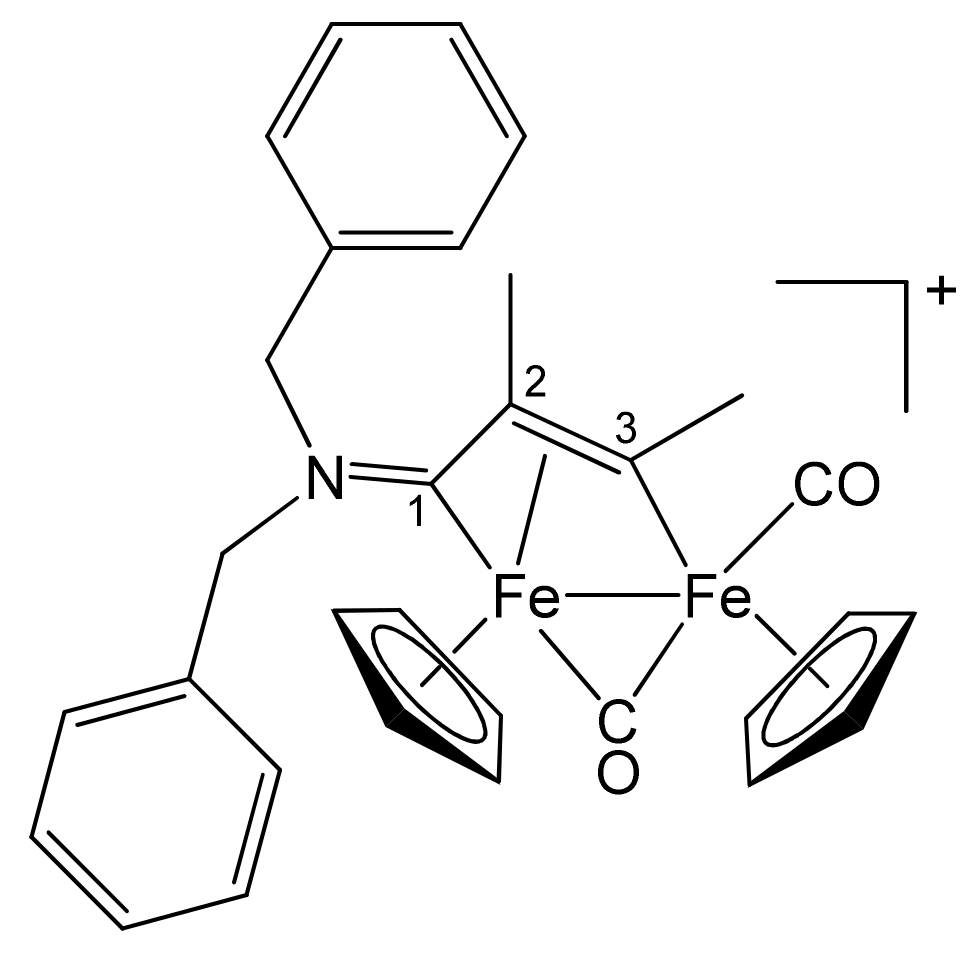
| 1a | CH2Ph | CH2Ph | Me | Me | 2c |
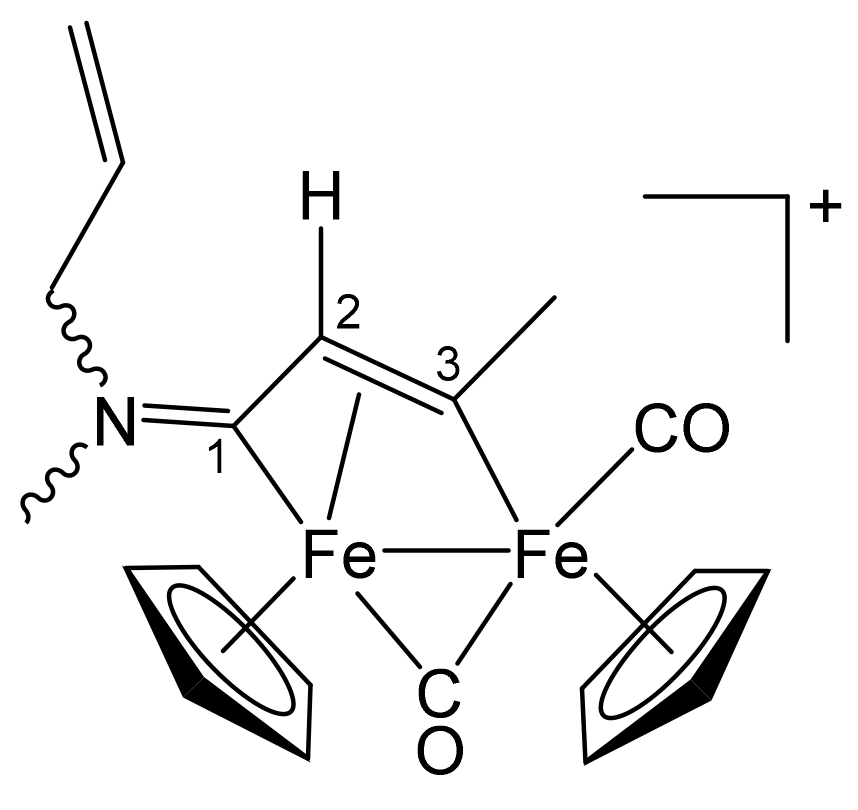
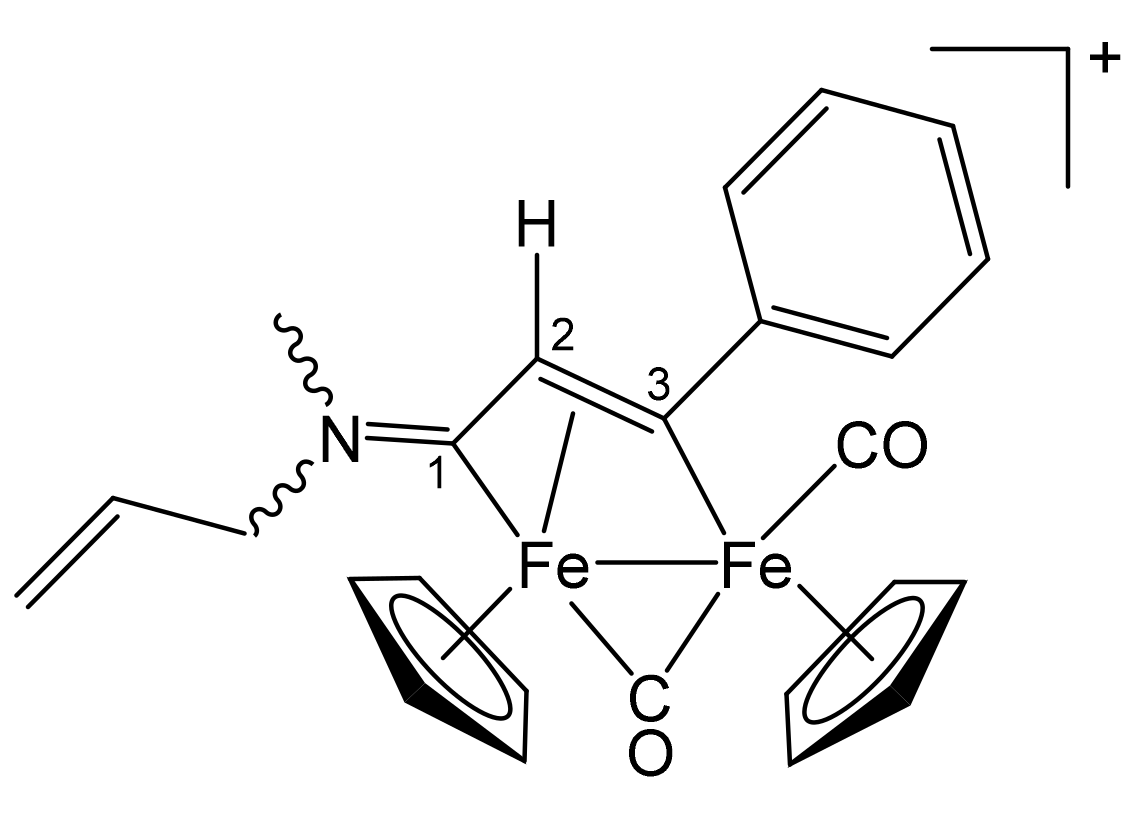
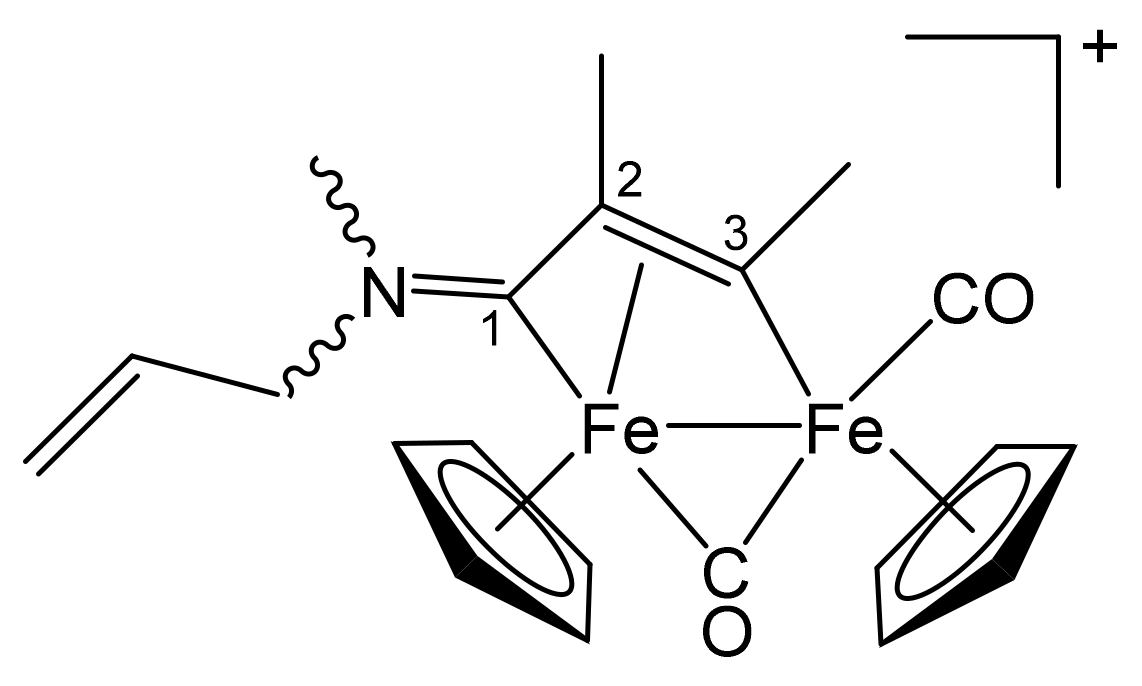
| 1b | CH2CH = CH2 | Me | Me | H | 3a |
| 1b | CH2CH = CH2 | Me | Ph | H | 3b |
| 1b | CH2CH = CH2 | Me | Me | Me | 3c |
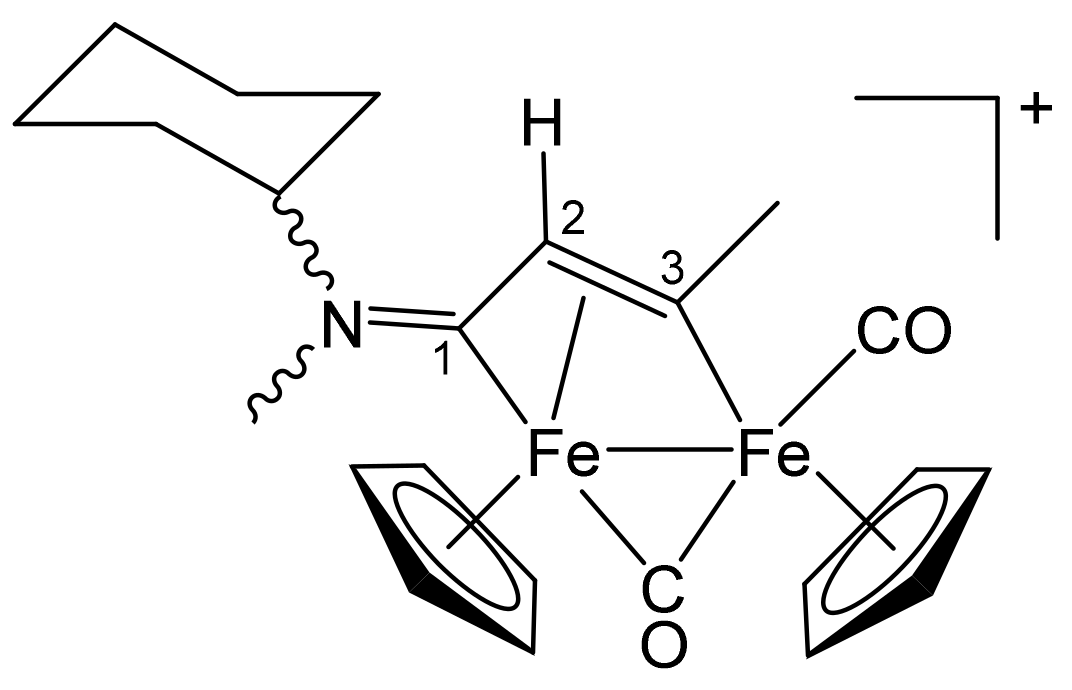
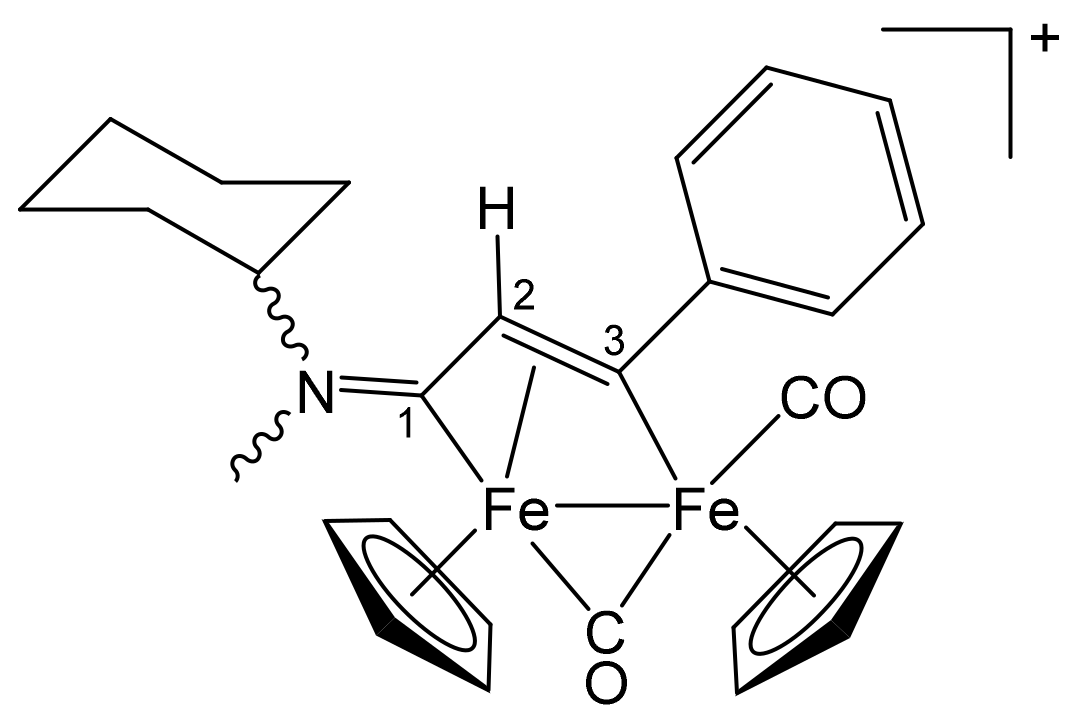
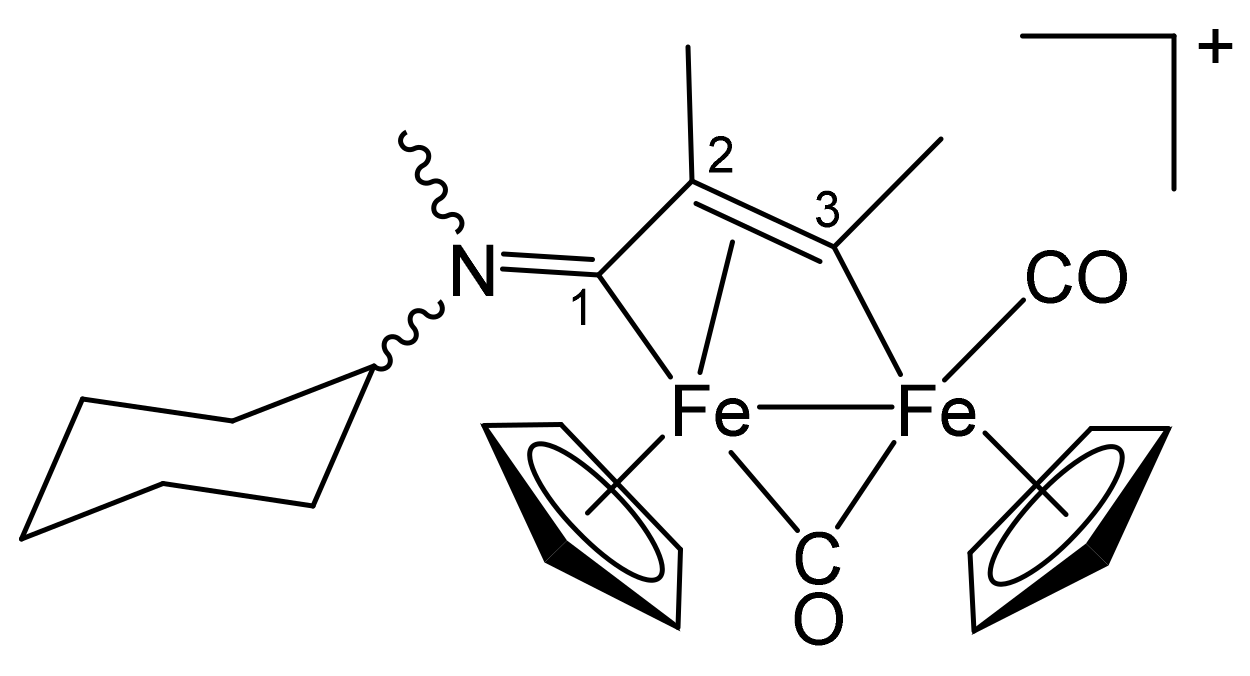
| 1c | C6H11 = Cy | Me | Me | H | 4a |
| 1c | Cy | Me | Ph | H | 4b |
| 1c | Cy | Me | Me | Me | 4c |
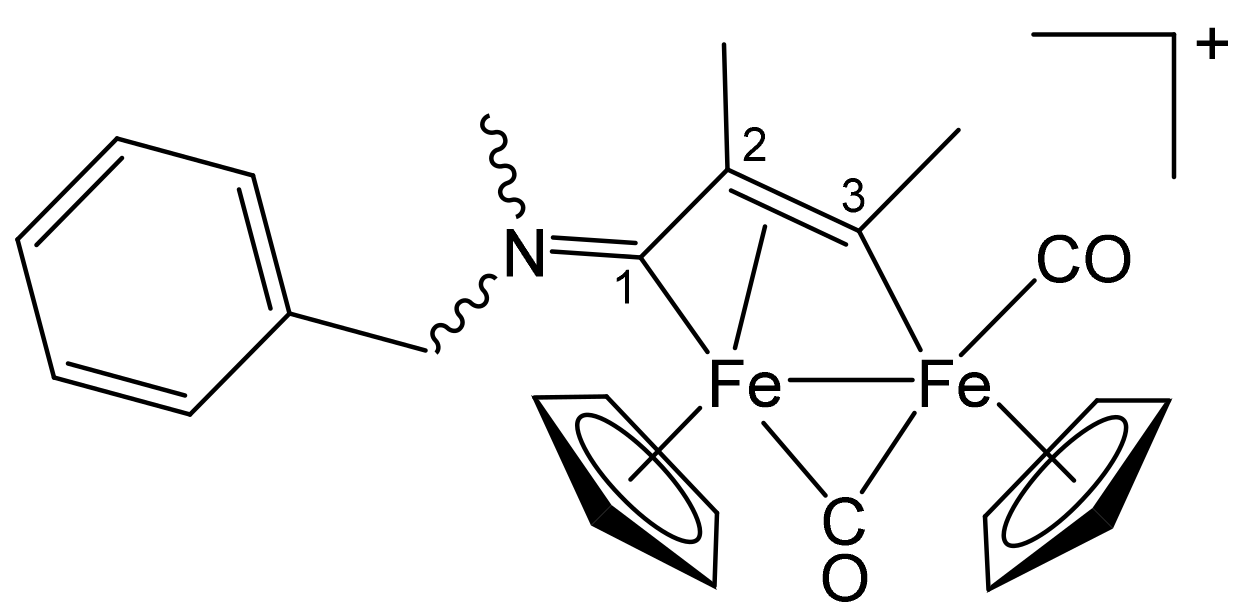
| 1d | CH2Ph | Me | Me | H | 5a |
| 1d | CH2Ph | Me | Me | Me | 5b |
| 1d | CH2Ph | Me | Et | Et | 5c |
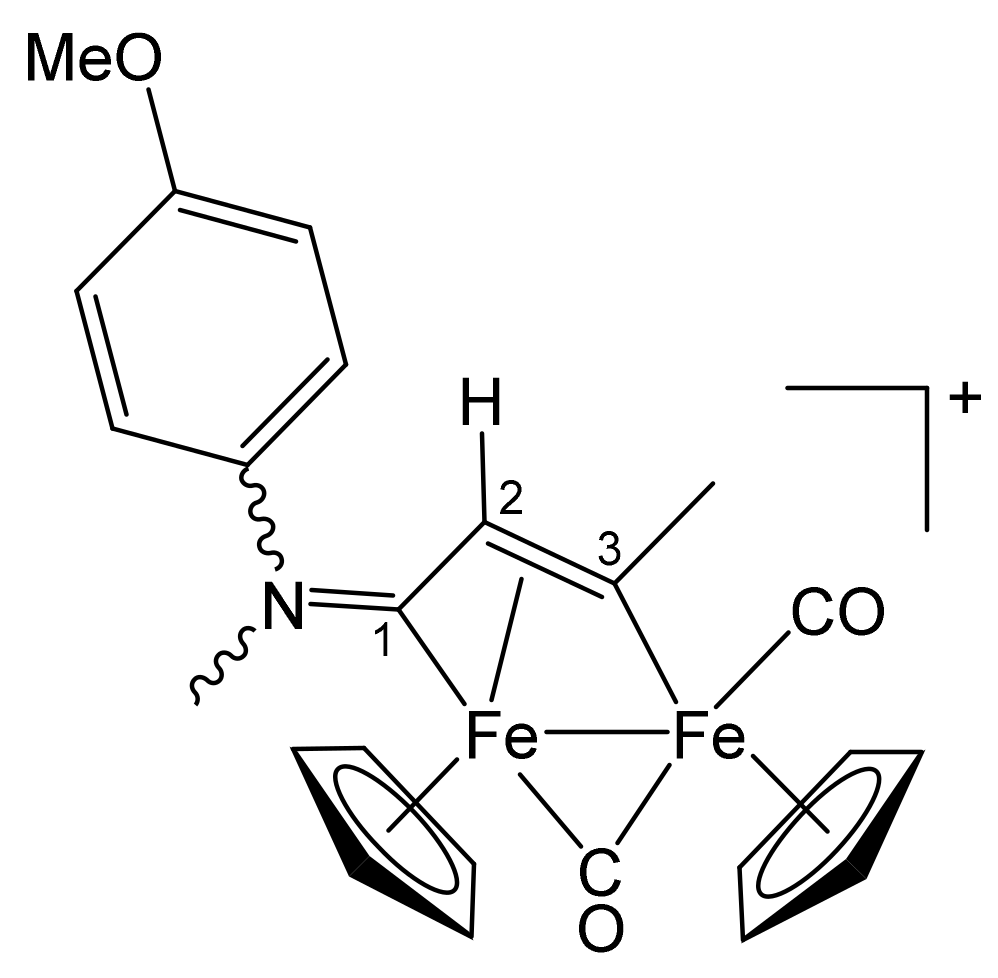
| 1e | 4-C6H4OMe | Me | Me | H | 6a |
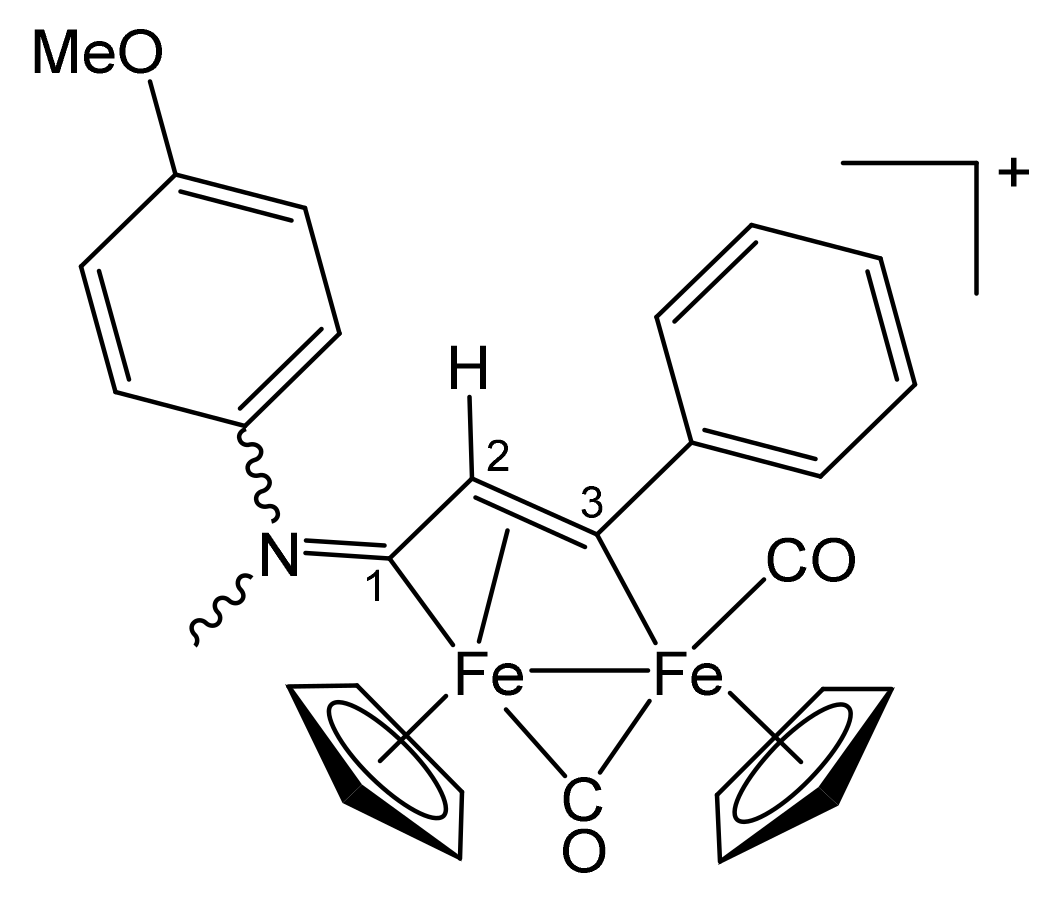
| 1e | 4-C6H4OMe | Me | Ph | H | 6b |
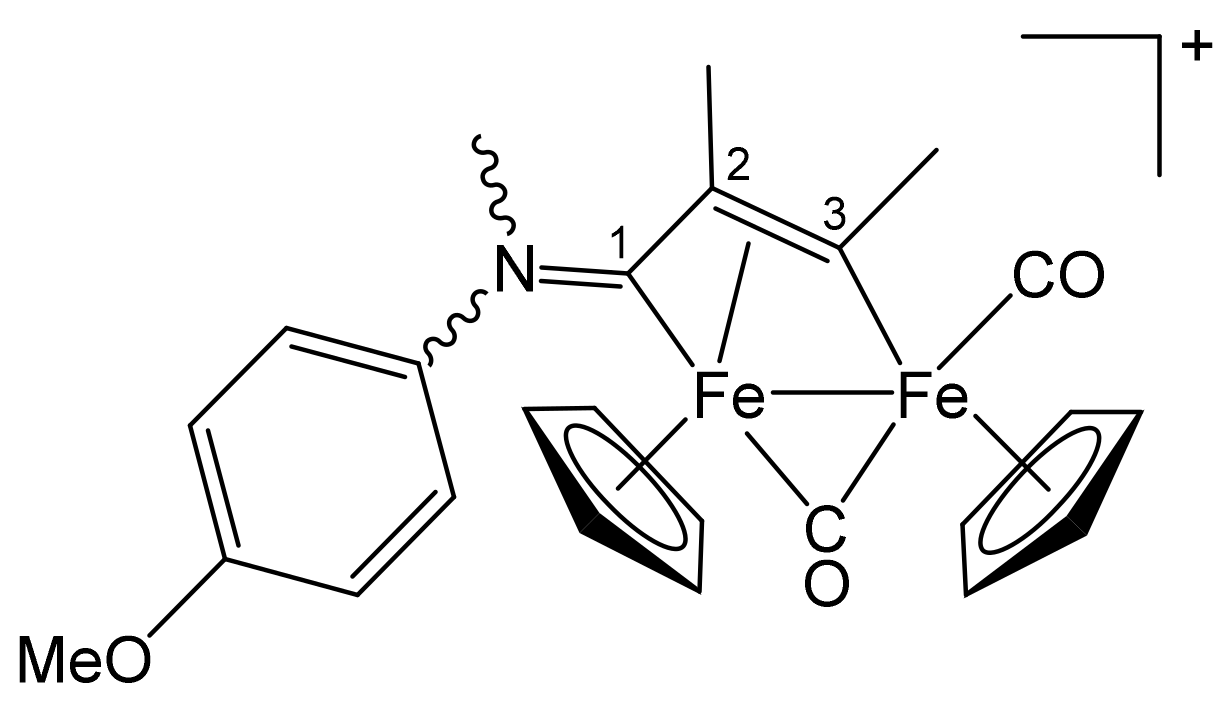
| 1e | 4-C6H4OMe | Me | Me | Me | 6c |
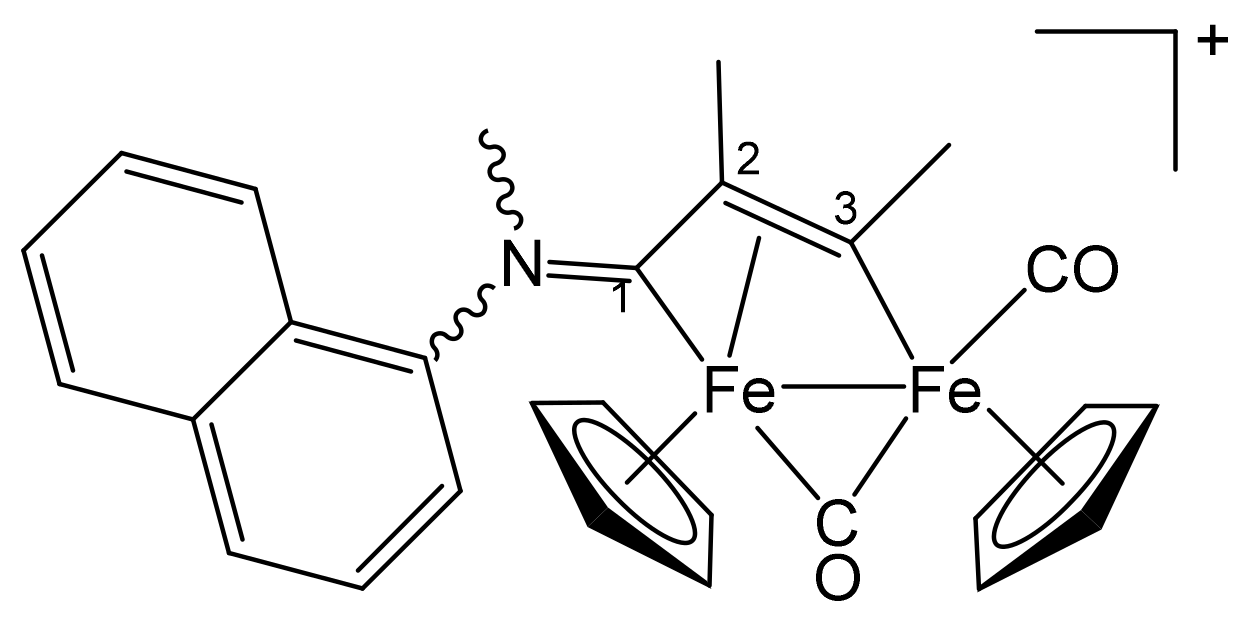
| 1f | 2-naphthyl | Me | Me | Me | 7 |
| Compound | Solubility/mol·L−1 | Solubility/g·L−1 | Stability % | Log Pow |
|---|---|---|---|---|
| 2a | 4.33 × 10⁻⁴ | 0.30 | 81 | 0.45 ± 0.04 |
| 2b | <1 × 10⁻⁴ | <0.08 | = | 1.4 ± 0.2 |
| 2c | <1 × 10⁻⁴ | <0.07 | 87 | 0.56 ± 0.08 |
| 3a | 6.43 × 10⁻³ | 3.66 | 93 a | −0.75 ± 0.01 |
| 3b | 2.34 × 10⁻³ | 1.48 | 68 | −0.09 ± 0.01 |
| 3c | 6.89 × 10⁻³ | 4.02 | 85 a | −0.77 ± 0.01 |
| 4a | 3.49 × 10⁻³ | 2.13 | 95 | −0.29 ± 0.03 |
| 4b | 1.52 × 10⁻³ | 1.02 | 65 | 0.41 ± 0.02 |
| 4c | 2.63 × 10⁻³ | 1.64 | 95 | −0.17 ± 0.01 |
| 5a | 5.41 × 10⁻⁴ | 0.34 | 85 | −0.26 ± 0.01 |
| 5b | 1.52 × 10⁻³ | 0.96 | 90 | −0.43 ± 0.01 |
| 5c | 1.10 × 10⁻³ | 0.73 | 84 | 0.13 ± 0.01 |
| 6a | 2.22 × 10⁻³ | 1.41 | 94 | −0.46 ± 0.01 |
| 6b | 4.98 × 10⁻⁴ | 0.35 | 76 | 0.37 ± 0.04 |
| 6c | 1.06 × 10⁻³ | 0.69 | 86 | −0.21 ± 0.01 |
| 7 | <1 × 10⁻⁴ | <0.07 | 66 | 0.38 ± 0.02 |
| Compound | A2780 | A2780cisR | Balb/3T3 | S.I. |
|---|---|---|---|---|
| 2a | 2.0 ± 0.7 | = | 14 ± 4 | 7 |
| 2c | 1.91 ± 0.15 | = | 18 ± 3 | 9 |
| 3a | 17.7 ± 0.8 | = | >100 | >5.6 |
| 3b | 6.0 ± 0.8 | 29 ± 3 | >100 | >16 |
| 3c | 17 ± 3 | = | >100 | >5.9 |
| 4a | 3.3 ± 0.4 | 11.6 ± 1.3 | >100 | >30 |
| 4b | 2.6 ± 0.3 | = | 35 ± 3 | 13 |
| 4c | 1.8 ± 0.2 | 11.4 ± 0.9 | 94 ± 16 | 52 |
| 5a | 7.1 ± 0.4 | = | >100 | >14 |
| 5b | 5.1 ± 0.3 | 12 ± 4 | >100 | >19 |
| 5c | 3.75 ± 0.14 | = | 90 ± 8 | 24 |
| 6a | 3.5 ± 0.5 | = | 94 ± 4 | 27 |
| 6b | 3.8 ± 0.4 | = | 39 ± 3 | 10 |
| 6c | 3.8 ± 0.4 | 17 ± 3 | >100 | >26 |
| 7 | 2.2 ± 0.2 | = | 48 ± 3 | 22 |
| cisplatin | 0.40 ± 0.07 | 26 ± 3 | 0.8 ± 0.2 | 2 |
Publisher’s Note: MDPI stays neutral with regard to jurisdictional claims in published maps and institutional affiliations. |
© 2021 by the authors. Licensee MDPI, Basel, Switzerland. This article is an open access article distributed under the terms and conditions of the Creative Commons Attribution (CC BY) license (https://creativecommons.org/licenses/by/4.0/).
Share and Cite
Braccini, S.; Rizzi, G.; Biancalana, L.; Pratesi, A.; Zacchini, S.; Pampaloni, G.; Chiellini, F.; Marchetti, F. Anticancer Diiron Vinyliminium Complexes: A Structure–Activity Relationship Study. Pharmaceutics 2021, 13, 1158. https://doi.org/10.3390/pharmaceutics13081158
Braccini S, Rizzi G, Biancalana L, Pratesi A, Zacchini S, Pampaloni G, Chiellini F, Marchetti F. Anticancer Diiron Vinyliminium Complexes: A Structure–Activity Relationship Study. Pharmaceutics. 2021; 13(8):1158. https://doi.org/10.3390/pharmaceutics13081158
Chicago/Turabian StyleBraccini, Simona, Giorgia Rizzi, Lorenzo Biancalana, Alessandro Pratesi, Stefano Zacchini, Guido Pampaloni, Federica Chiellini, and Fabio Marchetti. 2021. "Anticancer Diiron Vinyliminium Complexes: A Structure–Activity Relationship Study" Pharmaceutics 13, no. 8: 1158. https://doi.org/10.3390/pharmaceutics13081158