3.1. Solid-State and Physical Characteristics Assessment of Mannitol Crystallized Forms
The purpose of this work was to investigate whether mannitol powders in different crystal phases could affect the aerosolization behaviour of two model active pharmaceutical ingredients when the mannitol particles were used as carriers in an adhesive mixture. Previous work with lactose as a carrier [
18] clearly evidenced the influence of the lactose crystal phase on aerosolization performance both with hydrophilic and lipophilic model API. To accomplish this aim, the availability of pure solid phases of mannitol represents a fundamental prerequisite.
Starting from the work of Cares-Pacheco et al. [
23] (for the α form) and Vanhoorne et al. [
29,
33] (for the δ form), modified crystallization procedures were developed in order to isolate four mannitol solid phases suitable for the production of binary mixtures with the selected micronized API in terms of kinetic stability and physical characteristics such as shape and particle size distribution.
The obtained mannitol solid phases were, first of all, unequivocally identified by comparing their powder X-ray diffraction patterns with those relevant to β, δ, α and hydrate forms obtained from the CCDC [
22,
25].
Figure 1,
Figure 2,
Figure 3 and
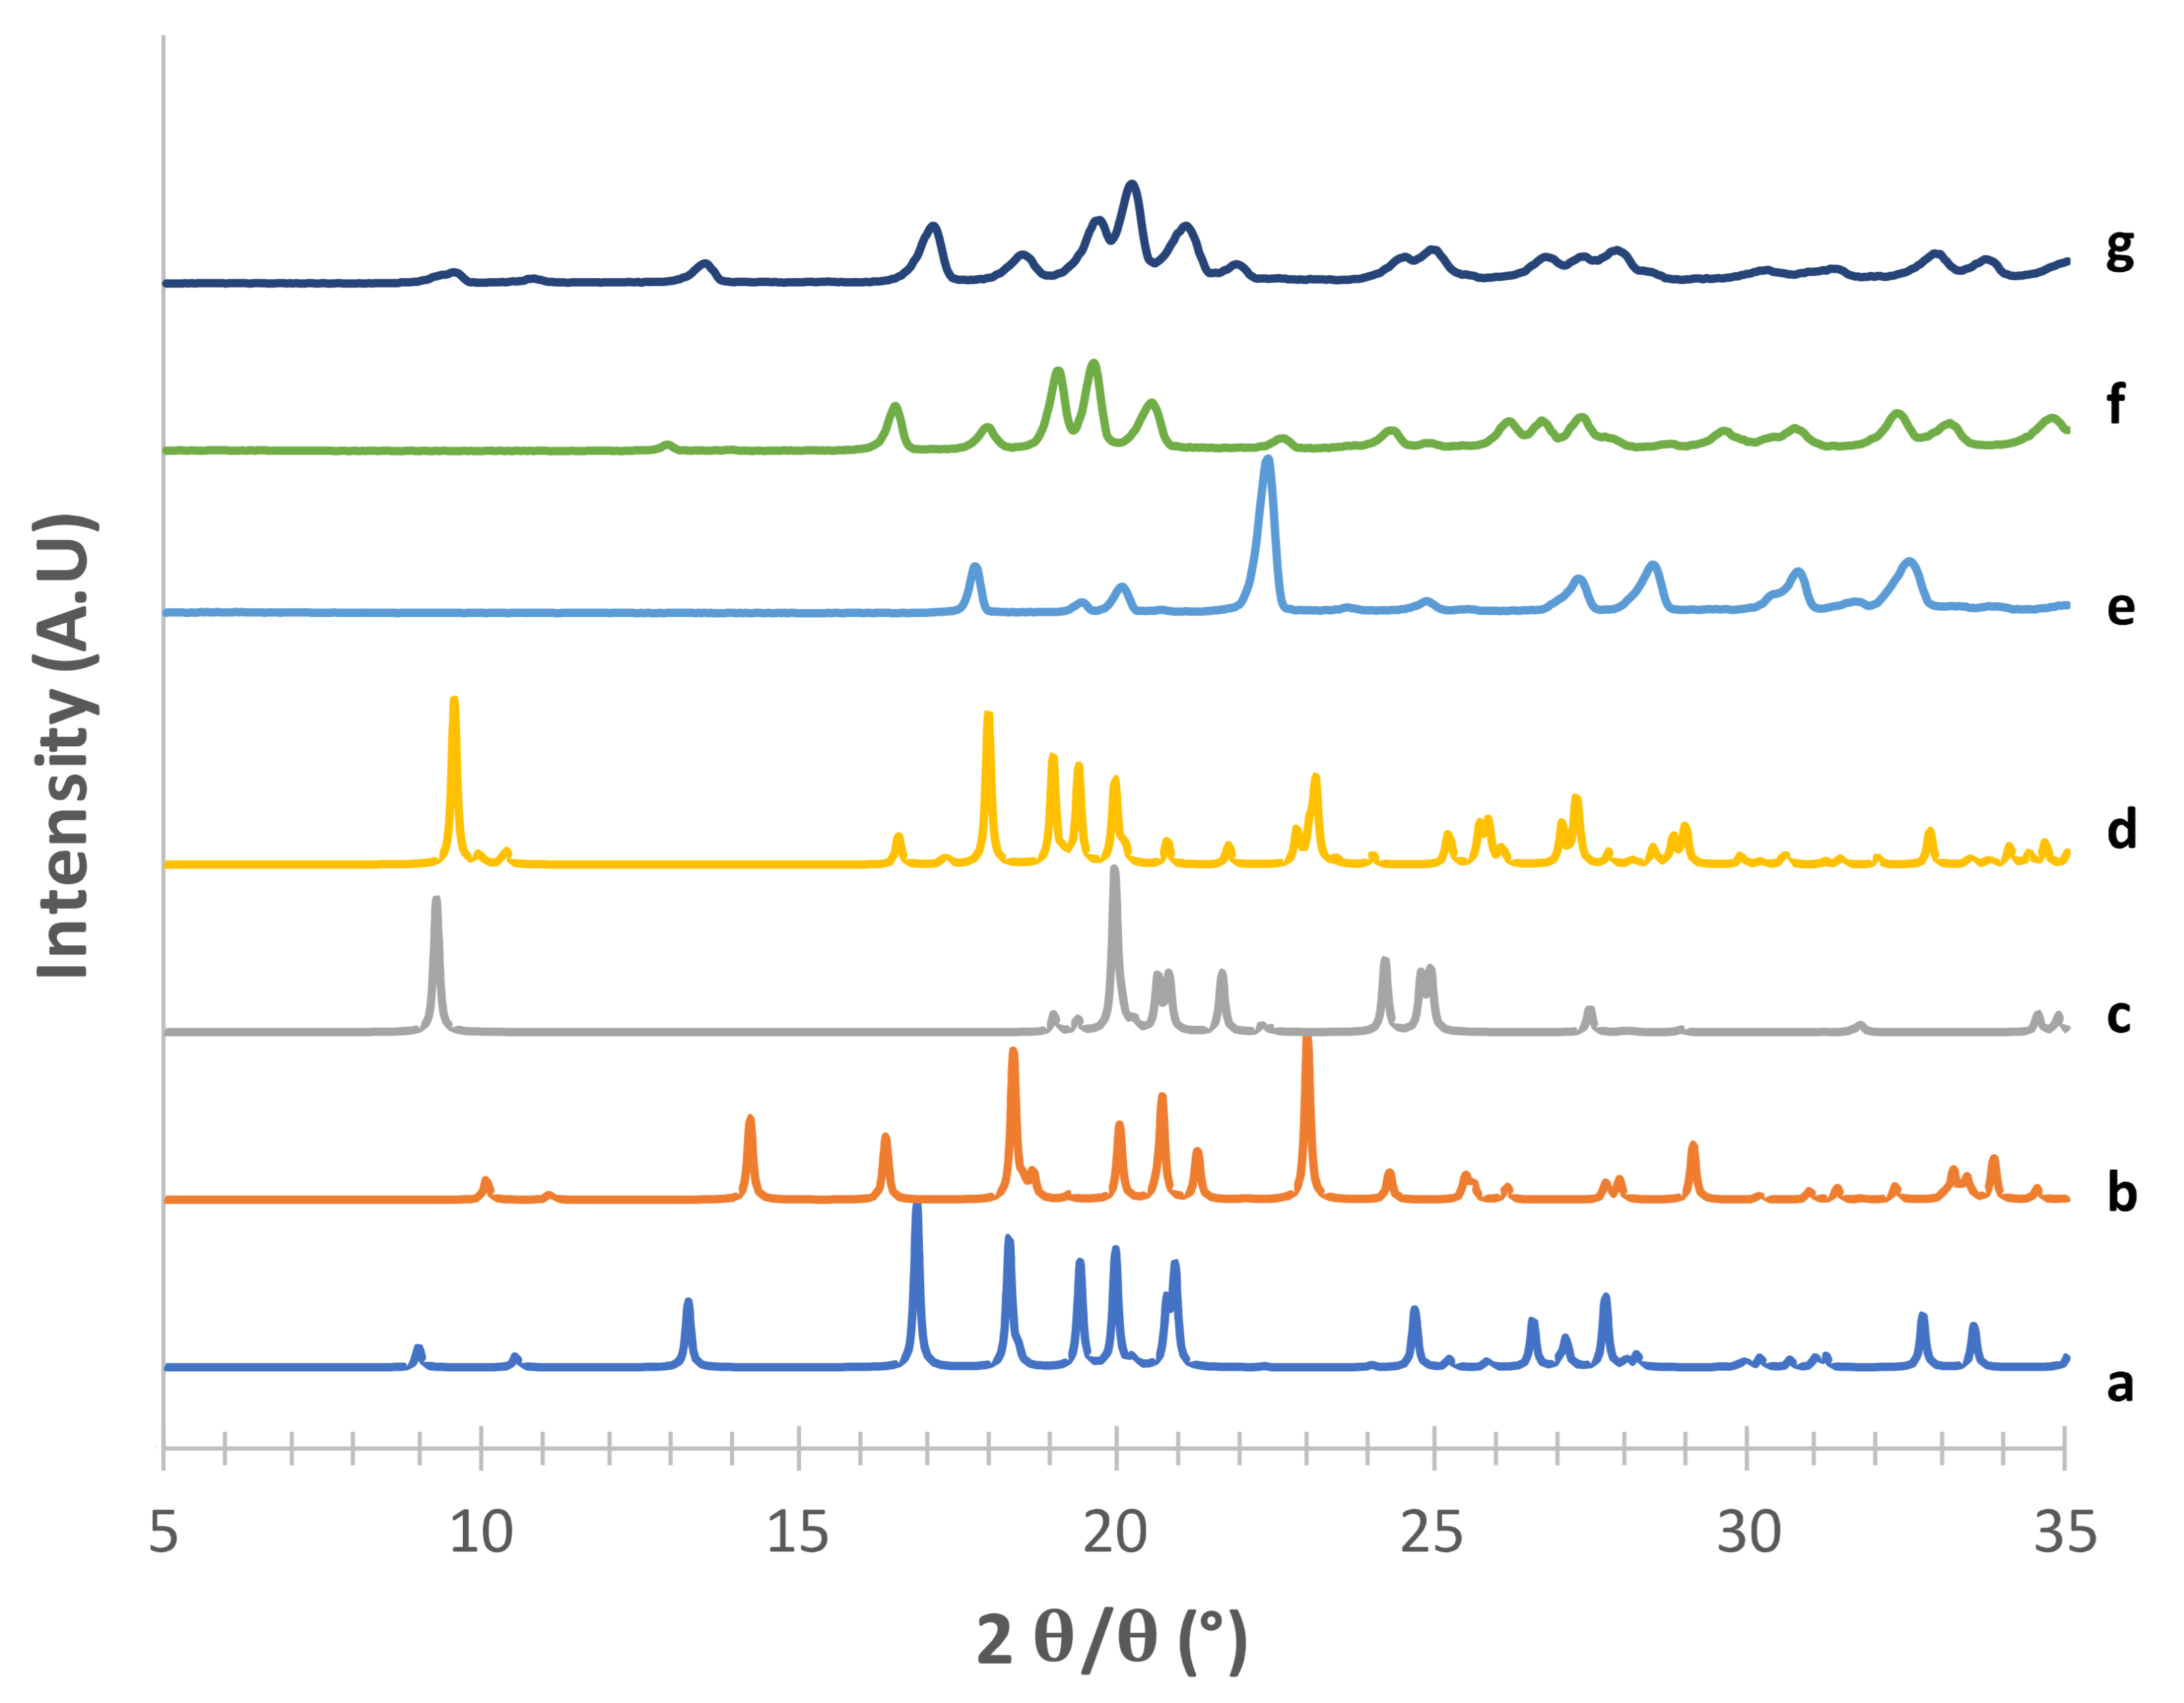
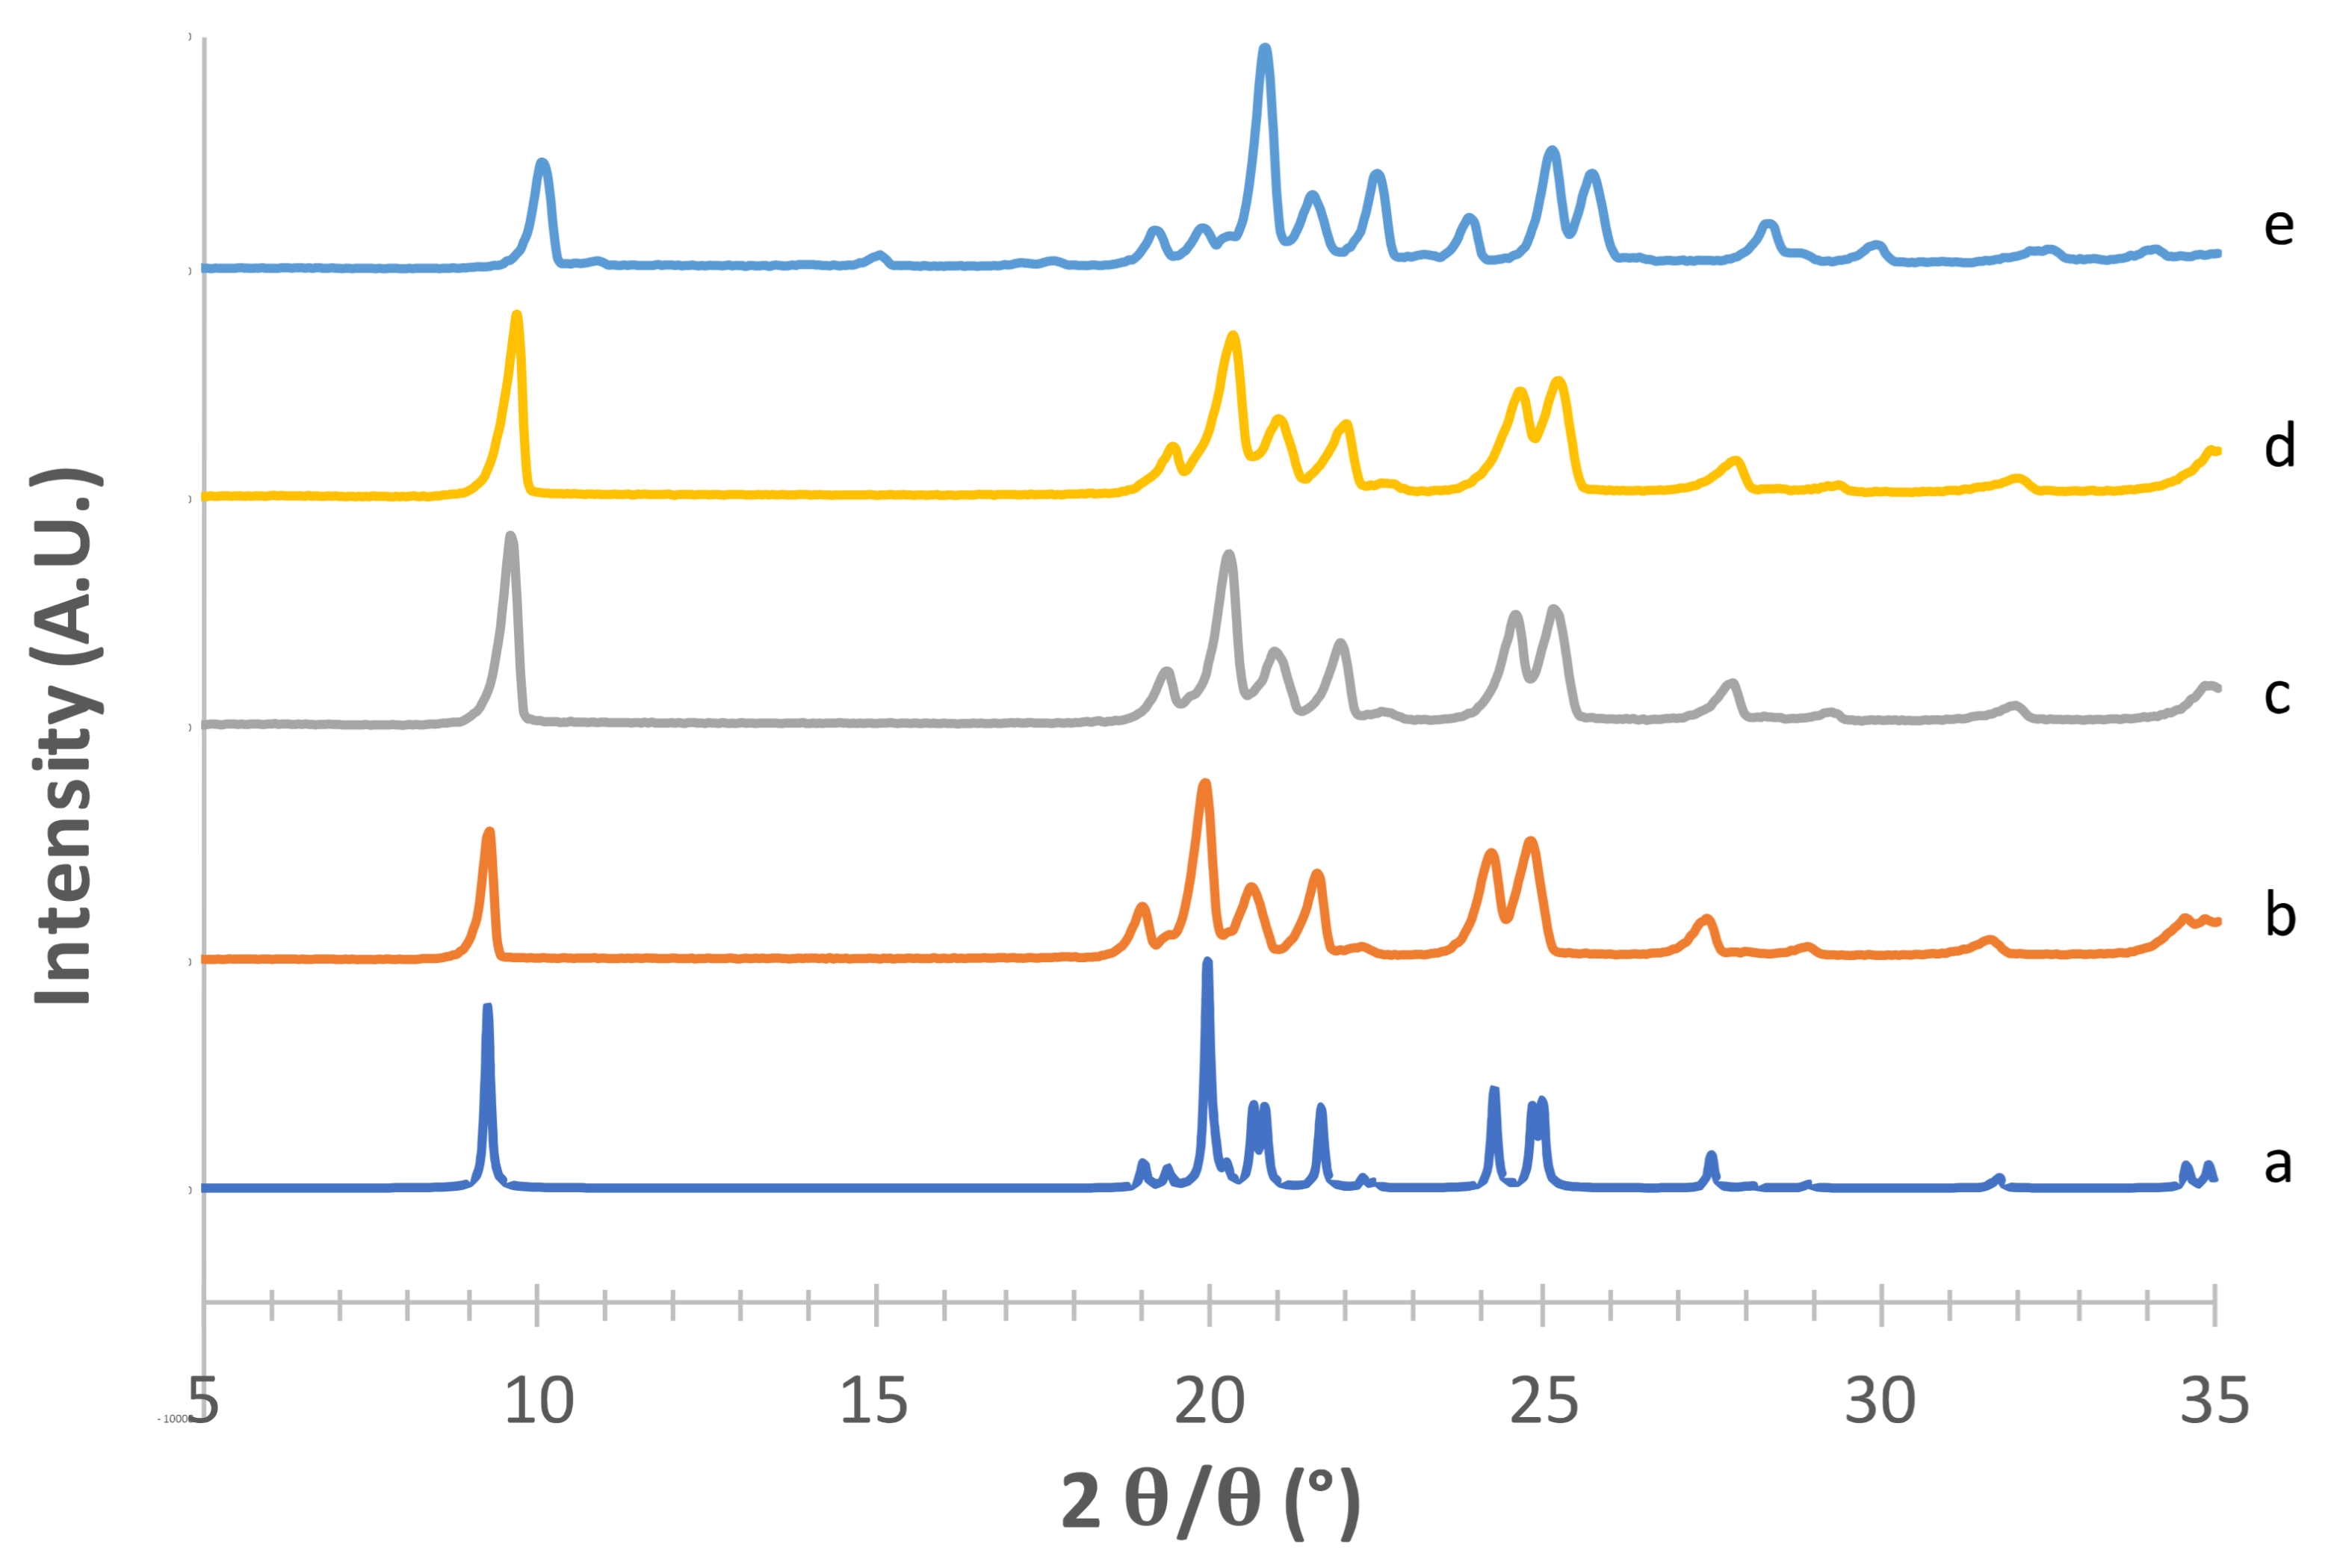
Figure 4 show the PXRD patterns of the crystallized mannitol β, δ, α and hydrate forms in comparison with the relevant theoretical form from CCDC.
Considering the supposed α form (
Figure 1) in the absence of PVA (e) [
23], the diffraction pattern substantially differed from that obtained from CCDC (deposition number 224,658, [
22]). The positions of the observed peaks, and in particular the presence of a peak at around 2
θ = 22.6°, suggest that in this condition we obtained a mixture of α and β forms. The addition of 2% PVA (g) resulted in good matching with the reconstructed pattern, as testified in particular by the presence of the diagnostic peaks at 2
θ = 8.91°, 2
θ = 10.45°, 2
θ = 13.17° and the most intense peak at 2
θ = 16.77°. At 1% PVA (f) the presence of the latter peak at low intensity suggests the formation of a mixture of phases rather than the pure α form, as also indicated by the absence of the peaks at 2
θ = 8.91° and 2
θ = 10.45° (see
Supplementary Table S1). Thus, 2% PVA appears to be the lower polymer concentration suitable for obtaining the pure α form. Although the use PVA in formulation for inhalation has already been proposed [
34] it is worth underlying that PVA has not yet been approved for such applications. Therefore, a low concentration of PVA in the carrier would be beneficial for reducing the polymer burden that may reach the respiratory tree, although it should be considered that most of the carrier deposits in the oropharyngeal region and is eventually swallowed.
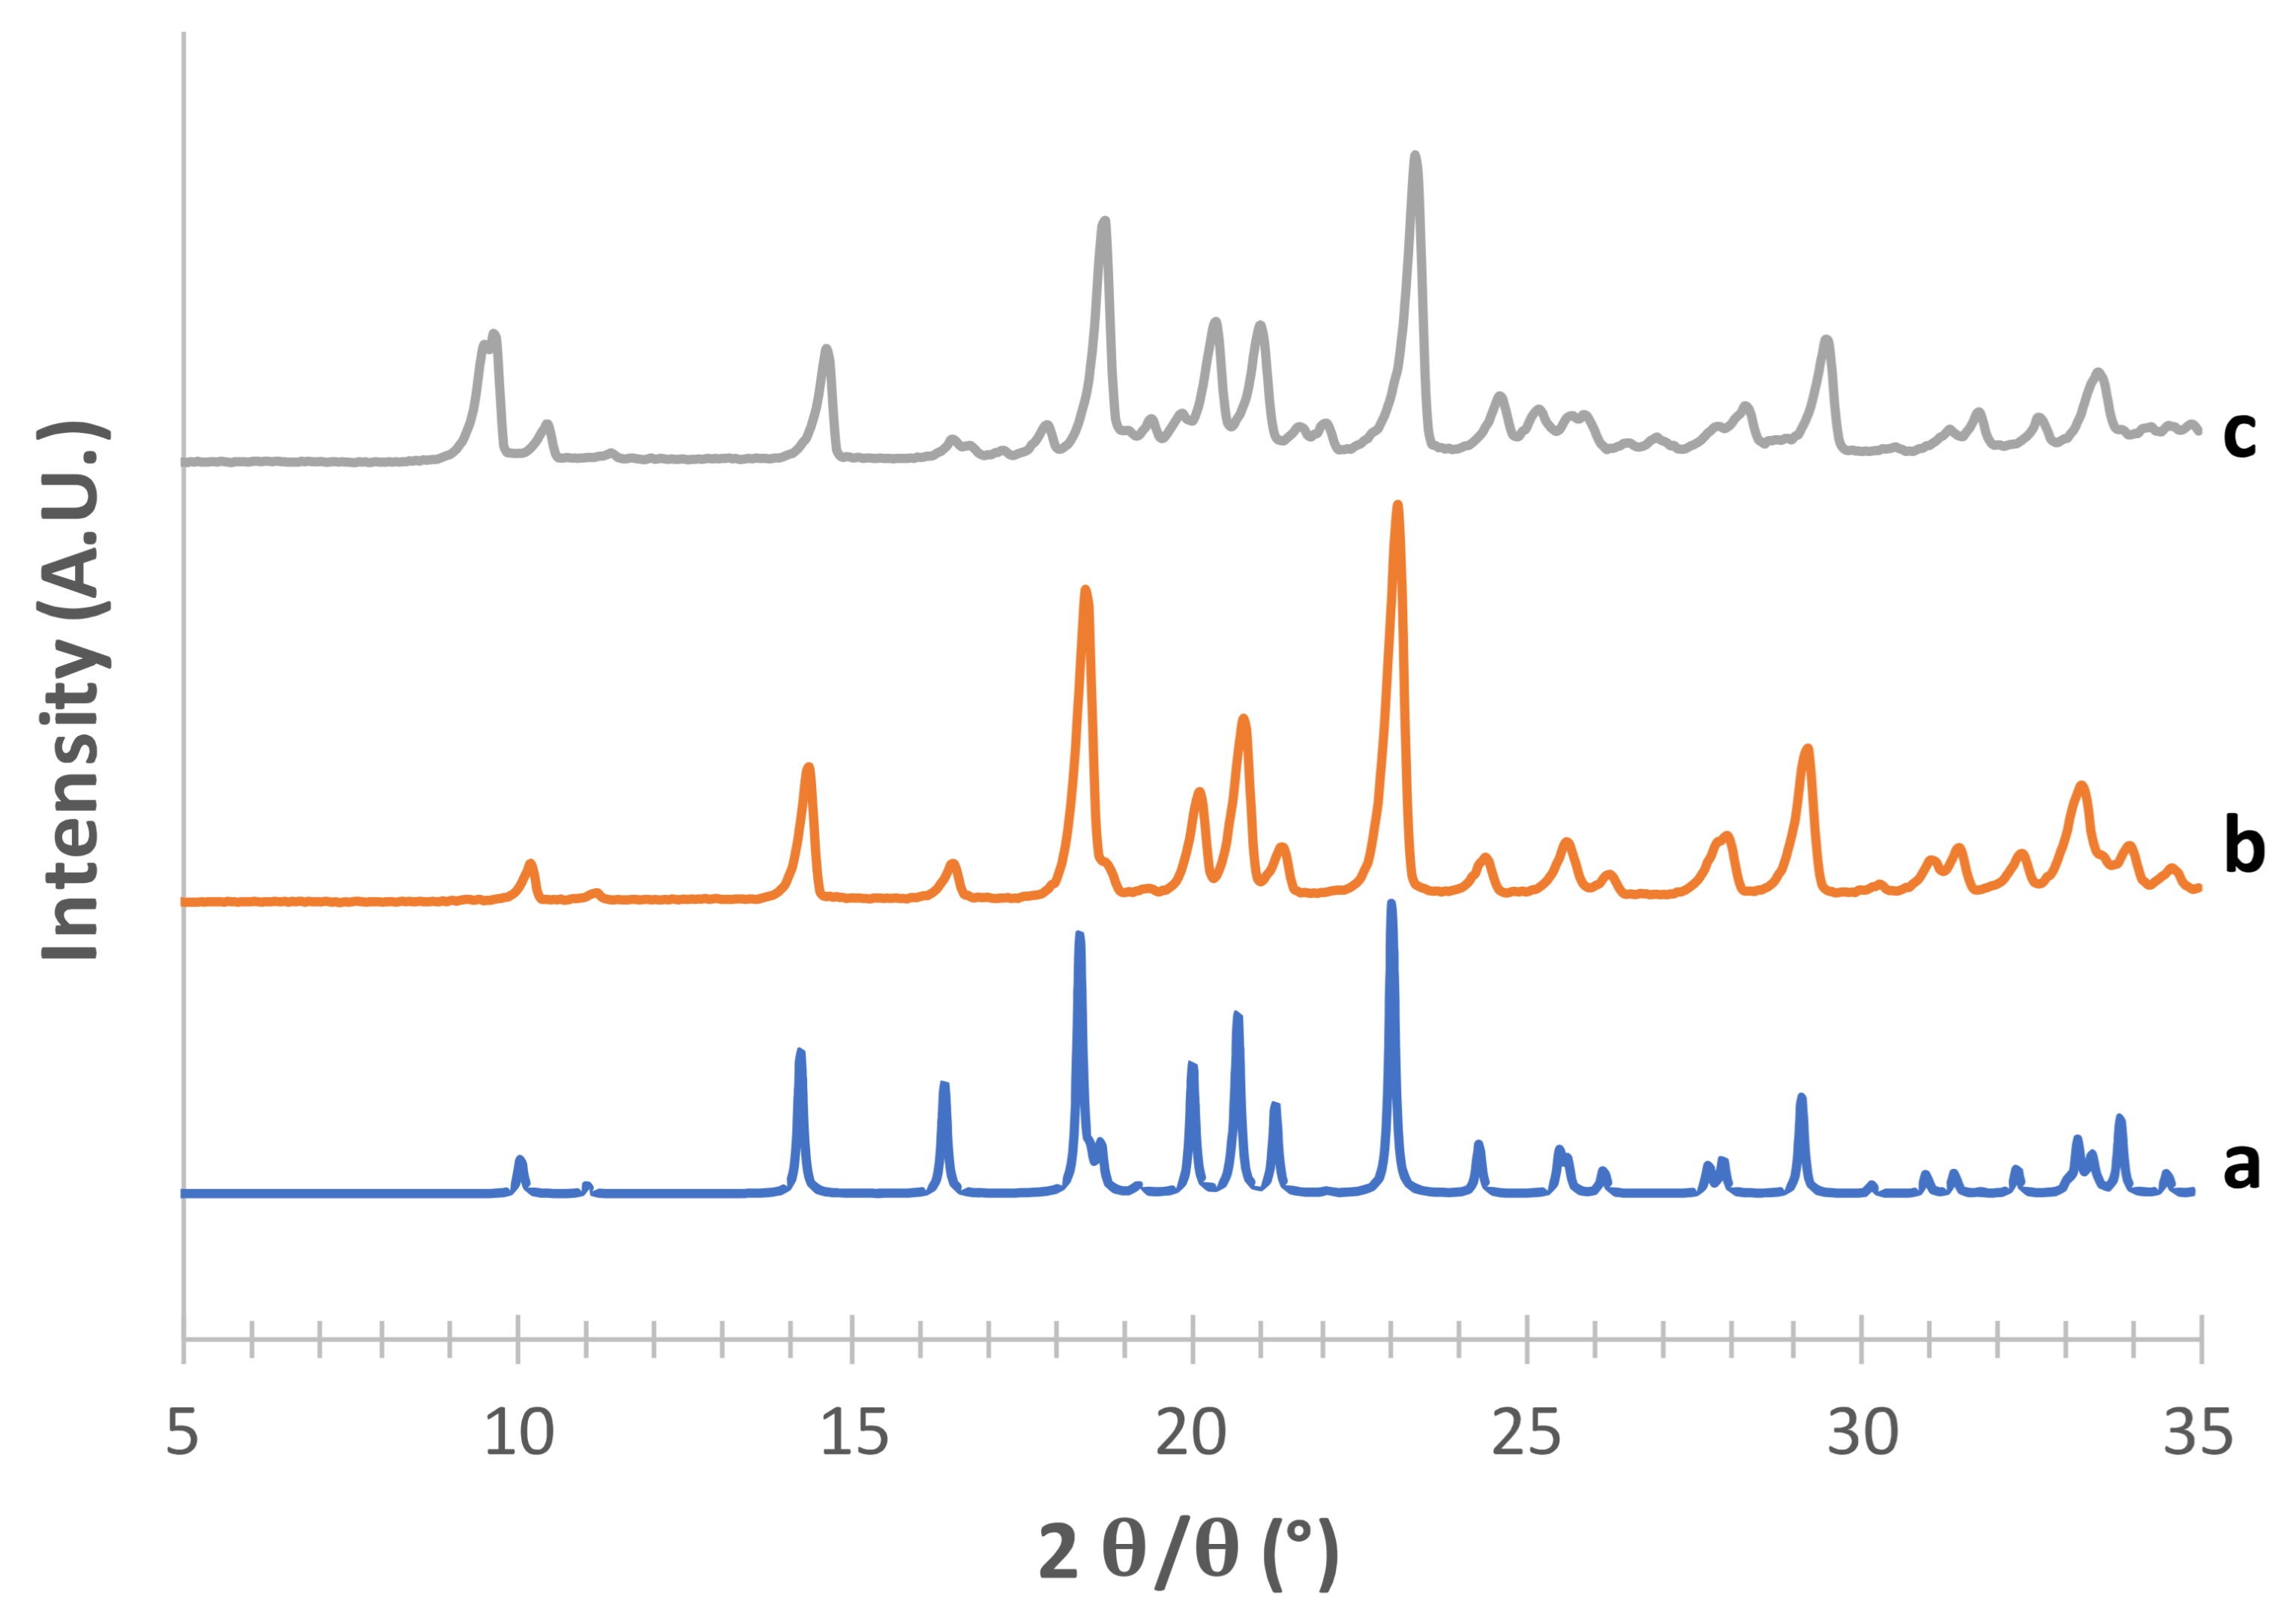
As for the supposed β form (
Figure 2), the superimposition with the pattern reconstructed from CCDC data (deposition number 224,659, [
35]) was quite good for the powders obtained with both crystallization methods, in particular for the characteristic peaks at 2
θ = 10.11°, 2
θ = 14.27°, the most intense peak at 2
θ = 23.07° and the peak at 2
θ = 20.09° (see
Supplementary Table S2).
The PXRD pattern obtained from CCDC for the supposed δ form (deposition number 224,660, [
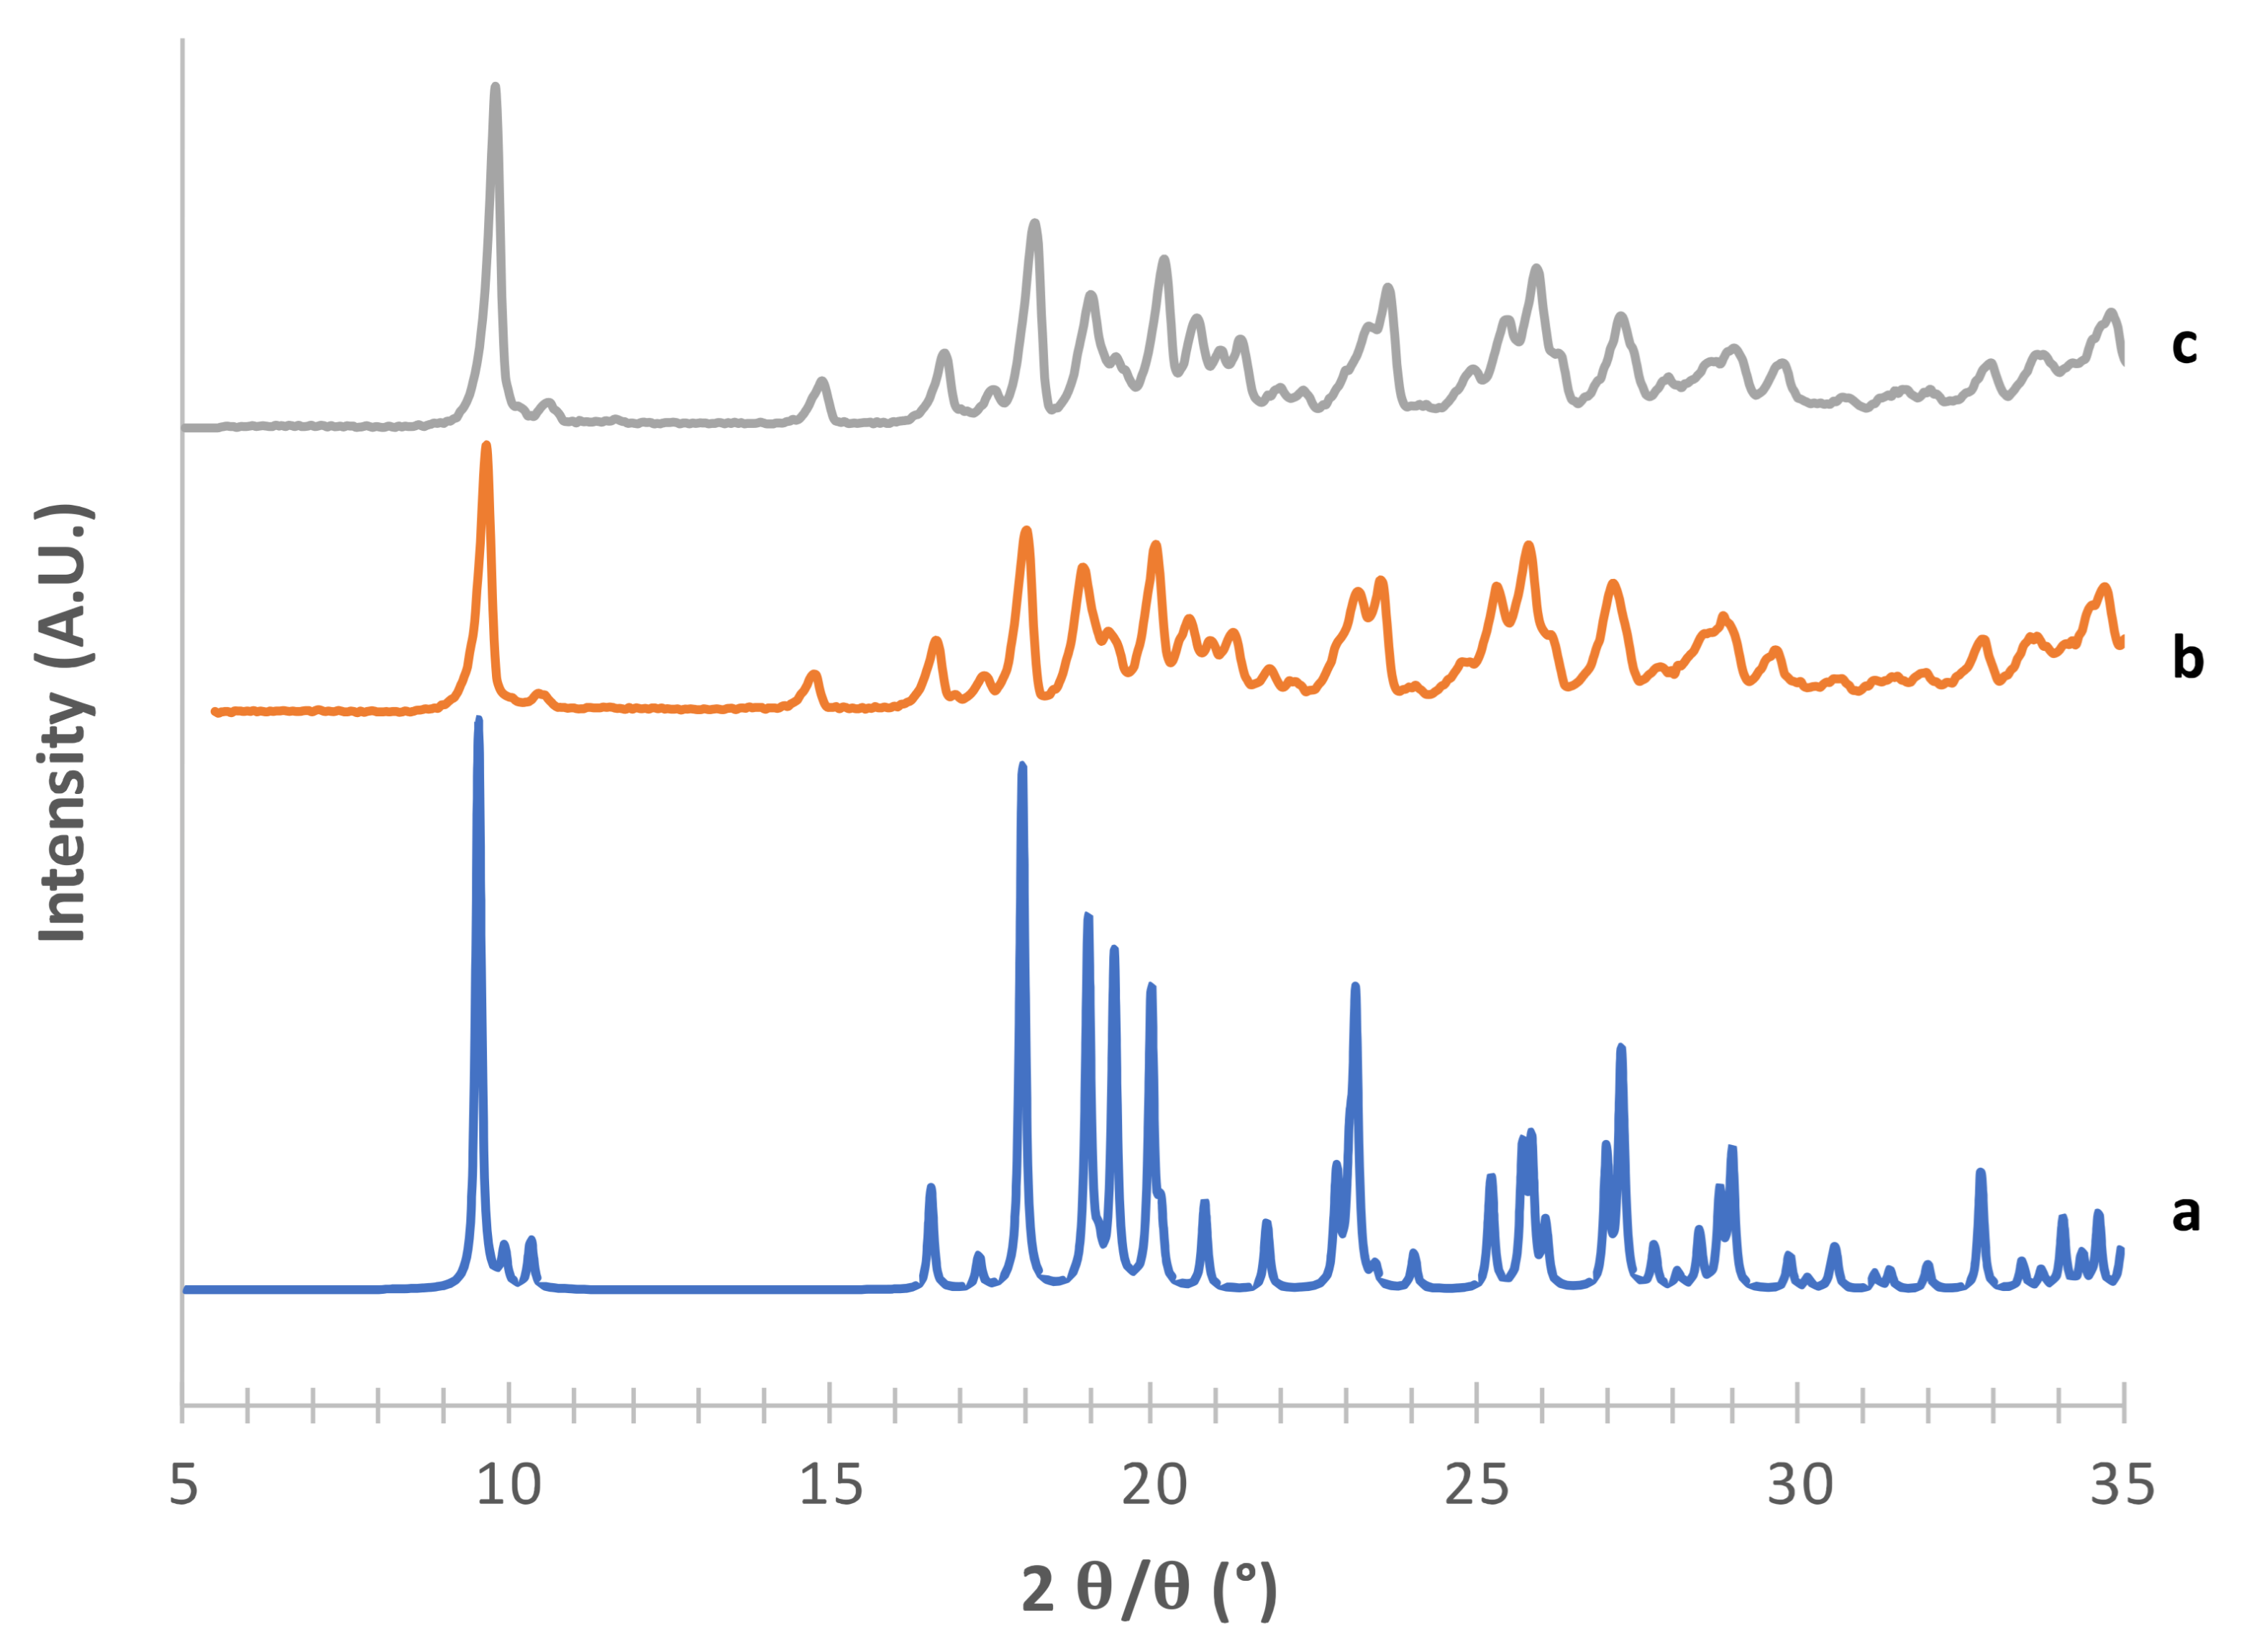
35]) is shown in
Figure 3 (c) along with those obtained from the powders prepared by modifying the method proposed by Vanhoorne et al. [
26,
31] who added 5% of PVP to obtain the stable mannitol δ form. Similar to the approach adopted for the α form, the rationale here was to figure out the lowest amount of polymer necessary to obtain the crystallographic pure (and possibly kinetically stable) δ form in order to minimize the polymer potentially reaching the lower airways. Thus, five different PVP concentrations (from 0 to 3%
w/
w of mannitol) were investigated (
Figure 3). Without PVP (e), as well as with 0.5%
w/
w polymer (f), the highly intense peak at 2
θ = 9.35°, which is characteristic of the δ form, was observed. However, in the trace from CCDC (c) no peaks were present in 2
θ region between 9.5–18.5°, whereas 0 and 0.5% PVP-containing powders showed small peaks at 2
θ = 13.43° and 2
θ = 17.05°, likely ascribable to the presence of traces of the α form (see
Supplementary Table S3). These two peaks disappeared as the PVP concentration increased, 1%
w/
w PVP (g) being the minimum polymer concentration to obtain the crystallographically pure δ form. This powder did not differ from those containing 2% (h) and 3% PVP (i).
The effect of PVP doping on the mannitol solid-state was also investigated by DSC (
Figure S1 in Supplementary material), which showed the appearance of the melting endotherm of the δ mannitol form (onset melting temperature of 155.4 °C at a peak of 157.2 °C) starting from 1% PVP.
It is worth underscoring that the amount of polymer added in the case of PVA and PVP was below the sensitivity of the diffractometer. Therefore, it was not possible to speculate about the solid-state characteristics of the polymer in the carrier particles. Nevertheless, the unidentified small peaks observed in
Figure 1 and
Figure 3 could be reasonably attributed to the presence of either PVA or PVP in crystalline form, respectively.
The hydrate form of mannitol was obtained by freeze-drying with final drying at 25 °C for 4 h at 0.1 mbar [
36]. A hemihydrate solid phase was isolated (
Figure 4), although not in a pure form (see extra reflection at around 15° 2
θ and
Supplementary Table S4)
). However this form was not stable enough, as it easily dehydrated at room temperature, converting into the anhydrous form [
25]. For this reason, its crystalline form was characterized, but it was not used for the preparation of adhesive mixtures with the drug used in the second phase of the work.
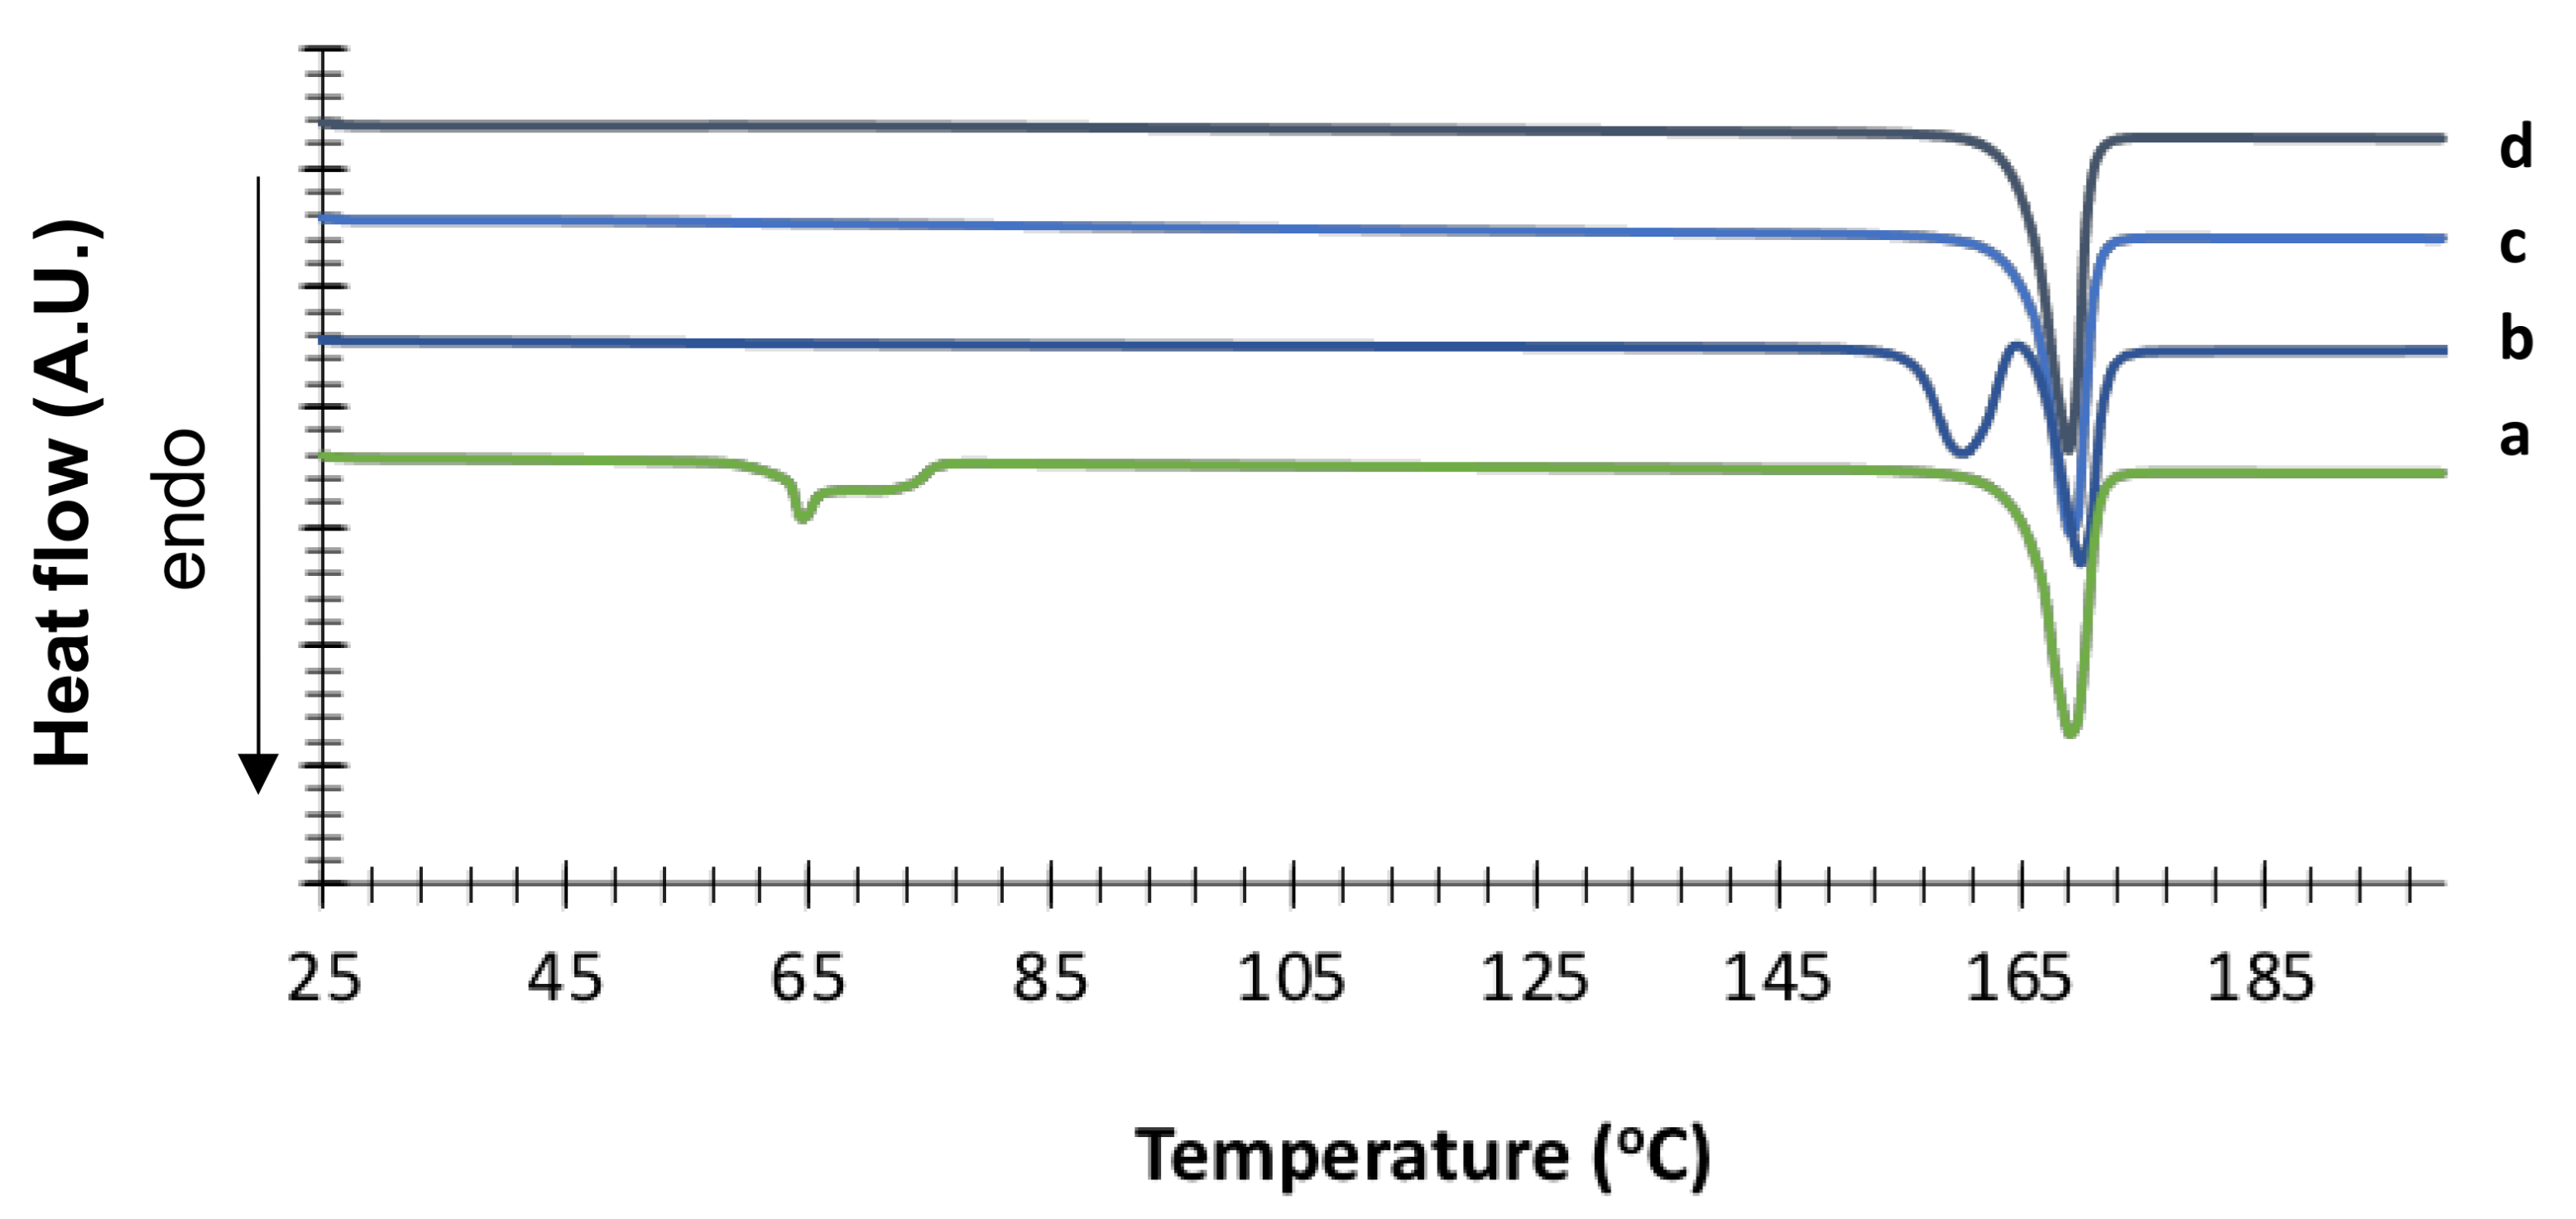
The hydrate nature of the crystal was confirmed by DSC (
Figure 5), which showed a fairly broad endothermic event (onset 62.9 °C ± 0.1 °C, peak 64.0 °C ± 0.1 °C) ascribable to the pseudopolymorphic transition (release of water molecule from the hydrate crystal) followed by final melting with onset at 164.5 °C ± 0.2 °C. TGA analysis indicated a weight loss of 5.2% ± 0.5% in the temperature range 25–80 °C, thus confirming the loss of half a molecule of water per molecule of mannitol (theoretical value 4.7%
w/
w) (
Figure S2 in Supplementary Materials).
For comparison purpose,
Figure 5 also shows the DSC traces of the other crystallized mannitol forms. δ mannitol showed an onset melting temperature of 155.4 °C ± 0.4 °C with a peak at 157.1 °C ± 0.2 °C. This endothermic event was followed by a small exotherm ascribable to recrystallization, and a final melting at 165.2 °C ± 0.5 °C (onset). As for α mannitol, the onset melting temperature was t 164.4 °C ± 0.1 °C with the peak at 165.6 °C ± 0.1 °C. The β form showed an onset temperature of fusion at 165.2 °C ± 0.5 °C with the peak at 166.0 °C ± 0.5 °C. These data are in good agreement with those reported by Cares-Pacheco and coworkers [
23].
3.2. Stability of Crystallized α and δ Mannitol
XRPD was used to study the stability of α and δ forms over time (
Figure 6 and
Figure 7, respectively). The crystallized powders were stored at a temperature of 40° C and 75% RH for up to 24 months in glass vials stoppered with elastomeric caps and clamped.
XRPD analyses were performed to evidence possible solid-phase changes.
As for the α form, although the peaks appeared slightly translated from one time sample to another (likely due to preferential orientation phenomena stemming from slight particle size distribution differences among specimens), the patterns were substantially similar, as no new peaks appeared within 12 months. However, 24 months storage resulted in small peaks at 2
θ = 15° and 2
θ = 23.6°, likely ascribable to the presence of traces of the β form (see
Supplementary Table S5).
In the case of the δ form, the patterns recorded after one month or 12 months storage were practically superimposed to that recorded at time zero. After 24 months storage, small peaks were detected at 2
θ = 10.88°, 2
θ = 15.08° and 2
θ = 23.85°, attributable to the presence of traces of the β form (see
Supplementary Table S6).
Therefore, it can be stated that both polymorphic forms kept their solid-state characteristics for at least 12 months under accelerated stability conditions and likely for longer time at ambient conditions.
The stability of the δ form crystallized with different concentrations of PVP was also evaluated by DVS (
Figure S3 in Supplementary Materials). The PVP-free powder presented an isothermal change in weight of only 1% in the 5–95% RH interval. Powders containing higher concentrations of PVP tended to interact more with water vapor, showing a maximum of 2% of weight increase in the case of the powder containing 3% PVP. This was not unexpected given the hydrophilic nature of the polymer. Interestingly, none of the tested samples gave rise to hysteresis, suggesting reversible interaction with humidity as also indicated by the DSC traces recorded on the samples after DVS experiments (
Figure S4 in Supplementary Materials) that were practically superimposable on those recorded before humidity exposure.
3.5. Salbutamol Sulphate Deposition
Table 3 reports the aerosolization parameters of SS from adhesive mixtures prepared with α, β and δ mannitol polymorphs in comparison with those obtained from lactose MM50, aerosolized with RS01 device.
Different mannitol forms lead to different SS deposition profiles. The mixtures prepared with the β form afforded an almost complete delivery of the loaded dose (97.7%), while with the powders having the α form and lactose, almost 20% of the powder dose was retained in the inhaler device and in the capsule. Nevertheless, the emitted dose was high (>80%) in all cases. In terms of FPF, there was no significant difference between the α and β form-containing mixtures, which afforded values around 13%, while the mixture with the δ form gave rise to a lower deposition of fine particles on the impactor (p = 0.01 compared to both formulations with the α and β forms).
Despite the high emitted dose, most of the emitted powder was constituted by a coarse fraction as indicated by the percentage of the loaded dose deposited in the pre-separator: 38.64% ± 12.8% for blends with lactose, 47.41% ± 3.73% for the formulations with the δ form and 47.98% ± 14.23% and 51.81% ± 1.24% for the formulations with the α and β form, respectively.
When aerosolization was performed with the NESAT
® device (
Table 4), a trend similar to that already observed with RS01 was noticed. In general, the percentage of emitted dose was higher than with RS01, except for the mixture with mannitol β form, although the difference was not statistically significant. A better dispersibility of the lactose formulation was obtained with NESAT
® compared to RS01 (FPF 13.5 vs. 8.4).
On the other hand, as for the case of aerosolization with RS01®, it was confirmed that among mannitol polymorphs, the δ forms gave rise to adhesive mixtures with SS behaving in different manners and affording lower FPF (p = 0.04, p = 0.01 vs. β and α form, respectively).
The α and β forms had similar dispersibility regardless of the devices used, while, as already stated, some effect of the device type and resistance (although not dramatic) could be observed for formulations prepared with lactose MM50 and the mannitol δ form (increased dispersibility for lactose and decreased for mannitol δ passing from RS01 to NESAT).
A study from Kaialy and the coworkers [
8] indicated that there was a significant difference between recrystallised and commercial (β form) mannitol in terms of aerodynamic performances when salbutamol sulphate was used as a model drug. According to their in vitro aerodynamic test via multi-stage liquid impinger, FPF values of the SS blend with recrystalised mannitol were considerably higher than FPF of the SS blend with commercial mannitol [
8]. However, the investigation of the solid-state of their recrystalised mannitol showed that it was a mixture of α, β and δ forms and not a single solid phase. On the other hand, the study of Boshhiha and Urbanetz showed that no differences could be evidenced between commercial lactose and mannitol when SS was used as a model drug [
38].
Here we report a significant difference in FPF between lactose and mannitol both in the β and α form despite a nonsignificantly different MMAD.
3.6. Budesonide Deposition
The values relevant to the aerosolization performance of budesonide with RS01
® and NESAT
® devices are reported in
Table 5 and
Table 6, respectively. With both devices, trends similar to those already presented for SS were observed, with the only significant difference that, in the case of BUD, the values of FPD and FPF were much higher than those recorded for SS, while the MMADs were significantly smaller.
In detail, the BUD deposition profile from the RS01
® device were not significantly different between the α and β form, while the mixture BUD with the δ form resulted in a significantly lower deposition of fine particles on the impactor. The deposition profile from the MM50 mixture was significantly lower in terms of the fine particle fraction compared to the blends with the α and β forms (
p = 0.02,
p = 0.004, respectively). These results are partly in agreement with those reported in the study of Nokhodchi and coworkers who showed that the highest percentage FPF of budesonide was obtained with the formulation of mannitol compared to other carriers, and attributed this better aerosolization performance to the elongated shape of the carrier rather than to its specific surface chemistry [
8,
35].
With the NESAT® device, very similar figures were observed except for the performance of the mixture prepared with the mannitol α form that afforded significantly higher FPD and FPF relative to RS01®.
These results clearly indicate that the manipulation of the solid-state of mannitol can have an impact on the in vitro deposition of two model drugs in relevant adhesive mixtures. Formulations prepared with α and β polymorphs behaved similarly affording better aerosolization performance with respect to the formulations prepared with δ mannitol polymorphs or the reference lactose MM50. In the case of the β form, the better performance might be ascribed to the small particle size distribution and, in particular, to the greater percentage of micronized particles (see
Table 1). In fact, in the case mixtures with lactose, it is common knowledge that the presence of fine particles improves the aerosolization performance [
5,
18,
39]. However, this was not the case for the mixture prepared with mannitol α polymorphs that showed a particle size distribution practically superimposable to that of mannitol form δ. Thus, the differences observed among mannitol polymorphs performance may more likely be ascribed to the different characteristics of the particle solid state rather than to a physical property such as size, whereas this latter cannot be excluded
a priori when considering the comparison with lactose (Dv50 = 53 µm vs. nearly 23.05 µm for α and δ mannitol).
A final point worth mentioning is the role of the device resistance on the aerosolization performance. As already highlighted, this did not seem to play a significant role in the case of adhesive mixtures prepared with the various mannitol forms containing either SS or BUD; however, mixtures prepared with lactose MM50 deserve particular attention. Similar mixtures with SS and BUD were also investigated by Della Bella et al. [
18] using a Turbospin
® device at a flow of 70 Lmin
−1. Therefore, by combining the data reported in this work with those of Della Bella et al., it is possible to study the correlation between resistance of the device (calculated according to Equation (3)) and FPF for both SS and BUD (
Figure S4). In agreement to data reported by Hassoun et al. [
37], no correlation seemed to exist for the hydrophilic model drug SS (
Figure S4, panel a), while a clear linear correlation (R
2 = 0.997) was highlighted for the lipophilic drug BUD (
Figure S4 panel b).
3.7. Preliminary Cell Toxicity Evaluation
As previously stated, although the use of PVA in a specific formulation for inhalation has been proposed [
34], no data have been reported about compatibility of this excipient toward lung epithelial cells. In addition, it is worth underlying that that neither PVA nor PVP have yet been approved as excipients for inhalation. Moreover, taking into consideration the particle size distribution of the mannitol powders proposed here as carriers for inhalation (
Table 1), it would not be unlikely that some small carrier particles would reach the lung while the biggest ones would deposit in the oropharynx and be swallowed. Thus, it is worth raising a concern about the possible toxic effect of the two polymers at the adopted concentration in the mannitol carrier.
As reported from our experiments, the concentrations of mannitol, PVP or PVA to be tested were based on the estimate of the amount of each component potentially reaching the lungs following an inspiration from a capsule loaded with about 20 mg of excipient, which, on the base of the in vitro aerosolization results, was set at 2 mg. It was assumed that this amount would dissolve in the available volume of the lung lining fluid, which has been reported to range between 10 and 30 mL [
33]. A worst-case scenario (more concentrated solution) was assumed; thus, 0.2 mg/mL mannitol was considered as reference concentration to be evaluated in the cell viability assay. PVP and PVA alone were taken as references and tested at concentrations of 2 μg/mL and 4 μg/mL, respectively, reflecting their relative ratios with mannitol in the carrier particle (1%
w/
w and 2%
w/
w, respectively).
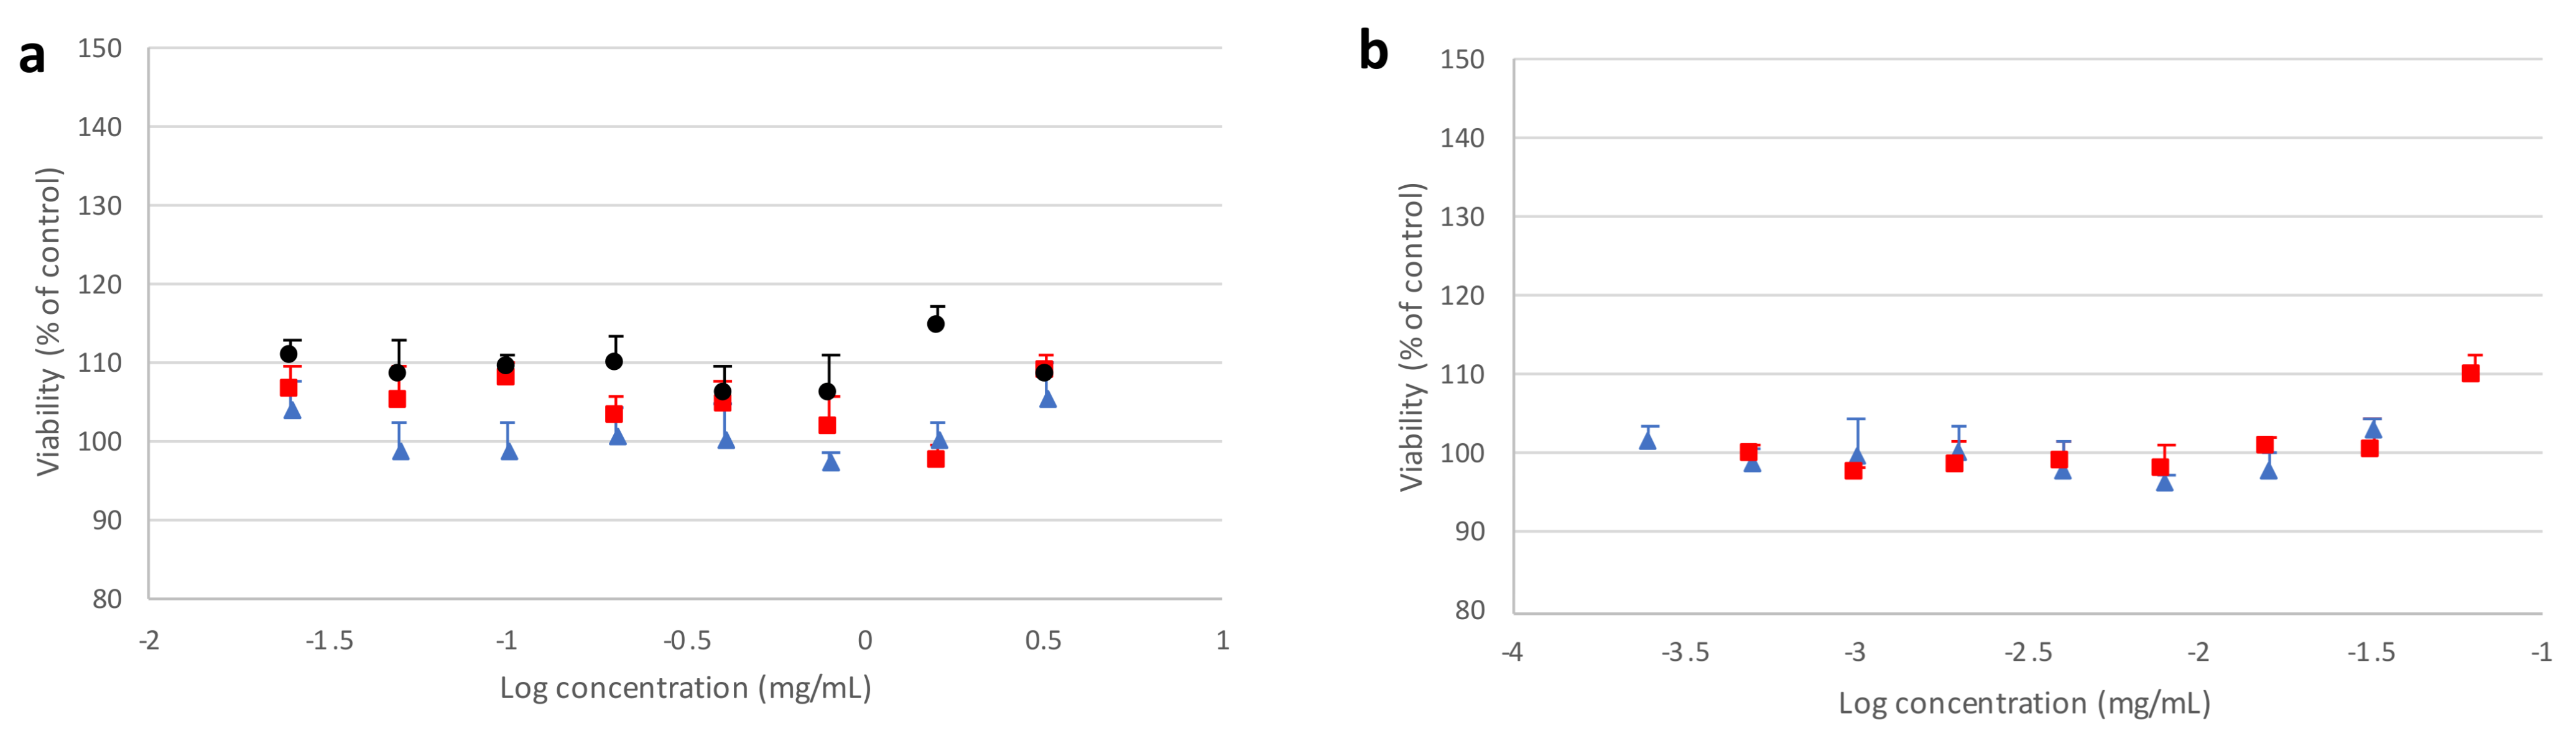
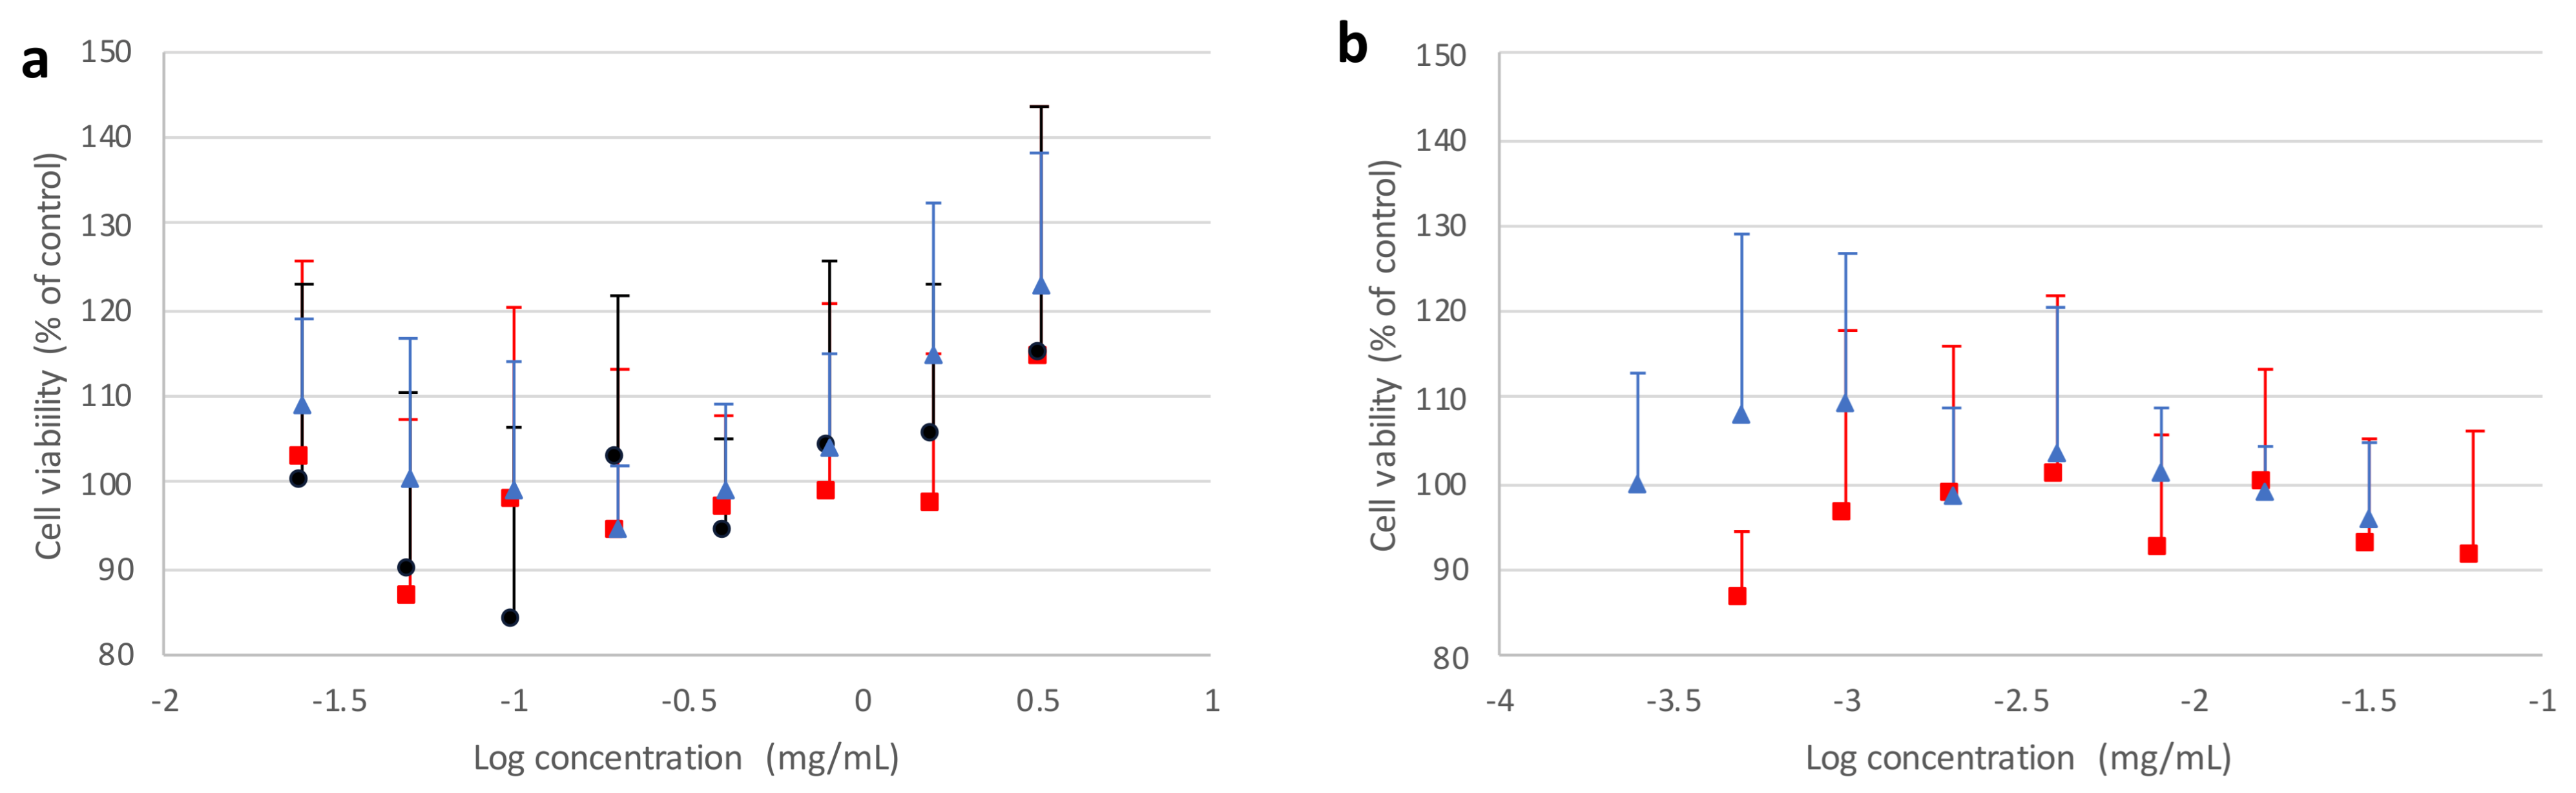
Figure 9 and
Figure 10 report, respectively, cell viability values obtained from the MTT assay after incubating Calu3 or A549 cell lines in the presence of different forms of mannitol for 24 h, as well as PVP and PVA alone, with respect to the untreated control.
It can be observed that the crystallized mannitol polymorphs had no deleterious effect on cell viability, as no significant difference could be detected between control cells and treated cells at all concentrations considered, up to 8 times above the reference value (0.2 mg/mL), which was estimated as a “worst case scenario” concentration. For A549 cell line (
Figure 10), a generally higher variability was observed on viability, which never fell below 85% with respect to control and increased with higher concentrations of mannitol polymorphs, confirming that no cytotoxic effects were ascribable to excipients. These results suggest that not only the recrystallized mannitol, but also PVA and PVP, could be considered as relatively safe excipients for lung administration, thus adding further support to data previously reported in the literature for PVA [
40,
41] and PVP [
42,
43,
44].


 ,
, 


