Article

Imaging-Based Characterization of a Slco2b1(-/-) Mouse Model Using [11C]Erlotinib and [99mTc]Mebrofenin as Probe Substrates

1
Laboratoire d’Imagerie Biomédicale Multimodale, BIOMAPS, Service Hospitalier Frédéric Joliot, Université Paris-Saclay, CEA, CNRS, Inserm, 4 Place du Général Leclerc, 91401 Orsay, France
2
Département de Pharmacie Clinique, Faculté de Pharmacie, Université Paris-Saclay, 92296 Châtenay-Malabry, France
3
AP-HP, Université Paris-Saclay, Hôpital Bicêtre, Pharmacie Clinique, 94270 Le Kremlin Bicêtre, France
4
Department of Clinical Pharmacology, Medical University of Vienna, 1090 Vienna, Austria
5
Division of Pharmaceutics and Pharmacology, College of Pharmacy, The Ohio State University, Columbus, OH 43210, USA
6
Department of Biomedical Imaging and Image-guided Therapy, Medical University of Vienna, 1090 Vienna, Austria
*
Author to whom correspondence should be addressed.
These authors contributed equally to this work.
Pharmaceutics 2021, 13(6), 918; https://doi.org/10.3390/pharmaceutics13060918
Submission received: 10 May 2021 / Revised: 9 June 2021 / Accepted: 17 June 2021 / Published: 21 June 2021

Abstract

:
Organic anion-transporting polypeptide 2B1 (OATP2B1) is co-localized with OATP1B1 and OATP1B3 in the basolateral hepatocyte membrane, where it is thought to contribute to the hepatic uptake of drugs. We characterized a novel Slco2b1(-/-) mouse model using positron emission tomography (PET) imaging with [11C]erlotinib (a putative OATP2B1-selective substrate) and planar scintigraphic imaging with [99mTc]mebrofenin (an OATP1B1/1B3 substrate, which is not transported by OATP2B1). Dynamic 40-min scans were performed after intravenous injection of either [11C]erlotinib or [99mTc]mebrofenin in wild-type and Slco2b1(-/-) mice. A pharmacokinetic model was used to estimate the hepatic uptake clearance (CL1) and the rate constants for transfer of radioactivity from the liver to the blood (k2) and excreted bile (k3). CL1 was significantly reduced in Slco2b1(-/-) mice for both radiotracers (p < 0.05), and k2 was significantly lower (p < 0.01) in Slco2b1(-/-) mice for [11C]erlotinib, but not for [99mTc]mebrofenin. Our data support previous evidence that OATP transporters may contribute to the hepatic uptake of [11C]erlotinib. However, the decreased hepatic uptake of the OATP1B1/1B3 substrate [99mTc]mebrofenin in Slco2b1(-/-) mice questions the utility of this mouse model to assess the relative contribution of OATP2B1 to the liver uptake of drugs which are substrates of multiple OATPs.

Graphical Abstract

1. Introduction

Organic anion-transporting polypeptides (OATPs) belong to the solute carrier (SLC) superfamily of transporters and are involved in the tissue uptake of endogenous compounds and many clinically used drugs [1]. OATP2B1 (encoded by the SLCO2B1 gene) is one important member of the OATP family and has a rather broad tissue expression profile including the small intestine, liver, kidneys, brain, heart, lungs and skeletal muscle [2,3,4,5,6]. Several drugs have been identified in vitro as substrates of OATP2B1, which is believed to be involved in the intestinal absorption of orally administered drugs. Clinically relevant OATP2B1-mediated food–drug interactions have been reported with certain fruit juices which contain OATP2B1-inhibiting components (e.g., naringin), leading to decreased systemic exposure of OATP2B1 substrate drugs (e.g., fexofenadine, aliskiren and celiprolol) [7,8,9]. OATP2B1 is co-localized with OATP1B1 (SLCO1B1) and OATP1B3 (SLCO1B3) in the basolateral/sinusoidal membrane of hepatocytes, where it is believed to mediate the hepatic uptake of drugs from the systemic circulation and thereby contribute to their hepatic clearance. However, OATP2B1 shows a largely overlapping substrate profile with OATP1B1/1B3, meaning that most drugs have a low fraction transported (ft) by OATP2B1 at the basolateral hepatocyte membrane (ft equals the ratio of the hepatic uptake clearance of a drug by OATP2B1 to the total hepatic uptake clearance) [10]. Due to the lack of clinically validated OATP2B1-selective inhibitors, the role of OATP2B1 in the hepatic disposition of drugs has remained elusive thus far. OATP2B1 has been defined by the International Transporter Consortium as a transporter of emerging clinical importance [11]. It has been recommended that the interaction of drugs with OATP2B1 has to be evaluated when there is in vivo evidence of intestinal or hepatic transport that cannot be attributed to other well-known mechanisms [11].
A step forward in efforts to better understand the intrinsic role of OATP2B1 in drug disposition has been the recent generation of Slco2b1(-/-) mice [12,13]. A first characterization of these novel mouse models revealed significantly lower plasma concentrations of orally administered fexofenadine and fluvastatin in Slco2b1(-/-) mice as compared with wild-type mice, which supported a role of OATP2B1 in the intestinal absorption of these drugs [12,13]. In an attempt to address the role of hepatic OATP2B1, the plasma pharmacokinetics (PK) of fluvastatin were also studied after intravenous (i.v.) administration, which failed to reveal significant differences between Slco2b1(-/-) and wild-type mice [13]. Given that liver concentrations may be a better indicator than plasma concentrations of the influence of OATP2B1 on the hepatic uptake of drugs, investigators also measured fluvastatin liver concentrations in Slco2b1(-/-) and wild-type mice after oral drug administration [13]. However, neither liver concentrations nor liver-to-plasma concentration ratios differed between the two mouse strains. These measurements were only made at one single and late time point after oral drug administration (4 h) and may have therefore failed to reveal the contribution of OATP2B1 to the initial hepatic uptake of fluvastatin.
Molecular imaging methods, such as positron emission tomography (PET), single-photon emission computed tomography (SPECT) or planar scintigraphic imaging, can be used to dynamically and non-invasively measure the organ and tissue PK of radiolabeled drugs in animals and humans [14]. This approach has been termed as PK imaging and has proven suitable to assess the influence of membrane transporters on drug tissue distribution and excretion [14]. With dynamic acquisition and dedicated compartmental PK models, quantitative parameters describing drug transfer across biological membranes can be obtained, which can be related to the activity of different membrane transporters [15,16,17].
The aim of the present work was to further characterize a novel Slco2b1(-/-) mouse model [13], with an emphasis on the role of OATP2B1 in the tissue distribution of its substrates. To this end, we used PET imaging with the putative OATP2B1-selective probe substrate [11C]erlotinib [18,19] and planar scintigraphic imaging with the OATP1B1/1B3 probe substrate [99mTc]mebrofenin [20,21,22]. A previously developed PK model was employed to assess the role of OATP2B1 in the hepatobiliary disposition of the employed radiotracers [15].

2. Materials and Methods

2.1. Radiotracers

[11C]erlotinib was synthetized as described previously [23]. The radiochemical purity was >98%, and the molar activity at the time of injection was 13.6 ± 7.9 GBq/µmol. Commercial kits of mebrofenin (Cholediam®) were a gift from Mediam (Marcq en Baroeul, France). Each kit was labeled with a sodium [99mTc]pertechnetate eluate (148 MBq/mL) obtained from a sterile 99Mo/99mTc generator (Tekcis®, distributed by GE Healthcare, Buc, France) followed by quality control according to the manufacturer’s recommendations.

2.2. Animals

Male adult wild-type (n = 10) and Slco2b1(-/-) (n = 9) mice with a C57BL/6N background were obtained via the University of California, Davis Knockout Mouse Project (KOMP) Repository (www.komp.org) as a gift from the Ohio State University (Columbus, OH, USA), where the transporter-deficient mouse model was generated as described previously [13]. At the time of the experiments, wild-type and Slco2b1(-/-) mice weighed 29.3 ± 5.0 g and 33.2 ± 2.4 g, respectively. All mice were housed in a temperature- and humidity-controlled environment with a 12-h light/dark cycle and received a standard diet and water ad libitum. All animal experiments were performed in accordance with the recommendations of the European Community (2010/63/UE) and the French National Committees (law 2013–118) for the care and use of laboratory animals. The experimental protocol was approved by a local ethics committee for animal use (CETEA) and by the French Ministry of Agriculture (APAFIS: 7466-2016110417049220 v3, accepted on 21 December 2018).

2.3. PET and Planar Scintigraphic Imaging

Mice were anesthetized with isoflurane (3.0% for induction, 1.5–2.5% for maintenance) in 100% oxygen, and a catheter was inserted into the caudal tail vein for i.v. radiotracer injection. PET imaging was performed using an Inveon® microPET system (Siemens, Knoxville, TN, USA). Following i.v. injection of [11C]erlotinib (7.6 ± 1.1 MBq, corresponding to 0.36 ± 0.37 µg of unlabeled erlotinib), a dynamic PET scan was acquired over 40 min. Dynamic PET data were sorted into 20 frames with time durations of 3 × 0.5 min, 5 × 1 min, 5 × 2 min, 3 × 3 min, 3 × 4 min and 1 × 2.5 min.
[99mTc]mebrofenin planar scintigraphic imaging was performed using a clinical Symbia® SPECT-CT camera (Siemens) with a low-energy high-resolution (LEHR) collimator. Mice were i.v. injected with [99mTc]mebrofenin (7.2 ± 0.2 MBq) followed by dynamic planar acquisitions. Dynamic images were reconstructed in 54 frames with time durations of 20 × 0.25 min, 10 × 0.5 min, 20 × 1 min and 4 × 2 min.

2.4. Analysis of PET Data

Volumes of interest for the left ventricle of the heart (image-derived arterial blood curve), liver, intestine (representing all the visible intestinal radioactivity), brain, myocardium, skeletal muscle (quadriceps femoris muscle), left kidney and right lung were manually outlined on the reconstructed PET images with the software AMIDE [24]. We assumed that radioactivity in the intestine predominantly represented excreted bile and that no direct secretion of [11C]erlotinib from blood into the intestine occurred during the short duration of the PET scan (40 min). The approach for obtaining an image-derived blood curve has been previously validated by correlating image-derived with sampled blood radioactivity concentrations [25]. Time–activity curves (TACs) were extracted for each volume of interest and were expressed in percent of injected dose per mL (%ID/mL) for all examined tissues except for the intestine, for which radioactivity was expressed as %ID (by multiplication of the image-derived radioactivity concentration with the volume of interest). For PK modeling purposes, the TACs were represented in megabecquerel per mL (MBq/mL) for the blood and liver and in MBq for the intestine.
The area under the TAC (AUC, %ID/mL x min) was calculated for each selected volume of interest using Prism Software, Version 8.4 (GraphPad, La Jolla, CA, USA). In order to assess the distribution of [11C]erlotinib to the brain, myocardium, skeletal muscle, liver, kidneys and lungs, the tissue-to-blood AUC ratios (AUCtissue/AUCblood) were calculated. AUCblood was calculated from the image-derived blood curve from the left ventricle of the heart. In addition, the tissue uptake rate constants (kuptake,tissue, mL/min/mL tissue) of radioactivity were estimated using integration plot analysis [26] by employing the following equation:
X t , tissue C t , blood = k uptake , tissue × AUC 0 t , blood C t , blood + V E , tissue
where Xt,tissue is the amount of radioactivity per milliliter tissue at time t, Ct,blood is the radioactivity concentration in the blood (image-derived blood curve) at time t, AUC0−t,blood is the blood AUC from time 0 to time t and VE,tissue is the y-intercept of the integration plot. kuptake,tissue represents the slope of the early linear part of the integration plot and is estimated by performing linear regression analysis.

2.5. Analysis of Planar Scintigraphy Data

Images were analyzed with PMOD® software (version 3.9, PMOD Technologies LLC, Zürich, Switzerland) as described in a previous study in rats [27]. Regions of interest were manually drawn over the liver, intestine (assumed to represent excreted bile) and whole heart (image-derived blood curve). Corresponding TACs were generated by plotting the mean radioactivity counts (counts per second, cps) in each region of interest normalized to the injected radioactivity amount in each animal (cps/MBq) versus time. For PK modeling purposes, the TACs were represented in cps per milliliter for the blood (by dividing the radioactivity in the whole heart region of interest by the volume of the heart adjusted for body weight obtained from the literature [28]) and in cps for the liver and the intestine.

2.6. Pharmacokinetic Modeling

A three-compartment model (Figure S1), modified from a previously developed model [15], was implemented to estimate the PK parameters defining the transfer of radioactivity between tissue compartments. CL1 (mL/min) represents the hepatic uptake clearance, and k2 (min−1) and k3 (min−1) are the rate constants describing the transfer of radioactivity from hepatocytes into blood and from hepatocytes into excreted bile, respectively. The model accounts for radiotracer delivery to the liver via both the hepatic artery and the portal vein. The radioactivity concentration in the hepatic artery was assumed to correspond to the image-derived arterial blood curve, while the concentration in the portal vein was mathematically estimated during the modeling process as previously described [15]. The final flow-weighted dual-input TAC was generated using a hepatic arterial flow fraction of 0.17 [28]. The ft by OATP2B1 of [11C]erlotinib in the mouse liver was calculated as (CL1,wild-type - CL1, Slco2b1(-/-))/CL1,wild-type.

2.7. Statistical Analysis

Statistical analysis was performed in Graphpad Prism Software. The Shapiro–Wilk normality test was used to assess the normal distribution of the data. Differences in PK parameters between wild-type and knockout mice were assessed using the Mann–Whitney U test. The level of statistical significance was set to a p-value of less than 0.05. All values are given as mean ± standard deviation (SD).

3. Results

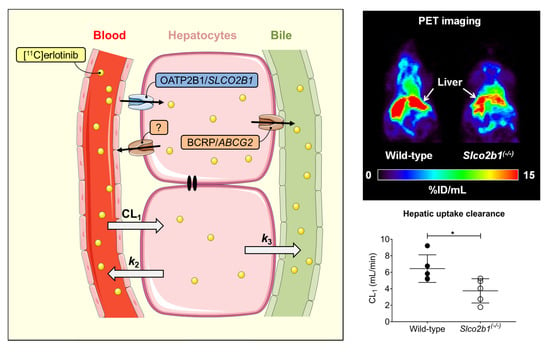
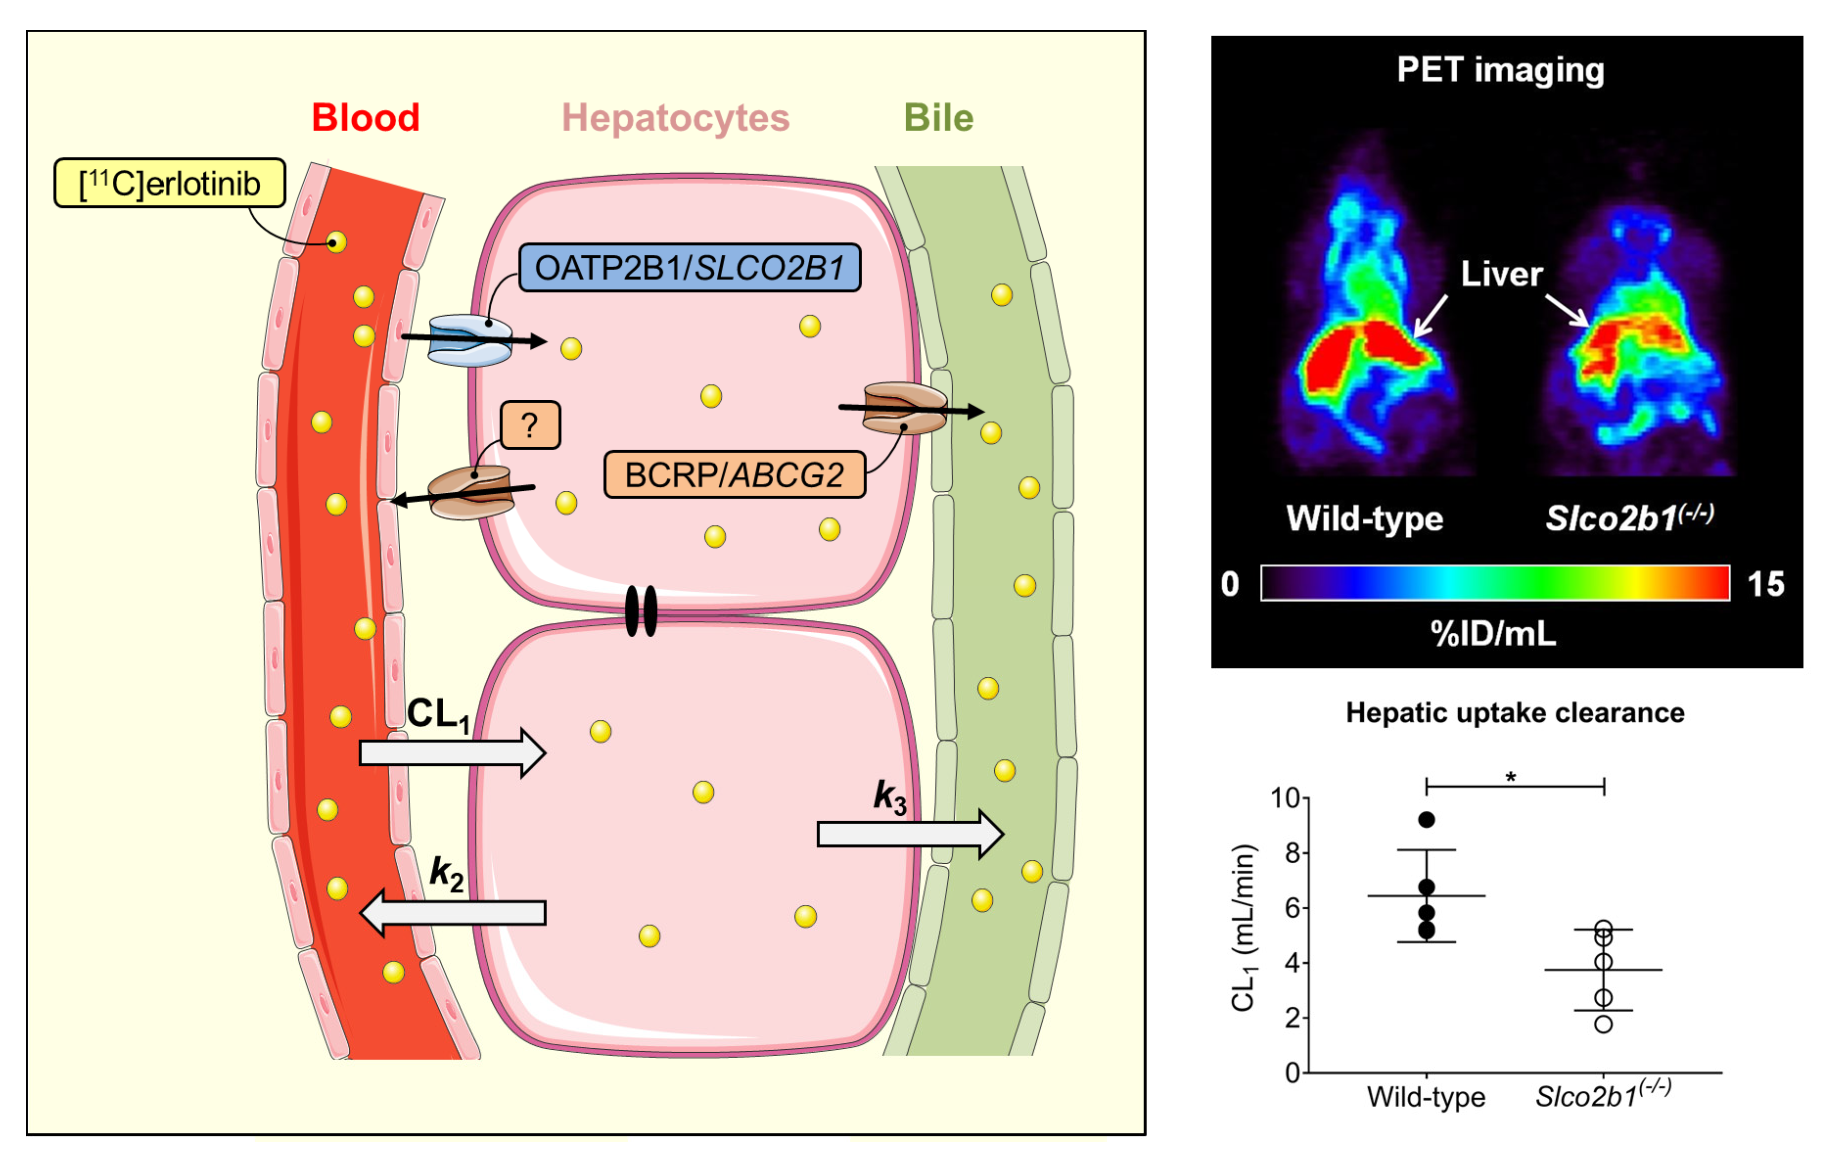
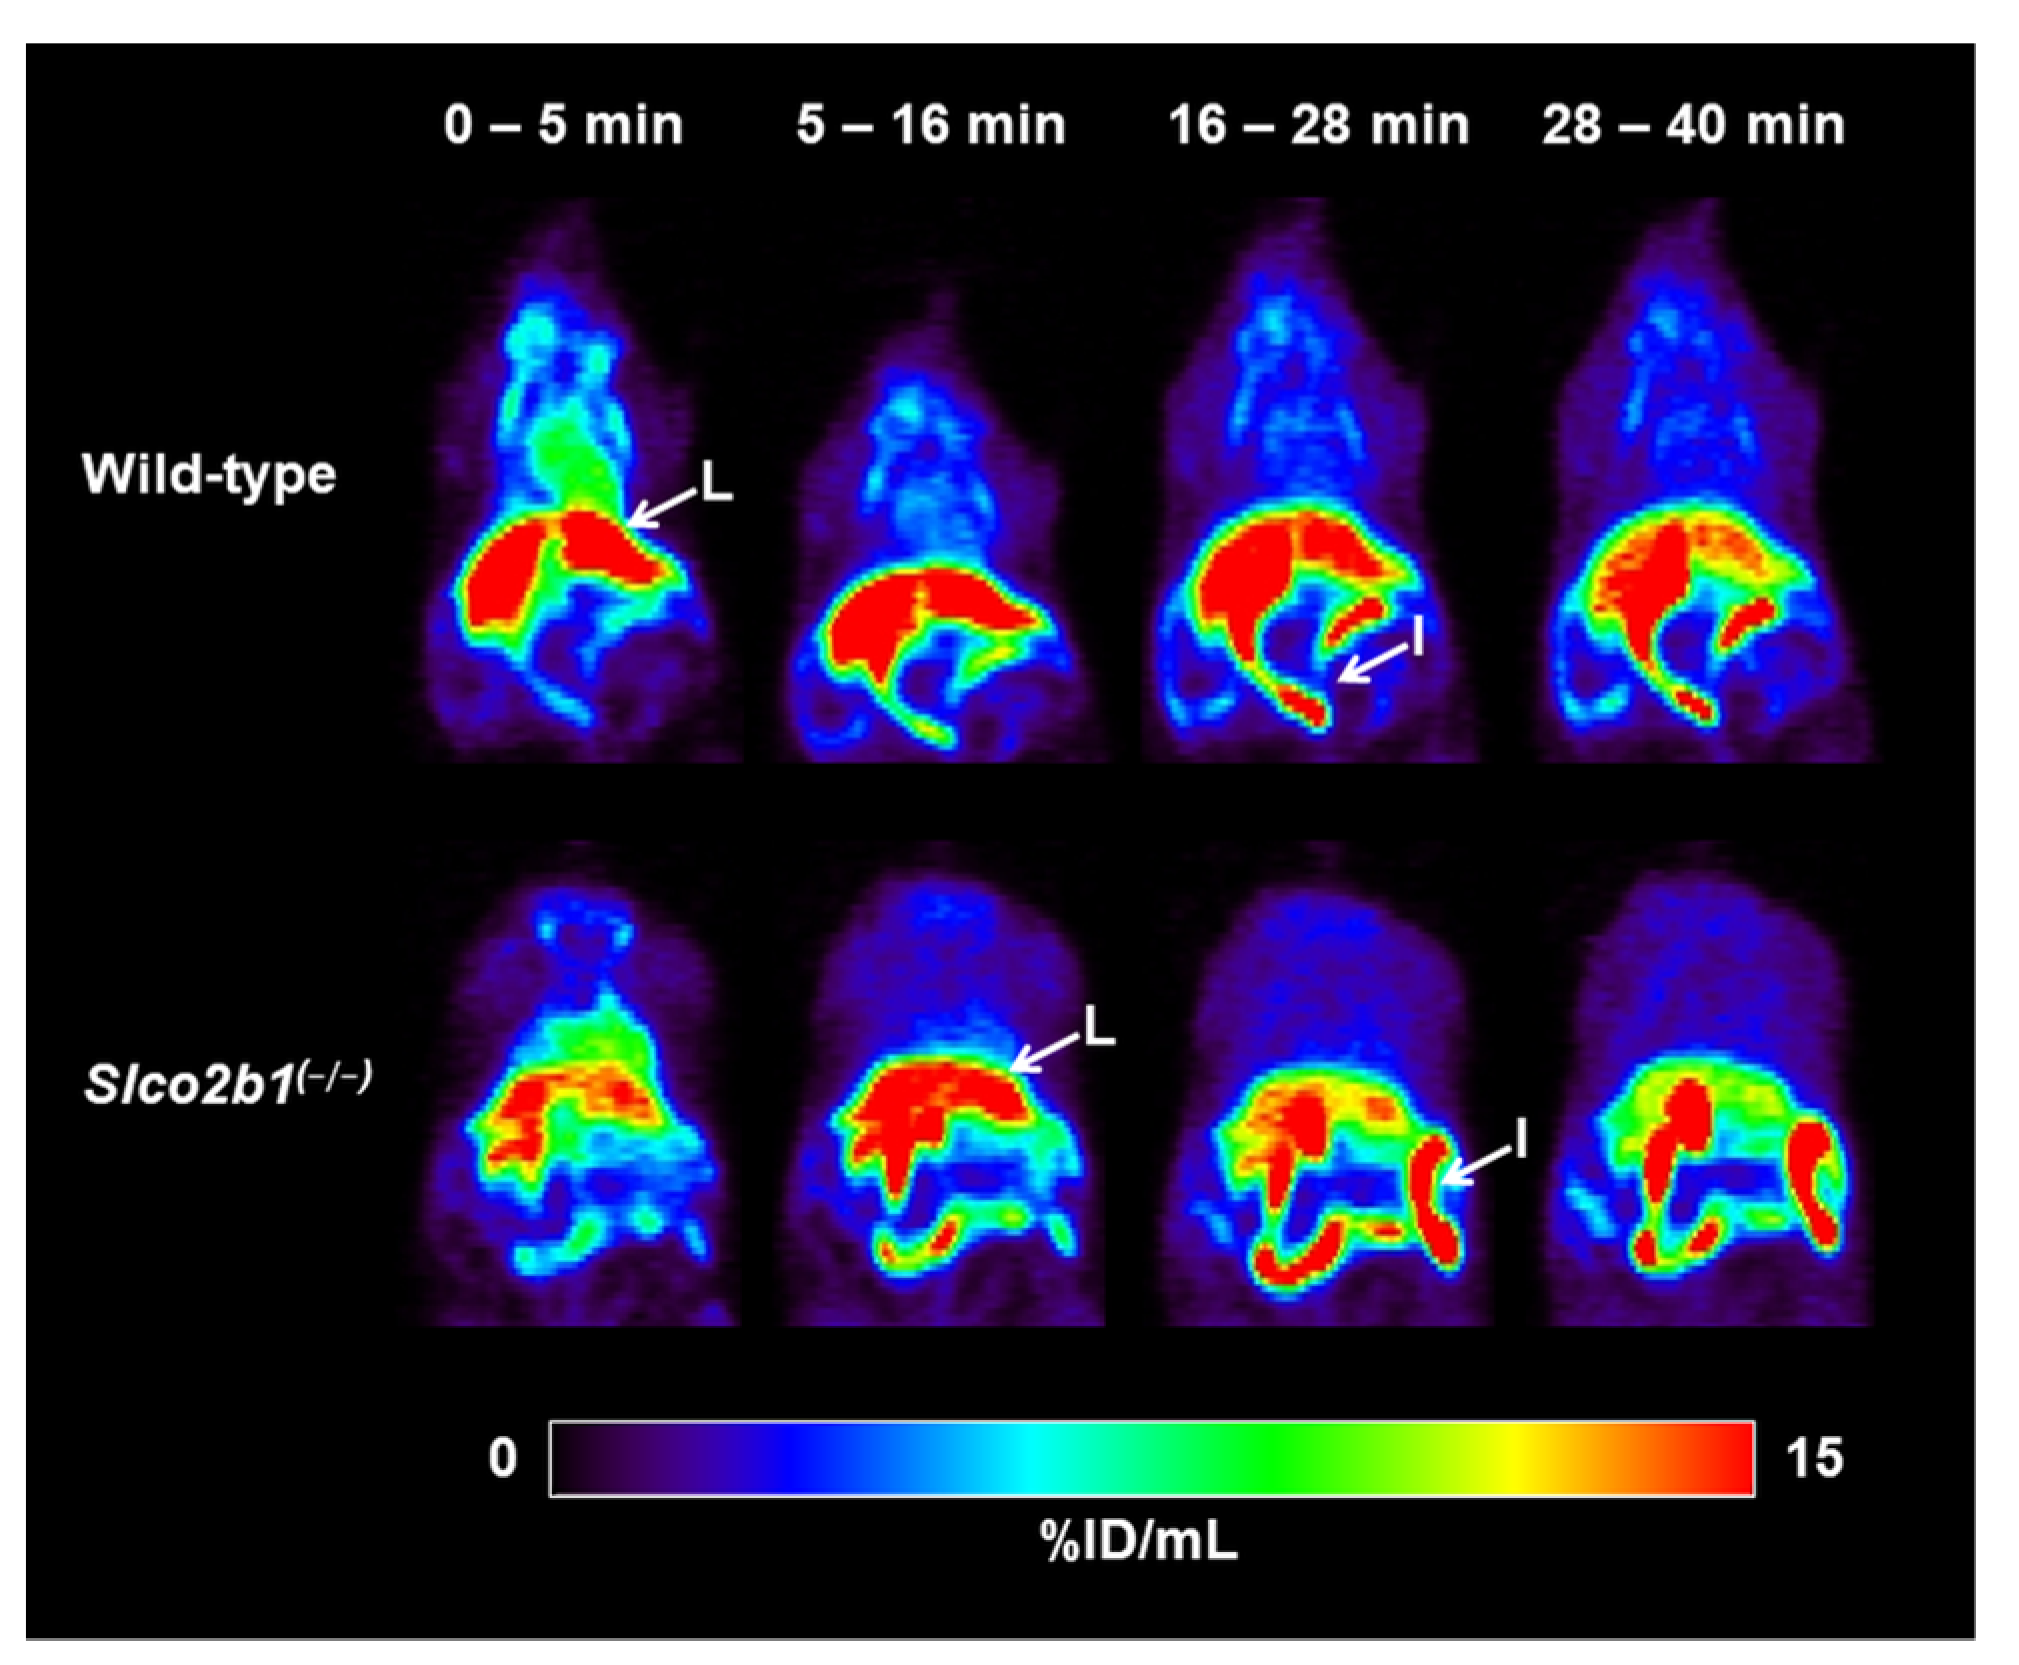
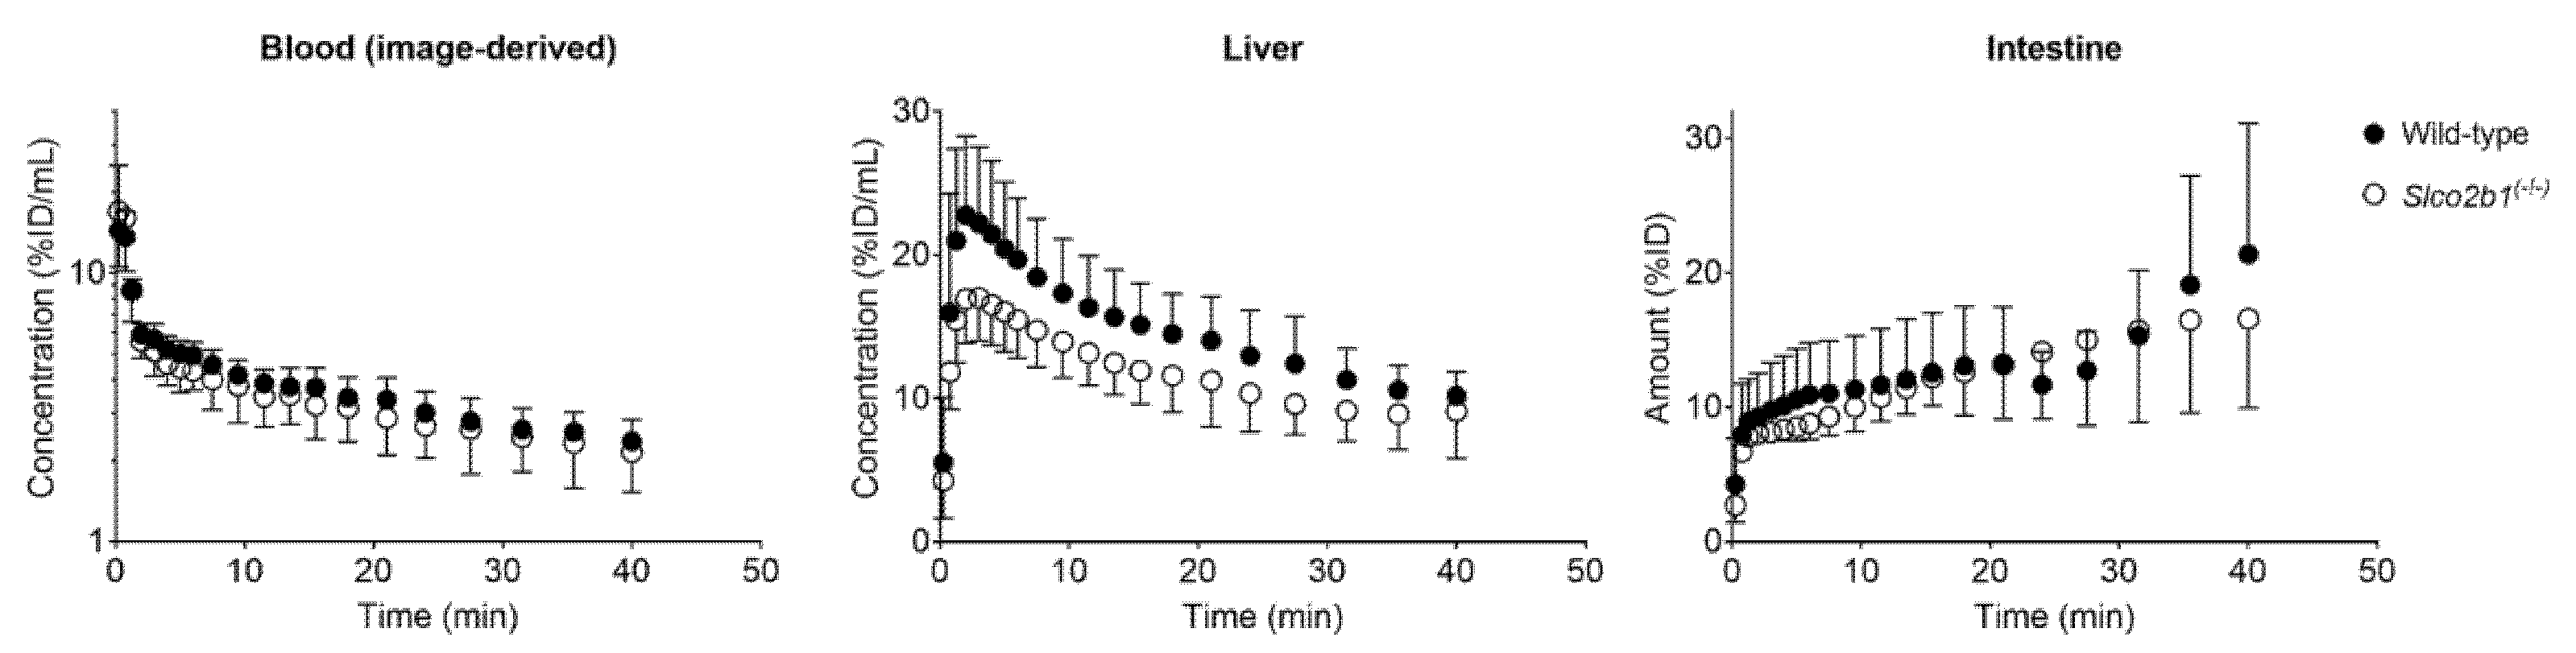
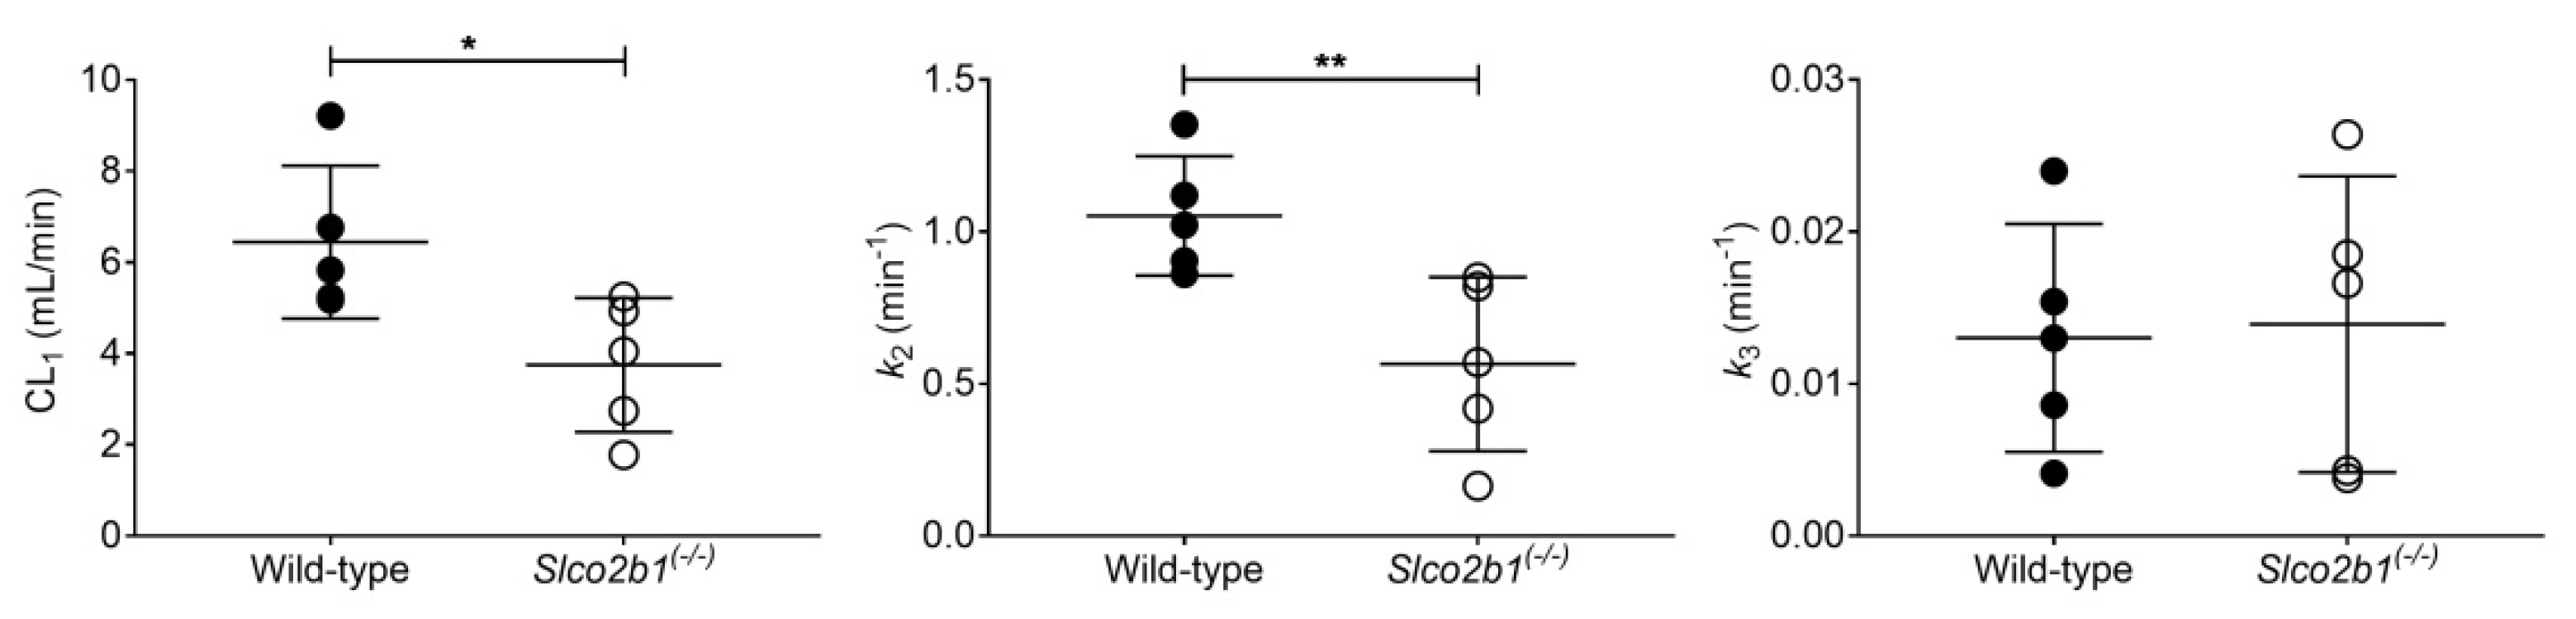
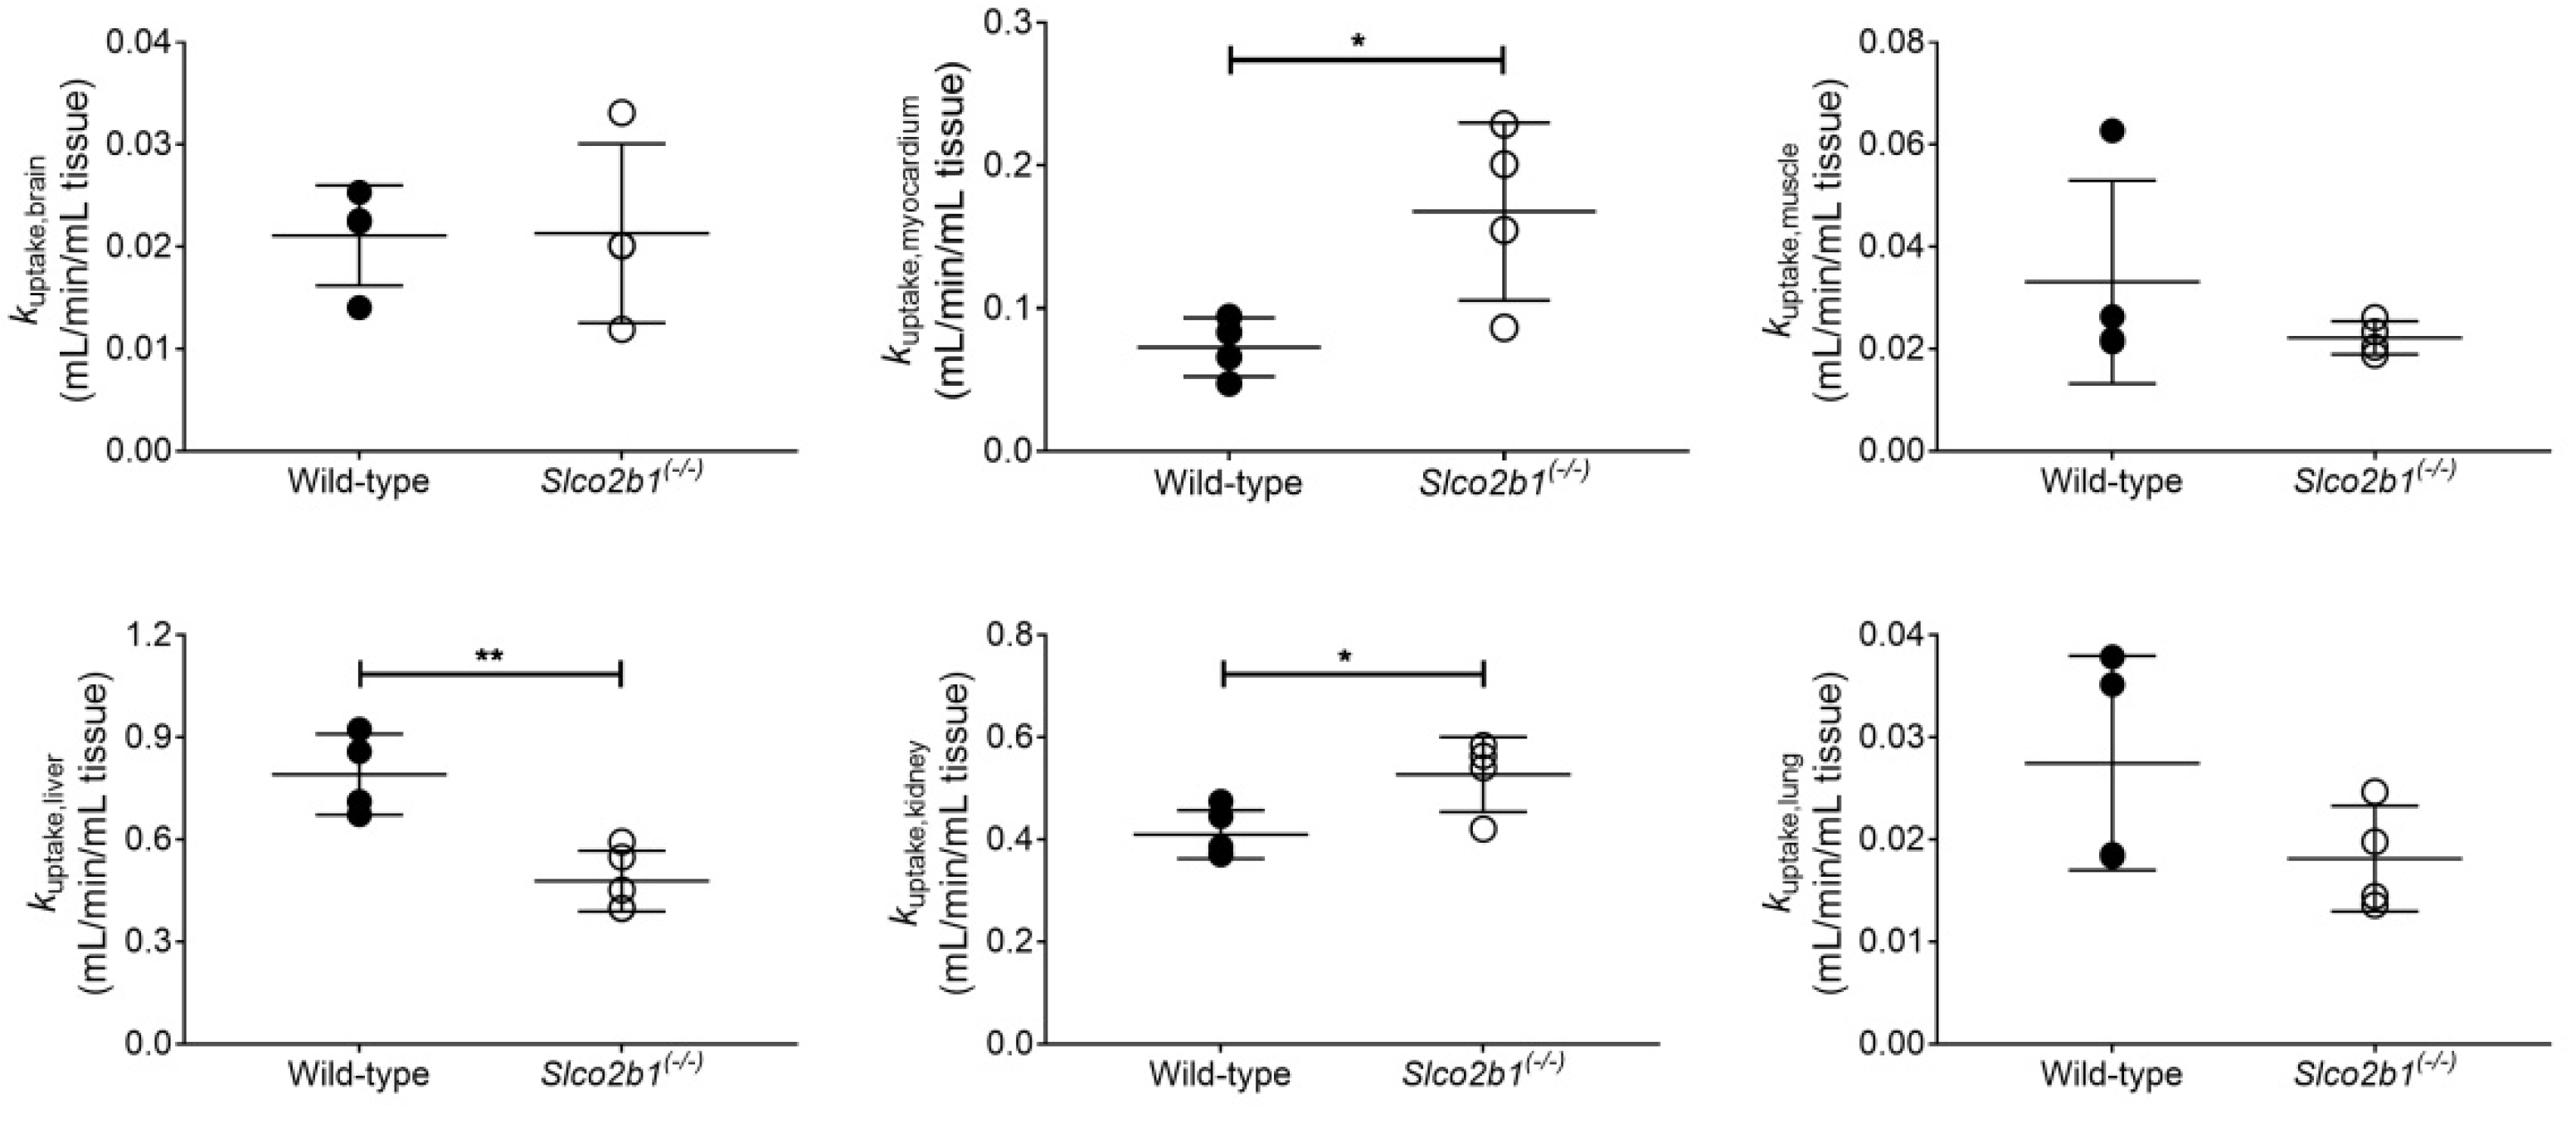
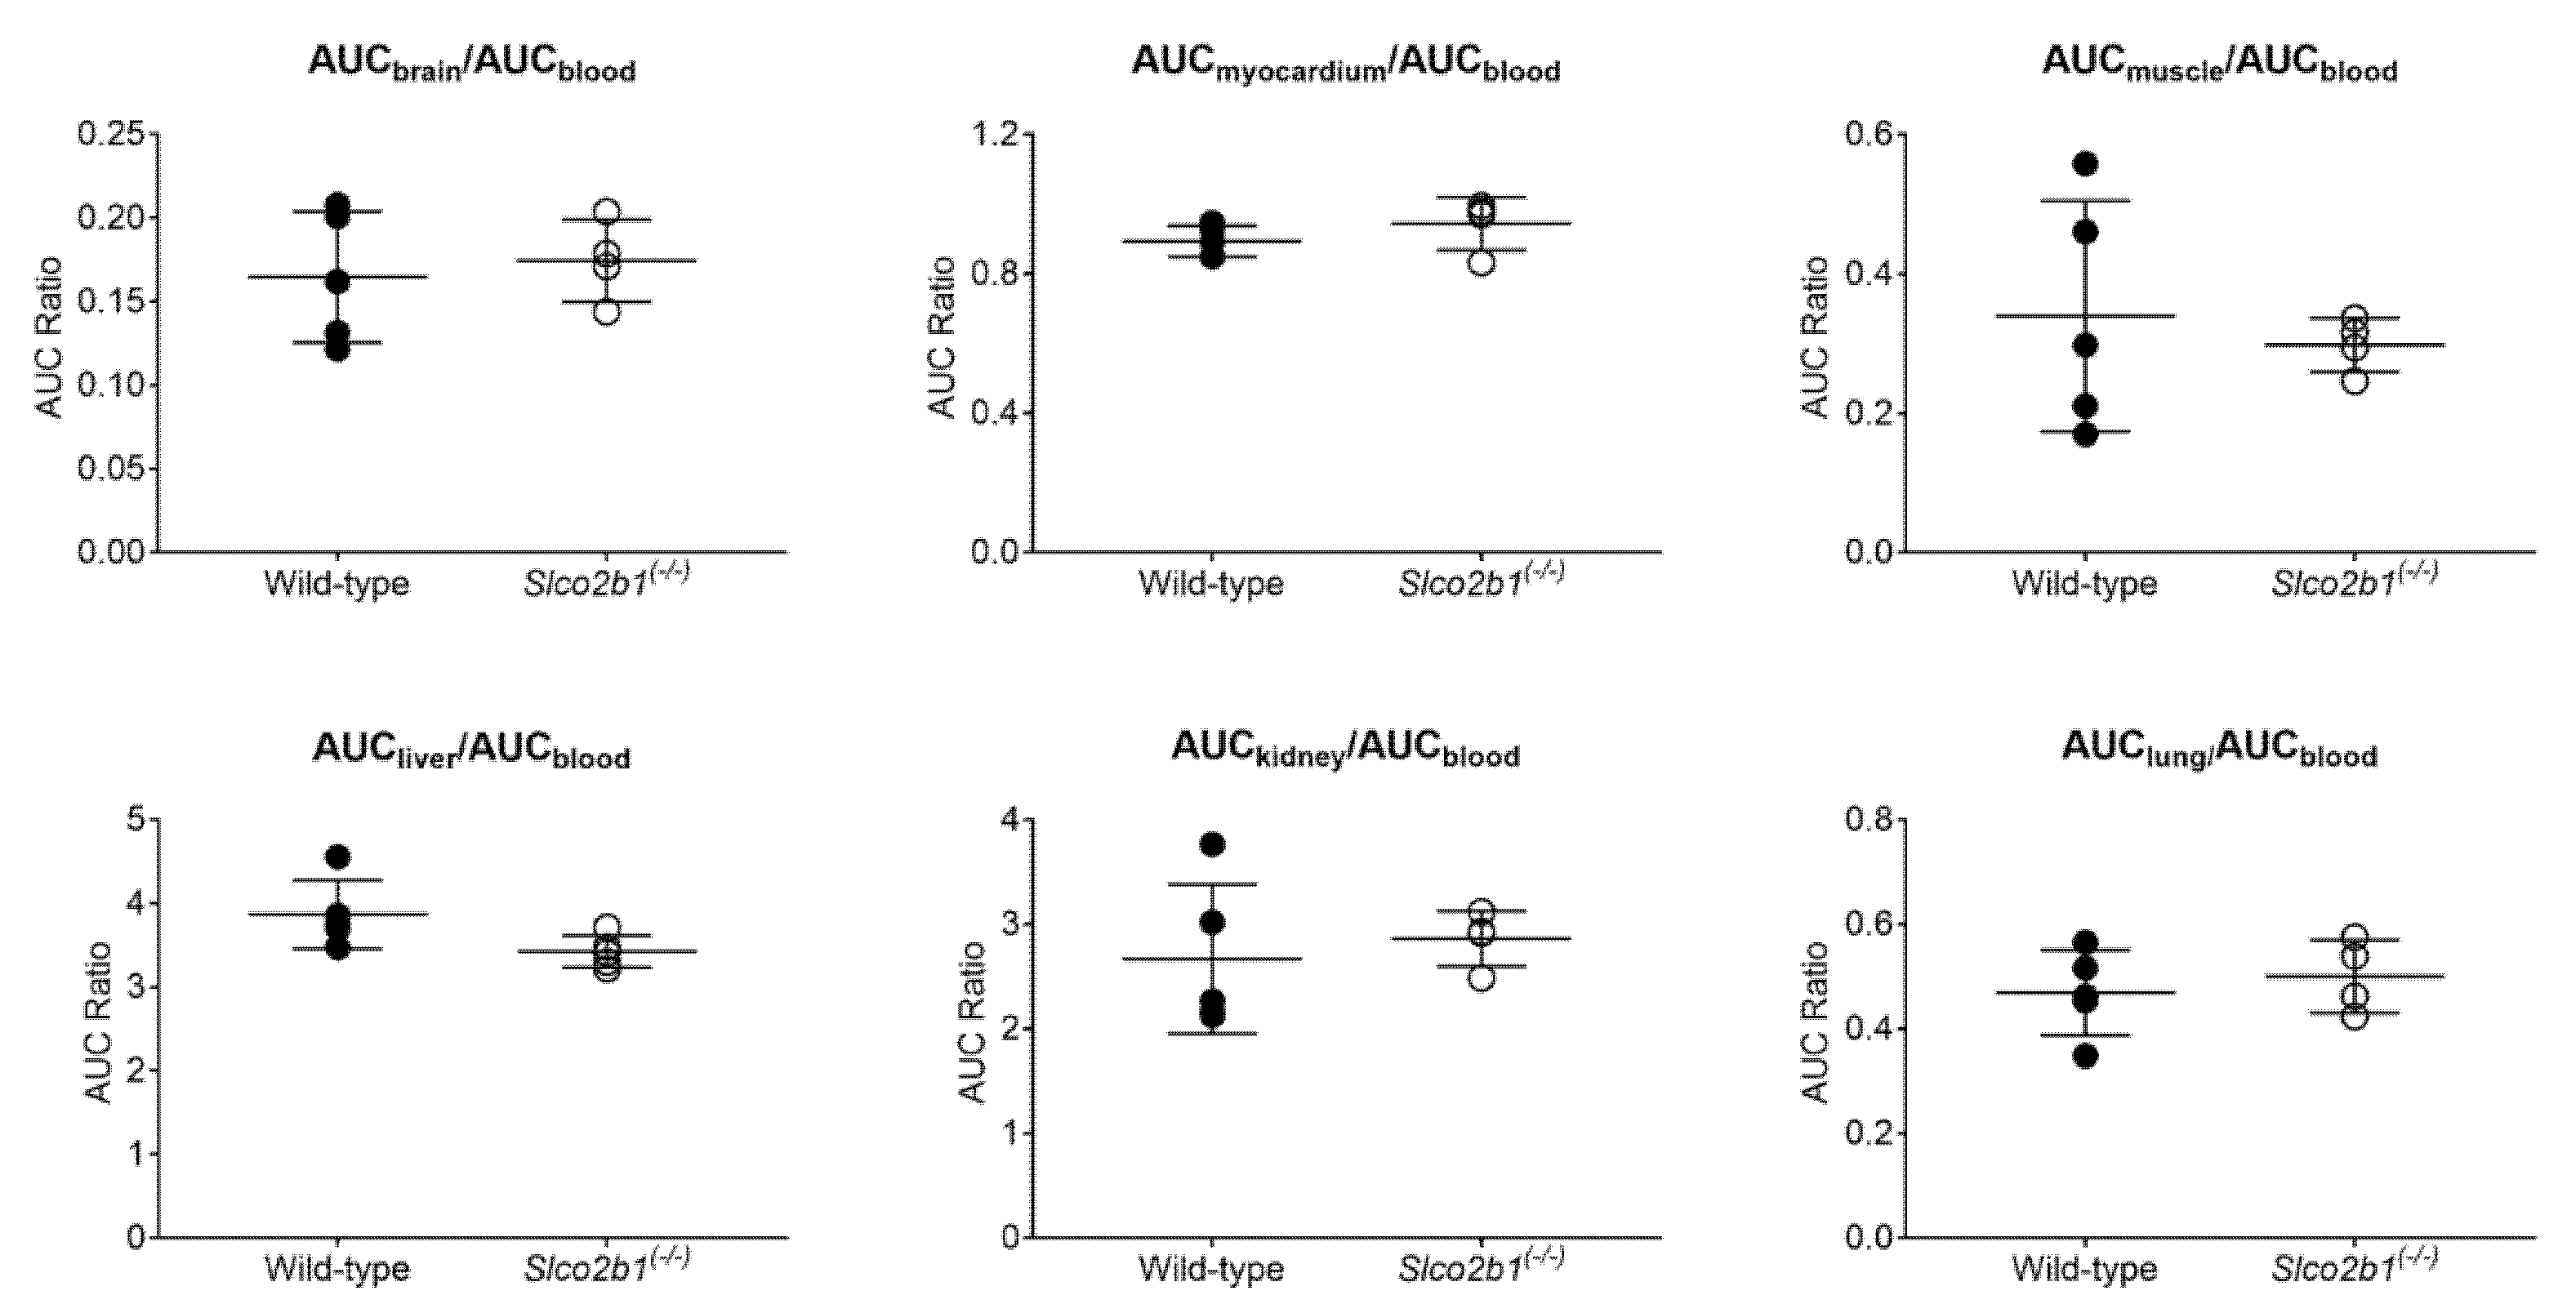
3.1. Influence of OATP2B1 on the Hepatobiliary Disposition of [11C]erlotinib

Wild-type and Slco2b1(-/-) mice underwent dynamic PET scans with [11C]erlotinib. Serial PET images of one representative wild-type mouse and one representative Slco2b1(-/-) mouse showed that, after i.v. injection of [11C]erlotinib, radioactivity was rapidly taken up into the liver followed by excretion into the intestine (Figure 1). Mean TACs in the blood (image-derived blood curve from the left ventricle of the heart), liver and intestine are shown in Figure 2.
Radioactivity concentrations were moderately decreased in the liver of Slco2b1(-/-) mice as compared to wild-type mice, while blood and intestinal TACs were similar in both mouse strains.
A PK model (Figure S1) was implemented to estimate the uptake clearance of radioactivity from the blood into the liver (CL1), as well as the rate constants for the transfer of radioactivity from the liver back to the blood (k2) and from the liver to the intestine (k3). Visually, the model provided good fits of the measured liver and intestinal TACs of [11C]erlotinib (Figure S2), and parameter precision (calculated as percent coefficient of variation, %CV) was acceptable (Table 1). CL1 and k2 were significantly decreased in Slco2b1(-/-) mice by 1.7-fold and 1.9-fold, respectively, as compared to wild-type mice, while no significant differences were observed for k3 between knockout and wild-type mice (Figure 3). The decrease in CL1 in Slco2b1(-/-) mice corresponds to an ft by OATP2B1 of [11C]erlotinib in the mouse liver of 0.42.
In addition, we assessed the influence of OATP2B1 on the distribution of [11C]erlotinib to other organs and tissues of interest (Figure 4 and Figure 5). The liver uptake rate constant (kuptake,liver), estimated by integration plot analysis, was significantly reduced in Slco2b1(-/-) mice (Figure 4), which was in good agreement with the observed reduction in CL1 (Figure 3).
The myocardium and kidney uptake rate constants (kuptake,myocardium and kuptake,kidney) were significantly increased in Slco2b1(-/-) mice. The other tissue uptake rate constants (kuptake,brain, kuptake,muscle and kuptake,lung) did not differ between knockout and wild-type mice (Figure 4). Moreover, none of the tissue-to-blood AUC ratios were significantly different between Slco2b1(-/-) and wild-type mice (Figure 5).

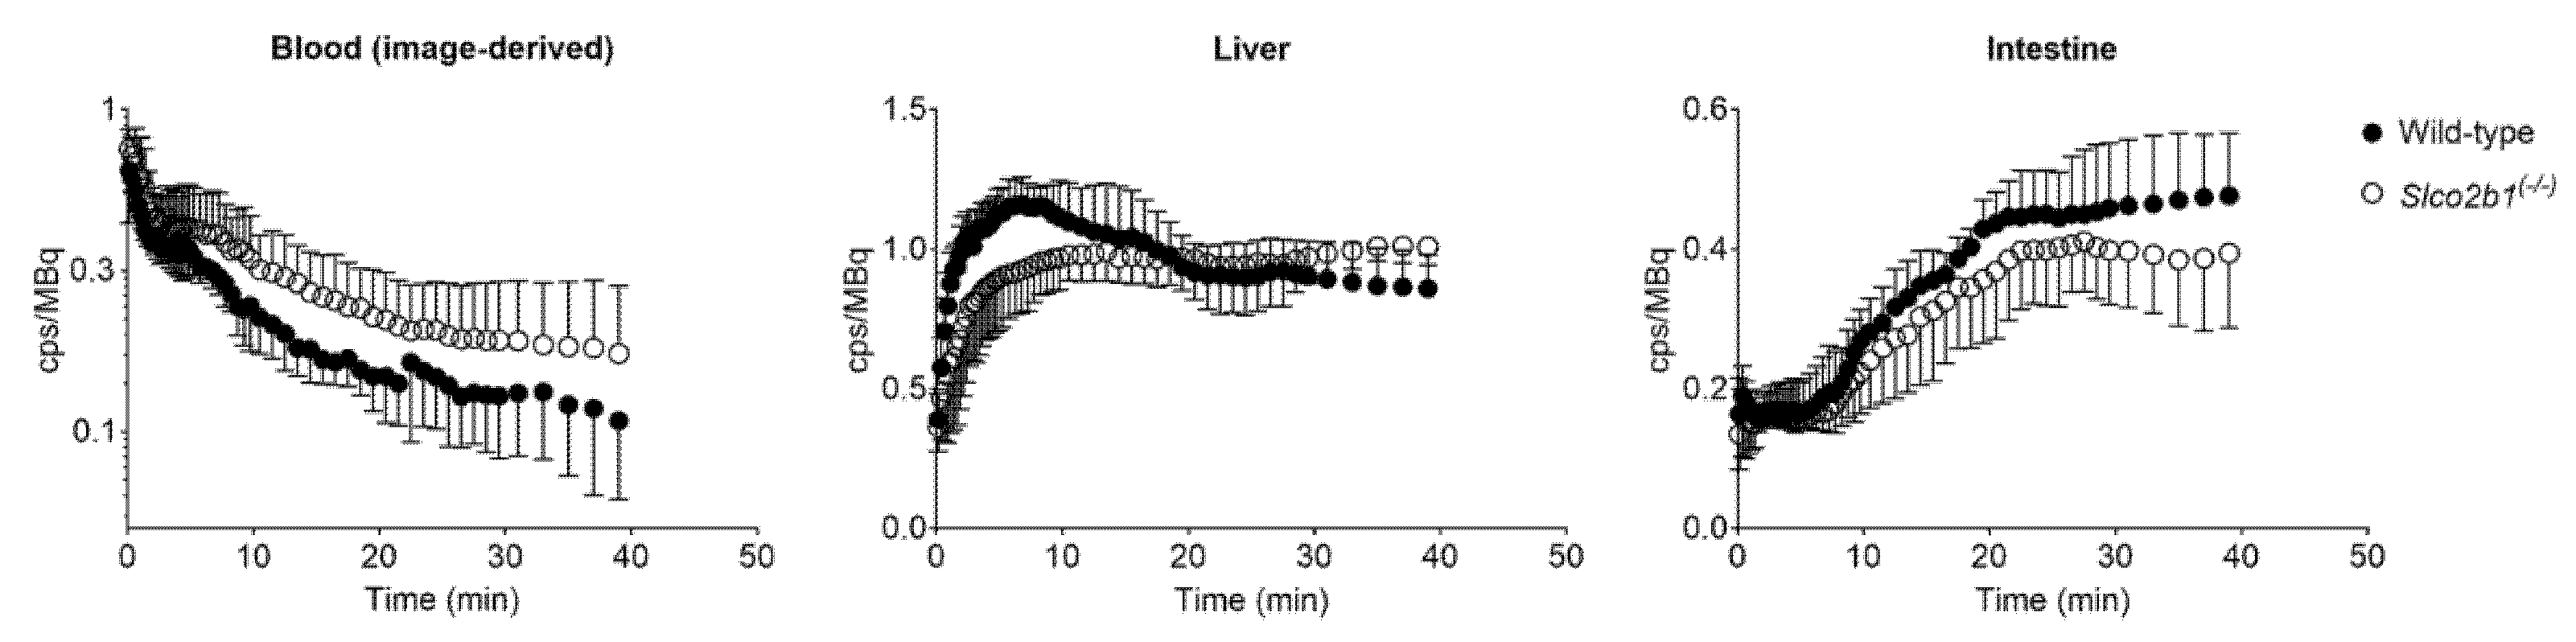
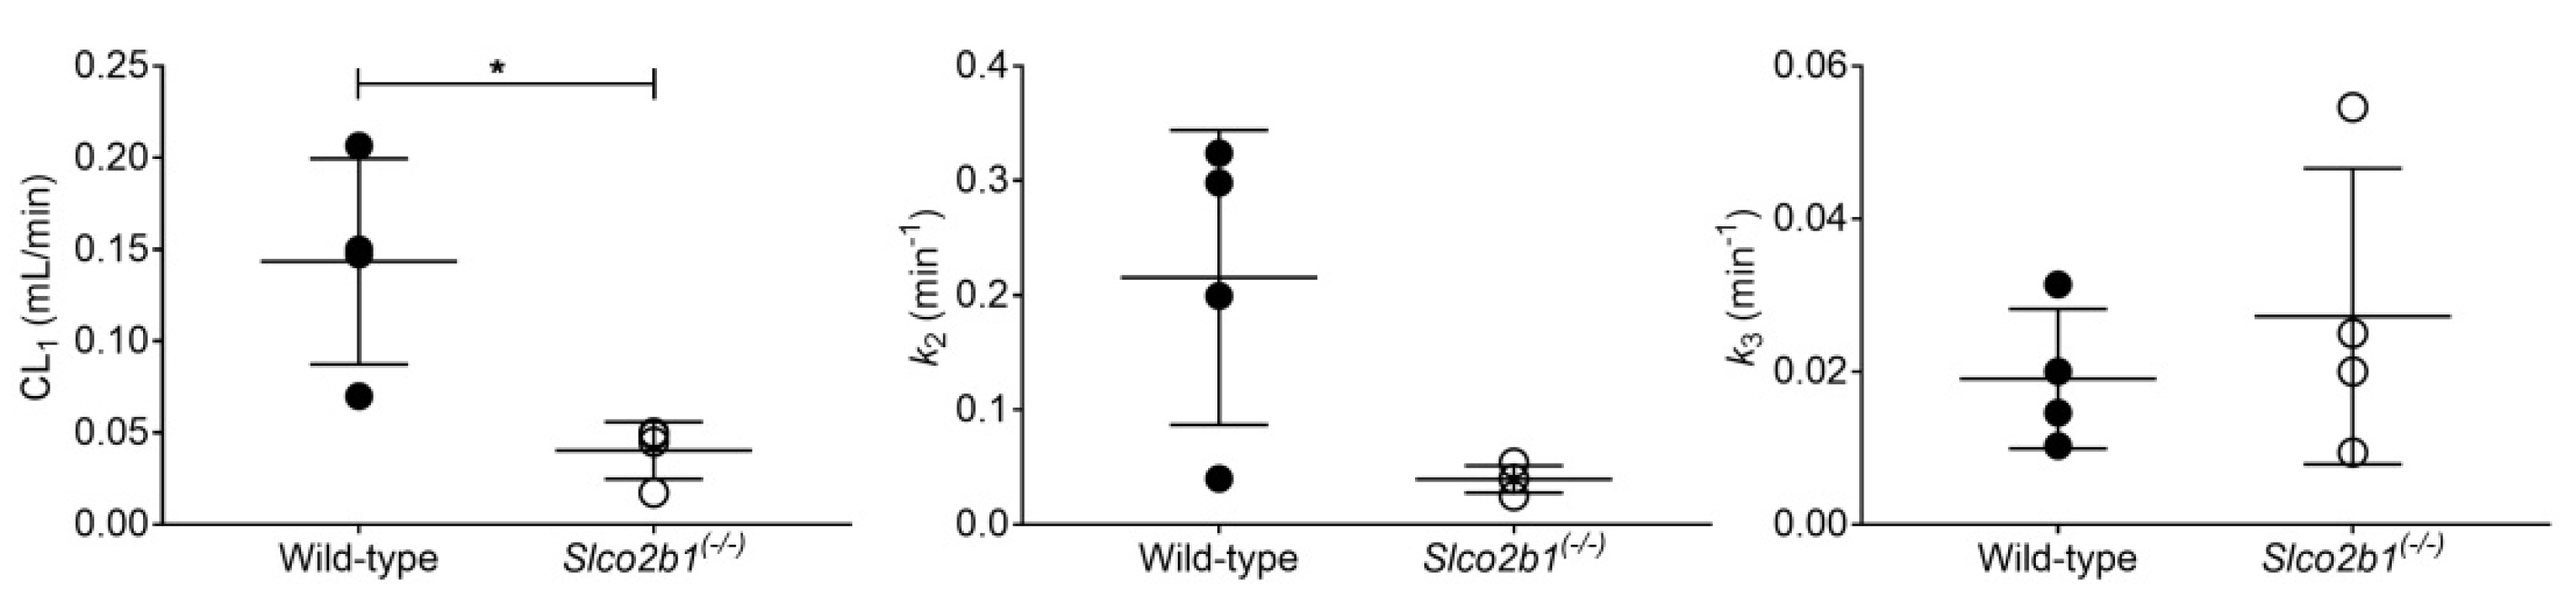
3.2. Influence of OATP2B1 on the Hepatobiliary Disposition of [99mTc]mebrofenin

Dynamic planar scintigraphic acquisitions were performed in wild-type and Slco2b1(-/-) mice after i.v. [99mTc]mebrofenin administration. Serial CT-co-registered planar scintigraphy images of one representative wild-type mouse and one representative Slco2b1(-/-) mouse are shown in Figure S3. Mean TACs in the blood (image-derived blood curve from the whole heart), liver and intestine are shown in Figure 6. The elimination of radioactivity from the blood was delayed in Slco2b1(-/-) mice along with a moderate decrease in radioactivity in the liver and intestine.
The PK model provided good fits of the liver and intestinal TACs of [99mTc]mebrofenin (Figure S4), and parameter precision was, in general, acceptable (Table 1). Model outcome parameters in wild-type and knockout mice are shown in Figure 7. CL1 was significantly decreased in Slco2b1(-/-) mice by 3.6-fold. There was a trend towards a decrease in k2 in Slco2b1(-/-) mice (5.5-fold decrease), but statistical significance was not reached. No significant differences were observed for k3 between knockout and wild-type mice.

4. Discussion

While several preclinical and clinical studies have addressed the role of OATP2B1 in mediating the intestinal absorption of drugs, the role of OATP2B1 as a hepatic uptake transporter has remained elusive thus far [10,29]. This is due to the largely overlapping substrate spectrum of OATP2B1 with the major hepatic OATP uptake transporters OATP1B1 and OATP1B3 and the lack of OATP2B1-selective inhibitors for in vivo use. A step forward in providing a better understanding of the role of OATP2B1 in drug disposition has been the development of OATP2B1-deficient mouse models (Slco2b1(-/-)) [12,13]. In the present study, we characterized the Slco2b1(-/-) mouse model initially presented by Chen et al. [13] with PET and planar scintigraphic imaging using i.v. administered radiolabeled OATP probe substrates to specifically assess the role of OATP2B1 as a hepatic uptake transporter.
The imaging data were analyzed with a dedicated liver PK model modified from a previously developed model (Figure S1) [15]. In this model, both the hepatic artery and the portal vein blood supply to the liver were considered. The flow-weighted dual blood TAC was used as an input function to the model. The radiotracer concentration in the hepatic artery was assumed to equal the radiotracer concentration derived from the left ventricle of the heart for [11C]erlotinib and from the whole heart region of interest for [99mTc]mebrofenin (due to the limited spatial resolution of planar imaging). Since the portal vein is too small to be visualized in rodents and since the radiotracer concentration is expected to be different from that of the hepatic artery, the portal vein radiotracer concentration was mathematically estimated as previously described [30]. Although this approach has been previously validated in pigs [31], it should be noted that this validation is still needed for mice. The employed PK model assumes that no metabolism of the radiotracer occurs during the time course of the imaging scan and that the rate constants define the transfer of the unmetabolized parent radiotracer between compartments. Previous studies in mice showed that the majority (>75%) of radioactivity in plasma and the liver after i.v. injection of [11C]erlotinib was in the form of an unmetabolized radiotracer [25]. In addition, [99mTc]mebrofenin has been shown to not undergo metabolism [32,33].
Previous in vitro data in transporter-transfected A431 cells indicated that [11C]erlotinib is transported by human OATP2B1, but not by human OATP1B1 and OATP1B3 [18]. However, the contribution of OATP2B1 to the uptake of [11C]erlotinib in OATP2B1-overexpressing A431 cells was rather small (ft approximately 0.20) and only evident when low concentrations of [11C]erlotinib (<0.1 µmol/L) were used [18]. Studies in mice showed that the initial hepatic uptake of [11C]erlotinib was significantly reduced upon co-administration with a pharmacological dose of unlabeled erlotinib [34], a known OATP2B1 inhibitor [35]. In addition, the hepatic uptake rate constant of [11C]erlotinib was lower in mice treated with rifampicin [19], a broad-spectrum OATP inhibitor [36,37]. Similar to mice, pre-treatment with rifampicin led to a reduction in the hepatic uptake rate constant of [11C]erlotinib in humans, although this effect was less pronounced than in mice [19]. Altogether, the results of these previous studies suggested that OATP2B1 may partly contribute to the hepatic uptake of [11C]erlotinib at tracer doses. However, currently available OATP2B1 inhibitors are not specific for OATP2B1 and may interact with other transporters or drug-metabolizing enzymes [11], meaning that the specific contribution of OATP2B1 to the hepatic uptake of [11C]erlotinib still remains to be elucidated [19]. It is currently not known whether any other membrane transporters than OATP2B1 contribute to the liver uptake of [11C]erlotinib or whether it mainly occurs via passive diffusion.
The hepatic uptake clearance of [11C]erlotinib (CL1) was significantly lower in Slco2b1(-/-) mice than in wild-type mice (Figure 3), which supported the notion that murine OATP2B1 contributes to the hepatic uptake of [11C]erlotinib in mice. However, the absence of OATP2B1 expression did not lead to changes in the blood concentrations of [11C]erlotinib (Figure 2), which is consistent with [11C]erlotinib having only a low ft by OATP2B1 (ft = 0.42). Similarly, previous studies in Slco2b1(-/-) mice reported no changes in the plasma PK of the i.v. administered OATP2B1 substrate drugs fluvastatin, fexofenadine and rosuvastatin, which also suggested a low ft by hepatic OATP2B1 [12,13]. This highlights the importance of measuring the dynamic liver concentrations as the lack of a hepatic uptake transporter may not cause appreciable changes in a drug’s plasma PK when ft is low [10]. The reduction in CL1 of [11C]erlotinib in Slco2b1(-/-) mice (1.7-fold) was lower than previously reported in rifampicin-treated wild-type mice (2.6-fold) [19], in which a concomitant and pronounced increase in blood concentrations was observed. This indicates that apart from OATP2B1, additional rifampicin-inhibitable uptake transporters may contribute to the hepatic uptake of [11C]erlotinib in mice. Apart from the reduction in CL1, the k2 parameter, which defines the transfer of radioactivity from the liver back to the blood, was significantly decreased in Slco2b1(-/-) mice (Figure 3). Although speculative, this may point to a reduced expression of an unknown basolateral efflux transporter in Slco2b1(-/-) mice which may mediate the transfer of [11C]erlotinib from the liver back to the blood. The k3 parameter, which reflects biliary excretion of [11C]erlotinib-derived radioactivity, which has been shown to be mediated by breast cancer resistance protein (BCRP/ABCG2) [34,38], was unchanged in Slco2b1(-/-) mice as compared with wild-type mice (Figure 3).
Next to employing [11C]erlotinib as a putatively OATP2B1-selective probe substrate, we used planar scintigraphic imaging with [99mTc]mebrofenin as a “negative control”, which is a probe substrate which is transported by human OATP1B1 and OATP1B3, but not by human OATP2B1 [20,21]. Biliary excretion of [99mTc]mebrofenin was shown to be mediated by multidrug resistance-associated protein 2 (MRP2/ABCC2) and basolateral efflux from the liver into the blood by multidrug resistance-associated protein 3 (MRP3/ABCC3) [21]. Unexpectedly, a significant decrease in CL1 of [99mTc]mebrofenin was observed in Slco2b1(-/-) mice (Figure 7), which was more pronounced than for [11C]erlotinib (Figure 3). This may either indicate that [99mTc]mebrofenin is a substrate of mouse OATP2B1 (while not being transported by human OATP2B1) or that the Slco2b1(-/-) mouse model showed a reduced expression of other transporters mediating the hepatic uptake of [99mTc]mebrofenin. In line with this latter assumption, Chen et al. reported decreased hepatic Slco1b2 mRNA expression in male Slco2b1(-/-) mice, which was not observed in female animals [13]. Slco1b2 encodes OATP1B2, which is the rodent orthologue of human OATP1B1 and 1B3. Transport of [99mTc]mebrofenin by mouse OATP1B2 is supported by data in Slco1a/1b(-/-) mice, which showed a markedly decreased hepatic uptake and increased blood exposure to [99mTc]mebrofenin as compared with wild-type mice [39]. Interestingly, reduced hepatic Slco1b2 mRNA expression was not reported for the other OATP2B1-deficient mouse model developed by Medwid et al., for which the same targeting construct was used [12]. The exact reasons for the marked decrease in CL1 of [99mTc]mebrofenin in Slco2b1(-/-) mice need further investigation but may indicate a limited relevance of the Slco2b1(-/-) mouse model to investigate the OATP2B1-mediated fraction of the liver uptake of drugs which are substrates of multiple hepatic OATPs. Interestingly, Slco2b1(-/-) mice showed a trend towards a decrease in the k2 parameter (Figure 7), which may be related to a reduced expression of hepatic MRP3 which was shown to mediate the efflux of [99mTc]mebrofenin from the liver into the blood [21].
Given that OATP2B1 is, in contrast to OATP1B1 and OATP1B3, not a liver-specific OATP transporter but shows a wide tissue distribution profile, we also investigated the effect of Slco2b1 knockout on the distribution of [11C]erlotinib to other tissues with known OATP2B1 expression (brain, myocardium, skeletal muscle, kidneys and lungs) [10,29]. We herein benefitted from the ability of small-animal PET to perform dynamic whole-body imaging in mice. In none of the investigated tissues, except for the liver, was a reduction in kuptake,tissue observed in Slco2b1(-/-) mice as compared with wild-type mice (Figure 4). This suggests a negligible role of mouse OATP2B1 in mediating the uptake of [11C]erlotinib to other tissues than the liver. Interestingly, we observed significant increases in kuptake,tissue of [11C]erlotinib in the myocardium and the kidneys, which may point to compensatory changes in other unknown uptake or efflux transporters mediating the tissue distribution of [11C]erlotinib in mice.
Limitations of our study include the lack of transporter protein expression data in the livers of Slco2b1(-/-) mice versus wild-type mice to support our in vivo findings as well as the limited knowledge regarding whether [11C]erlotinib and [99mTc]mebrofenin are substrates of the rodent orthologues of human hepatic OATP transporters.

5. Conclusions

We performed a detailed imaging-based characterization of a novel Slco2b1(-/-) mouse model using the putative OATP2B1-selective probe substrate [11C]erlotinib and the OATP1B1/1B3 probe substrate [99mTc]mebrofenin. Employment of a liver PK model revealed a significant decrease in the hepatic uptake clearance (CL1) of both radiotracers in Slco2b1(-/-) mice. This provided further support that OATP transporters may contribute to the liver uptake of [11C]erlotinib. However, the decreased hepatic uptake of the OATP1B1/1B3 substrate [99mTc]mebrofenin in Slco2b1(-/-) mice may be related to a reduced expression of OATP1B2 (the rodent orthologue of human OATP1B1/1B3), which questions the utility of this mouse model for hepatic uptake studies with drugs which are substrates of multiple OATPs.

Supplementary Materials

The following are available online at https://www.mdpi.com/article/10.3390/pharmaceutics13060918/s1, Figure S1: Pharmacokinetic model implemented to assess the hepatobiliary disposition of [11C]erlotinib and [99mTc]mebrofenin. Figure S2: Observed and fitted time–activity curves (MBq/mL or MBq) of [11C]erlotinib in the liver and intestine in one representative wild-type mouse and one representative Slco2b1(-/-) mouse. Figure S3: Serial CT-co-registered planar scintigraphy images of one representative wild-type mouse and one representative Slco2b1(-/-) mouse after i.v. injection of [99mTc]mebrofenin. Figure S4: Observed and fitted time–activity curves (cps) of [99mTc]mebrofenin in the liver and intestine in one representative wild-type mouse and one representative Slco2b1(-/-) mouse.

Author Contributions

Conceptualization, O.L., N.T. and A.S.; methodology, S.M., S.H., I.H.-L. and A.S.; software, I.H.-L.; formal analysis, S.M. and I.H.-L.; investigation, S.M., I.H.-L., L.B. and C.T.; resources, N.T.; writing—original draft preparation, I.H.-L., O.L. and S.M.; writing—review and editing, all authors; supervision, N.T., O.L. and A.S.; funding acquisition, N.T. and O.L. All authors have read and agreed to the published version of the manuscript.

Funding

This work was performed on a platform member of France Life Imaging Network (grant ANR-11-INBS-0006). The present study also received funding from the Austrian Science Fund (grant KLI 694-B30, to O.L.) and from the Gesellschaft für Forschungsförderung Niederösterreich m.b.H (grant LS15-003, to O.L.).

Institutional Review Board Statement

All animal experiments were performed in accordance with the recommendations of the European Community (2010/63/UE) and the French National Committees (law 2013-118) for the care and use of laboratory animals. The experimental protocol was approved by a local ethics committee for animal use (CETEA) and by the French Ministry of Agriculture (APAFIS: 7466-2016110417049220 v3, accepted on 21 December 2018).

Informed Consent Statement

Not applicable.

Acknowledgments

Maud Goislard, Gaëlle Hugon, Alexandra Winkeler and Vu Long Tran are acknowledged for their technical assistance in the imaging experiments. The graphical abstract was produced with the material from Servier Medical ART, licensed under a Creative Common Attribution 3.0 Generic License: http://smart.servier.com/. The authors must accept it according to IOAP’s request. “Open Access Funding by the Austrian Science Fund (FWF)”.

Conflicts of Interest

The authors declare no conflict of interest.

Abbreviations

AUC (area under the curve), ft (fraction transported), i.v. (intravenous), OATP (organic anion-transporting polypeptide), PET (positron emission tomography), PK (pharmacokinetic(s)), TAC (time–activity curve).

References

  1. Roth, M.; Obaidat, A.; Hagenbuch, B. OATPs, OATs and OCTs: The organic anion and cation transporters of the SLCO and SLC22A gene superfamilies. Br. J. Pharmacol. 2012, 165, 1260–1287. [Google Scholar] [CrossRef] [Green Version]
  2. Tamai, I.; Nezu, J.; Uchino, H.; Sai, Y.; Oku, A.; Shimane, M.; Tsuji, A. Molecular identification and characterization of novel members of the human organic anion transporter (OATP) family. Biochem. Biophys. Res. Commun. 2000, 273, 251–260. [Google Scholar] [CrossRef]
  3. Kullak-Ublick, G.A.; Ismair, M.G.; Stieger, B.; Landmann, L.; Huber, R.; Pizzagalli, F.; Fattinger, K.; Meier, P.J.; Hagenbuch, B. Organic anion-transporting polypeptide B (OATP-B) and its functional comparison with three other OATPs of human liver. Gastroenterology 2001, 120, 525–533. [Google Scholar] [CrossRef]
  4. Grube, M.; Kock, K.; Oswald, S.; Draber, K.; Meissner, K.; Eckel, L.; Bohm, M.; Felix, S.B.; Vogelgesang, S.; Jedlitschky, G.; et al. Organic anion transporting polypeptide 2B1 is a high-affinity transporter for atorvastatin and is expressed in the human heart. Clin. Pharmacol. Ther. 2006, 80, 607–620. [Google Scholar] [CrossRef]
  5. Seki, S.; Kobayashi, M.; Itagaki, S.; Hirano, T.; Iseki, K. Contribution of organic anion transporting polypeptide OATP2B1 to amiodarone accumulation in lung epithelial cells. Biochim. Biophys. Acta 2009, 1788, 911–917. [Google Scholar] [CrossRef] [Green Version]
  6. Knauer, M.J.; Urquhart, B.L.; Meyer zu Schwabedissen, H.E.; Schwarz, U.I.; Lemke, C.J.; Leake, B.F.; Kim, R.B.; Tirona, R.G. Human skeletal muscle drug transporters determine local exposure and toxicity of statins. Circ. Res. 2010, 106, 297–306. [Google Scholar] [CrossRef] [Green Version]
  7. Tapaninen, T.; Neuvonen, P.J.; Niemi, M. Orange and apple juice greatly reduce the plasma concentrations of the OATP2B1 substrate aliskiren. Br. J. Clin. Pharmacol. 2011, 71, 718–726. [Google Scholar] [CrossRef] [PubMed]
  8. Akamine, Y.; Miura, M.; Komori, H.; Tamai, I.; Ieiri, I.; Yasui-Furukori, N.; Uno, T. The change of pharmacokinetics of fexofenadine enantiomers through the single and simultaneous grapefruit juice ingestion. Drug. Metab. Pharmacokinet. 2015, 30, 352–357. [Google Scholar] [CrossRef] [PubMed]
  9. Ieiri, I.; Doi, Y.; Maeda, K.; Sasaki, T.; Kimura, M.; Hirota, T.; Chiyoda, T.; Miyagawa, M.; Irie, S.; Iwasaki, K.; et al. Microdosing clinical study: Pharmacokinetic, pharmacogenomic (SLCO2B1), and interaction (grapefruit juice) profiles of celiprolol following the oral microdose and therapeutic dose J. Clin. Pharmacol. 2012, 52, 1078–1089. [Google Scholar] [CrossRef] [PubMed]
  10. McFeely, S.J.; Wu, L.; Ritchie, T.K.; Unadkat, J. Organic anion transporting polypeptide 2B1 - More than a glass-full of drug interactions. Pharmacol. Ther. 2019, 196, 204–215. [Google Scholar] [CrossRef]
  11. Zamek-Gliszczynski, M.J.; Taub, M.E.; Chothe, P.P.; Chu, X.; Giacomini, K.M.; Kim, R.B.; Ray, A.S.; Stocker, S.L.; Unadkat, J.D.; Wittwer, M.B.; et al. Transporters in drug development: 2018 ITC recommendations for transporters of emerging clinical importance. Clin. Pharmacol. Ther. 2018, 104, 890–899. [Google Scholar] [CrossRef] [PubMed]
  12. Medwid, S.; Li, M.M.J.; Knauer, M.J.; Lin, K.; Mansell, S.E.; Schmerk, C.L.; Zhu, C.; Griffin, K.E.; Yousif, M.D.; Dresser, G.K.; et al. Fexofenadine and rosuvastatin pharmacokinetics in mice with targeted disruption of organic anion transporting polypeptide 2B1. Drug. Metab. Dispos. 2019, 47, 832–842. [Google Scholar] [CrossRef]
  13. Chen, M.; Hu, S.; Li, Y.; Gibson, A.A.; Fu, Q.; Baker, S.D.; Sparreboom, A. Role of Oatp2b1 in drug absorption and drug-drug interactions. Drug. Metab. Dispos. 2020, 48, 419–425. [Google Scholar] [CrossRef]
  14. Tournier, N.; Stieger, B.; Langer, O. Imaging techniques to study drug transporter function in vivo. Pharmacol. Ther. 2018, 189, 104–122. [Google Scholar] [CrossRef] [Green Version]
  15. Hernández Lozano, I.; Karch, R.; Bauer, M.; Blaickner, M.; Matsuda, A.; Wulkersdorfer, B.; Hacker, M.; Zeitlinger, M.; Langer, O. Towards improved pharmacokinetic models for the analysis of transporter-mediated hepatic disposition of drug molecules with positron emission tomography. AAPS J. 2019, 21, 61. [Google Scholar] [CrossRef]
  16. Hernández Lozano, I.; Langer, O. Use of imaging to assess the activity of hepatic transporters. Expert. Opin. Drug. Metab. Toxicol. 2020, 16, 149–164. [Google Scholar] [CrossRef] [Green Version]
  17. Hernández-Lozano, I.; Wanek, T.; Sauberer, M.; Filip, T.; Mairinger, S.; Stanek, J.; Traxl, A.; Karch, R.; Schuetz, J.D.; Langer, O. Influence of ABC transporters on the excretion of ciprofloxacin assessed with PET imaging in mice. Eur. J. Pharm. Sci. 2021, 163, 105854. [Google Scholar] [CrossRef] [PubMed]
  18. Bauer, M.; Matsuda, A.; Wulkersdorfer, B.; Philippe, C.; Traxl, A.; Özvegy-Laczka, C.; Stanek, J.; Nics, L.; Klebermass, E.M.; Poschner, S.; et al. Influence of OATPs on hepatic disposition of erlotinib measured with positron emission tomography. Clin. Pharmacol. Ther. 2018, 104, 139–147. [Google Scholar] [CrossRef] [Green Version]
  19. Bauer, M.; Traxl, A.; Matsuda, A.; Karch, R.; Philippe, C.; Nics, L.; Klebermass, E.M.; Wulkersdorfer, B.; Weber, M.; Poschner, S.; et al. Effect of rifampicin on the distribution of [11C]erlotinib to the liver, a translational PET study in humans and in mice. Mol. Pharm. 2018, 15, 4589–4598. [Google Scholar] [CrossRef]
  20. De Graaf, W.; Hausler, S.; Heger, M.; van Ginhoven, T.M.; van Cappellen, G.; Bennink, R.J.; Kullak-Ublick, G.A.; Hesselmann, R.; van Gulik, T.M.; Stieger, B. Transporters involved in the hepatic uptake of [99mTc]mebrofenin and indocyanine green. J. Hepatol. 2011, 54, 738–745. [Google Scholar] [CrossRef] [PubMed] [Green Version]
  21. Ghibellini, G.; Leslie, E.M.; Pollack, G.M.; Brouwer, K.L. Use of tc-99m mebrofenin as a clinical probe to assess altered hepatobiliary transport: Integration of in vitro, pharmacokinetic modeling, and simulation studies. Pharm. Res. 2008, 25, 1851–1860. [Google Scholar] [CrossRef] [PubMed] [Green Version]
  22. Marie, S.; Hernández-Lozano, I.; Langer, O.; Tournier, N. Repurposing 99mTc-mebrofenin as a probe for molecular imaging of hepatocyte transporters. J. Nucl. Med. 2021. [Google Scholar] [CrossRef] [PubMed]
  23. Bahce, I.; Smit, E.F.; Lubberink, M.; van der Veldt, A.A.; Yaqub, M.; Windhorst, A.D.; Schuit, R.C.; Thunnissen, E.; Heideman, D.A.; Postmus, P.E.; et al. Development of [11C]erlotinib positron emission tomography for in vivo evaluation of EGF receptor mutational status. Clin. Cancer. Res. 2013, 19, 183–193. [Google Scholar] [CrossRef] [PubMed] [Green Version]
  24. Loening, A.M.; Gambhir, S.S. AMIDE: A free software tool for multimodality medical image analysis. Mol. Imaging 2003, 2, 131–137. [Google Scholar] [CrossRef]
  25. Traxl, A.; Mairinger, S.; Filip, T.; Sauberer, M.; Stanek, J.; Poschner, S.; Jäger, W.; Zoufal, V.; Novarino, G.; Tournier, N.; et al. Inhibition of ABCB1 and ABCG2 at the mouse blood-brain barrier with marketed drugs to improve brain delivery of the model ABCB1/ABCG2 substrate [11C]erlotinib. Mol. Pharm. 2019, 16, 1282–1293. [Google Scholar] [CrossRef]
  26. Shingaki, T.; Hume, W.E.; Takashima, T.; Katayama, Y.; Okauchi, T.; Hayashinaka, E.; Wada, Y.; Cui, Y.; Kusuhara, H.; Sugiyama, Y.; et al. Quantitative evaluation of mMate1 function based on minimally invasive measurement of tissue concentration using PET with [11C]metformin in mouse. Pharm. Res. 2015, 32, 2538–2547. [Google Scholar] [CrossRef]
  27. Marie, S.; Hernández-Lozano, I.; Breuil, L.; Saba, W.; Novell, A.; Gennisson, J.L.; Langer, O.; Truillet, C.; Tournier, N. Validation of pharmacological protocols for targeted inhibition of canalicular MRP2 activity in hepatocytes using [99mTc]mebrofenin imaging in rats. Pharmaceutics 2020, 12, 486. [Google Scholar] [CrossRef]
  28. Davies, B.; Morris, T. Physiological parameters in laboratory animals and humans. Pharm. Res. 1993, 10, 1093–1095. [Google Scholar] [CrossRef]
  29. Kinzi, J.; Grube, M.; Meyer Zu Schwabedissen, H.E. OATP2B1—The underrated member of the organic anion transporting polypeptide family of drug transporters? Biochem. Pharmacol. 2021, 188, 114534. [Google Scholar] [CrossRef]
  30. Munk, O.L.; Keiding, S.; Bass, L. Impulse-response function of splanchnic circulation with model-independent constraints: Theory and experimental validation. Am. J. Physiol. Gastrointest. Liver Physiol. 2003, 285, 671–680. [Google Scholar] [CrossRef] [Green Version]
  31. Sørensen, M.; Munk, O.L.; Ørntoft, N.W.; Frisch, K.; Andersen, K.J.; Mortensen, F.V.; Alstrup, A.K.; Ott, P.; Hofmann, A.F.; Keiding, S. Hepatobiliary secretion kinetics of conjugated bile acids measured in pigs by [11C]cholylsarcosine PET. J. Nucl. Med. 2016, 57, 961–966. [Google Scholar] [CrossRef] [Green Version]
  32. Krishnamurthy, S.; Krishnamurthy, G.T. Technetium-99m-iminodiacetic acid organic anions: Review of biokinetics and clinical application in hepatology. Hepatology 1989, 9, 139–153. [Google Scholar] [CrossRef]
  33. Bhargava, K.K.; Joseph, B.; Ananthanarayanan, M.; Balasubramaniyan, N.; Tronco, G.G.; Palestro, C.J.; Gupta, S. Adenosine triphosphate-binding cassette subfamily C member 2 is the major transporter of the hepatobiliary imaging agent [99mTc]mebrofenin. J. Nucl. Med. 2009, 50, 1140–1146. [Google Scholar] [CrossRef] [Green Version]
  34. Traxl, A.; Wanek, T.; Mairinger, S.; Stanek, J.; Filip, T.; Sauberer, M.; Müller, M.; Kuntner, C.; Langer, O. Breast cancer resistance protein and P-glycoprotein influence in vivo disposition of [11C]erlotinib. J. Nucl. Med. 2015, 56, 1930–1936. [Google Scholar] [CrossRef] [Green Version]
  35. Johnston, R.A.; Rawling, T.; Chan, T.; Zhou, F.; Murray, M. Selective inhibition of human solute carrier transporters by multikinase inhibitors. Drug. Metab. Dispos. 2014, 42, 1851–1857. [Google Scholar] [CrossRef] [PubMed] [Green Version]
  36. Zheng, H.X.; Huang, Y.; Frassetto, L.A.; Benet, L.Z. Elucidating rifampin’s inducing and inhibiting effects on glyburide pharmacokinetics and blood glucose in healthy volunteers: Unmasking the differential effects of enzyme induction and transporter inhibition for a drug and its primary metabolite. Clin. Pharmacol. Ther. 2009, 85, 78–85. [Google Scholar] [CrossRef]
  37. Karlgren, M.; Vildhede, A.; Norinder, U.; Wisniewski, J.R.; Kimoto, E.; Lai, Y.; Haglund, U.; Artursson, P. Classification of inhibitors of hepatic organic anion transporting polypeptides (OATPs): Influence of protein expression on drug-drug interactions. J. Med. Chem. 2012, 55, 4740–4763. [Google Scholar] [CrossRef] [PubMed]
  38. Traxl, A.; Komposch, K.; Glitzner, E.; Wanek, T.; Mairinger, S.; Langer, O.; Sibilia, M. Hepatocyte-specific deletion of EGFR in mice reduces hepatic Abcg2 transport activity measured by [11C]erlotinib and positron emission tomography. Drug. Metab. Dispos. 2017, 45, 1093–1100. [Google Scholar] [CrossRef] [PubMed] [Green Version]
  39. Neyt, S.; Huisman, M.T.; Vanhove, C.; De Man, H.; Vliegen, M.; Moerman, L.; Dumolyn, C.; Mannens, G.; De Vos, F. In vivo visualization and quantification of (disturbed) Oatp-mediated hepatic uptake and Mrp2-mediated biliary excretion of 99mTc-mebrofenin in mice. J. Nucl. Med. 2013, 54, 624–630. [Google Scholar] [CrossRef] [Green Version]
Figure 1. Serial PET images of one representative wild-type mouse and one representative Slco2b1(-/-) mouse after i.v. injection of [11C]erlotinib. Radioactivity concentration is expressed as percent of injected dose per mL (%ID/mL). Anatomical structures are labeled with white arrows (I: intestine; L: liver).
Pharmaceutics 13 00918 g001
Figure 2. Mean time–activity curves (%ID/mL or %ID ± SD) of [11C]erlotinib in the blood (image-derived blood curve from the left ventricle of the heart), liver and intestine in wild-type and Slco2b1(-/-) mice.
Pharmaceutics 13 00918 g002
Figure 3. Pharmacokinetic parameters obtained with the compartmental model to describe the hepatobiliary disposition of [11C]erlotinib in wild-type and Slco2b1(-/-) mice. * p ≤ 0.05, ** p ≤ 0.01, Mann–Whitney U test.
Pharmaceutics 13 00918 g003
Figure 4. Uptake rate constants of [11C]erlotinib, determined with integration plot analysis, in wild-type and Slco2b1(-/-) mice for the different analyzed tissues (brain, myocardium, skeletal muscle, liver, kidney and lung). * p ≤ 0.05, ** p ≤ 0.01, Mann–Whitney U test.
Pharmaceutics 13 00918 g004
Figure 5. Tissue-to-blood AUC ratios of [11C]erlotinib in wild-type and Slco2b1(-/-) mice.
Pharmaceutics 13 00918 g005
Figure 6. Mean time–activity curves (counts per second (cps) normalized to injected activity in MBq ± SD) of [99mTc]mebrofenin in the blood (image-derived blood curve from the heart), liver and intestine in wild-type and Slco2b1(-/-) mice.
Pharmaceutics 13 00918 g006
Figure 7. Pharmacokinetic parameters obtained with the compartmental model to describe the hepatobiliary disposition of [99mTc]mebrofenin in wild-type and Slco2b1(-/-) mice. * p ≤ 0.05, Mann–Whitney U test.
Pharmaceutics 13 00918 g007
Table 1. Pharmacokinetic parameters obtained with the compartmental model describing the hepatobiliary disposition of [11C]erlotinib and [99mTc]mebrofenin in wild-type and Slco2b1(-/-) mice.
MiceCL1 (mL/min)k2 (min−1)k3 (min−1)
[11C]erlotinibWild-type6.442 ± 1.675
(16.7–62.1)
1.052 ± 0.196
(15.4–54.2)
0.013 ± 0.008
(4.9–12.6)
Slco2b1(-/-)3.748 ± 1.470 *
(5.7–57.9)
0.565 ± 0.287 **
(5.8–54.9)
0.014 ± 0.010
(3.1–10.7)
[99mTc]mebrofeninWild-type0.144 ± 0.056
(2.4–3.7)
0.215 ± 0.129
(2.8–6.7)
0.019 ± 0.009
(1.3–2.5)
Slco2b1(-/-)0.040 ± 0.016 *
(4.3–43.0)
0.040 ± 0.012
(7.3–90.3)
0.027 ± 0.019
(2.3–14.4)
Data are given as mean ± SD (n = 4–5 per group). Values in parentheses represent the range in percent coefficient of variation (%CV). CL1 represents hepatic uptake clearance, and k2 and k3 are the rate constants defining the transfer of radioactivity from liver into blood and from liver to intestine, respectively. * p ≤ 0.05, ** p ≤ 0.01, Mann–Whitney U test, comparing wild-type and Slco2b1(-/-) mice.
Publisher’s Note: MDPI stays neutral with regard to jurisdictional claims in published maps and institutional affiliations.

