
Drug-Rich Phases Induced by Amorphous Solid Dispersion: Arbitrary or Intentional Goal in Oral Drug Delivery?

 , , and
Abstract
:
1. Introduction
2. Dissolution Pathways of ASD in Water
2.1. Thermodynamics of the Pure Drug in the Dissolution
2.2. Thermodynamics of ASD in Dissolution
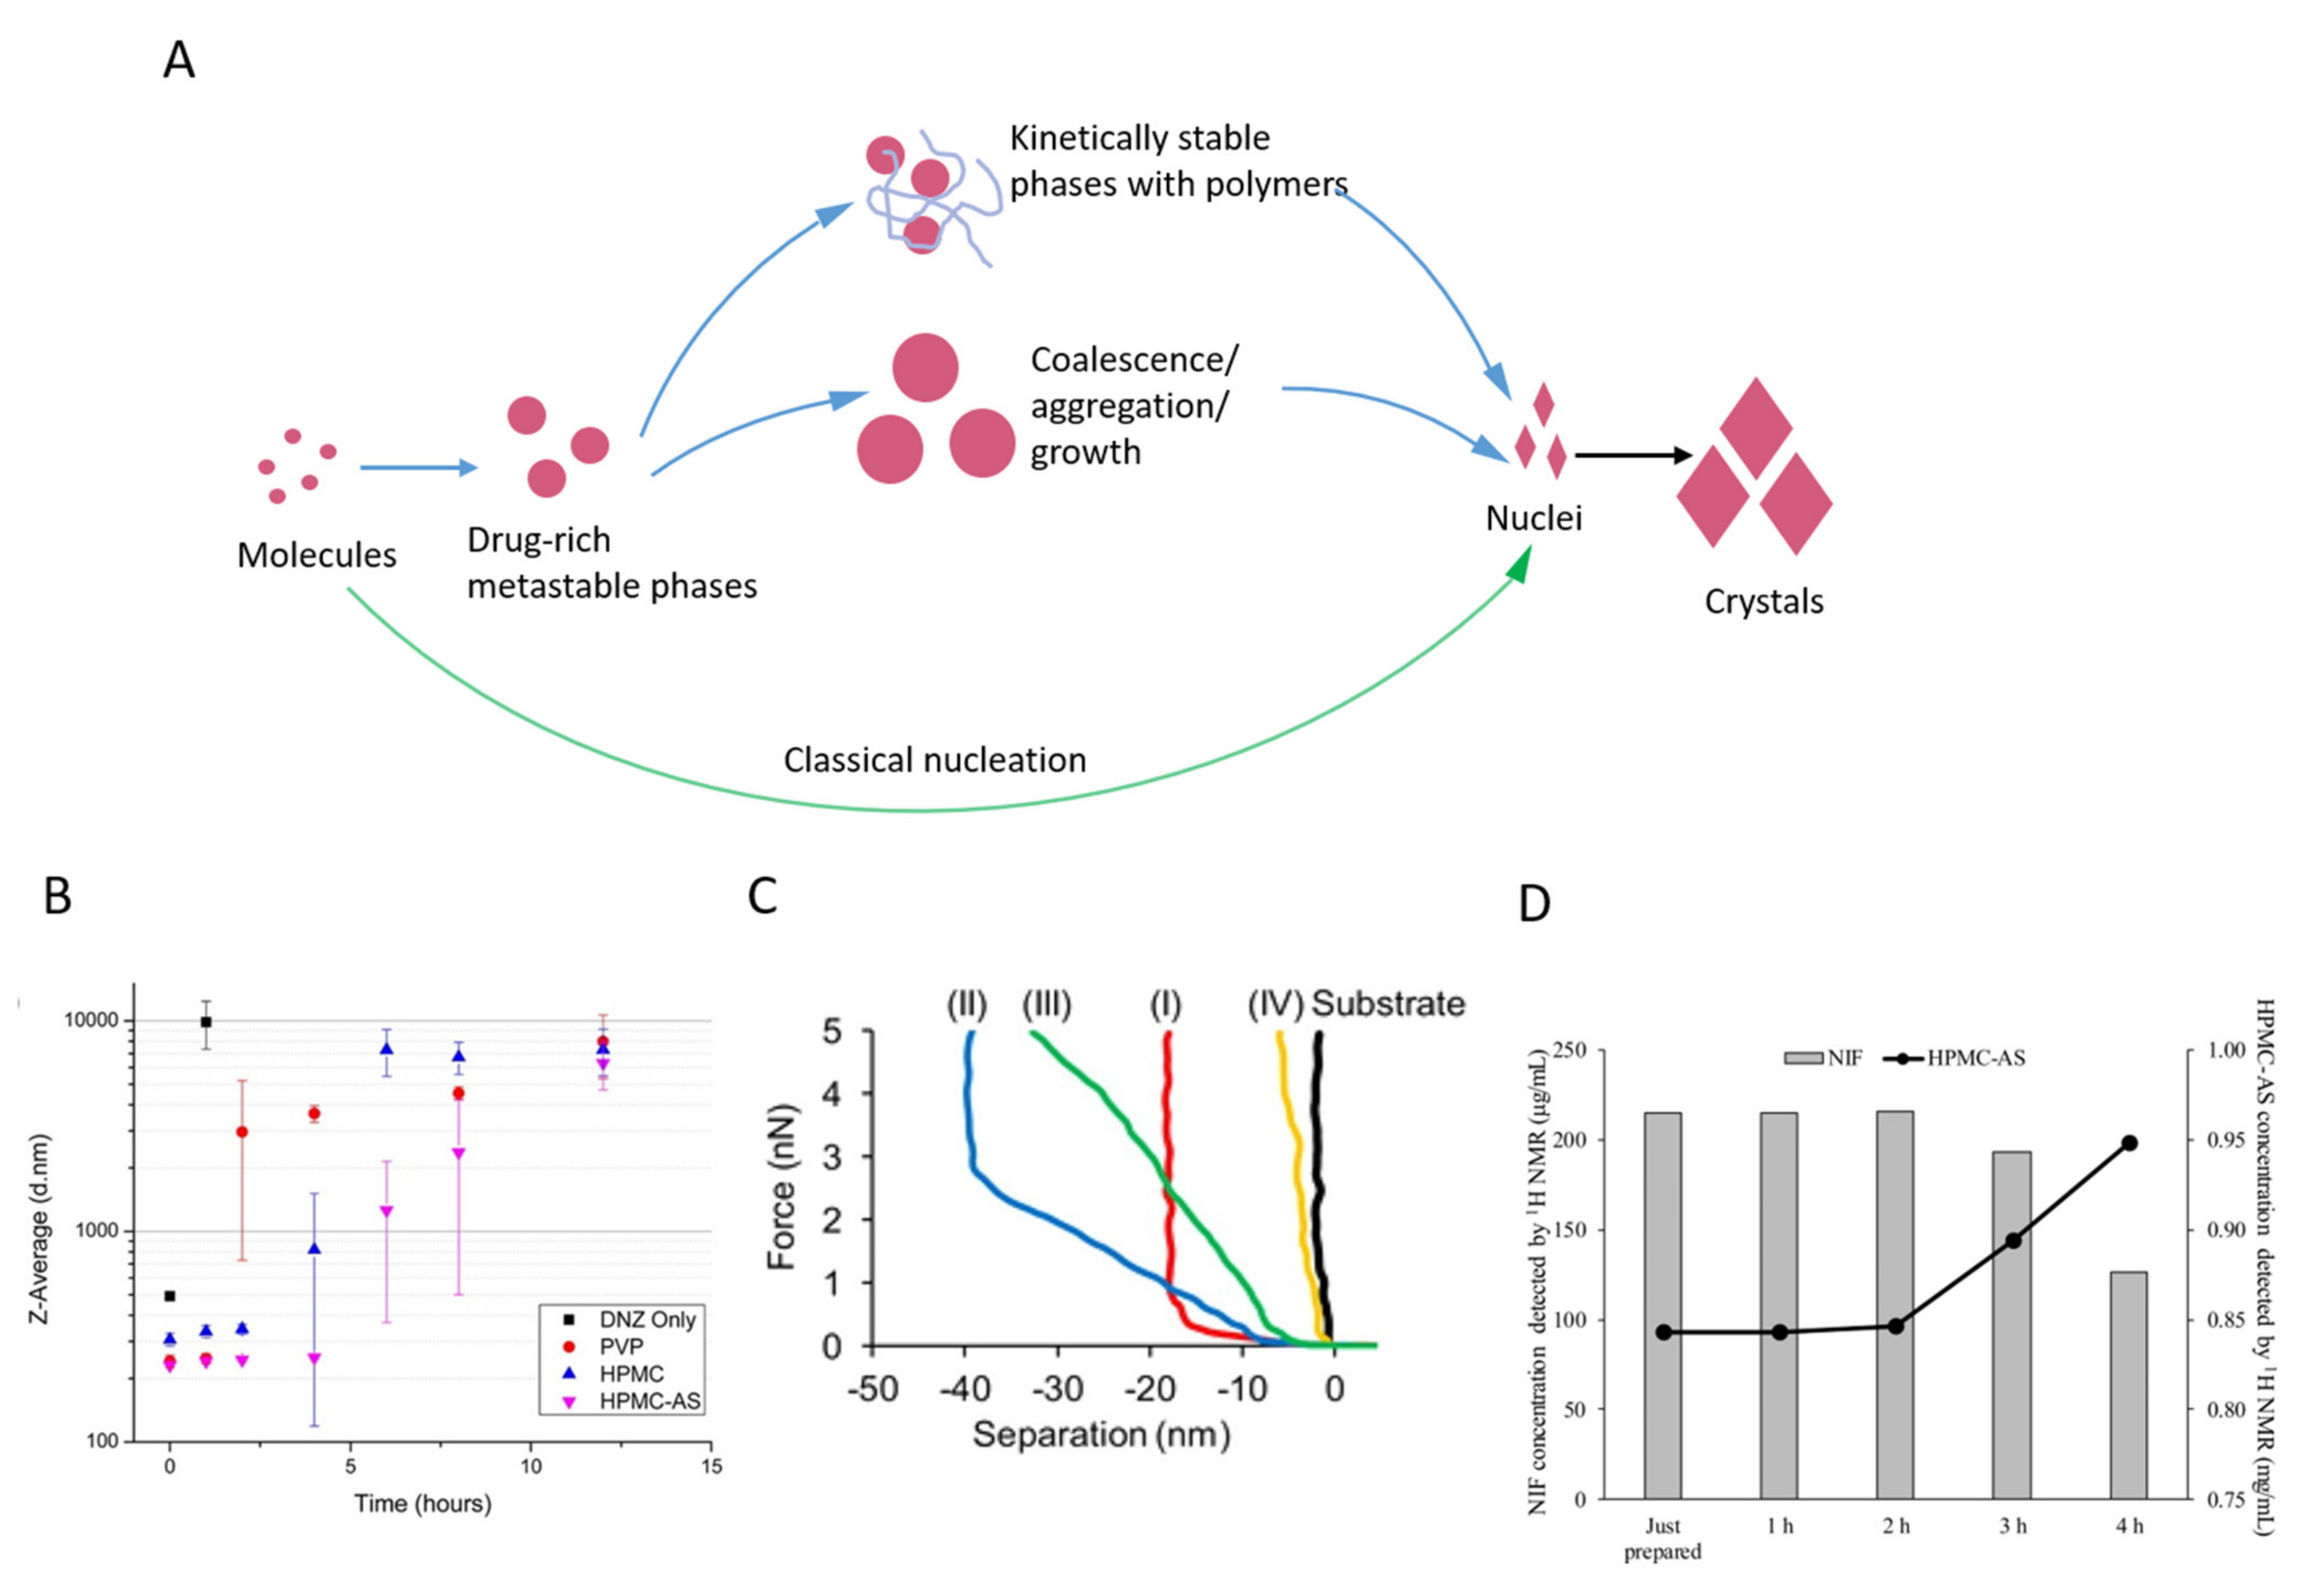
2.3. Kinetic Stability of Drug-Rich Phases

| Drugs | Drug Weight Fraction (%) | Excipients | Drug-rich Phase Formation Concentration (μg/mL) | Size (nm) | Metastable Phase a | Apparent Solubility/Binodal Point Concentration | References |
|---|---|---|---|---|---|---|---|
| Ritonavir | 10 | PVP | 27–28.5 | / | 1 | 0.69 | [93,95,110] |
| PVPVA | 26.8–27.5 | / | 1 | 2.96 | |||
| HPMCAS | 27.5 | / | 1 | 1.27 | |||
| 50 | PVP | 27–28.5 | / | 0 | 0.69 | ||
| PVPVA | 26.8–27.5 | / | 0 | 0.37 | |||
| HPMCAS | 27.5 | / | 1 | 0.76 | |||
| 10 | pure drug | 18.2 | 188–830 | / | ∼1 | ||
| PVP | 18.3 | 188–631 | 1 | ∼1 | |||
| PAA b | 18.3 | 213–922 | 1 | ∼1 | |||
| HPMC | 18.7 | 203–714 | 1 | ∼1 | |||
| HPMCAS | 18.2 | 235–352 | 1 | ∼1 | |||
| CAAdP 0.85 c | 21.3 | 203–248 | 1 | ∼1 | |||
| 10–30 | PVPVA | ∼30 | 218 | 1 | 8.67–3.33 | ||
| 35–50 | / | 0 | 0.3–0.5 | ||||
| clotrimazole | / | pure drug | 490.2 (pH 4) | 100–400 | 1 | 0.98 | [72] |
| 7.7 (pH 8) | 1 | 0.87 | |||||
| nicardipine | / | pure drug | 105.9 (pH 6) | 100–400 | 1 | 1.1 | [72] |
| 5.5 (pH 9) | 1 | 0.69 | |||||
| atazanavir | / | pure drug | 668.4 (pH 3.5) | 100–400 | 1 | 0.95 | [72,111] |
| 65.8 (pH 9) | 1 | 0.91 | |||||
| / | pure drug | / | 204–226 | / | / | ||
| 10 | HPMCAS | 78 | 294 | 1 | 3.21 | ||
| 30 | / | 0 | 1.28 | ||||
| 50 | / | 0 | 1 | ||||
| 10 | HPMCS | 78 | 326 | 1 | 2.95 | ||
| 30 | / | 0 | 1 | ||||
| 50 | / | 0 | 1 | ||||
| 10 | PVPVA | 94 | / | 0 | 1.17 | ||
| 30 | / | 0 | 0.96 | ||||
| 50 | / | 0 | 0.74 | ||||
| danazol | / | pure drug | 8.0 (estimated) | 267 | / | / | [112] |
| 10 | PVP | mean 6.0 | 256 | 1 | 1.58 | ||
| 50 | mean 8.5 | / | 1 | 1.12 | |||
| 10 | HPMC | mean 8.5 | 284 | 1 | 1.18 | ||
| 50 | mean 8.5 | / | 1 | 1.18 | |||
| 10 | HPMCAS | mean 6.5 | 246 | 1 | 2.54 | ||
| 50 | 8.0 (estimated) | / | 0 | 0.75 | |||
| nilvadipine | 5–10 | PVPVA | 30–31.9 | 237–246 | 1 | ∼3 | [113] |
| 15–20 | / | 0 | ∼0.5 | ||||
| cilnidipine | 5–15 | PVPVA | 0.5–0.6 | 255–366 | 1 | ∼158 | [113] |
| 20–25 | / | 0 | ∼1–2 | ||||
| glibenclamide | 33.3 | HPMC | ∼150 | / | 0 | 1 | [114] |
| HPMCAS-LF | ∼150 | / | 1 | 2.4 | |||
| HPMCAS-HF | ∼150 | / | 0 | 1 | |||
| enzalutamide | / | pure drug | 42–43 | / | / | / | [53] |
| 10 | PVPVA | 42 | / | 1 | 1 | ||
| 50 | / | 0 | 0.95 | ||||
| 10 | HPMCAS | 43 | / | / | 0.24 | ||
| 50 | / | / | 1 | ||||
| Lopinavir | 50 | HPMC | 17.4 | / | / | 1 | [70] |
| itraconazole | 25 | HPMCAS-HF | ∼0.1 | / | 1 | 1600 | [54,115] |
| HPMCAS-LF | ∼0.1 | / | 1 | 4500 | |||
| HPMCAS 716HP | 0.1 (0% SIFl) | 170 | 1 | 4530 | |||
| 6 (0.5% SIFl) | 150 | 1 | 81.16 | ||||
| 20 (2% SIFl) | 200 | 1 | 31.1 | ||||
| HPMCAS 126HP | 0.1 (0% SIFl) | 140 | 1 | 1540 | |||
| 6 (0.5% SIFl) | 160 | 1 | 31 | ||||
| 20 (2% SIFl) | 170 | 1 | 8.5 | ||||
| HPMCAS 716HP; HPMCAS HF | 0.1 (0% SIFl) | 210 | 1 | 4030 | |||
| 6 (0.5% SIFl) | 200 | 1 | 93.33 | ||||
| 20 (2% SIFl) | 190 | 1 | 29.05 | ||||
| Telaprevir | 10 | PVPVA | 100 | 156 | 1 | 1.22 | [116] |
| 30 | 0 | 0.8 | |||||
| 50 | 0 | 0.75 | |||||
| 10 | HPMC | 96 | 147 | 1 | 1.88 | ||
| 30 | 1 | 1.1 | |||||
| 10 | HPMCAS | 102 | 99 | 1 | 1.57 | ||
| 30 | 1 | 1.17 | |||||
| 50 | 0 | 0.88 | |||||
| 50 | HPMCAS + 5% SDS d | 1 | 1.08 | ||||
| 10 | CA Sub e | 111 | 76 | 1 | 1.44 | ||
| phenytoin | 10 | HPMCAS | / | 15 | 1 | / | [105,117] |
| 25 | 15 | 1 | / | ||||
| 50 | / | 0 | / | ||||
| 10 | C2-PNIPA-m-7 f | / | 1.8–2.0 (pure polymer) | 1 | <1 | ||
| C12-PNIPA-m-7 f | / | 7.6–7.9(pure polymer) | 1 | <1 | |||
| C12-PNIPA-m-30 f | / | 12.0–12.7 (pure polymer) | 1 | <1 | |||
| C12-PNIPA-m-98 f | / | 24.5–32.1;7.9–8.6 (pure polymer) | 1 | <1 | |||
| probucol | 10 | HPMCAS | <1 | 16–20 | 1 | / | [96,105,106,118,119,120] |
| 25 | 70 | 1 | / | ||||
| 50 | 180 | 1 | / | ||||
| 25 | HPMC; SDS (weight ratio of 1.75:1.25) | <1 | 25–93.9 (0–7days) | 1 | >500 | ||
| 14.3 | HPMC; SDS (weight ratio of 2:1) | <1 | 25.3–138.3 (0–12days) | 1 | >500 | ||
| 0 | PDMA | / | 14.5 | 1 | <1 | ||
| 10 | 54 | 1 | <1 | ||||
| 25 | 6.3 | 1 | <1 | ||||
| 50 | 13.1 | 1 | <1 | ||||
| 0 | P(DMA-grad-MAG) | / | 35 | 1 | <1 | ||
| 10 | 48 | 1 | <1 | ||||
| 25 | 61 | 1 | <1 | ||||
| 50 | 8 | 1 | <1 | ||||
| 0 | PEP-PDMA | / | 25.8 | 1 | <1 | ||
| 10 | 25.1 | 1 | <1 | ||||
| 25 | 65 | 1 | <1 | ||||
| 50 | 77 | 1 | <1 | ||||
| 10;25 | PND34-C2 | ∼2000 (without excipient) | 5.7 | 1 | <1 | ||
| PND34-C12 | 15.9 | 1 | <1 | ||||
| PND34-b-PS2-C12 | 19.7 | 1 | <1 | ||||
| PND34-b-PS9-C12 | 22.7 | 1 | <1 | ||||
| PND34-b-PS14-C12 | 27.0 | 1 | <1 | ||||
| 10 | PNIPAm; 5.0 mol % BIS h, i | / | 42–46 | 1 | / | ||
| PNIPAm; 2.5 mol % BIS h, i | 43–44 | 1 | / | ||||
| PNIPAm; 0.5 mol % BIS h, i | 41–43 | 1 | / | ||||
| nilutamide | 10;25 | PND34-C2 | ∼1400 (without excipient) | 5.7 | 1 | <1 | [119] |
| PND34-C12 | 15.9 | 1 | <1 | ||||
| PND34-b-PS2-C12 g | 19.7 | 1 | <1 | ||||
| PND34-b-PS9-C12 g | 22.7 | 1 | <1 | ||||
| PND34-b-PS14-C12 g | 27.0 | 1 | <1 | ||||
| nifedipine | 10 | HPMC-E5 LV j | 110–156 (5–25 °C, without excipient) | ∼200 | 1 | 1.05 | [121] |
| 20 | 1 | 1.15 | |||||
| 10 | PVPVA | 1 | 1.1 | ||||
| 20 | 1 | 1 | |||||
| anacetrapib | 20 | copovidone; TPGS | <1 | 50–200 (10–2% TPGS) k | 1 | ∼90 | [122,123] |
| / |
3. In Vitro Permeability Enhancement Achieved by the ASD Solution
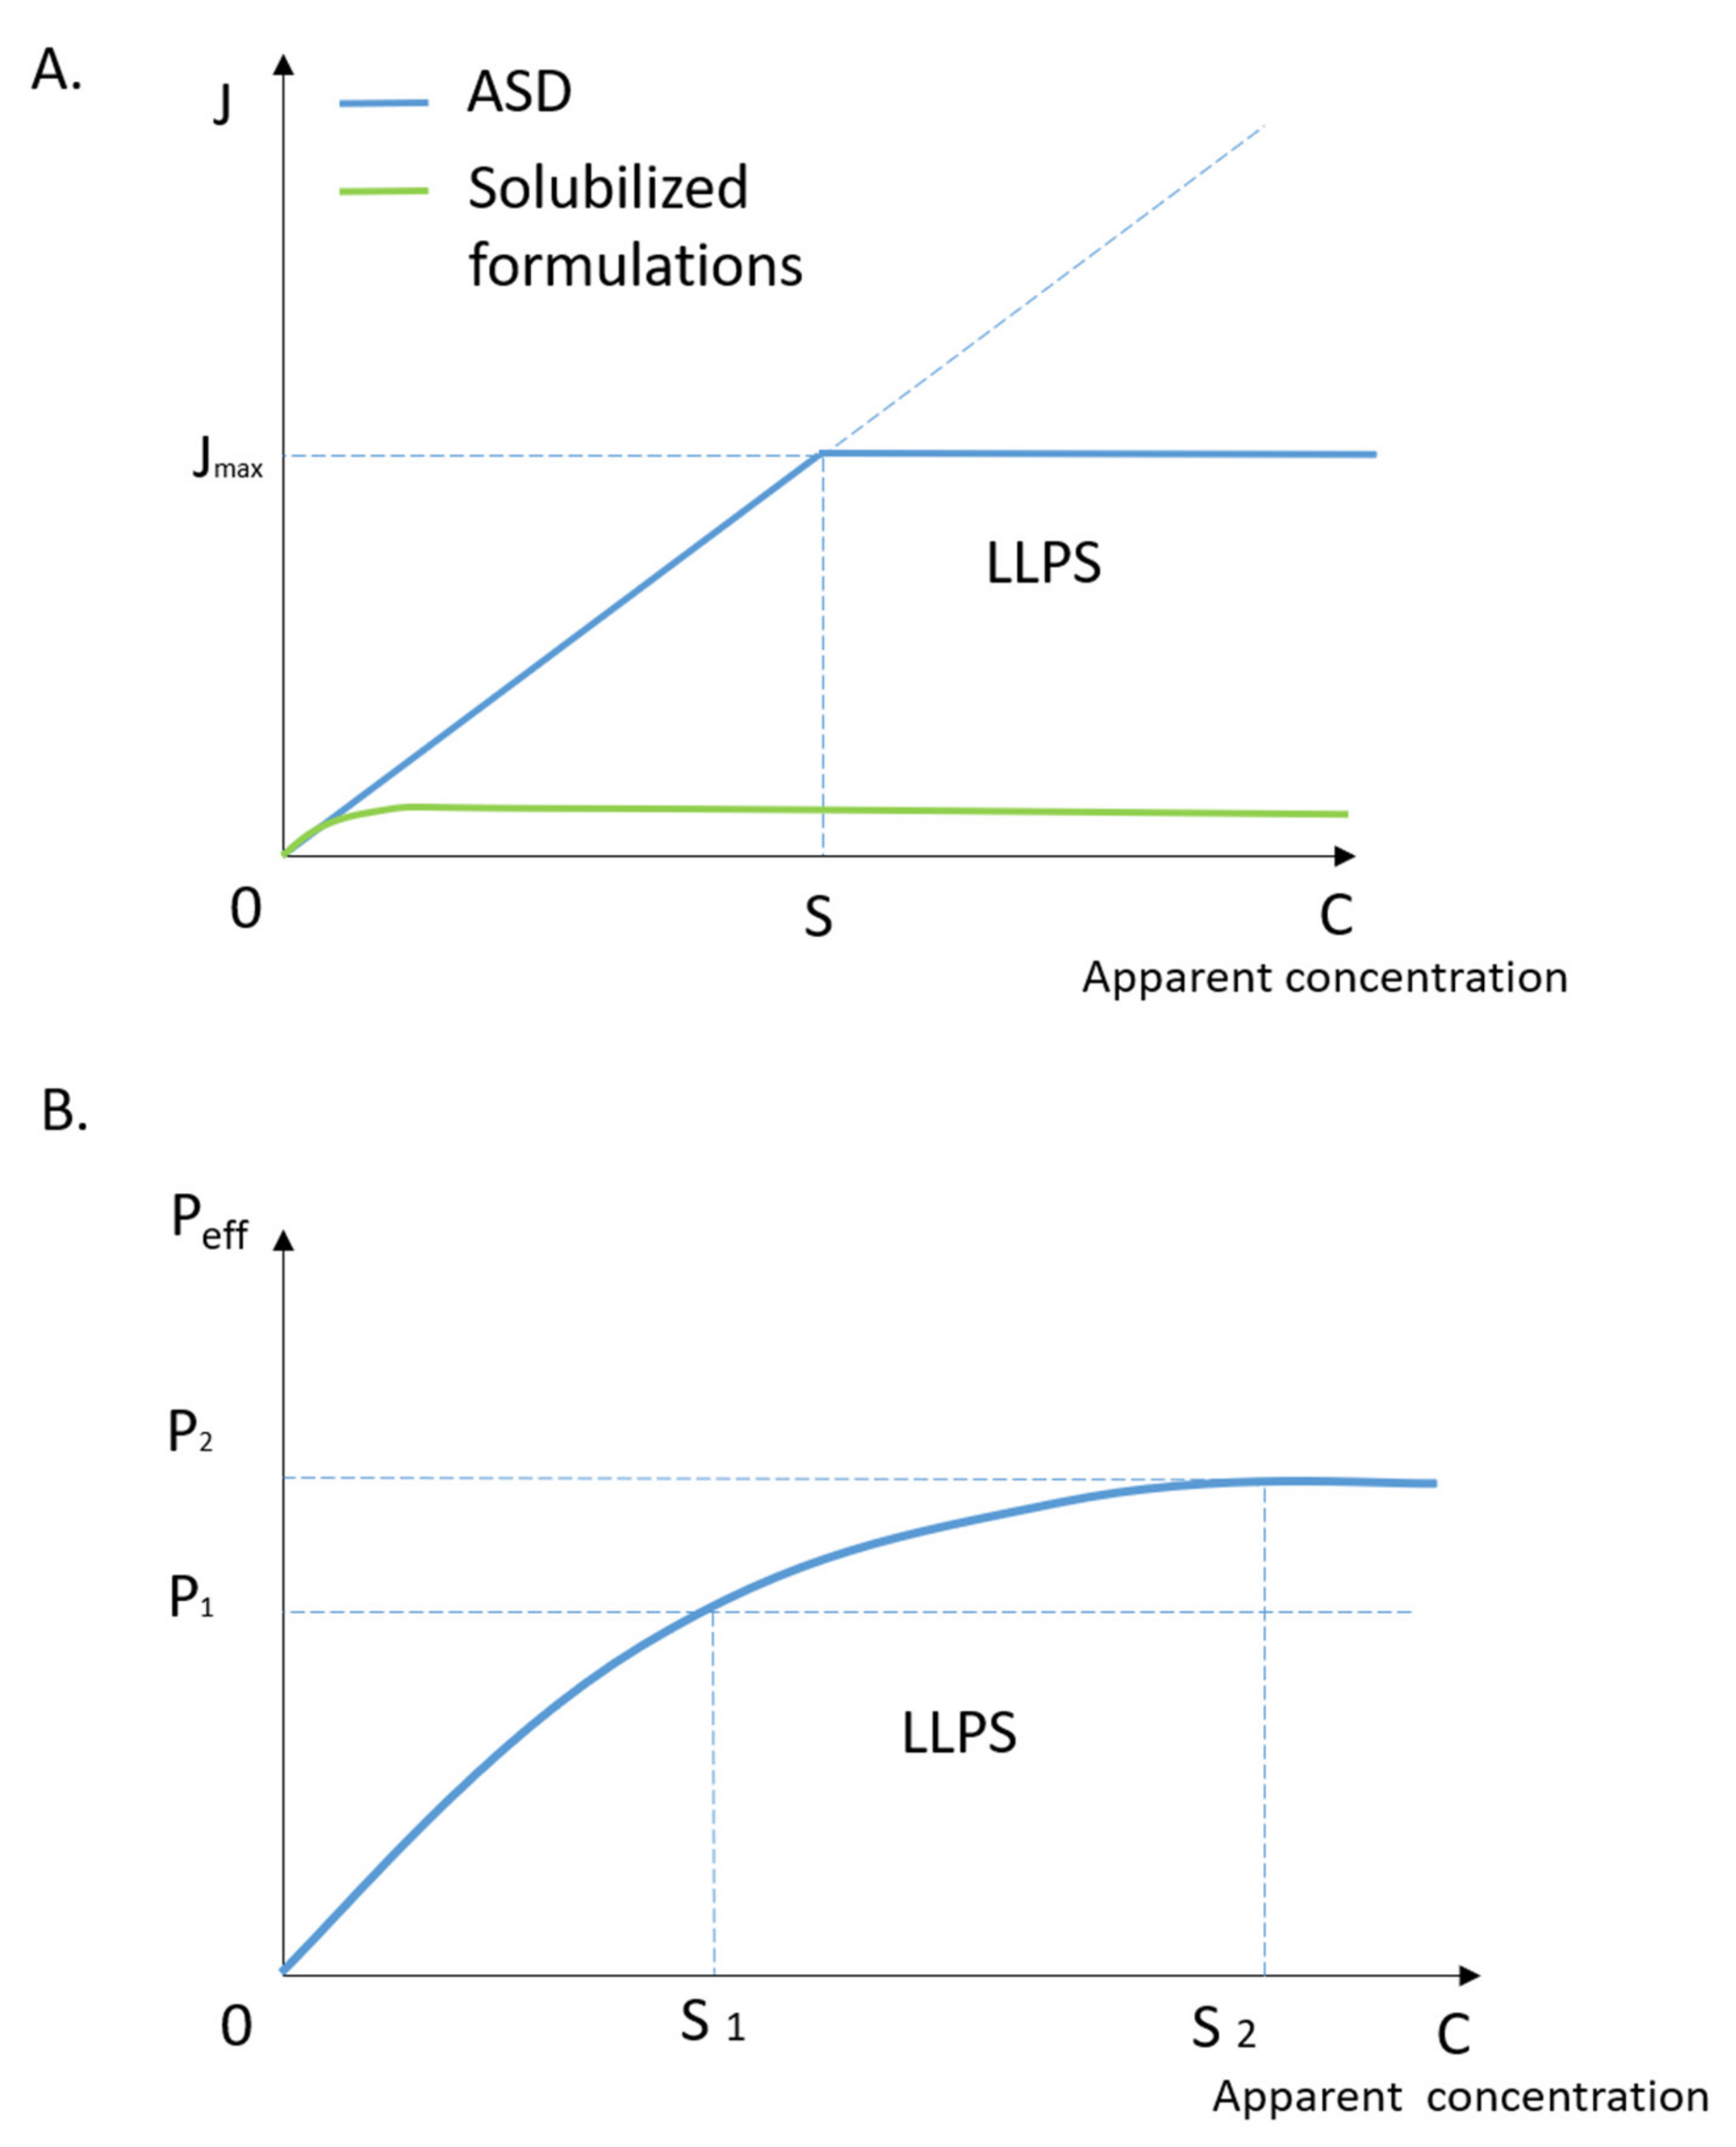
3.1. Drug Solubility-Permeability Interplay
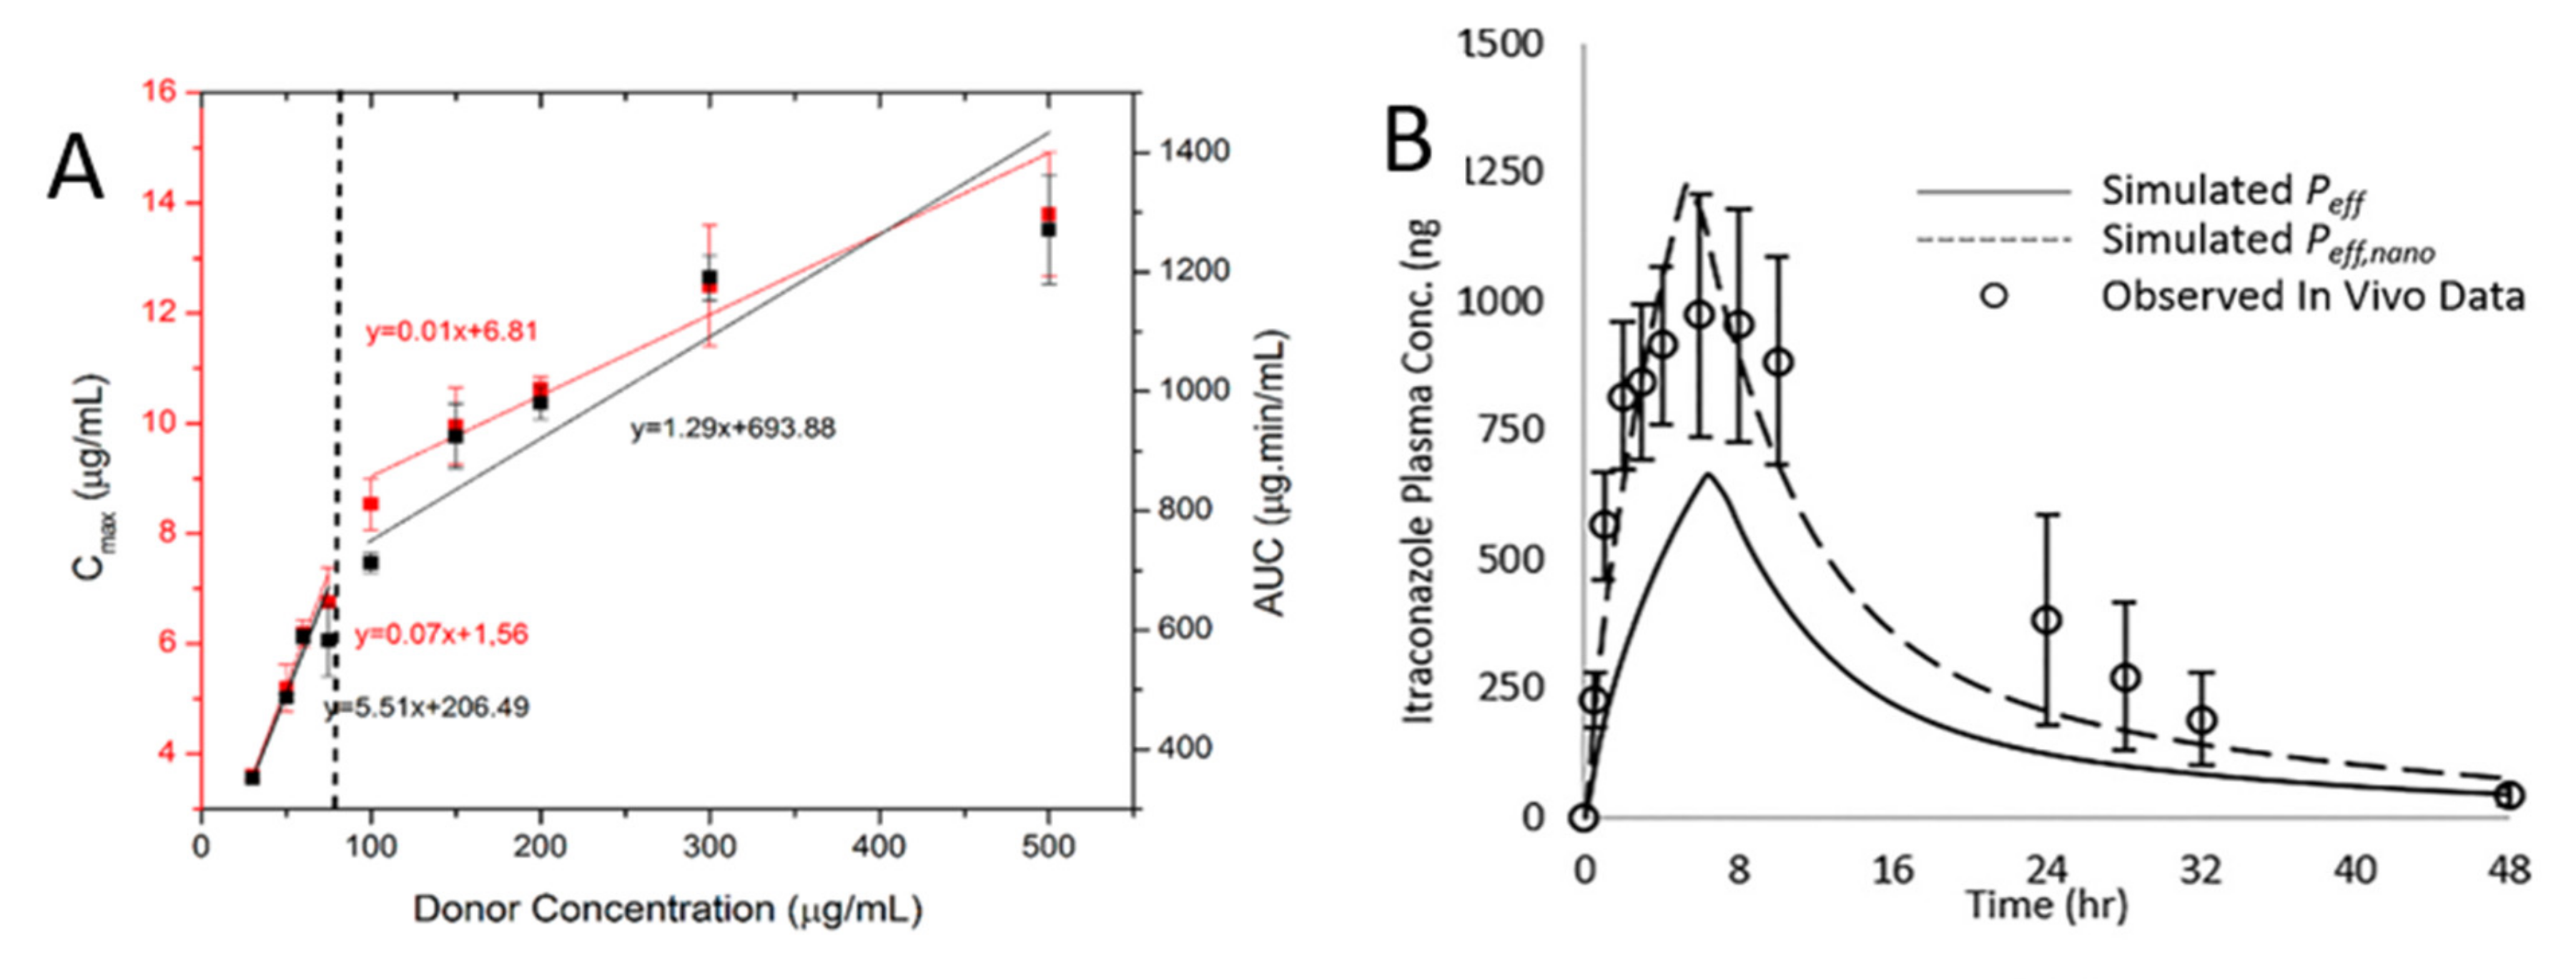
3.2. The Roles of Drug-rich Phase in Membrane Transportation
3.3. The Importance of Polymeric Excipients for Drug Permeability Enhancement
4. Conclusions
Author Contributions
Funding
Institutional Review Board Statement
Informed Consent Statement
Data Availability Statement
Acknowledgments
Conflicts of Interest
References
- Waring, M.J.; Arrowsmith, J.; Leach, A.R.; Leeson, P.D.; Mandrell, S.; Owen, R.M.; Pairaudeau, G.; Pennie, W.D.; Pickett, S.D.; Wang, J.; et al. An Analysis of the Attrition of Drug Candidates from Four Major Pharmaceutical Companies. Nat. Rev. Drug Discov. 2015, 14, 475–486. [Google Scholar] [CrossRef] [PubMed]
- Ting, J.M.; Porter, W.W.; Mecca, J.M.; Bates, F.S.; Reineke, T.M. Advances in Polymer Design for Enhancing Oral Drug Solubility and Delivery. Bioconjugate Chem. 2018, 29, 939–952. [Google Scholar] [CrossRef] [PubMed]
- Lipinski, C.A.; Lombardo, F.; Dominy, B.W.; Feeney, P.J. Experimental and Computational Approaches to Estimate Solubility and Permeability in Drug Discovery and Development Settings. Adv. Drug Deliv. Rev. 2012, 23, 3–25. [Google Scholar] [CrossRef]
- Dahan, A.; Miller, J.M.; Amidon, G.L. Prediction of Solubility and Permeability Class Membership: Provisional BCS Classification of the World’s Top Oral Drugs. AAPS J. 2009, 11, 740–746. [Google Scholar] [CrossRef] [Green Version]
- Loftsson, T.; Brewster, M.E. Pharmaceutical Applications of Cyclodextrins: Basic Science and Product Development. J. Pharm. Pharmacol. 2010, 62, 1607–1621. [Google Scholar] [CrossRef]
- Takagi, T.; Ramachandran, C.; Bermejo, M.; Yamashita, S.; Yu, L.X.; Amidon, G.L. A Provisional Biopharmaceutical Classification of the Top 200 Oral Drug Products in the United States, Great Britain, Spain, and Japan. Mol. Pharm. 2006. [Google Scholar] [CrossRef] [PubMed]
- Thayer, A.M. Finding Solutions. Chem. Eng. News 2010. [Google Scholar] [CrossRef]
- Babu, N.J.; Nangia, A. Solubility Advantage of Amorphous Drugs and Pharmaceutical Cocrystals. Cryst. Growth Des. 2011, 11, 2662–2679. [Google Scholar] [CrossRef]
- Schittny, A.; Huwyler, J.; Puchkov, M. Mechanisms of Increased Bioavailability through Amorphous Solid Dispersions: A Review. Drug Deliv. 2020, 27, 110–127. [Google Scholar] [CrossRef]
- Kanaujia, P.; Poovizhi, P.; Ng, W.K.; Tan, R.B.H. Amorphous Formulations for Dissolution and Bioavailability Enhancement of Poorly Soluble APIs. Powder Technol. 2015, 285, 2–15. [Google Scholar] [CrossRef]
- Buraphacheep, V.; Morakul, B. Nanocrystals for Enhancement of Oral Bioavailability of Poorly Water-Soluble Drugs. Asian J. Pharm. Sci. 2015, 10, 13–23. [Google Scholar] [CrossRef] [Green Version]
- Gigliobianco, M.R.; Casadidio, C.; Censi, R.; Di Martino, P. Nanocrystals of Poorly Soluble Drugs: Drug Bioavailability and Physicochemical Stability. Pharmaceutics 2018, 10, 134. [Google Scholar] [CrossRef] [PubMed] [Green Version]
- Porter, C.J.H.; Trevaskis, N.L.; Charman, W.N. Lipids and Lipid-Based Formulations: Optimizing the Oral Delivery of Lipophilic Drugs. Nat. Rev. Drug Discov. 2007, 6, 231–248. [Google Scholar] [CrossRef] [PubMed]
- Lee, M.K. Liposomes for Enhanced Bioavailability of Water-Insoluble Drugs: In Vivo Evidence and Recent Approaches. Pharmaceutics 2020, 12, 264. [Google Scholar] [CrossRef] [PubMed] [Green Version]
- Kang, B.K.; Lee, J.S.; Chon, S.K.; Jeong, S.Y.; Yuk, S.H.; Khang, G.; Lee, H.B.; Cho, S.H. Development of Self-Microemulsifying Drug Delivery Systems (SMEDDS) for Oral Bioavailability Enhancement of Simvastatin in Beagle Dogs. Int. J. Pharm. 2004, 274, 65–73. [Google Scholar] [CrossRef]
- Mashinchian, O.; Johari-Ahar, M.; Ghaemi, B.; Rashidi, M.; Barar, J.; Omidi, Y. Impacts of Quantum Dots in Molecular Detection and Bioimaging of Cancer. BioImpacts 2014, 4, 149–166. [Google Scholar] [CrossRef] [Green Version]
- Drugs@FDA: FDA-Approved Drugs. Available online: https://www.acessdata.fda.gov/scripts/cder/daf/index.cfm (accessed on 15 February 2021).
- Hancock, B.C.; Parks, M. What Is the True Solubility Advantage for Amorphous Pharmaceuticals? Pharm. Res. 2000. [Google Scholar] [CrossRef]
- Xiong, X.; Xu, K.; Du, Q.; Zeng, X.; Xiao, Y.; Yang, H.; Li, H. Effects of Temperature and Solvent on the Solid-State Transformations of Pranlukast During Mechanical Milling. J. Pharm. Sci. 2017. [Google Scholar] [CrossRef]
- Huang, Y.; Dai, W.-G. Fundamental Aspects of Solid Dispersion Technology for Poorly Soluble Drugs. Acta Pharm. Sin. B 2014, 4, 18–25. [Google Scholar] [CrossRef] [Green Version]
- LaFountaine, J.S.; McGinity, J.W.; Williams, R.O. Challenges and Strategies in Thermal Processing of Amorphous Solid Dispersions: A Review. AAPS PharmSciTech 2016. [Google Scholar] [CrossRef] [Green Version]
- Ricarte, R.G.; Van Zee, N.J.; Li, Z.; Johnson, L.M.; Lodge, T.P.; Hillmyer, M.A. Recent Advances in Understanding the Micro-and Nanoscale Phenomena of Amorphous Solid Dispersions. Mol. Pharm. 2019, 16, 4089–4103. [Google Scholar] [CrossRef]
- Jackson, M.J.; Toth, S.J.; Kestur, U.S.; Huang, J.; Qian, F.; Hussain, M.A.; Simpson, G.J.; Taylor, L.S. Impact of Polymers on the Precipitation Behavior of Highly Supersaturated Aqueous Danazol Solutions. Mol. Pharm. 2014, 11, 3027–3038. [Google Scholar] [CrossRef]
- Baghel, S.; Cathcart, H.; O’Reilly, N.J. Polymeric Amorphous Solid Dispersions: A Review of Amorphization, Crystallization, Stabilization, Solid-State Characterization, and Aqueous Solubilization of Biopharmaceutical Classification System Class II Drugs. J. Pharm. Sci. 2016, 105, 2527–2544. [Google Scholar] [CrossRef] [PubMed] [Green Version]
- Vasconcelos, T.; Marques, S.; das Neves, J.; Sarmento, B. Amorphous Solid Dispersions: Rational Selection of a Manufacturing Process. Adv. Drug Deliv. Rev. 2016, 100, 85–101. [Google Scholar] [CrossRef] [PubMed]
- Jermain, S.V.; Brough, C.; Williams, R.O. Amorphous Solid Dispersions and Nanocrystal Technologies for Poorly Water-Soluble Drug Delivery—An Update. Int. J. Pharm. 2018, 535, 379–392. [Google Scholar] [CrossRef] [PubMed]
- Rams-Baron, M.; Jachowicz, R.; Boldyreva, E.; Zhou, D.; Jamroz, W.; Paluch, M. Amorphous Drugs: Benefits and Challenges; Springer International Publishing: Cham, Switzerland, 2018; ISBN 9783319720029. [Google Scholar]
- Uttaro, E.; Pudipeddi, M.; Schweighardt, A.; Zhao, F. To Crush or Not to Crush: A Brief Review of Novel Tablets and Capsules Prepared from Nanocrystal and Amorphous Solid Dispersion Technologies. Am. J. Health-Syst. Pharm. 2021, 78, 389–394. [Google Scholar] [CrossRef]
- Tian, Y.; Jacobs, E.; Jones, D.S.; McCoy, C.P.; Wu, H.; Andrews, G.P. The Design and Development of High Drug Loading Amorphous Solid Dispersion for Hot-Melt Extrusion Platform. Int. J. Pharm. 2020, 586, 119545. [Google Scholar] [CrossRef] [PubMed]
- Kissi, E.O.; Khorami, K.; Rades, T. Determination of Stable Co-Amorphous Drug-Drug Ratios from the Eutectic Behavior of Crystalline Physical Mixtures. Pharmaceutics 2019, 11, 628. [Google Scholar] [CrossRef] [PubMed] [Green Version]
- Shi, Q.; Moinuddin, S.M.; Cai, T. Advances in Coamorphous Drug Delivery Systems. Acta Pharm. Sin. B 2019. [Google Scholar] [CrossRef]
- Su, M.; Xia, Y.; Shen, Y.; Heng, W.; Wei, Y.; Zhang, L.; Gao, Y.; Zhang, J.; Qian, S. A Novel Drug-Drug Coamorphous System without Molecular Interactions: Improve the Physicochemical Properties of Tadalafil and Repaglinide. RSC Adv. 2019. [Google Scholar] [CrossRef] [Green Version]
- Shayanfar, A.; Jouyban, A. Drug-Drug Coamorphous Systems: Characterization and Physicochemical Properties of Coamorphous Atorvastatin with Carvedilol and Glibenclamide. J. Pharm. Innov. 2013. [Google Scholar] [CrossRef]
- Balk, A.; Wiest, J.; Widmer, T.; Galli, B.; Holzgrabe, U.; Meinel, L. Transformation of Acidic Poorly Water Soluble Drugs into Ionic Liquids. Eur. J. Pharm. Biopharm. 2015. [Google Scholar] [CrossRef] [PubMed]
- Stoimenovski, J.; MacFarlane, D.R.R. Enhanced Membrane Transport of Pharmaceutically Active Protic Ionic Liquids. Chem. Commun. 2011, 47, 11429. [Google Scholar] [CrossRef]
- Yang, D.; Liu, C.; Piao, H.; Quan, P.; Fang, L. Enhanced Drug Loading in the Drug-in-Adhesive Transdermal Patch Utilizing a Drug-Ionic Liquid Strategy: Insight into the Role of Ionic Hydrogen Bonding. Mol. Pharm. 2021, 18, 1157–1166. [Google Scholar] [CrossRef] [PubMed]
- Löbmann, K.; Grohganz, H.; Laitinen, R.; Strachan, C.; Rades, T. Amino Acids as Co-Amorphous Stabilizers for Poorly Water Soluble Drugs—Part 1: Preparation, Stability and Dissolution Enhancement. Eur. J. Pharm. Biopharm. 2013. [Google Scholar] [CrossRef]
- Wiest, J.; Saedtler, M.; Balk, A.; Merget, B.; Widmer, T.; Bruhn, H.; Raccuglia, M.; Walid, E.; Picard, F.; Stopper, H.; et al. Mapping the Pharmaceutical Design Space by Amorphous Ionic Liquid Strategies. J. Control. Release 2017. [Google Scholar] [CrossRef] [PubMed]
- Wilkes, J.S. A Short History of Ionic Liquids—From Molten Salts to Neoteric Solvents. Green Chem. 2002, 4, 73–80. [Google Scholar] [CrossRef]
- Hough, W.L.; Smiglak, M.; Rodríguez, H.; Swatloski, R.P.; Spear, S.K.; Daly, D.T.; Pernak, J.; Grisel, J.E.; Carliss, R.D.; Soutullo, M.D.; et al. The Third Evolution of Ionic Liquids: Active Pharmaceutical Ingredients. New J. Chem. 2007. [Google Scholar] [CrossRef]
- Egorova, K.S.; Gordeev, E.G.; Ananikov, V.P. Biological Activity of Ionic Liquids and Their Application in Pharmaceutics and Medicine. Chem. Rev. 2017, 117, 7132–7189. [Google Scholar] [CrossRef]
- Shamshina, J.L.; Barber, P.S.; Rogers, R.D. Ionic Liquids in Drug Delivery. Expert Opin. Drug Deliv. 2013, 10, 1367–1381. [Google Scholar] [CrossRef]
- Lovejoy, K.S.; Corley, C.A.; Cope, E.K.; Valentine, M.C.; Leid, J.G.; Purdy, G.M.; Wilkes, J.S.; Koppisch, A.T.; Del Sesto, R.E. Utilization of Metal Halide Species Ambiguity to Develop Amorphous, Stabilized Pharmaceutical Agents as Ionic Liquids. Cryst. Growth Des. 2012. [Google Scholar] [CrossRef]
- Choi, S.Y.; Rodríguez, H.; Gunaratne, H.Q.N.; Puga, A.V.; Gilpin, D.; McGrath, S.; Vyle, J.S.; Tunney, M.M.; Rogers, R.D.; McNally, T. Dual Functional Ionic Liquids as Antimicrobials and Plasticisers for Medical Grade PVCs. RSC Adv. 2014. [Google Scholar] [CrossRef]
- Araújo, J.M.M.; Florindo, C.; Pereiro, A.B.; Vieira, N.S.M.; Matias, A.A.; Duarte, C.M.M.; Rebelo, L.P.N.; Marrucho, I.M. Cholinium-Based Ionic Liquids with Pharmaceutically Active Anions. RSC Adv. 2014. [Google Scholar] [CrossRef]
- Egorova, K.S.; Ananikov, V.P. Fundamental Importance of Ionic Interactions in the Liquid Phase: A Review of Recent Studies of Ionic Liquids in Biomedical and Pharmaceutical Applications. J. Mol. Liq. 2018, 272, 271–300. [Google Scholar] [CrossRef]
- Verreck, G.; Chun, I.; Peeters, J.; Rosenblatt, J.; Brewster, M.E. Preparation and Characterization of Nanofibers Containing Amorphous Drug Dispersions Generated by Electrostatic Spinning. Pharm. Res. 2003. [Google Scholar] [CrossRef] [PubMed]
- Young, T.J.; Mawson, S.; Johnston, K.P.; Henriksen, I.B.; Pace, G.W.; Mishra, A.K. Rapid Expansion from Supercritical to Aqueous Solution to Produce Submicron Suspensions of Water-Insoluble Drugs. Biotechnol. Prog. 2000. [Google Scholar] [CrossRef] [PubMed]
- Amstad, E.; Gopinadhan, M.; Holtze, C.; Osuji, C.O.; Brenner, M.P.; Spaepen, F.; Weitz, D.A. Production of Amorphous Nanoparticles by Supersonic Spray-Drying with a Microfluidic Nebulator. Science 2015. [Google Scholar] [CrossRef] [Green Version]
- Cheow, W.S.; Kiew, T.Y.; Hadinoto, K. Amorphous Nanodrugs Prepared by Complexation with Polysaccharides: Carrageenan versus Dextran Sulfate. Carbohydr. Polym. 2015. [Google Scholar] [CrossRef]
- Jog, R.; Burgess, D.J. Pharmaceutical Amorphous Nanoparticles. J. Pharm. Sci. 2017, 106, 39–65. [Google Scholar] [CrossRef] [Green Version]
- Indulkar, A.S.; Gao, Y.; Raina, S.A.; Zhang, G.G.Z.; Taylor, L.S. Exploiting the Phenomenon of Liquid-Liquid Phase Separation for Enhanced and Sustained Membrane Transport of a Poorly Water-Soluble Drug. Mol. Pharm. 2016, 13, 2059–2069. [Google Scholar] [CrossRef] [PubMed]
- Wilson, V.; Lou, X.; Osterling, D.J.; Stolarik, D.F.; Jenkins, G.; Gao, W.; Zhang, G.G.Z.; Taylor, L.S. Relationship between Amorphous Solid Dispersion In Vivo Absorption and In Vitro Dissolution: Phase Behavior during Dissolution, Speciation, and Membrane Mass Transport. J. Control. Release 2018, 292, 172–182. [Google Scholar] [CrossRef]
- Stewart, A.M.; Grass, M.E.; Mudie, D.M.; Morgen, M.M.; Friesen, D.T.; Vodak, D.T. Development of a Biorelevant, Material-Sparing Membrane Flux Test for Rapid Screening of Bioavailability-Enhancing Drug Product Formulations. Mol. Pharm. 2017, 14, 2032–2046. [Google Scholar] [CrossRef] [PubMed] [Green Version]
- Roos, C.; Dahlgren, D.; Berg, S.; Westergren, J.; Abrahamsson, B.; Tannergren, C.; Sjögren, E.; Lennernäs, H. In Vivo Mechanisms of Intestinal Drug Absorption from Aprepitant Nanoformulations. Mol. Pharm. 2017, 14, 4233–4242. [Google Scholar] [CrossRef] [PubMed]
- Sugano, K. Possible Reduction of Effective Thickness of Intestinal Unstirred Water Layer by Particle Drifting Effect. Int. J. Pharm. 2010, 387, 103–109. [Google Scholar] [CrossRef]
- Amidon, G.E.; Higuchi, W.I.; Ho, N.F.H. Theoretical and Experimental Studies of Transport of Micelle-solubilized Solutes. J. Pharm. Sci. 1982, 71, 77–84. [Google Scholar] [CrossRef] [PubMed]
- Denninger, A.; Westedt, U.; Rosenberg, J.; Wagner, K.G. A Rational Design of a Biphasic Dissolution Setup—Modelling of Biorelevant Kinetics for a Ritonavir Hot-Melt Extruded Amorphous Solid Dispersion. Pharmaceutics 2020, 12, 237. [Google Scholar] [CrossRef] [PubMed] [Green Version]
- Paisana, M.C.; Lino, P.R.; Nunes, P.D.; Pinto, J.F.; Henriques, J.; Paiva, A.M. Laser Diffraction as a Powerful Tool for Amorphous Solid Dispersion Screening and Dissolution Understanding. Eur. J. Pharm. Sci. 2021, 163. [Google Scholar] [CrossRef]
- Ueda, K.; Taylor, L.S. Partitioning of Surfactant into Drug-Rich Nanodroplets and Its Impact on Drug Thermodynamic Activity and Droplet Size. J. Control. Release 2021, 330, 229–243. [Google Scholar] [CrossRef]
- Mašková, E.; Kubová, K.; Raimi-Abraham, B.T.; Vllasaliu, D.; Vohlídalová, E.; Turánek, J.; Mašek, J. Hypromellose—A Traditional Pharmaceutical Excipient with Modern Applications in Oral and Oromucosal Drug Delivery. J. Control. Release 2020, 324, 695–727. [Google Scholar] [CrossRef]
- Davey, R.J.; Schroeder, S.L.M.M.; Ter Horst, J.H. Nucleation of Organic Crystals—A Molecular Perspective. Angew. Chem. Int. Ed. 2013, 52, 2167–2179. [Google Scholar] [CrossRef]
- De Yoreo, J. A Perspective on Multistep Pathways of Nucleation. ACS Symp. Ser. 2020, 1358, 1–17. [Google Scholar] [CrossRef]
- De Yoreo, J.J.; Gilbert, P.U.P.A.; Sommerdijk, N.A.J.M.; Penn, R.L.; Whitelam, S.; Joester, D.; Zhang, H.; Rimer, J.D.; Navrotsky, A.; Banfield, J.F.; et al. Crystallization by Particle Attachment in Synthetic, Biogenic, and Geologic Environments. Science 2015, 349, aaa6760. [Google Scholar] [CrossRef] [PubMed]
- Tian, Y.; Qian, K.; Jacobs, E.; Amstad, E.; Jones, D.S.; Stella, L.; Andrews, G.P. The Investigation of Flory-Huggins Interaction Parameters for Amorphous Solid Dispersion across the Entire Temperature and Composition Range. Pharmaceutics 2019, 11, 420. [Google Scholar] [CrossRef] [PubMed] [Green Version]
- Ilevbare, G.A.; Taylor, L.S. Liquid-Liquid Phase Separation in Highly Supersaturated Aqueous Solutions of Poorly Water-Soluble Drugs: Implications for Solubility Enhancing Formulations. Cryst. Growth Des. 2013, 13, 1497–1509. [Google Scholar] [CrossRef]
- Xu, S.; Zhang, H.; Qiao, B.; Wang, Y. Review of Liquid-Liquid Phase Separation in Crystallization: From Fundamentals to Application. Cryst. Growth Des. 2021. [Google Scholar] [CrossRef]
- Du, H.; Amstad, E. Water: How Does It Influence the CaCO3 Formation? Angewandte Chemie—International Edition 2020, 59, 1798–1816. [Google Scholar] [CrossRef]
- Xu, Y.; Tijssen, K.C.H.; Bomans, P.H.H.; Akiva, A.; Friedrich, H.; Kentgens, A.P.M.; Sommerdijk, N.A.J.M. Microscopic Structure of the Polymer-Induced Liquid Precursor for Calcium Carbonate. Nat. Commun. 2018, 9, 1–12. [Google Scholar] [CrossRef] [Green Version]
- Li, N.; Taylor, L.S. Tailoring Supersaturation from Amorphous Solid Dispersions. J. Control. Release 2018, 279, 114–125. [Google Scholar] [CrossRef]
- Raina, S.A.; Alonzo, D.E.; Zhang, G.G.Z.; Gao, Y.; Taylor, L.S. Using Environment-Sensitive Fluorescent Probes to Characterize Liquid-Liquid Phase Separation in Supersaturated Solutions of Poorly Water Soluble Compounds. Pharm. Res. 2015, 32, 3660–3673. [Google Scholar] [CrossRef]
- Indulkar, A.S.; Box, K.J.; Taylor, R.; Ruiz, R.; Taylor, L.S. PH-Dependent Liquid-Liquid Phase Separation of Highly Supersaturated Solutions of Weakly Basic Drugs. Mol. Pharm. 2015, 12, 2365–2377. [Google Scholar] [CrossRef]
- Lafferrère, L.; Hoff, C.; Veesler, S. Study of Liquid-Liquid Demixing from Drug Solution. J. Cryst. Growth 2004, 269, 550–557. [Google Scholar] [CrossRef]
- Baird, J.A.; Van Eerdenbrugh, B.; Taylor, L.S. A Classification System to Assess the Crystallization Tendency of Organic Molecules from Undercooled Melts. J. Pharm. Sci. 2010, 99, 3787–3806. [Google Scholar] [CrossRef]
- Tian, Y.; Jones, D.S.D.S.; Andrews, G.P.G.P. An Investigation into the Role of Polymeric Carriers on Crystal Growth within Amorphous Solid Dispersion Systems. Mol. Pharm. 2015, 12, 1180–1192. [Google Scholar] [CrossRef]
- Lauer, M.E.; Grassmann, O.; Siam, M.; Tardio, J.; Jacob, L.; Page, S.; Kindt, J.H.; Engel, A.; Alsenz, J. Atomic Force Microscopy-Based Screening of Drug-Excipient Miscibility and Stability of Solid Dispersions. Pharm. Res. 2011, 28, 572–584. [Google Scholar] [CrossRef] [Green Version]
- Li, N.; Taylor, L.S. Nanoscale Infrared, Thermal, and Mechanical Characterization of Telaprevir-Polymer Miscibility in Amorphous Solid Dispersions Prepared by Solvent Evaporation. Mol. Pharm. 2016, 13, 1123–1136. [Google Scholar] [CrossRef] [PubMed]
- Guo, Y.; Shalaev, E.; Smith, S. Physical Stability of Pharmaceutical Formulations: Solid-State Characterization of Amorphous Dispersions. Trac—Trends Anal. Chem. 2013, 49, 137–144. [Google Scholar] [CrossRef]
- Guan, J.; Liu, Q.; Jin, L.; Xu, H.; Wu, H.; Zhang, X.; Mao, S. Synergistic Effect of Soluplus and Hyaluronic Acid on the Supersaturation Maintenance of Lovastatin: The Facilitated in Vitro-in Vivo Performance and Improved Physical Stability. Carbohydr. Polym. 2019, 222, 114978. [Google Scholar] [CrossRef] [PubMed]
- Sarode, A.L.; Sandhu, H.; Shah, N.; Malick, W.; Zia, H. Hot Melt Extrusion for Amorphous Solid Dispersions: Temperature and Moisture Activated Drug-Polymer Interactions for Enhanced Stability. Mol. Pharm. 2013, 10, 3665–3675. [Google Scholar] [CrossRef]
- Lin, X.; Hu, Y.; Liu, L.; Su, L.; Li, N.; Yu, J.; Tang, B.; Yang, Z. Physical Stability of Amorphous Solid Dispersions: A Physicochemical Perspective with Thermodynamic, Kinetic and Environmental Aspects. Pharm. Res. 2018, 35. [Google Scholar] [CrossRef] [PubMed]
- Mehta, M.; Suryanarayanan, R. Accelerated Physical Stability Testing of Amorphous Dispersions. Mol. Pharm. 2016, 13, 2661–2666. [Google Scholar] [CrossRef]
- Li, N.; Gilpin, C.J.J.; Taylor, L.S.S. Understanding the Impact of Water on the Miscibility and Microstructure of Amorphous Solid Dispersions: An AFM-LCR and TEM-EDX Study. Mol. Pharm. 2017, 14, 1691–1705. [Google Scholar] [CrossRef] [PubMed]
- Dohrn, S.; Luebbert, C.; Lehmkemper, K.; Kyeremateng, S.O.; Degenhardt, M.; Sadowski, G. Solvent Influence on the Phase Behavior and Glass Transition of Amorphous Solid Dispersions. Eur. J. Pharm. Biopharm. 2021, 158, 132–142. [Google Scholar] [CrossRef]
- Meere, M.; Pontrelli, G.; McGinty, S. Modelling Phase Separation in Amorphous Solid Dispersions. Acta Biomater. 2019, 94, 410–424. [Google Scholar] [CrossRef] [PubMed] [Green Version]
- Duarte, Í.; Santos, J.L.; Pinto, J.F.; Temtem, M. Screening Methodologies for the Development of Spray-Dried Amorphous Solid Dispersions. Pharm. Res. 2015, 32, 222–237. [Google Scholar] [CrossRef] [PubMed]
- Luebbert, C.; Huxoll, F.; Sadowski, G.; Van Den Mooter, G.; Grohganz, H. Amorphous-Amorphous Phase Separation in API/Polymer Formulations. Molecules 2017, 22, 296. [Google Scholar] [CrossRef] [PubMed]
- Taylor, L.S.; Li, N.; Cape, J.L.; Mankani, B.R.; Zemlyanov, D.Y.; Shepard, K.B.; Morgen, M.M. Water-Induced Phase Separation of Spray-Dried Amorphous Solid Dispersions. Mol. Pharm. 2020, 17, 4004–4017. [Google Scholar] [CrossRef]
- Knopp, M.M.; Wendelboe, J.; Holm, R.; Rades, T. Effect of Amorphous Phase Separation and Crystallization on the in Vitro and in Vivo Performance of an Amorphous Solid Dispersion. Eur. J. Pharm. Biopharm. 2018, 130, 290–295. [Google Scholar] [CrossRef] [Green Version]
- Meng, F.; Ferreira, R.; Zhang, F. Effect of Surfactant Level on Properties of Celecoxib Amorphous Solid Dispersions. J. Drug Deliv. Sci. Technol. 2019, 49, 301–307. [Google Scholar] [CrossRef]
- Ueda, K.; Higashi, K.; Yamamoto, K.; Moribe, K. Inhibitory Effect of Hydroxypropyl Methylcellulose Acetate Succinate on Drug Recrystallization from a Supersaturated Solution Assessed Using Nuclear Magnetic Resonance Measurements. Mol. Pharm. 2013, 10, 3801–3811. [Google Scholar] [CrossRef]
- Haiss, W.; Thanh, N.T.K.; Aveyard, J.; Fernig, D.G. Determination of Size and Concentration of Gold Nanoparticles from UV-Vis Spectra. Anal. Chem. 2007, 79, 4215–4221. [Google Scholar] [CrossRef] [PubMed]
- Purohit, H.S.; Taylor, L.S. Phase Behavior of Ritonavir Amorphous Solid Dispersions during Hydration and Dissolution. Pharm. Res. 2017, 34, 2842–2861. [Google Scholar] [CrossRef]
- Almeida, E.; Sousa, L.; Reutzel-Edens, S.M.; Stephenson, G.A.; Taylor, L.S. Assessment of the Amorphous “Solubility” of a Group of Diverse Drugs Using New Experimental and Theoretical Approaches. Mol. Pharm. 2015, 12, 484–495. [Google Scholar] [CrossRef]
- Ilevbare, G.A.; Liu, H.; Pereira, J.; Edgar, K.J.; Taylor, L.S. Influence of Additives on the Properties of Nanodroplets Formed in Highly Supersaturated Aqueous Solutions of Ritonavir. Mol. Pharm. 2013, 10, 3392–3403. [Google Scholar] [CrossRef]
- Zhao, Z.; Katai, H.; Higashi, K.; Ueda, K.; Kawakami, K.; Moribe, K. Cryo-TEM and AFM Observation of the Time-Dependent Evolution of Amorphous Probucol Nanoparticles Formed by the Aqueous Dispersion of Ternary Solid Dispersions. Mol. Pharm. 2019, 16, 2184–2198. [Google Scholar] [CrossRef]
- Wang, S.; Liu, C.; Chen, Y.; Zhu, A.; Qian, F. Aggregation of Hydroxypropyl Methylcellulose Acetate Succinate under Its Dissolving PH and the Impact on Drug Supersaturation. Mol. Pharm. 2018, 15, 4643–4653. [Google Scholar] [CrossRef] [PubMed]
- Mosquera-Giraldo, L.I.; Taylor, L.S. Glass-Liquid Phase Separation in Highly Supersaturated Aqueous Solutions of Telaprevir. Mol. Pharm. 2015, 12, 496–503. [Google Scholar] [CrossRef] [PubMed]
- Zhu, C.; Liang, S.; Song, E.; Zhou, Y.; Wang, W.; Shan, F.; Shi, Y.; Hao, C.; Yin, K.; Zhang, T.; et al. In-Situ Liquid Cell Transmission Electron Microscopy Investigation on Oriented Attachment of Gold Nanoparticles. Nat. Commun. 2018. [Google Scholar] [CrossRef] [PubMed] [Green Version]
- Weatherall, E.; Willmott, G.R. Applications of Tunable Resistive Pulse Sensing. Analyst 2015, 140, 3318–3334. [Google Scholar] [CrossRef]
- Sivakumaran, M.; Platt, M. Tunable Resistive Pulse Sensing: Potential Applications in Nanomedicine. Nanomedicine 2016, 11, 2197–2214. [Google Scholar] [CrossRef] [Green Version]
- Bootz, A.; Vogel, V.; Schubert, D.; Kreuter, J. Comparison of Scanning Electron Microscopy, Dynamic Light Scattering and Analytical Ultracentrifugation for the Sizing of Poly(Butyl Cyanoacrylate) Nanoparticles. Eur. J. Pharm. Biopharm. 2004. [Google Scholar] [CrossRef]
- Gioria, S.; Caputo, F.; Urbán, P.; Maguire, C.M.; Bremer-Hoffmann, S.; Prina-Mello, A.; Calzolai, L.; Mehn, D. Are Existing Standard Methods Suitable for the Evaluation of Nanomedicines: Some Case Studies. Nanomedicine 2018, 13, 539–554. [Google Scholar] [CrossRef] [PubMed] [Green Version]
- Bonnett, P.E.; Carpenter, K.J.; Dawson, S.; Davey, R.J. Solution Crystallisation via a Submerged Liquid-Liquid Phase Boundary: Oiling Out. Chem. Commun. 2003, 3, 698–699. [Google Scholar] [CrossRef]
- Ricarte, R.G.; Li, Z.; Johnson, L.M.; Ting, J.M.; Reineke, T.M.; Bates, F.S.; Hillmyer, M.A.; Lodge, T.P. Direct Observation of Nanostructures during Aqueous Dissolution of Polymer/Drug Particles. Macromolecules 2017, 50, 3143–3152. [Google Scholar] [CrossRef]
- Egami, K.; Higashi, K.; Yamamoto, K.; Moribe, K. Crystallization of Probucol in Nanoparticles Revealed by AFM Analysis in Aqueous Solution. Mol. Pharm. 2015, 12, 2972–2980. [Google Scholar] [CrossRef] [PubMed]
- Ueda, K.; Higashi, K.; Moribe, K. Direct NMR Monitoring of Phase Separation Behavior of Highly Supersaturated Nifedipine Solution Stabilized with Hypromellose Derivatives. Mol. Pharm. 2017, 14, 2314–2322. [Google Scholar] [CrossRef]
- Ueda, K.; Taylor, L.S. Polymer Type Impacts Amorphous Solubility and Drug-Rich Phase Colloidal Stability: A Mechanistic Study Using Nuclear Magnetic Resonance Spectroscopy. Mol. Pharm. 2020, 17, 1352–1362. [Google Scholar] [CrossRef] [PubMed]
- Jha, P.K.; Larson, R.G. Assessing the Efficiency of Polymeric Excipients by Atomistic Molecular Dynamics Simulations. Mol. Pharm. 2014, 11, 1676–1686. [Google Scholar] [CrossRef]
- Indulkar, A.S.; Lou, X.; Zhang, G.G.Z.; Taylor, L.S. Insights into the Dissolution Mechanism of Ritonavir-Copovidone Amorphous Solid Dispersions: Importance of Congruent Release for Enhanced Performance. Mol. Pharm. 2019, 16, 1327–1339. [Google Scholar] [CrossRef] [PubMed]
- Hate, S.S.; Reutzel-Edens, S.M.; Taylor, L.S. Insight into Amorphous Solid Dispersion Performance by Coupled Dissolution and Membrane Mass Transfer Measurements. Mol. Pharm. 2019, 16, 448–461. [Google Scholar] [CrossRef]
- Jackson, M.J.; Kestur, U.S.; Hussain, M.A.; Taylor, L.S. Dissolution of Danazol Amorphous Solid Dispersions: Supersaturation and Phase Behavior as a Function of Drug Loading and Polymer Type. Mol. Pharm. 2016, 13, 223–231. [Google Scholar] [CrossRef]
- Saboo, S.; Mugheirbi, N.A.; Zemlyanov, D.Y.; Kestur, U.S.; Taylor, L.S. Congruent Release of Drug and Polymer: A “Sweet Spot” in the Dissolution of Amorphous Solid Dispersions. J. Control. Release 2019, 298, 68–82. [Google Scholar] [CrossRef] [PubMed]
- Ueda, K.; Higashi, K.; Moribe, K. Mechanistic Elucidation of Formation of Drug-Rich Amorphous Nanodroplets by Dissolution of the Solid Dispersion Formulation. Int. J. Pharm. 2019, 561, 82–92. [Google Scholar] [CrossRef] [PubMed]
- Stewart, A.M.; Grass, M.E.; Brodeur, T.J.; Goodwin, A.K.; Morgen, M.M.; Friesen, D.T.; Vodak, D.T. Impact of Drug-Rich Colloids of Itraconazole and HPMCAS on Membrane Flux in Vitro and Oral Bioavailability in Rats. Mol. Pharm. 2017, 14, 2437–2449. [Google Scholar] [CrossRef] [Green Version]
- Mosquera-Giraldo, L.I.; Li, N.; Wilson, V.R.; Nichols, B.L.B.; Edgar, K.J.; Taylor, L.S. Influence of Polymer and Drug Loading on the Release Profile and Membrane Transport of Telaprevir. Mol. Pharm. 2018, 15, 1700–1713. [Google Scholar] [CrossRef]
- Li, Z.; Johnson, L.M.; Ricarte, R.G.; Yao, L.J.; Hillmyer, M.A.; Bates, F.S.; Lodge, T.P. Enhanced Performance of Blended Polymer Excipients in Delivering a Hydrophobic Drug through the Synergistic Action of Micelles and HPMCAS. Langmuir 2017, 33, 2837–2848. [Google Scholar] [CrossRef] [PubMed]
- Dalsin, M.C.; Tale, S.; Reineke, T.M. Solution-State Polymer Assemblies Influence BCS Class II Drug Dissolution and Supersaturation Maintenance. Biomacromolecules 2014, 15, 500–511. [Google Scholar] [CrossRef]
- Li, Z.; Lenk, T.I.; Yao, L.J.; Bates, F.S.; Lodge, T.P. Maintaining Hydrophobic Drug Supersaturation in a Micelle Corona Reservoir. Macromolecules 2018, 51, 540–551. [Google Scholar] [CrossRef]
- Li, Z.; Van Zee, N.J.; Bates, F.S.; Lodge, T.P. Polymer Nanogels as Reservoirs to Inhibit Hydrophobic Drug Crystallization. ACS Nano 2019, 13, 1232–1243. [Google Scholar] [CrossRef]
- Indulkar, A.S.; Waters, J.E.; Mo, H.; Gao, Y.; Raina, S.A.; Zhang, G.G.Z.; Taylor, L.S. Origin of Nanodroplet Formation Upon Dissolution of an Amorphous Solid Dispersion: A Mechanistic Isotope Scrambling Study. J. Pharm. Sci. 2017, 106, 1998–2008. [Google Scholar] [CrossRef]
- Harmon, P.; Galipeau, K.; Xu, W.; Brown, C.; Wuelfing, W.P. Mechanism of Dissolution-Induced Nanoparticle Formation from a Copovidone-Based Amorphous Solid Dispersion. Mol. Pharm. 2016, 13, 1467–1481. [Google Scholar] [CrossRef]
- Kesisoglou, F.; Wang, M.; Galipeau, K.; Harmon, P.; Okoh, G.; Xu, W. Effect of Amorphous Nanoparticle Size on Bioavailability of Anacetrapib in Dogs. J. Pharm. Sci. 2019, 108, 2917–2925. [Google Scholar] [CrossRef]
- Miller, J.M.; Beig, A.; Carr, R.A.; Spence, J.K.; Dahan, A. A Win-Win Solution in Oral Delivery of Lipophilic Drugs: Supersaturation via Amorphous Solid Dispersions Increases Apparent Solubility without Sacrifice of Intestinal Membrane Permeability. Mol. Pharm. 2012, 9, 2009–2016. [Google Scholar] [CrossRef] [PubMed]
- Beig, A.; Miller, J.M.; Lindley, D.; Carr, R.A.; Zocharski, P.; Agbaria, R.; Dahan, A. Head-To-Head Comparison of Different Solubility-Enabling Formulations of Etoposide and Their Consequent Solubility-Permeability Interplay. J. Pharm. Sci. 2015, 104, 2941–2947. [Google Scholar] [CrossRef] [Green Version]
- Dahan, A.; Beig, A.; Lindley, D.; Miller, J.M. The Solubility-Permeability Interplay and Oral Drug Formulation Design: Two Heads Are Better than One. Adv. Drug Deliv. Rev. 2016, 101, 99–107. [Google Scholar] [CrossRef]
- Dahan, A.; Beig, A.; Ioffe-Dahan, V.; Agbaria, R.; Miller, J.M. The Twofold Advantage of the Amorphous Form as an Oral Drug Delivery Practice for Lipophilic Compounds: Increased Apparent Solubility and Drug Flux through the Intestinal Membrane. AAPS J. 2013, 15, 347–353. [Google Scholar] [CrossRef] [Green Version]
- Dahan, A.; Miller, J.M. The Solubility-Permeability Interplay and Its Implications in Formulation Design and Development for Poorly Soluble Drugs. AAPS J. 2012, 14, 244–251. [Google Scholar] [CrossRef] [PubMed] [Green Version]
- Miller, J.M.; Beig, A.; Carr, R.A.; Webster, G.K.; Dahan, A. The Solubility-Permeability Interplay When Using Cosolvents for Solubilization: Revising the Way We Use Solubility-Enabling Formulations. Mol. Pharm. 2012, 9, 581–590. [Google Scholar] [CrossRef] [PubMed]
- Beig, A.; Fine-Shamir, N.; Lindley, D.; Miller, J.M.; Dahan, A. Advantageous Solubility-Permeability Interplay When Using Amorphous Solid Dispersion (ASD) Formulation for the BCS Class IV P-Gp Substrate Rifaximin: Simultaneous Increase of Both the Solubility and the Permeability. AAPS J. 2017, 19, 806–813. [Google Scholar] [CrossRef]
- Dahan, A.; Miller, J.M.; Hoffman, A.; Amidon, G.E.; Amidon, G.L. The Solubility-Permeability Interplay in Using Cyclodextrins as Pharmaceutical Solubilizers: Mechanistic Modeling and Application to Progesterone. J. Pharm. Sci. 2010. [Google Scholar] [CrossRef] [Green Version]
- Miller, J.M.; Beig, A.; Krieg, B.J.; Carr, R.A.; Borchardt, T.B.; Amidon, G.E.; Amidon, G.L.; Dahan, A. The Solubility-Permeability Interplay: Mechanistic Modeling and Predictive Application of the Impact of Micellar Solubilization on Intestinal Permeation. Mol. Pharm. 2011, 8, 1848–1856. [Google Scholar] [CrossRef] [PubMed]
- Raina, S.A.; Zhang, G.G.Z.; Alonzo, D.E.; Wu, J.; Zhu, D.; Catron, N.D.; Gao, Y.; Taylor, L.S. Impact of Solubilizing Additives on Supersaturation and Membrane Transport of Drugs. Pharm. Res. 2015, 32, 3350–3364. [Google Scholar] [CrossRef]
- Loftsson, T.; Brewster, M.E. Cyclodextrins as Functional Excipients: Methods to Enhance Complexation Efficienc. J. Pharm. Sci. 2012, 101, 3019–3032. [Google Scholar] [CrossRef]
- Kesisoglou, F.; Wu, Y. Understanding the Effect of API Properties on Bioavailability through Absorption Modeling. AAPS J. 2008, 10, 516–525. [Google Scholar] [CrossRef]
- Wu, Y.; Loper, A.; Landis, E.; Hettrick, L.; Novak, L.; Lynn, K.; Chen, C.; Thompson, K.; Higgins, R.; Batra, U.; et al. The Role of Biopharmaceutics in the Development of a Clinical Nanoparticle Formulation of MK-0869: A Beagle Dog Model Predicts Improved Bioavailability and Diminished Food Effect on Absorption in Human. Int. J. Pharm. 2004, 285, 135–146. [Google Scholar] [CrossRef] [PubMed]
- Wilson, F.A.; Dietschy, J.M. Characterization of Bile Acid Absorption across the Unstirred Water Layer and Brush Border of the Rat Jejunum. J. Clin. Investig. 1972, 51, 3015–3025. [Google Scholar] [CrossRef]
- Loftsson, T. Drug Permeation through Biomembranes: Cyclodextrins and the Unstirred Water Layer. Pharmazie 2012, 67, 363–370. [Google Scholar] [CrossRef]
- Stewart, A.M.; Grass, M.E. Practical Approach to Modeling the Impact of Amorphous Drug Nanoparticles on the Oral Absorption of Poorly Soluble Drugs. Mol. Pharm. 2020, 17, 180–189. [Google Scholar] [CrossRef] [PubMed] [Green Version]
- Arce, F.A.; Setiawan, N.; Campbell, H.R.; Lu, X.; Nethercott, M.J.; Bummer, P.; Su, Y.; Marsac, P.J. Toward Developing Discriminating Dissolution Methods for Formulations Containing Nanoparticulates in Solution: The Impact of Particle Drift and Drug Activity in Solution. Mol. Pharm. 2020, 17, 4125–4140. [Google Scholar] [CrossRef] [PubMed]
- Fine-Shamir, N.; Dahan, A. Methacrylate-Copolymer Eudragit EPO as a Solubility-Enabling Excipient for Anionic Drugs: Investigation of Drug Solubility, Intestinal Permeability, and Their Interplay. Mol. Pharm. 2019, 16, 2884–2891. [Google Scholar] [CrossRef]
- Saal, W.; Ross, A.; Wyttenbach, N.; Alsenz, J.; Kuentz, M. A Systematic Study of Molecular Interactions of Anionic Drugs with a Dimethylaminoethyl Methacrylate Copolymer Regarding Solubility Enhancement. Mol. Pharm. 2017, 14, 1243–1250. [Google Scholar] [CrossRef]
- Higashi, K.; Yamamoto, K.K.K.; Pandey, M.K.K.; Mroue, K.H.H.; Moribe, K.; Yamamoto, K.K.K.; Ramamoorthy, A. Insights into Atomic-Level Interaction between Mefenamic Acid and Eudragit EPO in a Supersaturated Solution by High-Resolution Magic-Angle Spinning NMR Spectroscopy. Mol. Pharm. 2014, 11, 351–357. [Google Scholar] [CrossRef]
- Raghavan, S.L.; Kiepfer, B.; Davis, A.F.; Kazarian, S.G.; Hadgraft, J. Membrane Transport of Hydrocortisone Acetate from Supersaturated Solutions; the Role of Polymers. Int. J. Pharm. 2001, 221, 95–105. [Google Scholar] [CrossRef]
- Otsuka, N.; Ueda, K.; Ohyagi, N.; Shimizu, K.; Katakawa, K.; Kumamoto, T.; Higashi, K.; Yamamoto, K.; Moribe, K. An Insight into Different Stabilization Mechanisms of Phenytoin Derivatives Supersaturation by HPMC and PVP. J. Pharm. Sci. 2015, 104, 2574–2582. [Google Scholar] [CrossRef]
- Yu, M.; Wu, J.; Shi, J.; Farokhzad, O.C. Nanotechnology for Protein Delivery: Overview and Perspectives. J. Control. Release 2016, 240, 24–37. [Google Scholar] [CrossRef] [PubMed] [Green Version]
- Engin, A.B.; Nikitovic, D.; Neagu, M.; Henrich-Noack, P.; Docea, A.O.; Shtilman, M.I.; Golokhvast, K.; Tsatsakis, A.M. Mechanistic Understanding of Nanoparticles’ Interactions with Extracellular Matrix: The Cell and Immune System. Part. Fibre Toxicol. 2017, 14, 1–16. [Google Scholar] [CrossRef]
- Crater, J.S.; Carrier, R.L. Barrier Properties of Gastrointestinal Mucus to Nanoparticle Transport. Macromol. Biosci. 2010. [Google Scholar] [CrossRef]
- Maisel, K.; Ensign, L.; Reddy, M.; Cone, R.; Hanes, J. Effect of Surface Chemistry on Nanoparticle Interaction with Gastrointestinal Mucus and Distribution in the Gastrointestinal Tract Following Oral and Rectal Administration in the Mouse. J. Control. Release 2015, 197, 48–57. [Google Scholar] [CrossRef] [PubMed] [Green Version]
- Sahatsapan, N.; Rojanarata, T.; Ngawhirunpat, T.; Opanasopit, P. 6-Maleimidohexanoic Acid-Grafted Chitosan: A New Generation Mucoadhesive Polymer. Carbohydr. Polym. 2018, 202, 258–264. [Google Scholar] [CrossRef] [PubMed]
- Lai, S.K.; Wang, Y.Y.; Hanes, J. Mucus-Penetrating Nanoparticles for Drug and Gene Delivery to Mucosal Tissues. Adv. Drug Deliv. Rev. 2009, 61, 158–171. [Google Scholar] [CrossRef] [PubMed] [Green Version]
- Yu, M.; Xu, L.; Tian, F.; Su, Q.; Zheng, N.; Yang, Y.; Wang, J.; Wang, A.; Zhu, C.; Guo, S.; et al. Rapid Transport of Deformation-Tuned Nanoparticles across Biological Hydrogels and Cellular Barriers. Nat. Commun. 2018, 9, 1–11. [Google Scholar] [CrossRef] [Green Version]
- Abe, O.; Abe, R.; Enomoto, K.; Kikuchi, K.; Koyama, H.; Masuda, H.; Nomura, Y.; Sakai, K.; Sugimachi, K.; Tominaga, T.; et al. A Comparison of Spray Drying and Milling in the Production of Amorphous Dispersions of Sulfathiazole/Polyvinylpyrrolidone and Sulfadimidine/Polyvinylpyrrolidone. J. Pharm. Sci. 2011, 8, 1131–1138. [Google Scholar] [CrossRef]
- Taipaleenmäki, E.; Städler, B. Recent Advancements in Using Polymers for Intestinal Mucoadhesion and Mucopenetration. Macromol. Biosci. 2020, 20, 1–9. [Google Scholar] [CrossRef] [PubMed]
- Ways, T.M.M.; Lau, W.M.; Khutoryanskiy, V.V. Chitosan and Its Derivatives for Application in Mucoadhesive Drug Delivery Systems. Polymers 2018, 10, 267. [Google Scholar] [CrossRef] [PubMed] [Green Version]
- Fan, B.; Xing, Y.; Zheng, Y.; Sun, C.; Liang, G. PH-Responsive Thiolated Chitosan Nanoparticles for Oral Low-Molecular Weight Heparin Delivery: In Vitro and in Vivo Evaluation. Drug Deliv. 2016, 23, 238–247. [Google Scholar] [CrossRef]
- Sreeharsha, N.; Ramnarayanan, C.; Al-Dhubiab, B.E.; Nair, A.B.; Hiremath, J.G.; Venugopala, K.N.; Satish, R.T.; Attimarad, M.; Shariff, A. Mucoadhesive Particles: A Novel, Prolonged-Release Nanocarrier of Sitagliptin for the Treatment of Diabetics. BioMed Res. Int. 2019, 2019, 3950942. [Google Scholar] [CrossRef] [Green Version]
- Ha, E.S.; Choo, G.H.; Baek, I.H.; Kim, M.S. Formulation, Characterization, and in Vivo Evaluation of Celecoxib-PVP Solid Dispersion Nanoparticles Using Supercritical Antisolvent Process. Molecules 2014, 19, 20325–20339. [Google Scholar] [CrossRef] [Green Version]
- Liu, Y.; Sun, C.; Hao, Y.; Jiang, T.; Zheng, L.; Wang, S. Mechanism of Dissolution Enhancement and Bioavailability of Poorly Water Soluble Celecoxib by Preparing Stable Amorphous Nanoparticles. J. Pharm. Pharm. Sci. 2010, 13, 589–606. [Google Scholar] [CrossRef]
- Wu, W.; Zu, Y.; Wang, L.; Wang, L.; Li, Y.; Liu, Y.; Wu, M.; Zhao, X.; Zhang, X. Preparation, Characterization and Antitumor Activity Evaluation of Silibinin Nanoparticles for Oral Delivery through Liquid Antisolvent Precipitation. RSC Adv. 2017, 7, 54379–54390. [Google Scholar] [CrossRef] [Green Version]
- Sun, R.; Shen, C.; Shafique, S.; Mustapha, O.; Hussain, T.; Khan, I.U.; Mehmood, Y.; Anwer, K.; Shahzad, Y.; Yousaf, A.M. Electrosprayed Polymeric Nanospheres for Enhanced Solubility, Dissolution Rate, Oral Bioavailability and Antihyperlipidemic Activity of Bezafibrate. Int. J. Nanomed. 2020, 15, 705–715. [Google Scholar] [CrossRef] [Green Version]
- Kim, M.S.; Baek, I.H. Fabrication and Evaluation of Valsartan-Polymer- Surfactant Composite Nanoparticles by Using the Supercritical Antisolvent Process. Int. J. Nanomed. 2014. [Google Scholar] [CrossRef] [PubMed] [Green Version]
- Wang, X.Q.; Dai, J.D.; Chen, Z.; Zhang, T.; Xia, G.M.; Nagai, T.; Zhang, Q. Bioavailability and Pharmacokinetics of Cyclosporine A-Loaded PH-Sensitive Nanoparticles for Oral Administration. J. Control. Release 2004, 97, 421–429. [Google Scholar] [CrossRef]
- Tran, T.H.; Poudel, B.K.; Marasini, N.; Chi, S.C.; Choi, H.G.; Yong, C.S.; Kim, J.O. Preparation and Evaluation of Raloxifene-Loaded Solid Dispersion Nanoparticle by Spray-Drying Technique without an Organic Solvent. Int. J. Pharm. 2013, 443, 50–57. [Google Scholar] [CrossRef]
- Sun, X.; Zhu, D.; Cai, Y.; Shi, G.; Gao, M.; Zheng, M. One-Step Mechanochemical Preparation and Prominent Antitumor Activity of SN-38 Self-Micelle Solid Dispersion. Int. J. Nanomed. 2019, 14, 2115–2126. [Google Scholar] [CrossRef] [PubMed] [Green Version]
- Rao, Q.; Qiu, Z.; Huang, D.; Lu, T.; Zhang, Z.J.; Luo, D.; Pan, P.; Zhang, L.; Liu, Y.; Guan, S.; et al. Enhancement of the Apparent Solubility and Bioavailability of Tadalafil Nanoparticles via Antisolvent Precipitation. Eur. J. Pharm. Sci. 2019, 128, 222–231. [Google Scholar] [CrossRef] [PubMed]
- Ha, E.S.; Kim, J.S.; Baek, I.H.; Yoo, J.W.; Jung, Y.; Moon, H.R.; Kim, M.S. Development of Megestrol Acetate Solid Dispersion Nanoparticles for Enhanced Oral Delivery by Using a Supercritical Antisolvent Process. Drug Des. Dev. Ther. 2015, 9, 4269–4277. [Google Scholar] [CrossRef] [Green Version]
- Kim, M.S.; Kim, J.S.; Park, H.J.; Cho, W.K.; Cha, K.H.; Hwang, S.J. Enhanced Bioavailability of Sirolimus via Preparation of Solid Dispersion Nanoparticles Using a Supercritical Antisolvent Process. Int. J. Nanomed. 2011, 6, 2997–3009. [Google Scholar] [CrossRef] [Green Version]


| Brand Name | Generic Name | Company | Manufacture Technique | FDA Approval | Dosage Form |
|---|---|---|---|---|---|
| Kalydeco® | ivacaftor | Vertex | SD | 2015 | granule |
| Orkambi® | lumacaftor; ivacaftor | Vertex | SD | 2015 | tablet |
| Epclusa® | sofosbuvir; velpatasvir | Gilead Sciences | SD | 2016 | tablet |
| Venclexta® | venetoclax | AbbVie | HME | 2016 | tablet |
| Viekira XR™ | dasabuvir sodium; ombitasvir; paritaprevir; ritonavir | AbbVie | HME | 2016 | tablet |
| Zepatier® | elbasvir; grazoprevir | Merck | SD | 2016 | tablet |
| Lynparza® | olaparib | Astrazeneza | HME | 2017 | tablet |
| Norvir® | ritonavir | AbbVie | HME | 2017 | powder |
| Mavyret™ | glecaprevir; pibrentasvir | AbbVie | HME | 2017 | tablet |
| Prograf® | tacrolimus | AbbVie | SD | 2018 | granule; capsule |
| Tibsovo® | ivosedinib | AbbVie | / | 2018 | tablet |
| symdeko® | tezacaftor; ivacaftor | Vertex | / | 2018 | tablet |
| Trikafta® | elexacaftor; tezacaftor; ivacaftor | Vertex | / | 2019 | tablet |
| Harvoni® | ledipasvir; sofosbuvir | Gilead Sciences | SD | 2019 | pellet |
| Drugs | Excipients | Particle Size | Comments | References |
|---|---|---|---|---|
| heparin | thiolated chitosan; HPMCP | 200–500nm (1360 nm for the special drug-excipient ratio) | A significant improvement of mucoadhesion was observed in rats; a 1.86-fold improvement of permeation-enhancing effect was observed in freshly excised carp intestine. | [156] |
| celecoxib | PVP K30; TPGS | less than 300 nm | The amorphous nanoparticles showed 4.6- and 5.7-times greater AUC 0–24 h and Cmax in plasma, respectively, compared with the unprocessed form. | [158] |
| celecoxib | HPMC E5 and SDS (2:1, w/w) | mean 159 nm | The maximum drug concentration and AUC0–24h of amorphous celecoxib nanoparticles were observed to be 3-fold and 2-fold greater than those of the celecoxib capsules. | [159] |
| silibinin | HPMC | 132.3 nm | The dissolution rate of silibinin nanoparticles was 48.2 times and 153.8 times higher than that of free silibinin in gastric juice and intestinal juice, respectively. The C max and AUC values for silibinin nanoparticles were 15.3 times and 6.48 times greater than those in the free drug. | [160] |
| bezafibrate | PVP K30; cremophor ELP | less than 500 nm | Smooth-surfaced amorphous particles exhibited a 5.5-fold higher oral bioavailability compared with the plain bezafibrate powder. | [161] |
| valsartan | HPMC; poloxamer 407 | less than 400 nm | Valsartan-HPMC-surfactant nanoparticles increased the drug release speed (up to 90% within 10 min), exhibited 7.2-fold greater maximum plasma concentration, and 4.6-fold higher AUC0–24h. | [162] |
| cyclosporine A | HPMCP; including HP50 and HP55 | 50–60 nm | Significant sustain drug release; the bioavailability of pH-sensitive drug nanoparticles calculated by the AUC0–72h was 119.6% for HPMC HP55. | [163] |
| raloxifene | PVP | 180 nm | The raloxifene loaded suspension nanoparticles were found to be 3.3-fold and 2.3-fold higher, in terms of AUC and Cmax increment, respectively, in plasma than those of the drug powder. | [164] |
| anacetrapib | copovidone; vitamin E TPGS | / | Particles with sizes of less than 100 nm were observed to have approximately 2-fold higher average exposure in dogs compared with larger particles. | [123] |
| 7-ethyl10-hydroxycamptothecin (SN-38) | disodium glycyrrhizin | 69.41 nm | The amorphous formulation increased the drug solubility of the crystal drug 189-fold. The nanoparticles exhibited 4-fold greater bioavailability than that of drug suspension. | [165] |
| tadalafil | HPMC, VA64, and PVP K30 | 200 nm | The amorphous particles exhibit 8.5 times faster dissolution rates in the first minute of dissolution, 22-fold greater apparent solubility at 10 min, 3.67-fold greater in oral bioavailability than unprocessed tadalafil. | [166] |
| megestrol acetate | HPMC; PVPK30; Ryoto sugar ester L1695 | less than 500 nm | The solid dispersion nanoparticles showed 4-fold and 5.5-fold higher AUC0–24h and Cmax than those of raw drug powder. | [167] |
| sitagliptin | chitosan | 210–618 nm | The chitosan-loaded amorphous nanoparticles showed a sustained release and mucoadhesive properties. | [157] |
| itraconazole | HPMCAS 716HP; HPMCAS 126HP | 140–210 nm | The drug-rich nanoparticles have been demonstrated contribution to the ABL diffusion in proportion to their diffusion coefficients and drug loadings. | [115] |
| sirolimus | PVP K30; surfactants | mean 250 nm | The peak concentration and AUC0-12h of sirolimus were increased 18.3-fold and 15.2-fold, respectively. | [168] |
| enzalutamide | HPMCAS; PVPVA | 42–43 nm | ASDs that formed drug nanoparticles during dissolution showed higher drug concentration for rat plasma exposure than samples that only yielded supersaturated solutions. | [53] |
Publisher’s Note: MDPI stays neutral with regard to jurisdictional claims in published maps and institutional affiliations. |
© 2021 by the authors. Licensee MDPI, Basel, Switzerland. This article is an open access article distributed under the terms and conditions of the Creative Commons Attribution (CC BY) license (https://creativecommons.org/licenses/by/4.0/).
Share and Cite
Qian, K.; Stella, L.; Jones, D.S.; Andrews, G.P.; Du, H.; Tian, Y. Drug-Rich Phases Induced by Amorphous Solid Dispersion: Arbitrary or Intentional Goal in Oral Drug Delivery? Pharmaceutics 2021, 13, 889. https://doi.org/10.3390/pharmaceutics13060889
Qian K, Stella L, Jones DS, Andrews GP, Du H, Tian Y. Drug-Rich Phases Induced by Amorphous Solid Dispersion: Arbitrary or Intentional Goal in Oral Drug Delivery? Pharmaceutics. 2021; 13(6):889. https://doi.org/10.3390/pharmaceutics13060889
Chicago/Turabian StyleQian, Kaijie, Lorenzo Stella, David S. Jones, Gavin P. Andrews, Huachuan Du, and Yiwei Tian. 2021. "Drug-Rich Phases Induced by Amorphous Solid Dispersion: Arbitrary or Intentional Goal in Oral Drug Delivery?" Pharmaceutics 13, no. 6: 889. https://doi.org/10.3390/pharmaceutics13060889