
Exploring the Role of Surfactants in Enhancing Drug Release from Amorphous Solid Dispersions at Higher Drug Loadings

 , ,
, ,
Abstract
:
1. Introduction
2. Materials and Methods
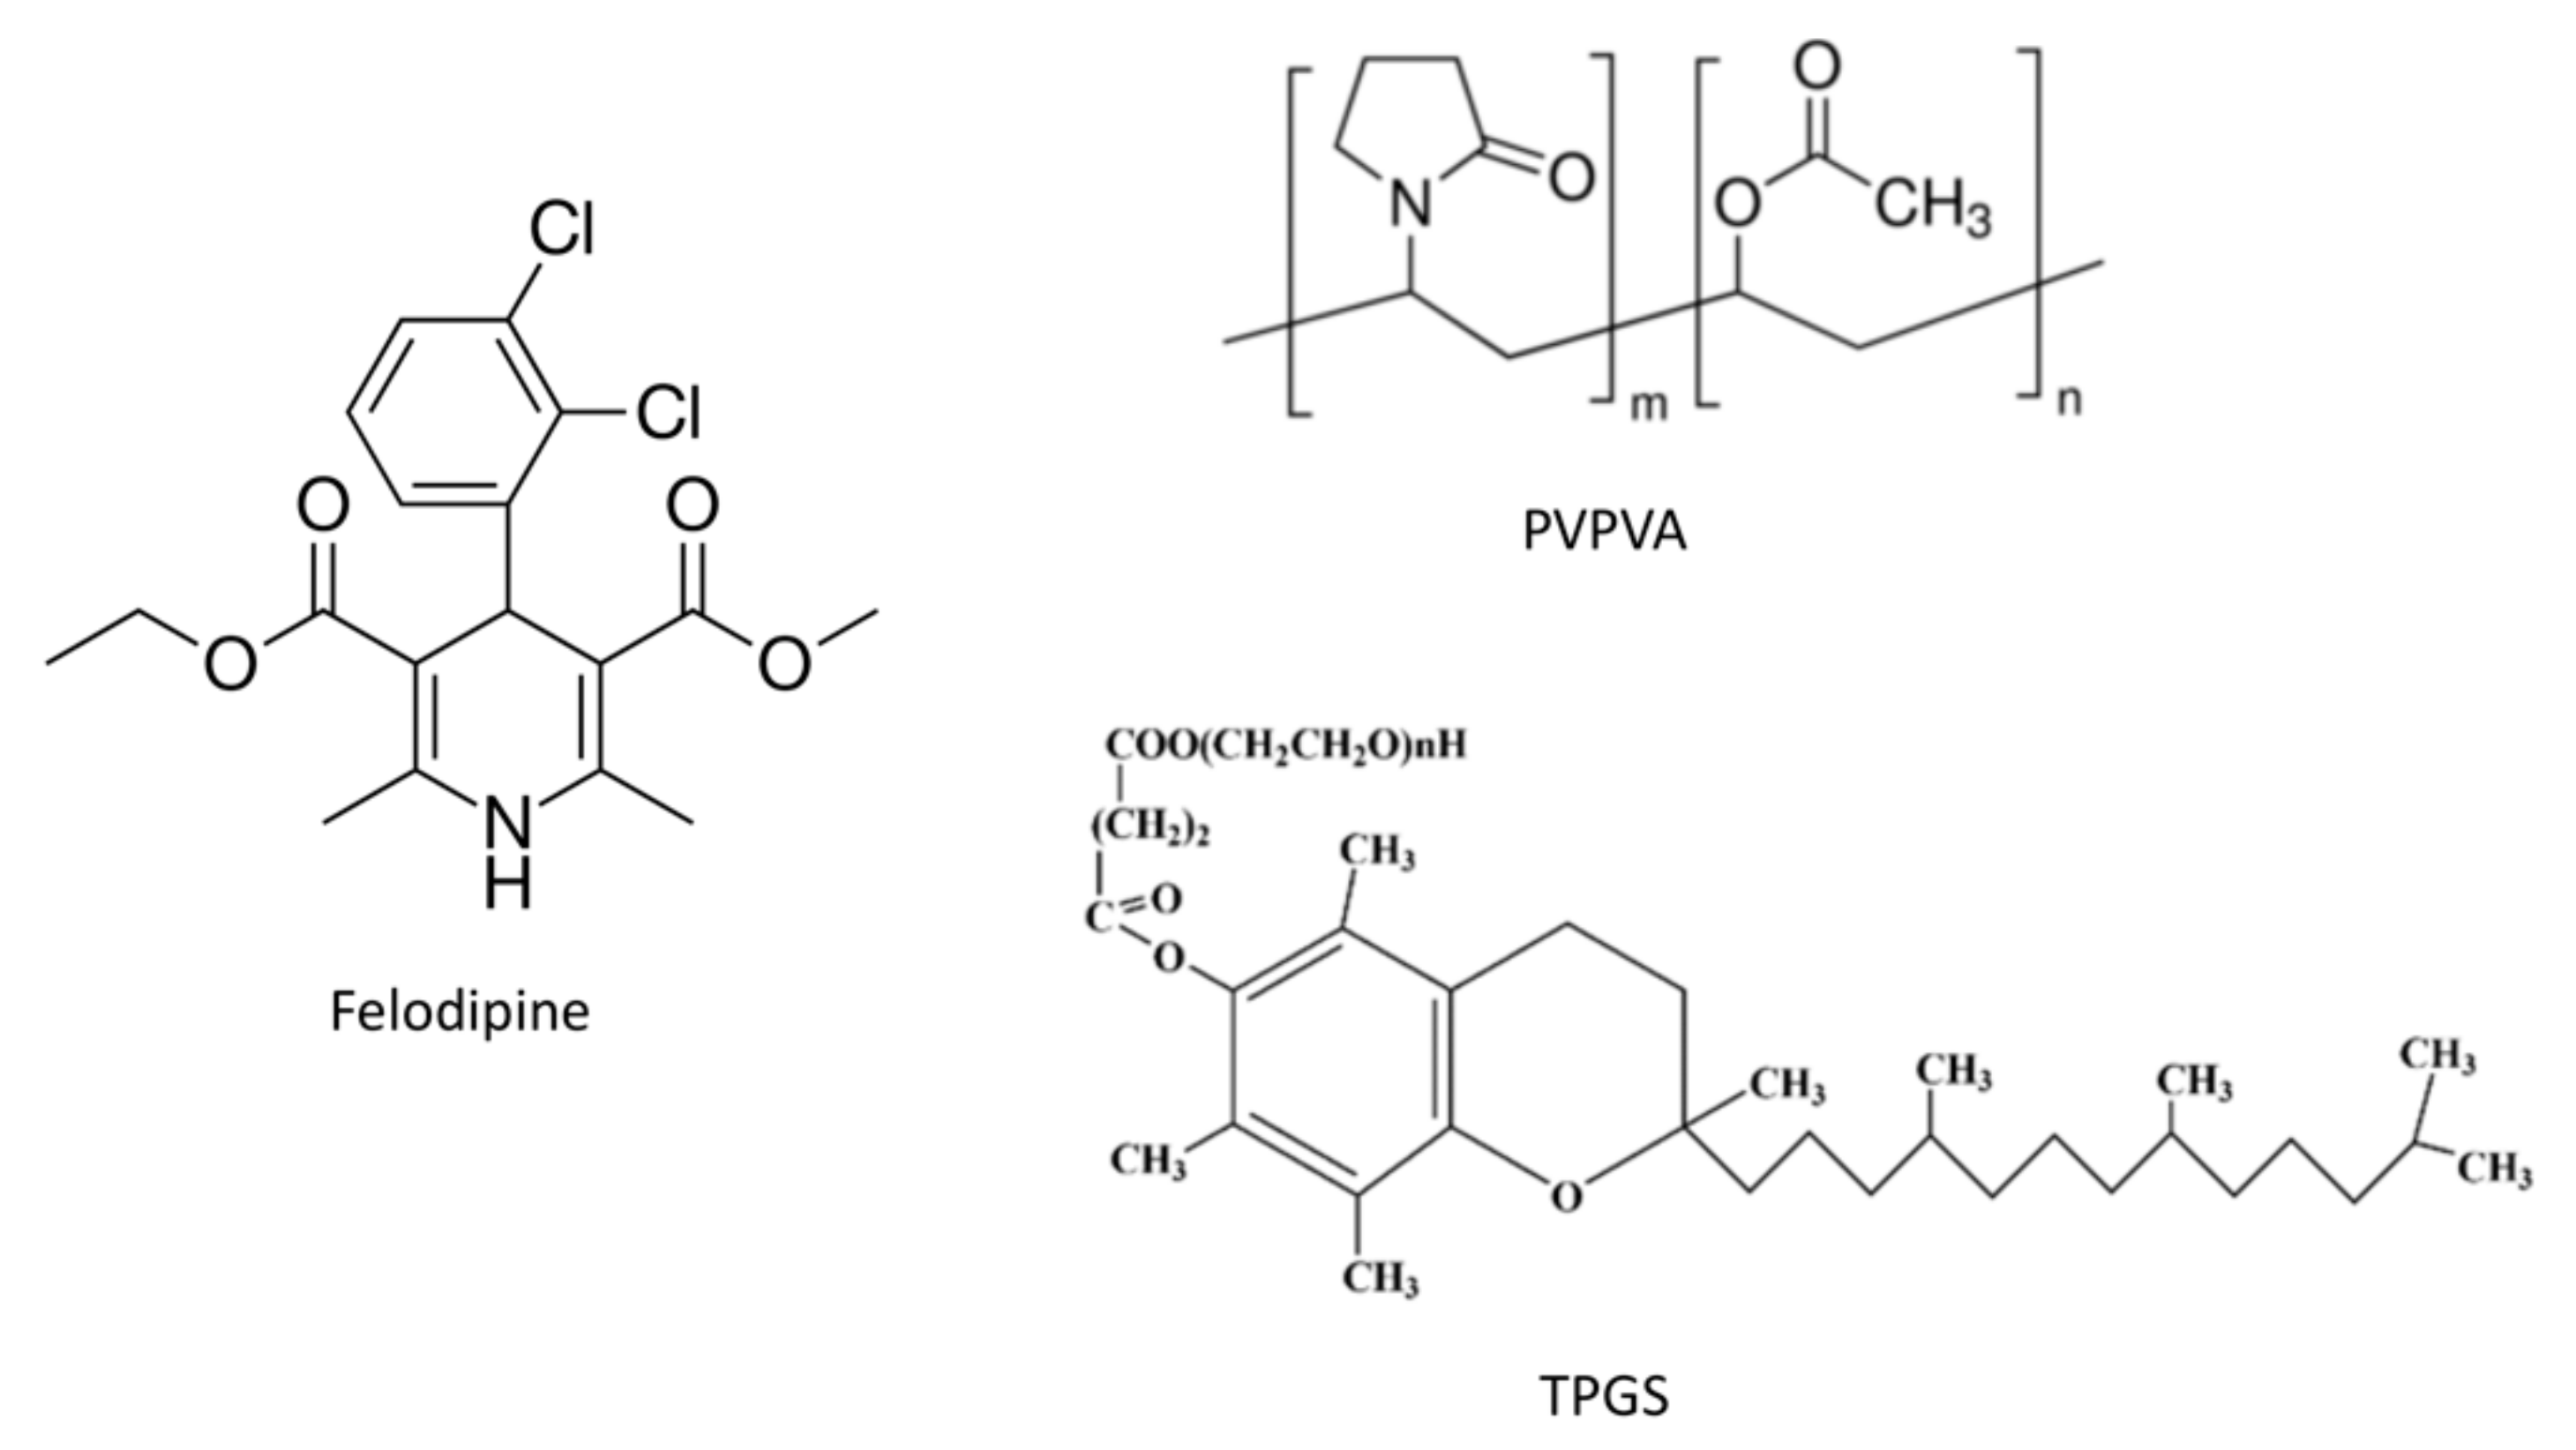
2.1. Materials
2.2. Methods
2.2.1. Critical Micelle Concentration Measurement
2.2.2. Amorphous Solubility Measurement
2.2.3. Preparation of Ternary Amorphous Solid Dispersions (ASDs)
2.2.4. Measurement of Glass Transition Temperature by Differential Scanning Calorimetry (DSC)
2.2.5. Surface Normalized Dissolution Rate Experiments
2.2.6. Nanoparticle Tracking Analysis (NTA)
2.2.7. Particle Size Distribution Using Dynamic Light Scattering (DLS)
2.2.8. X-ray Microcomputed Tomography (micro-CT) Images
2.2.9. ASD Film Exposure Studies under a High RH Environment
3. Results
3.1. Measurement of TPGS CMC
3.2. Amorphous Solubility
3.3. Glass Transition Temperature (Tg)
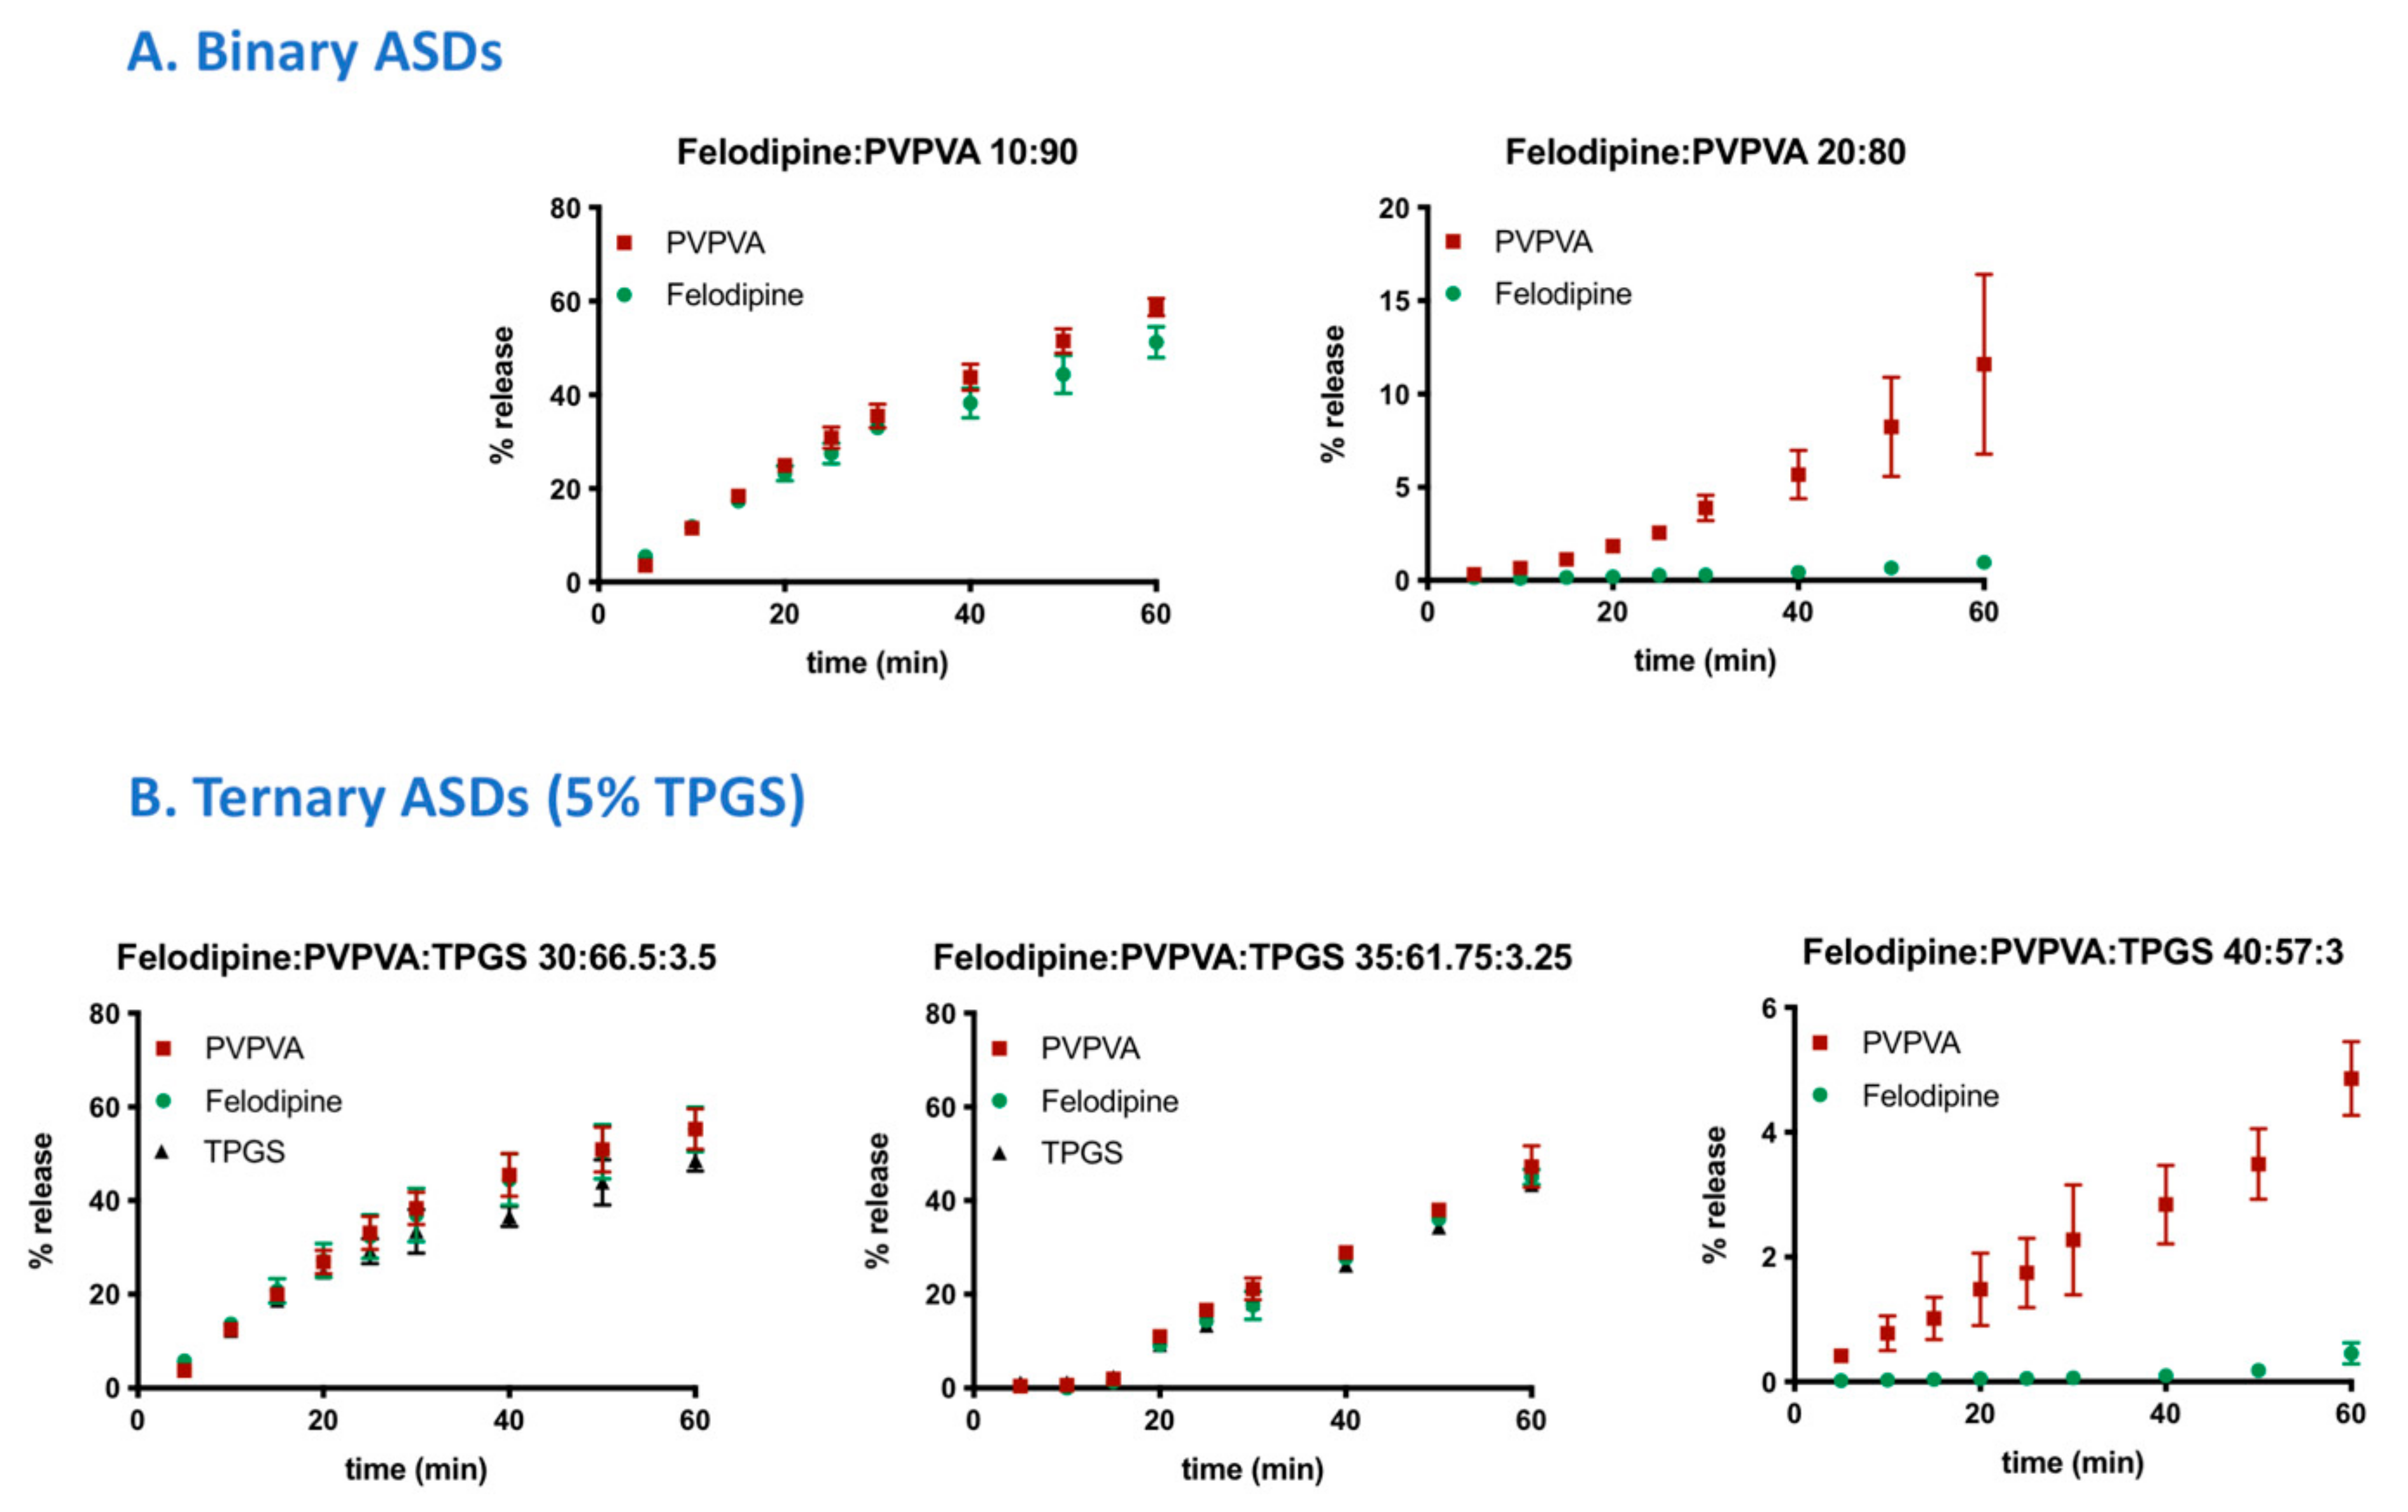
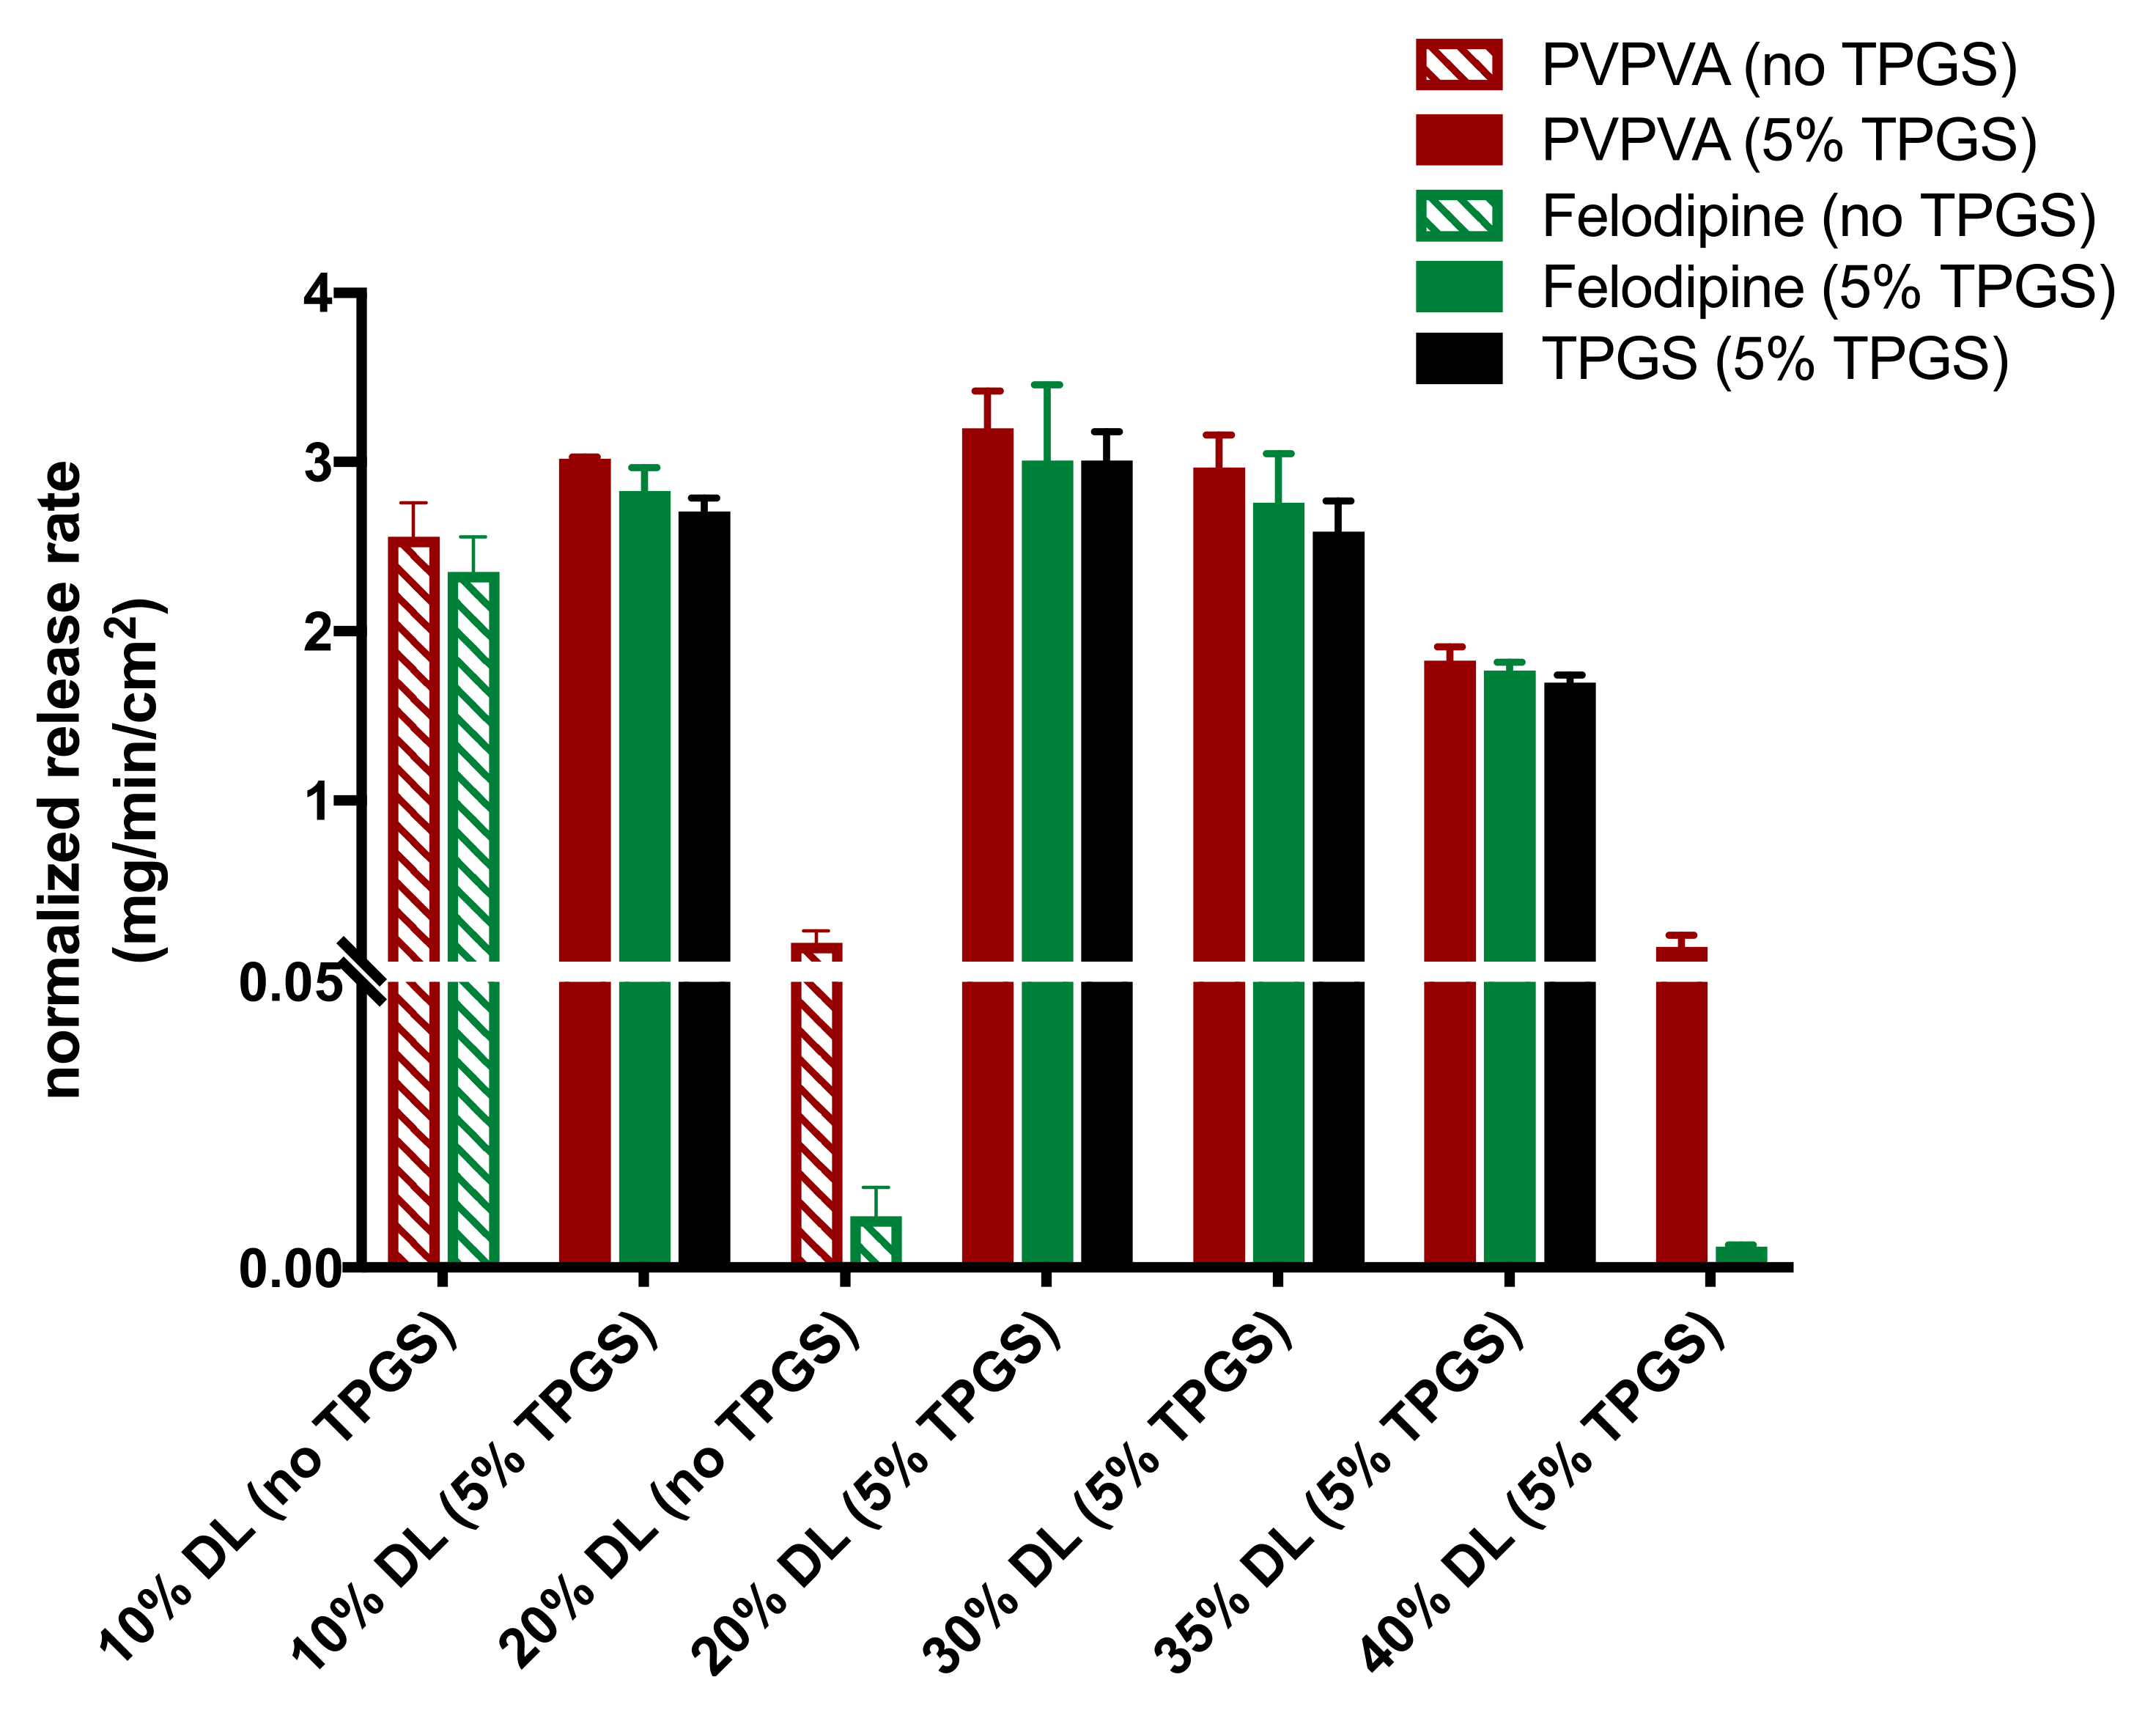
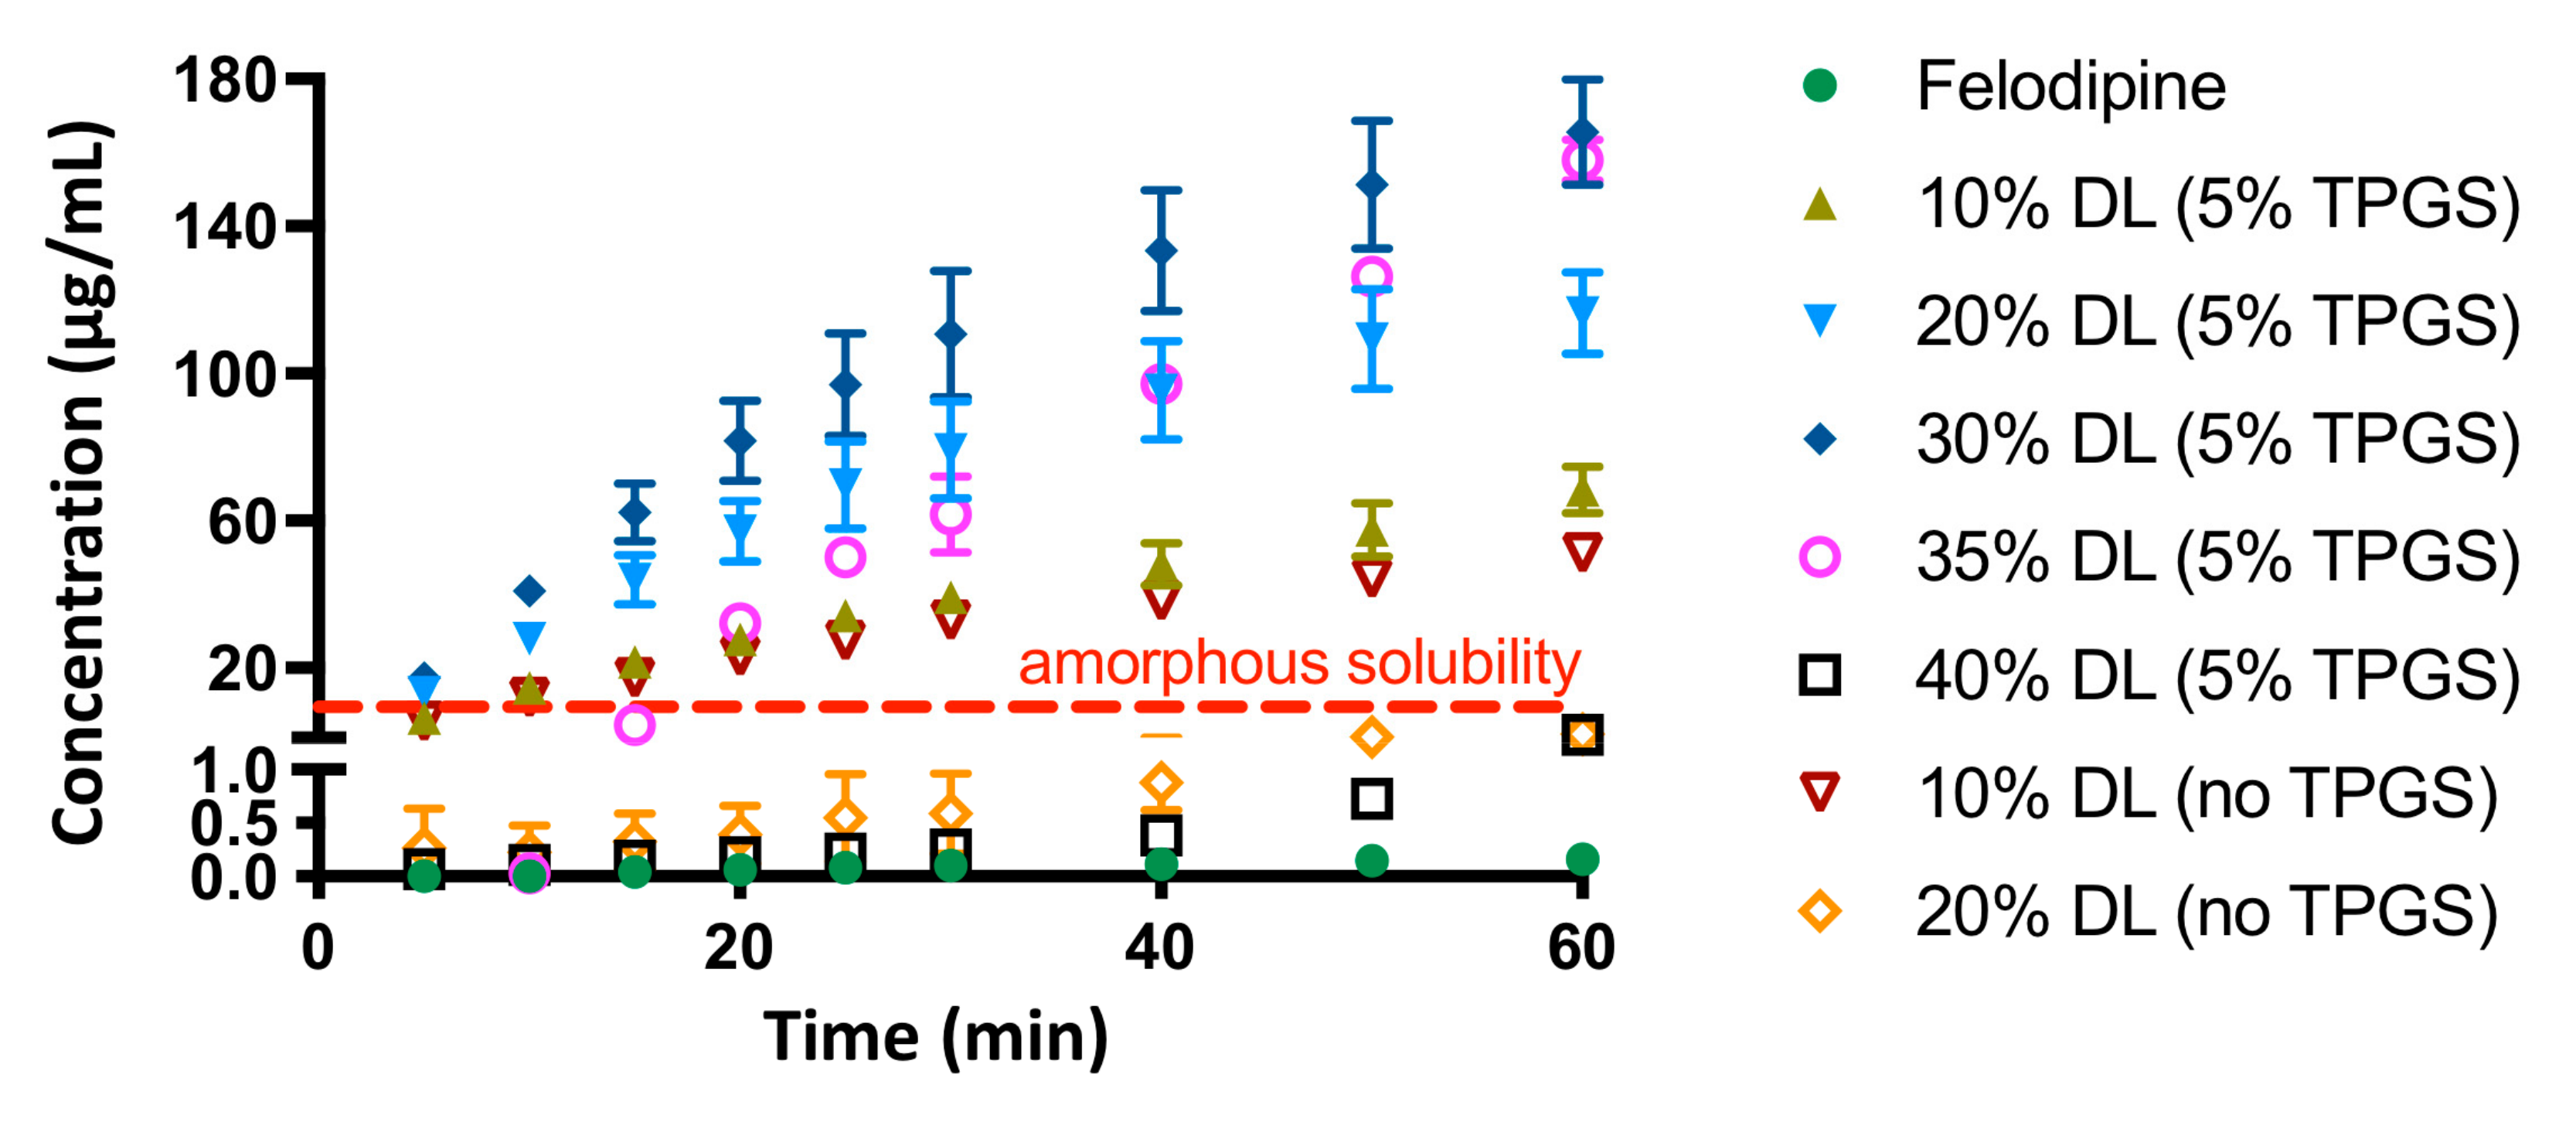
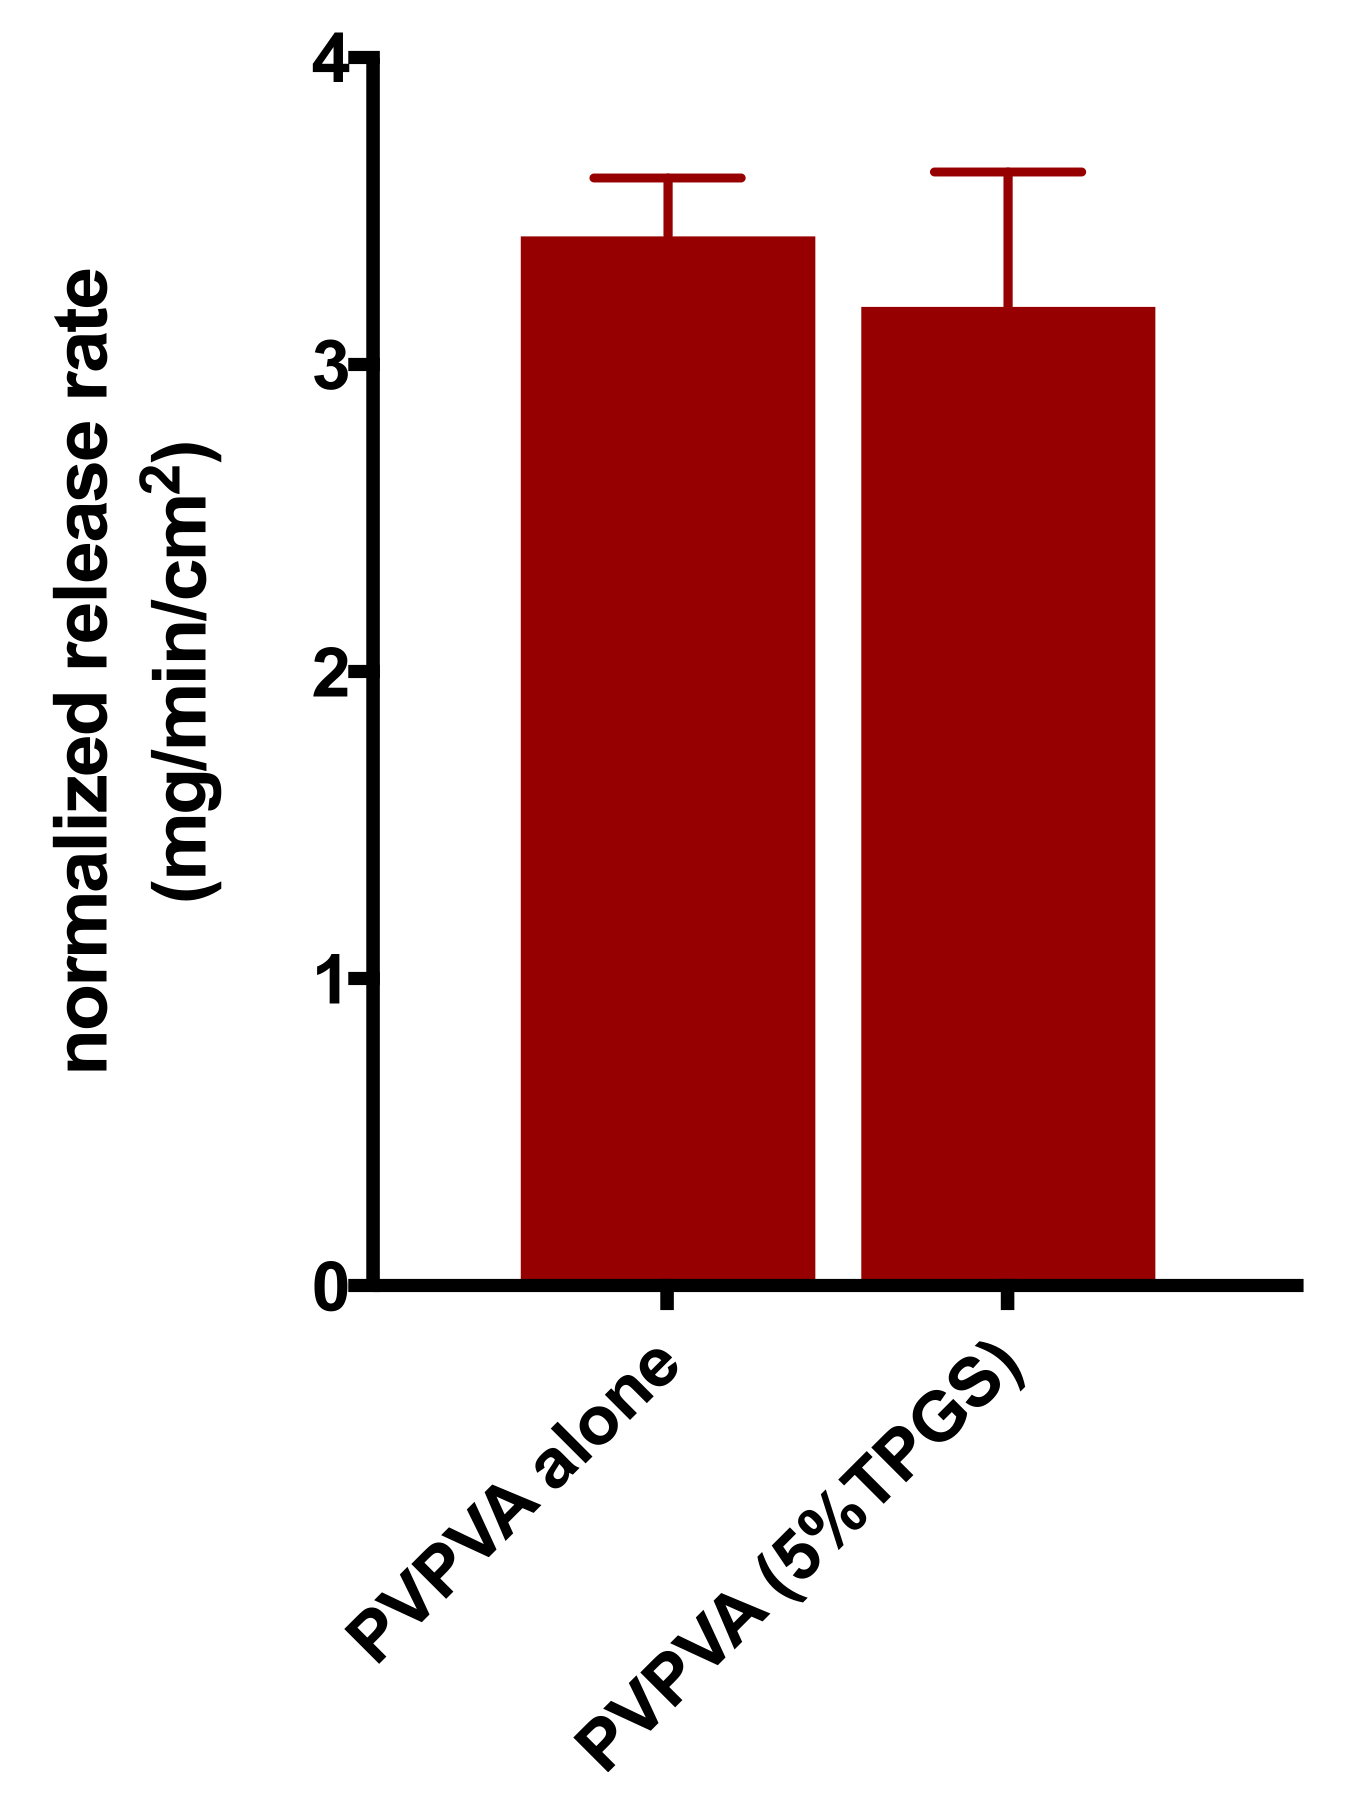
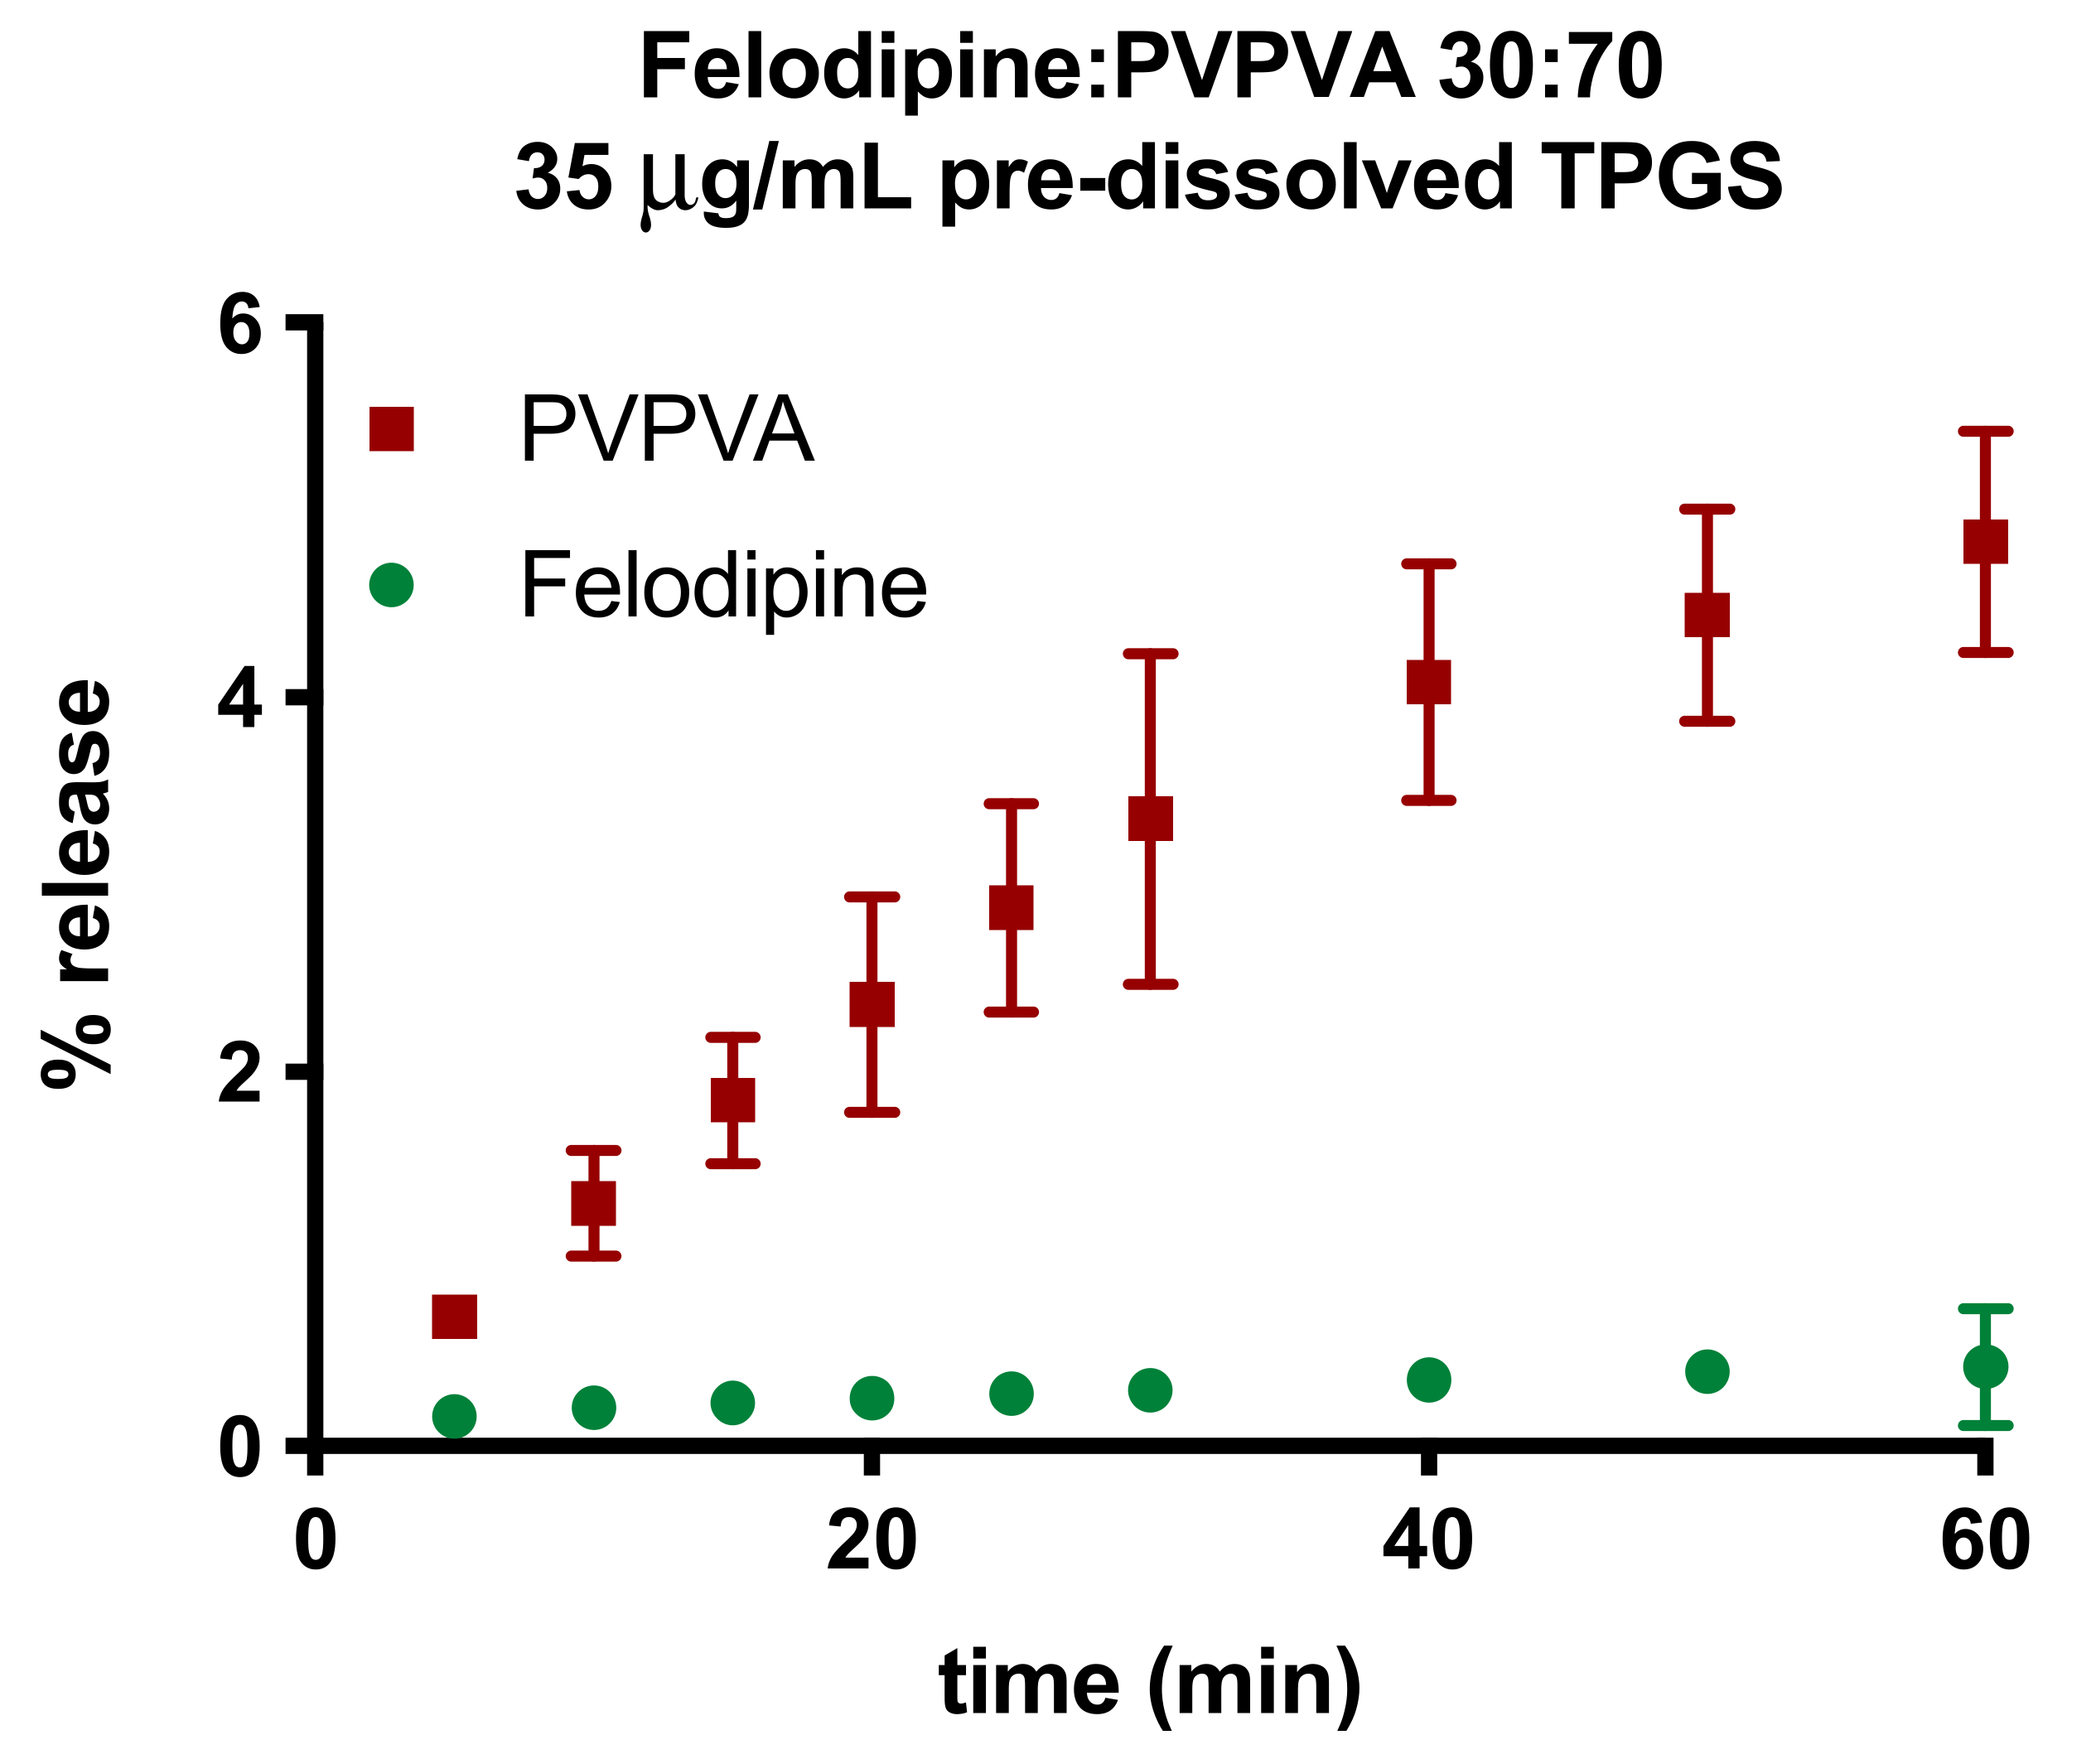
3.4. Surface-Normalized Release Profiles of Drug, Polymer, and Surfactant from Ternary ASDs
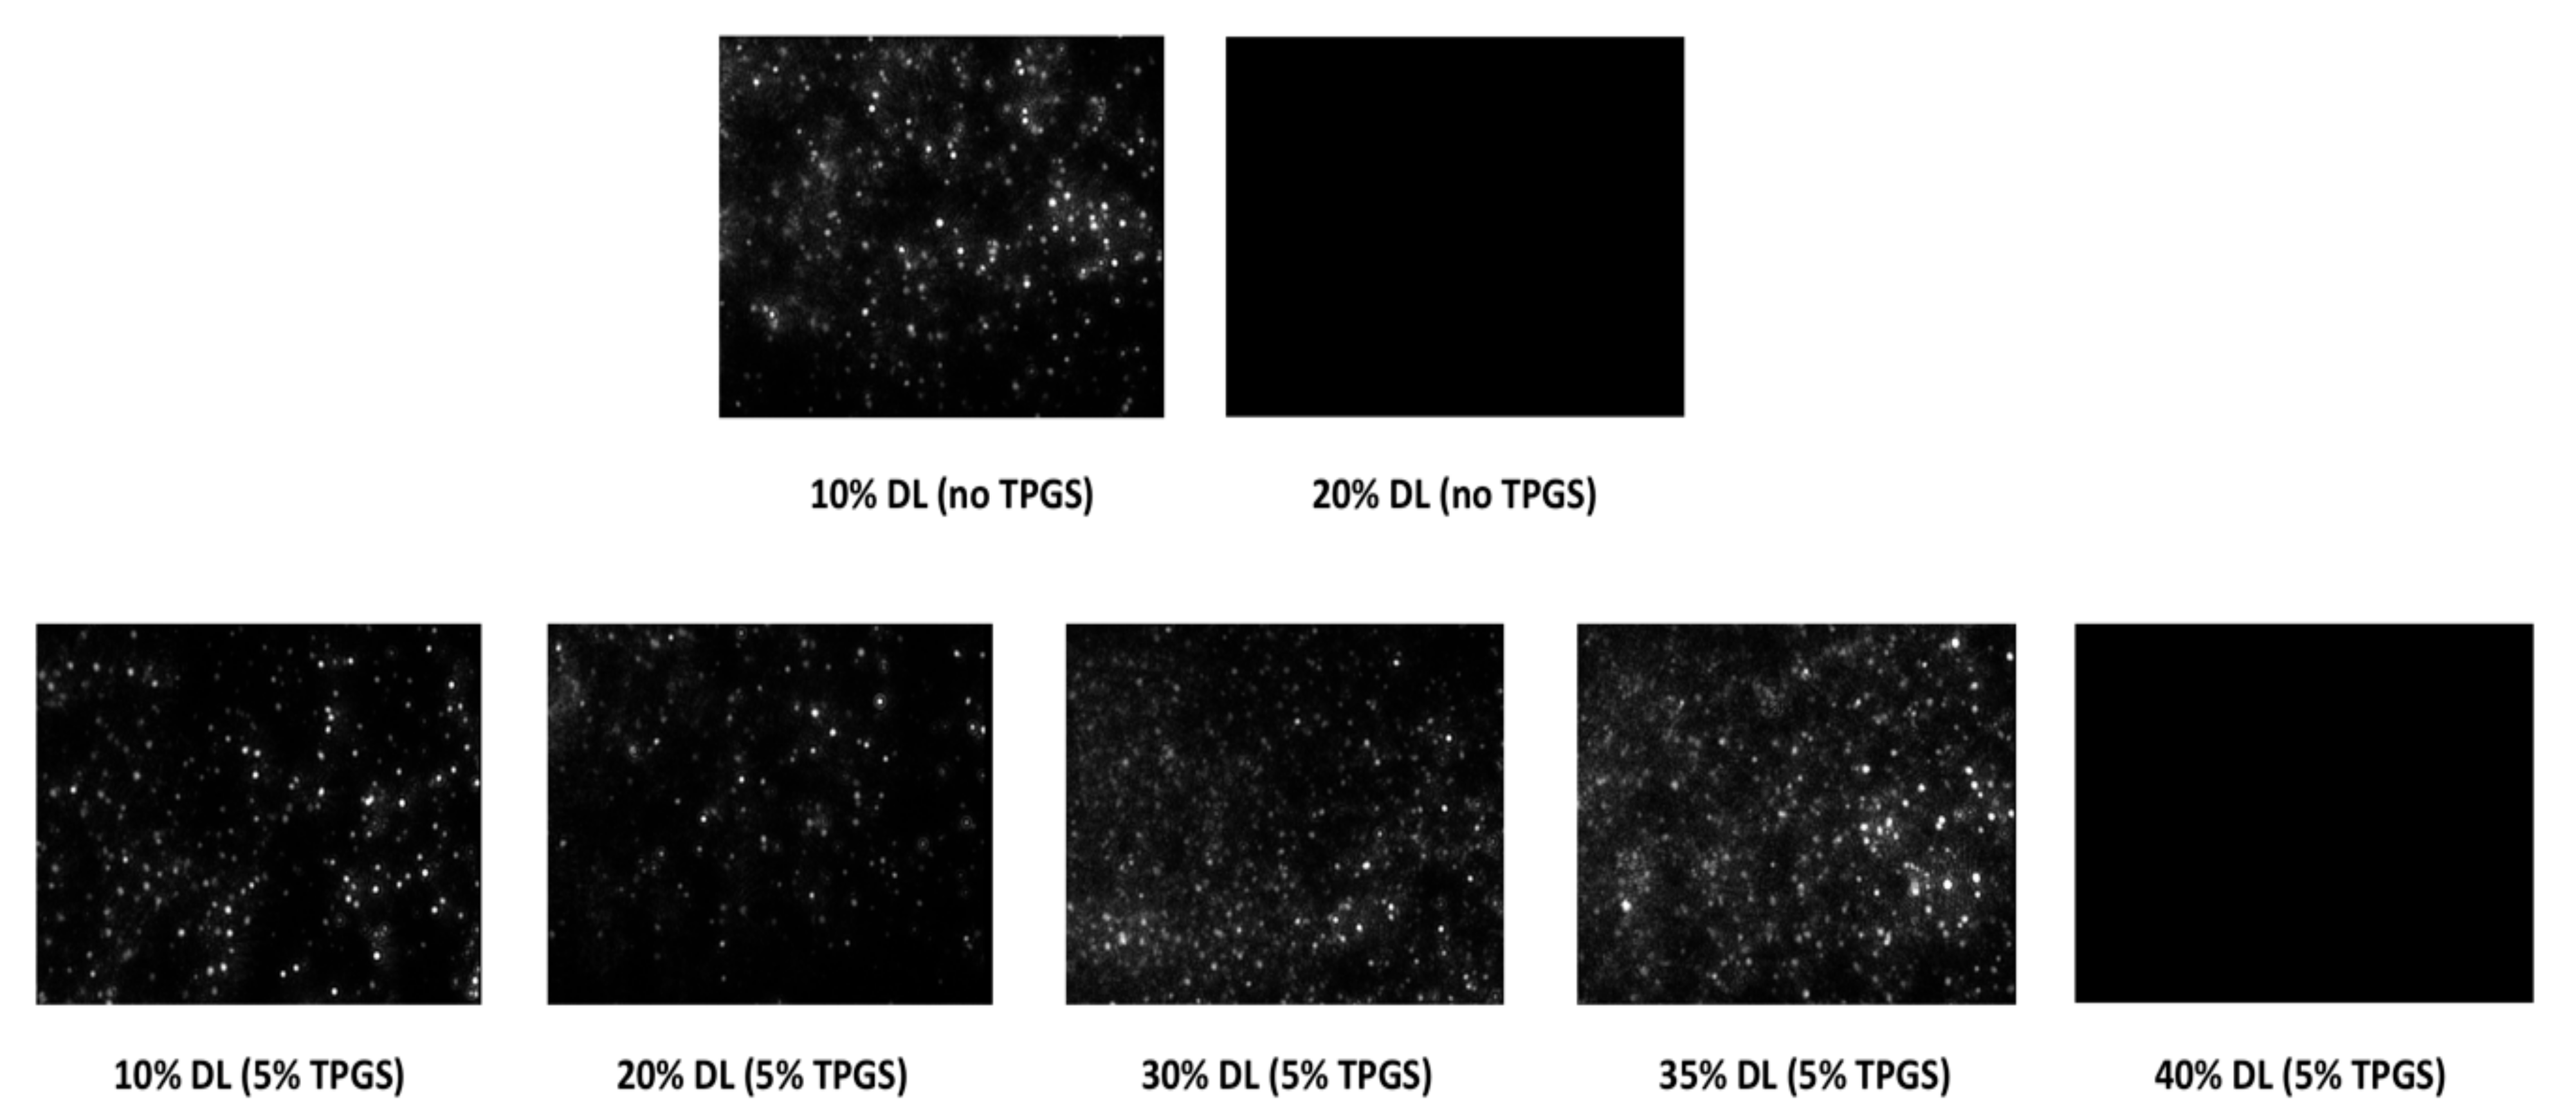
3.5. Nanoparticle Tracking Analysis (NTA)
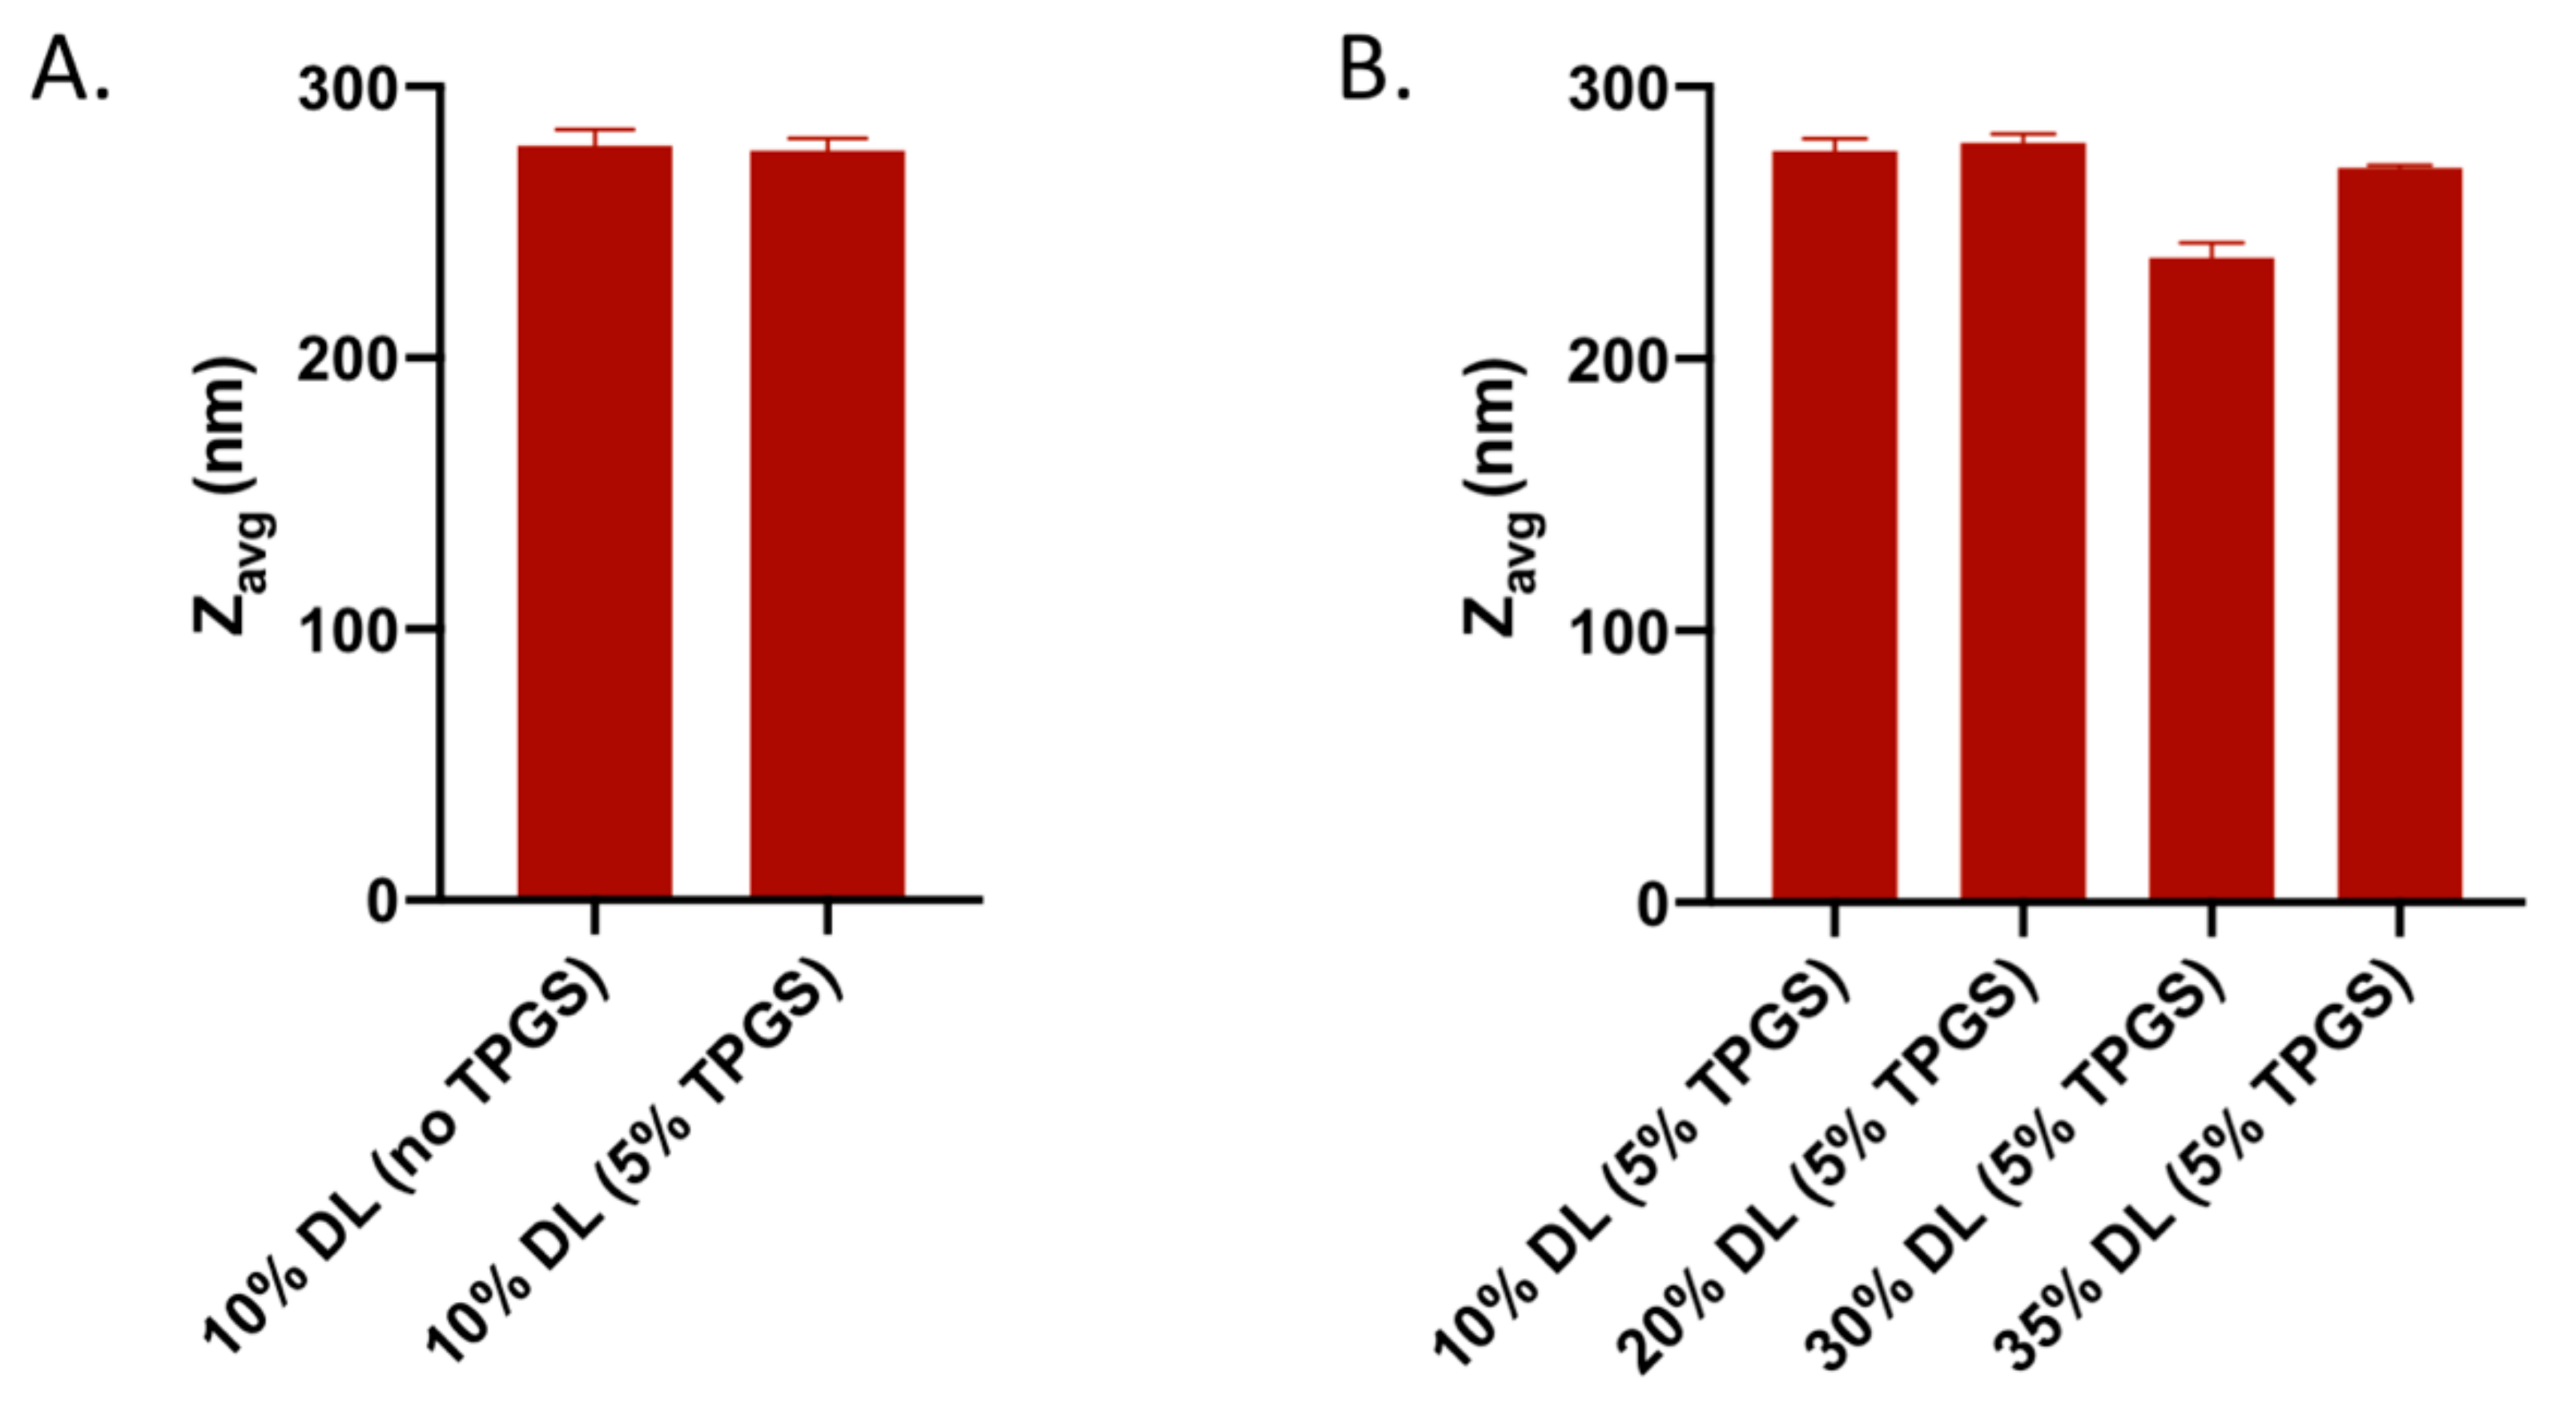
3.6. Dynamic Light Scattering (DLS)
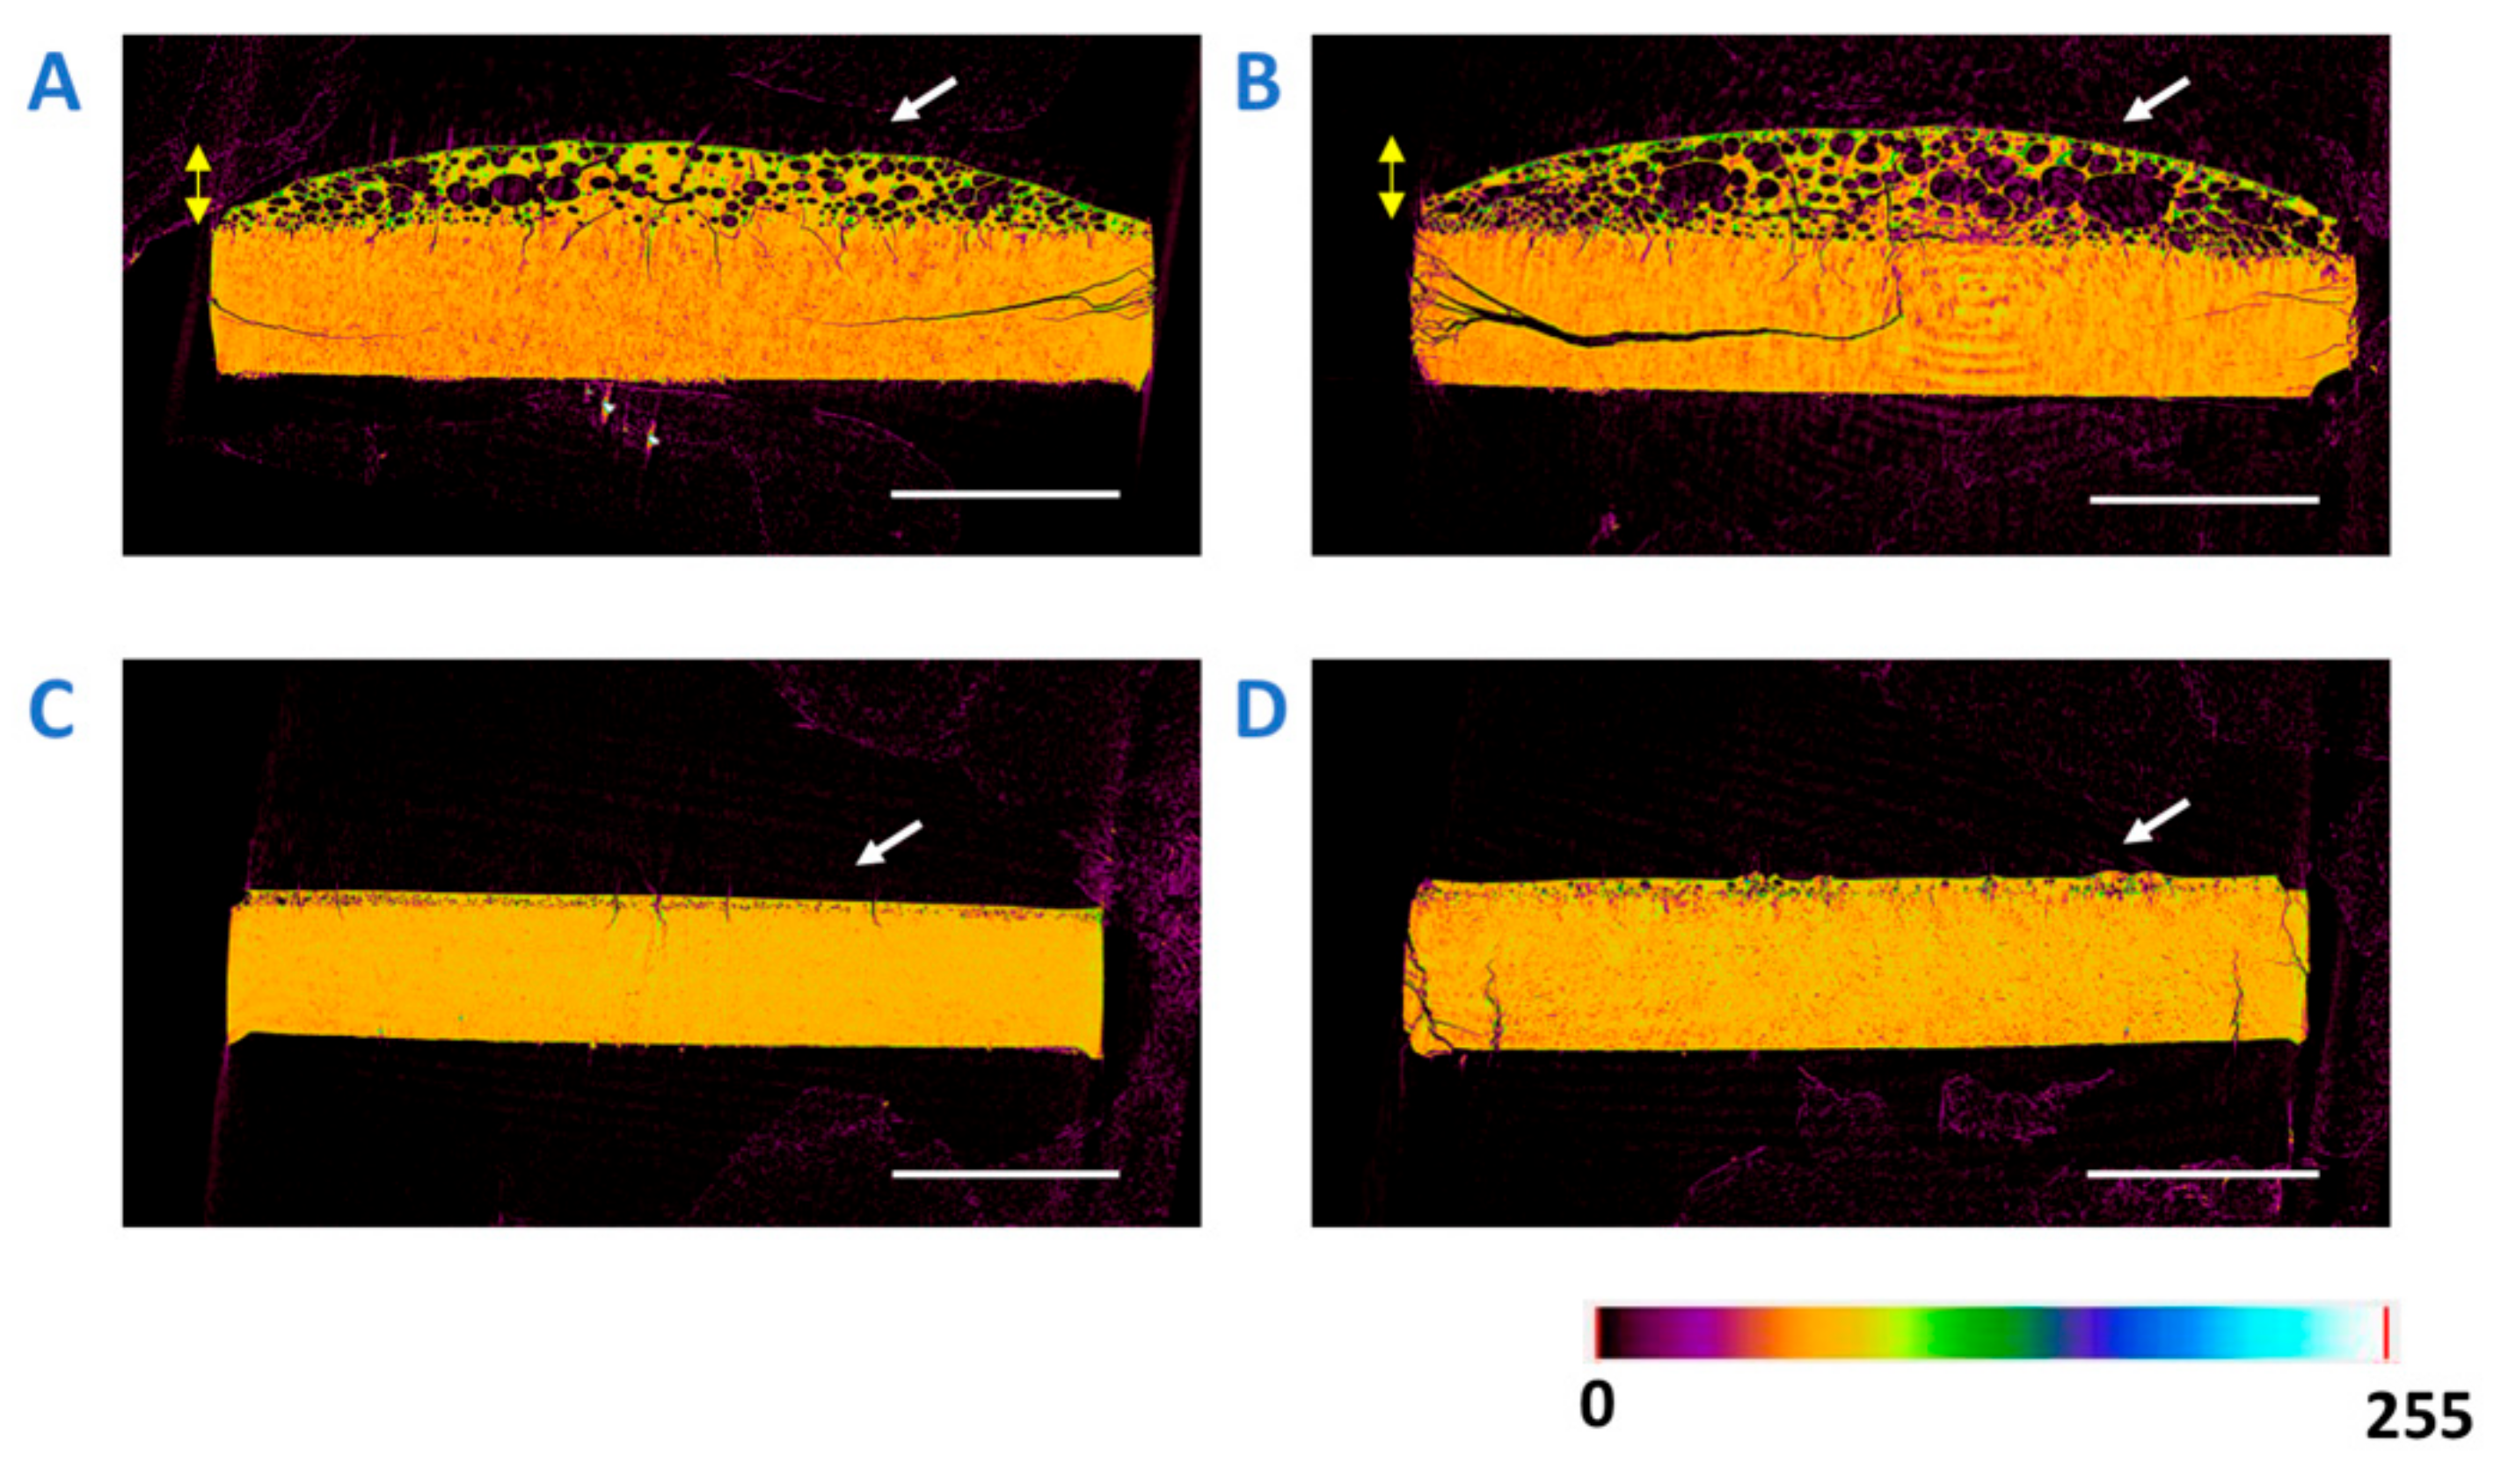
3.7. X-ray Microcomputed Tomography (Micro-CT) Imaging
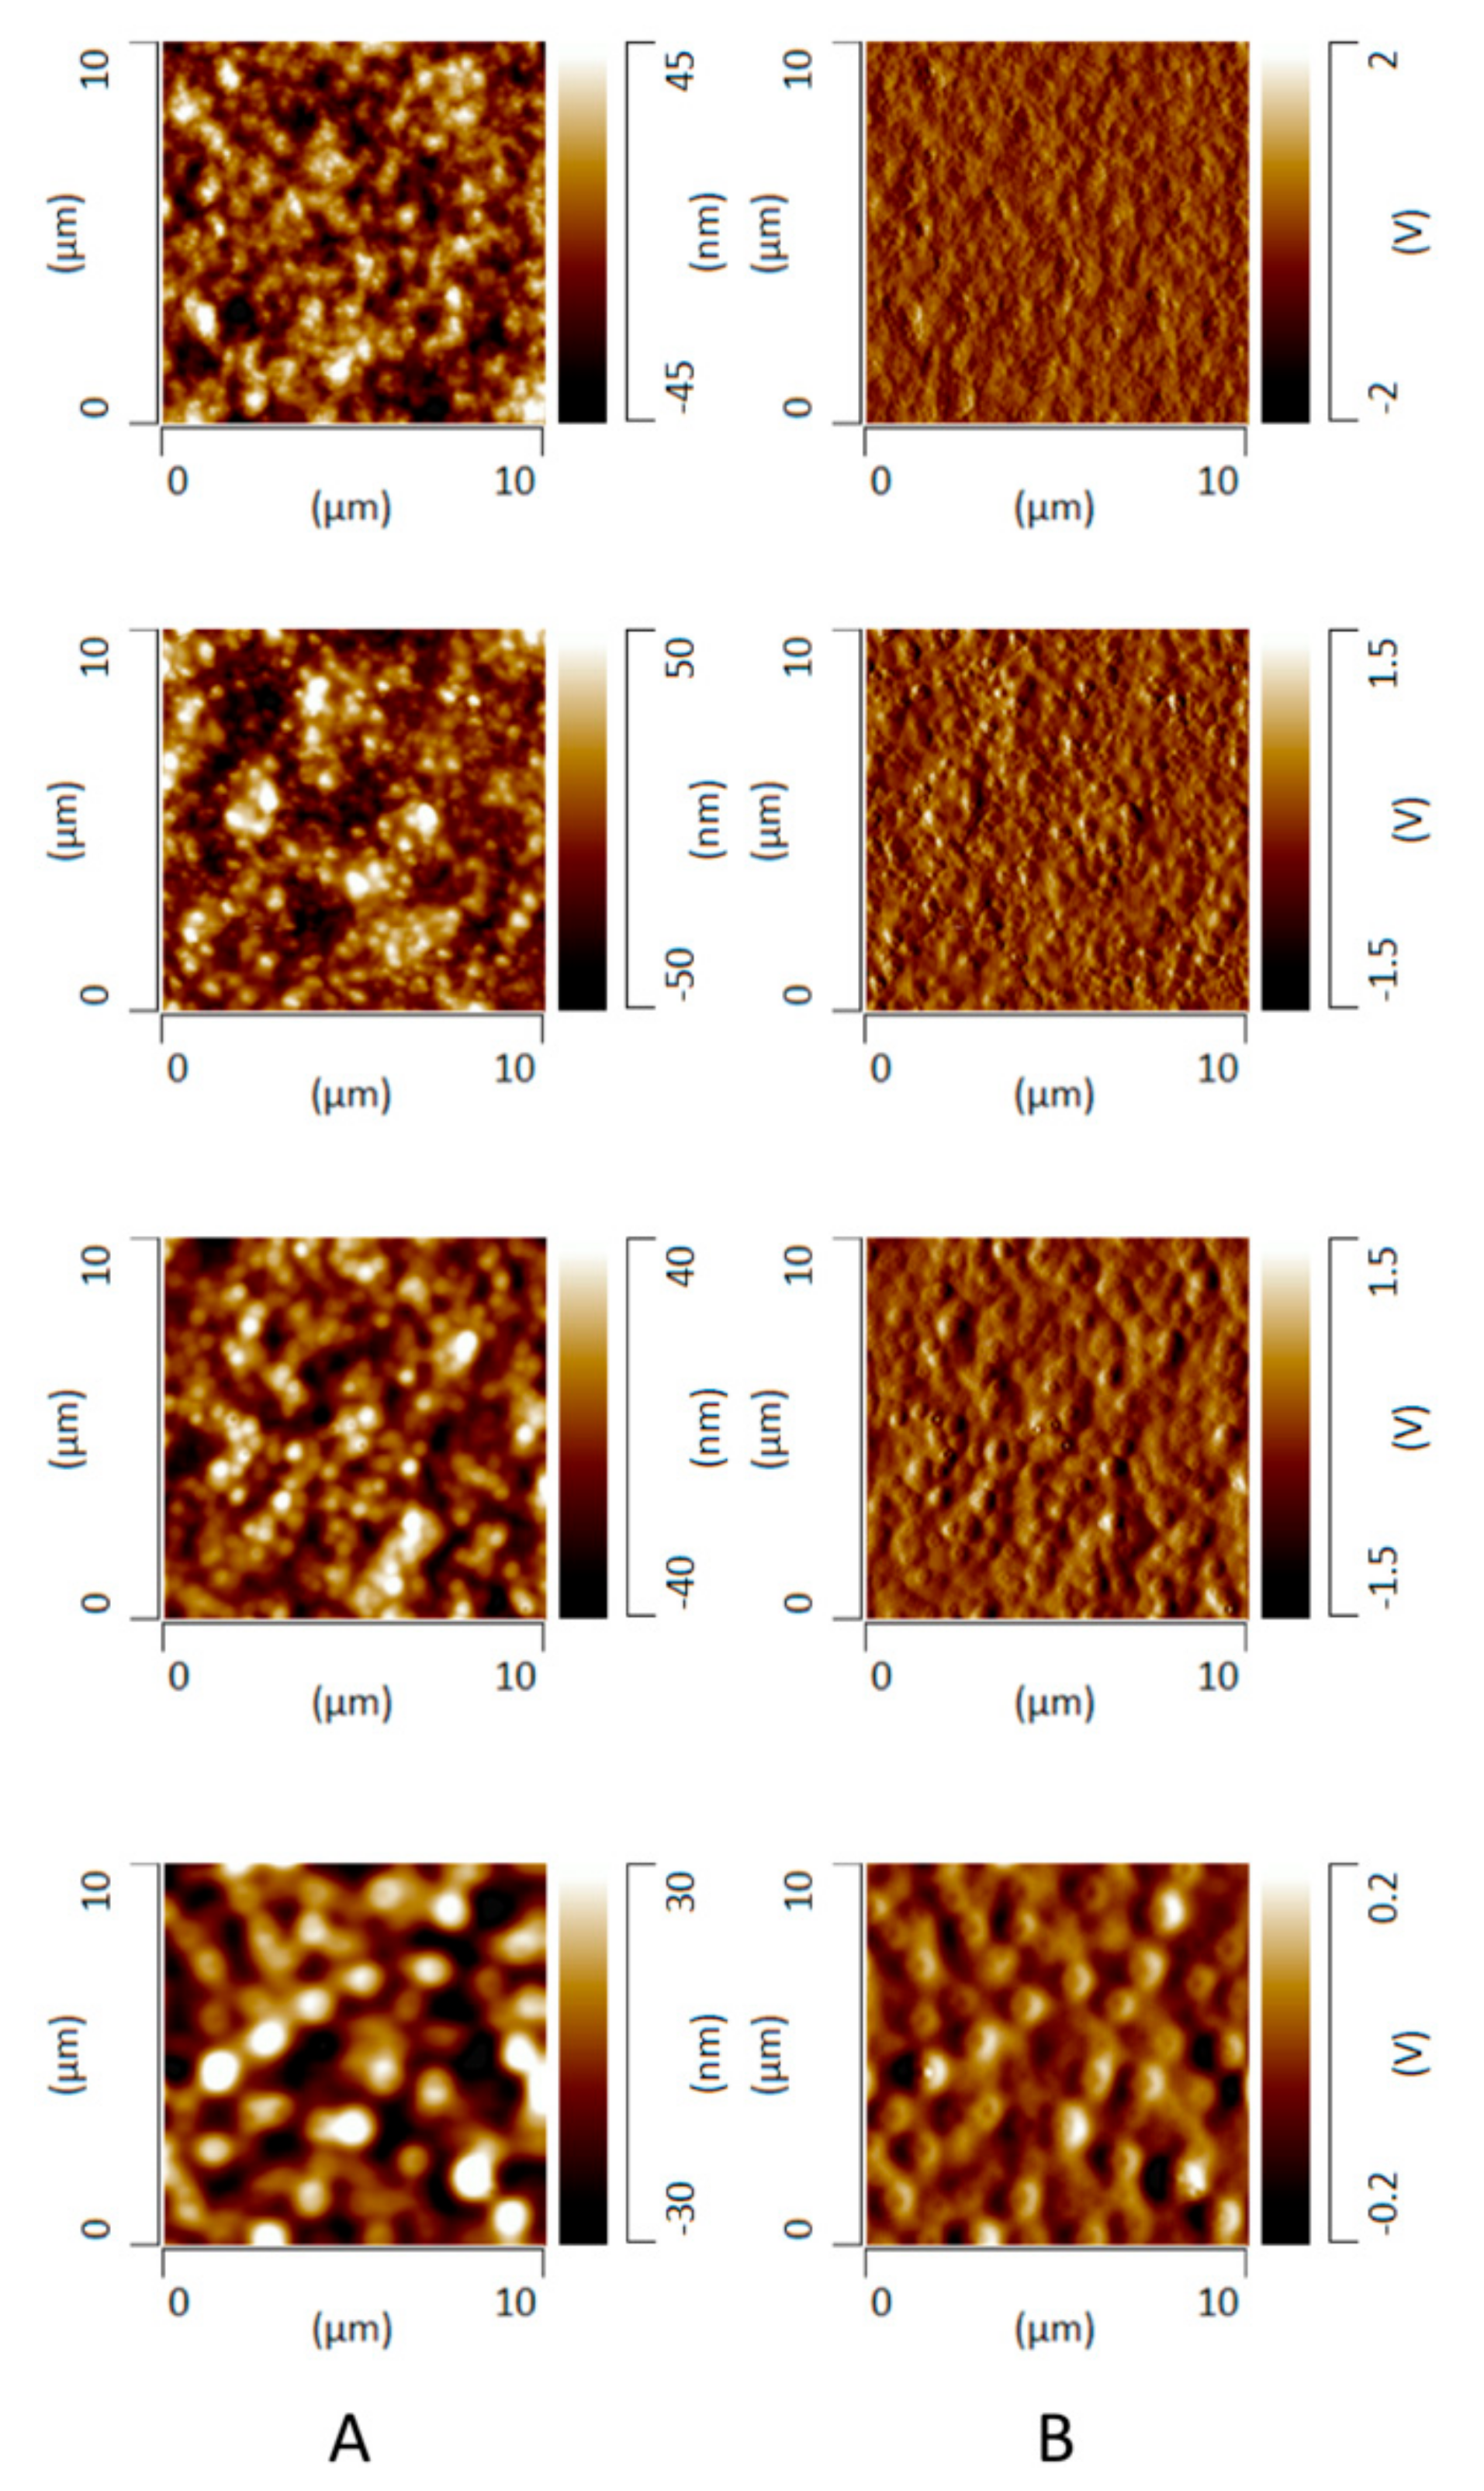
3.8. Phase Behavior of ASD Films after High RH Exposure
4. Discussion
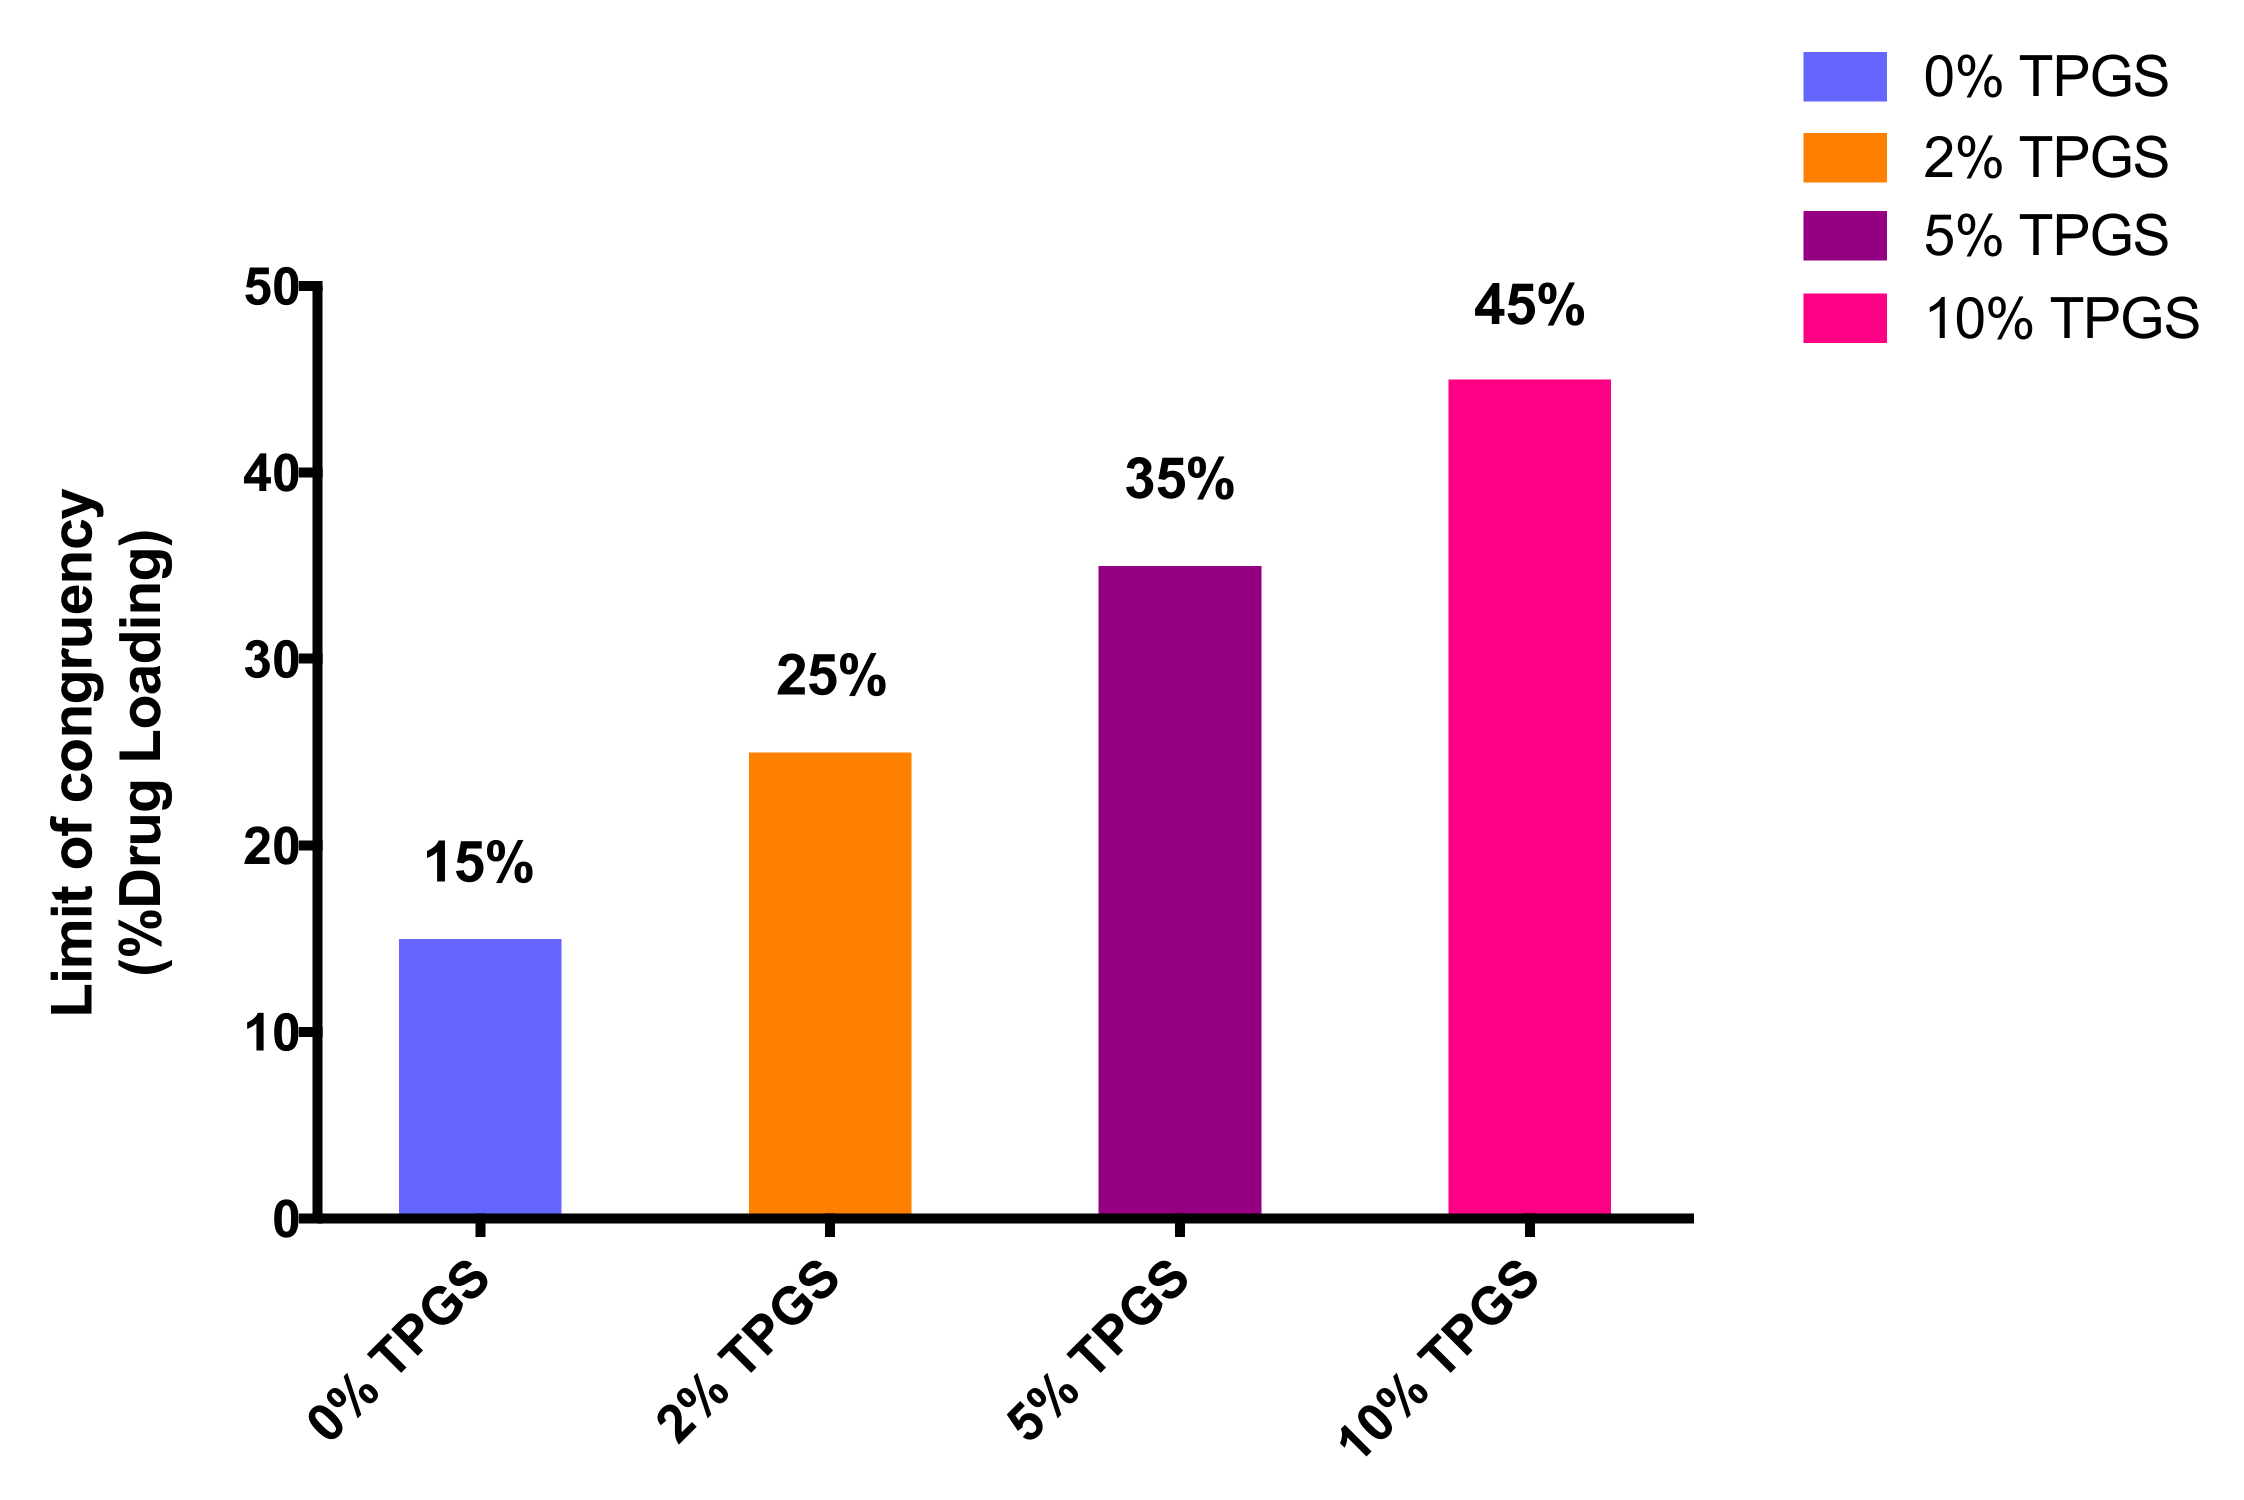
4.1. Solubilization
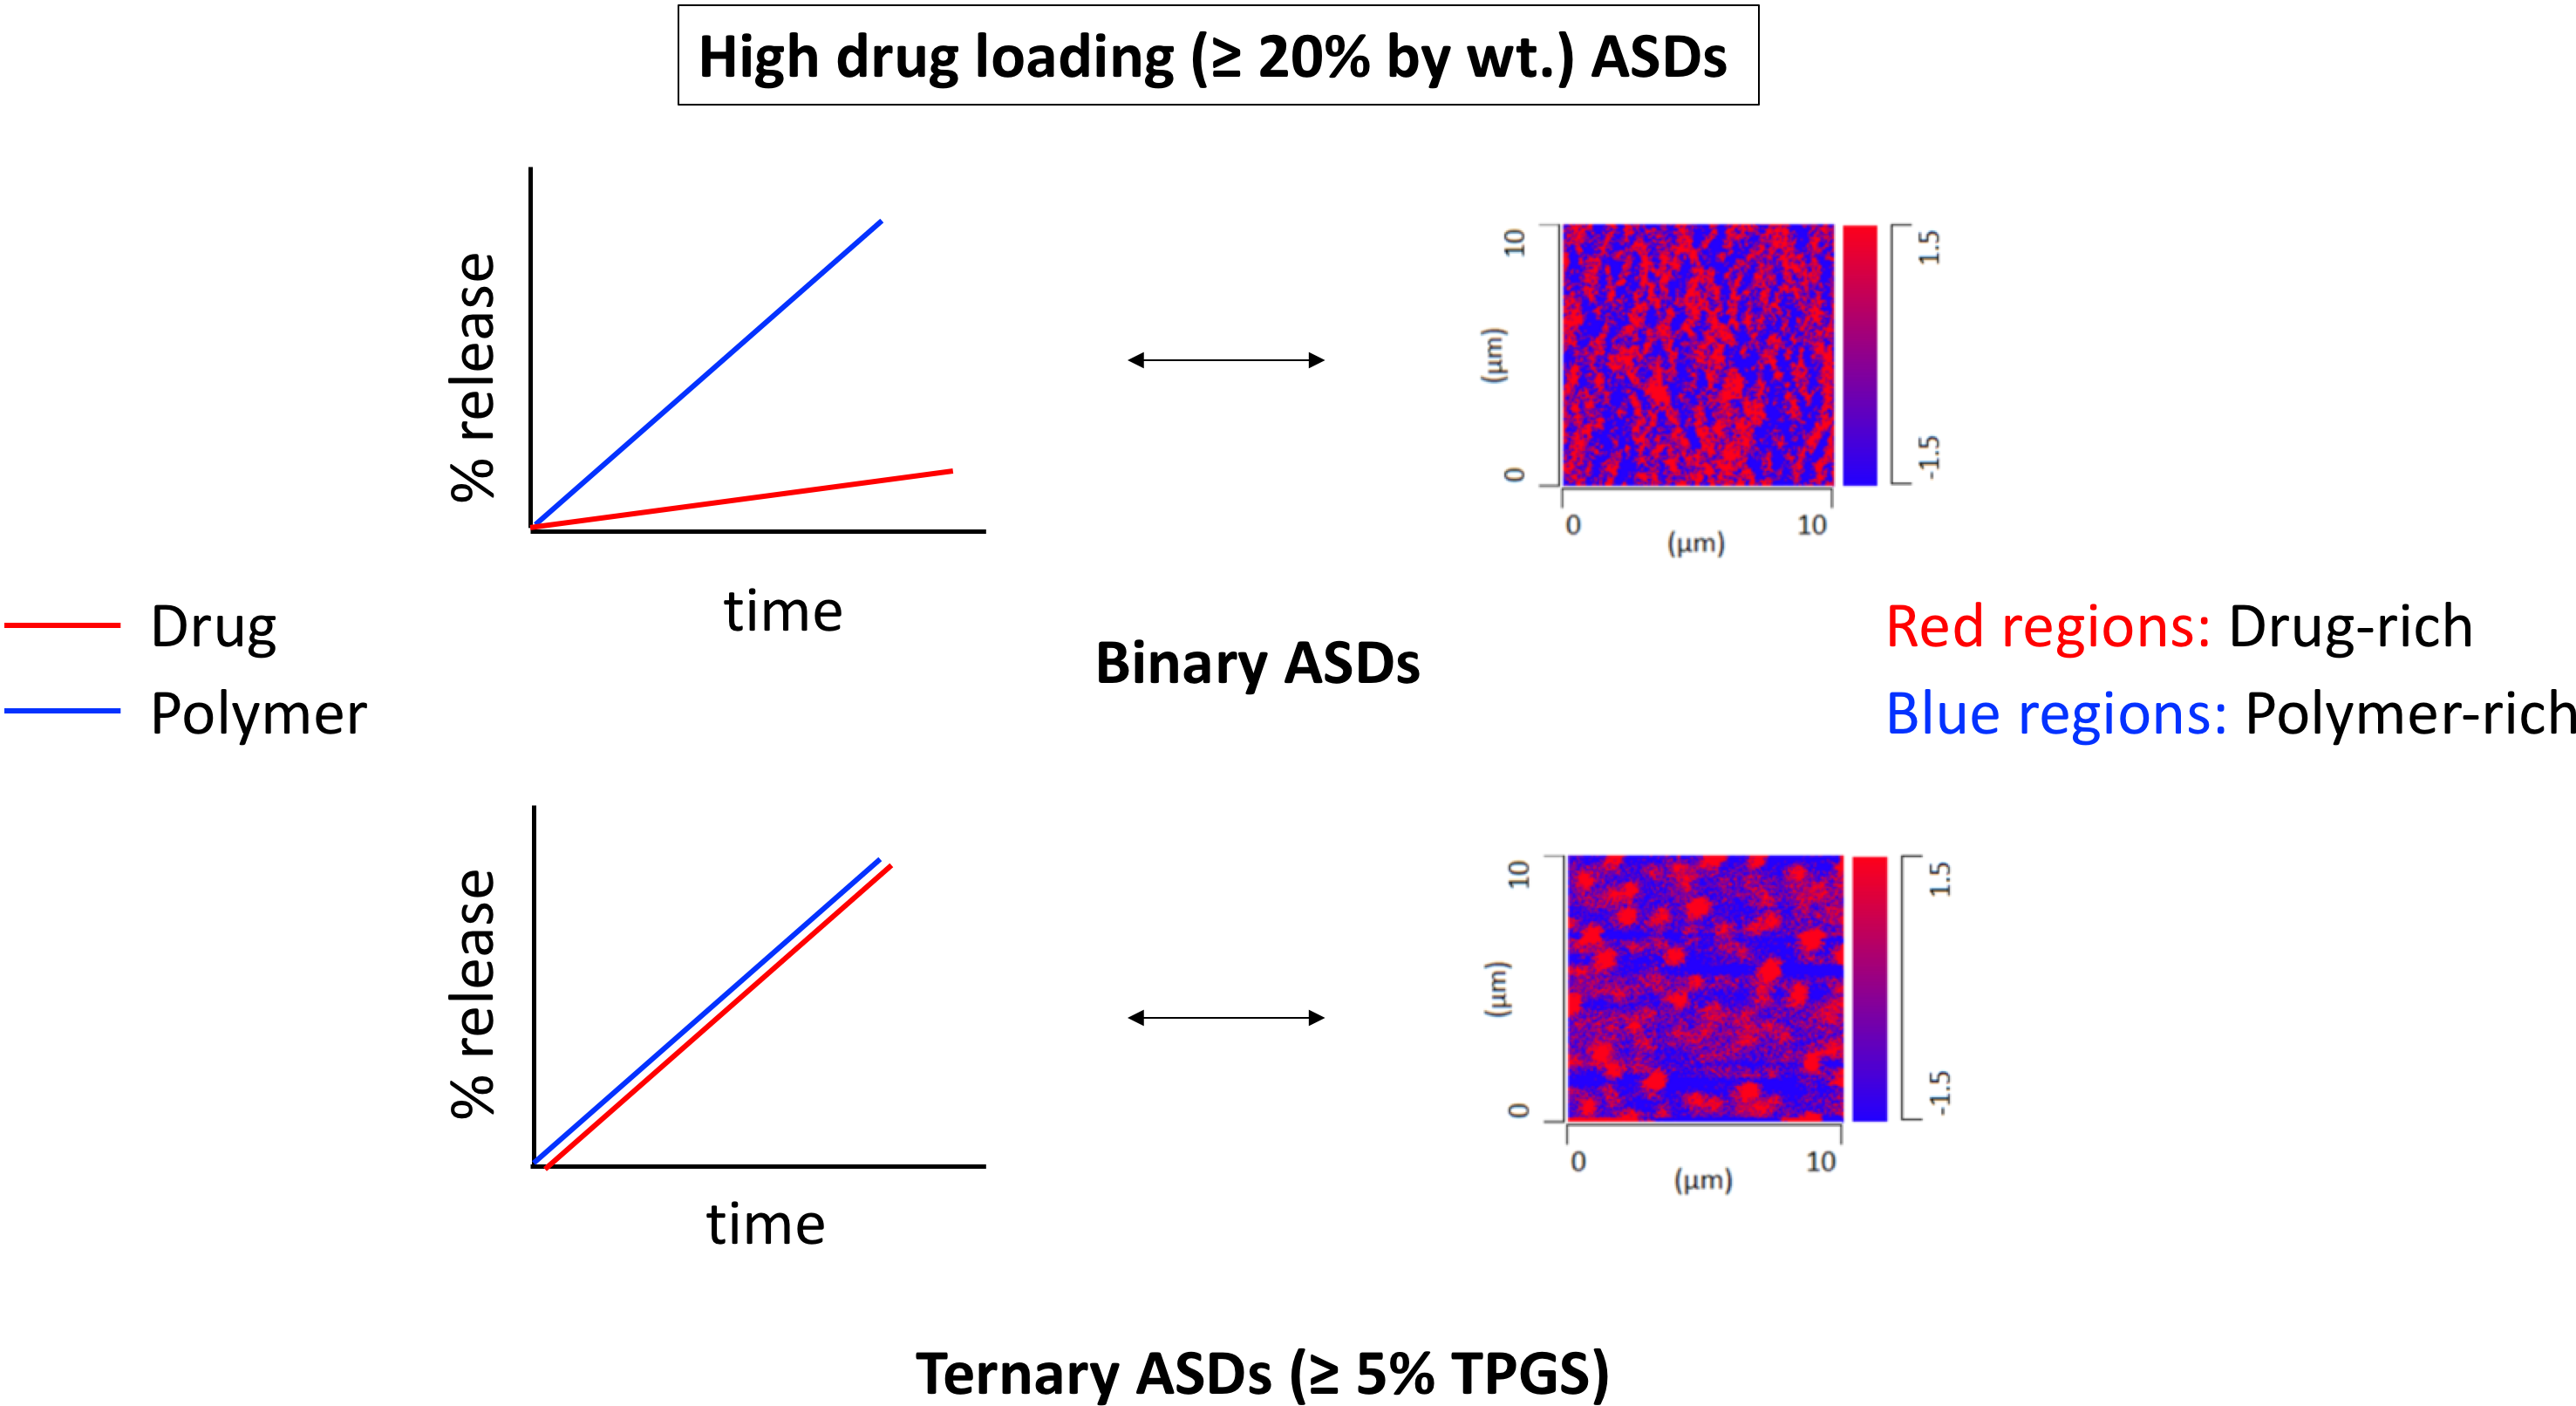
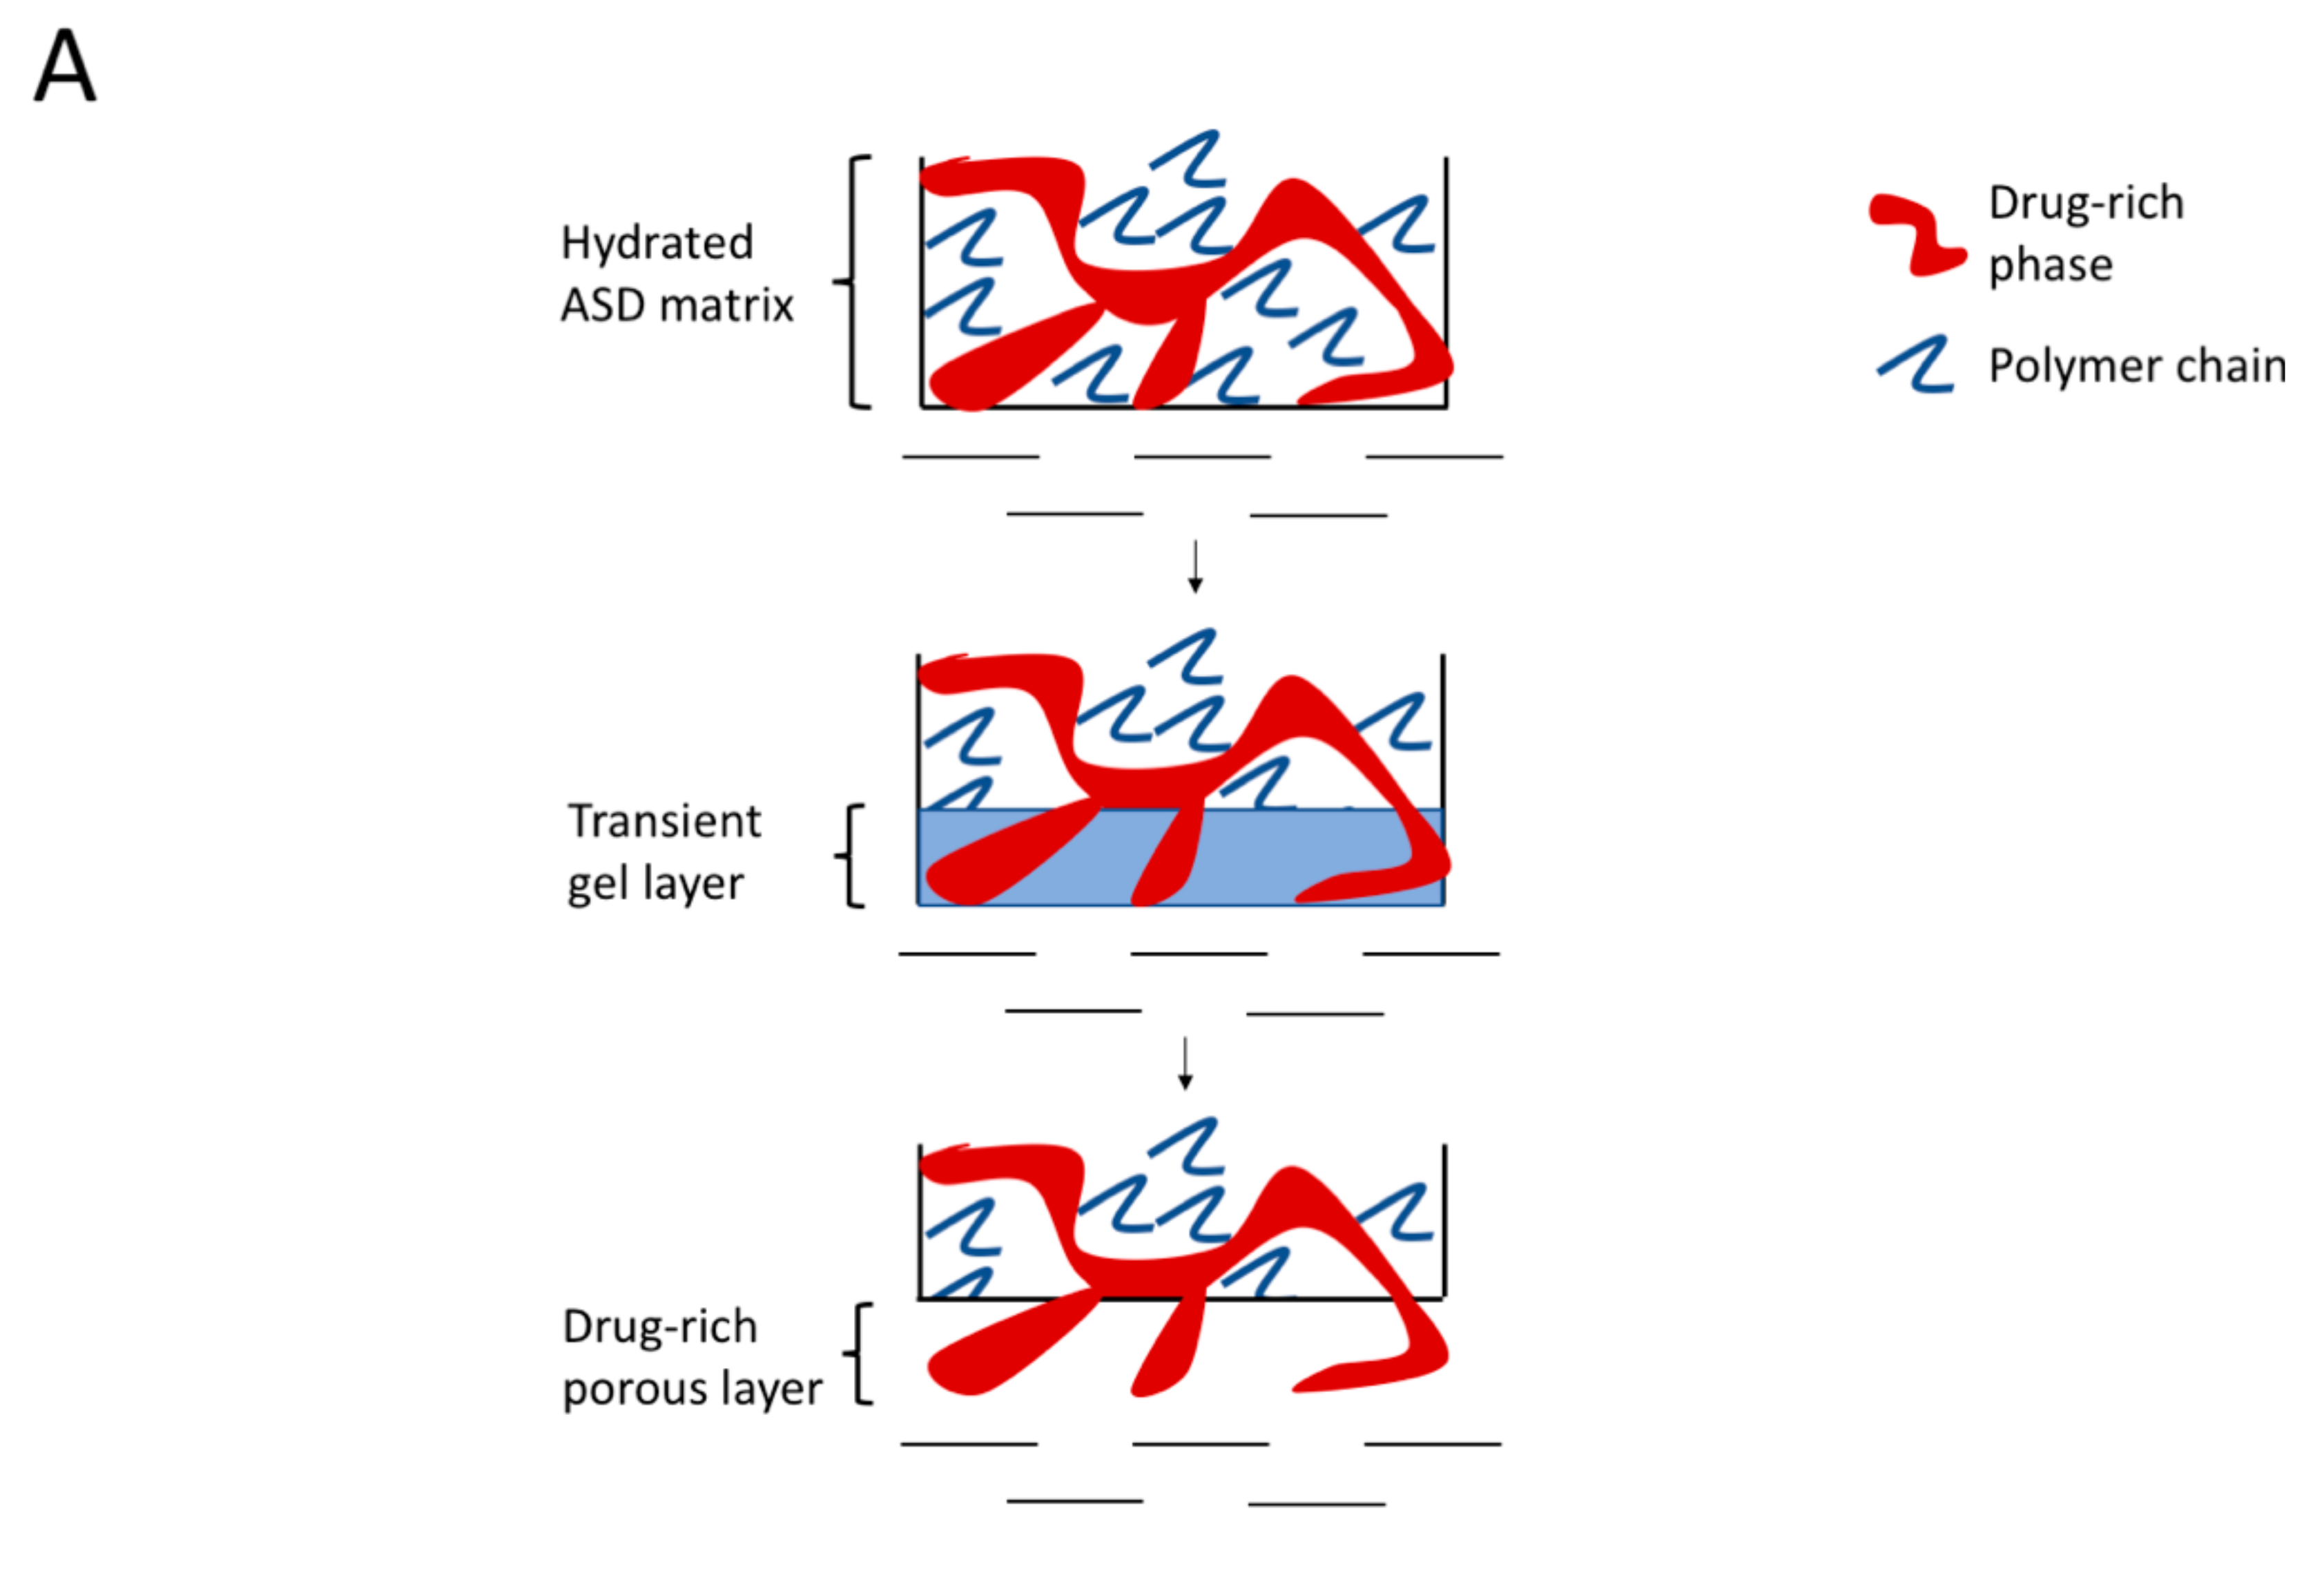
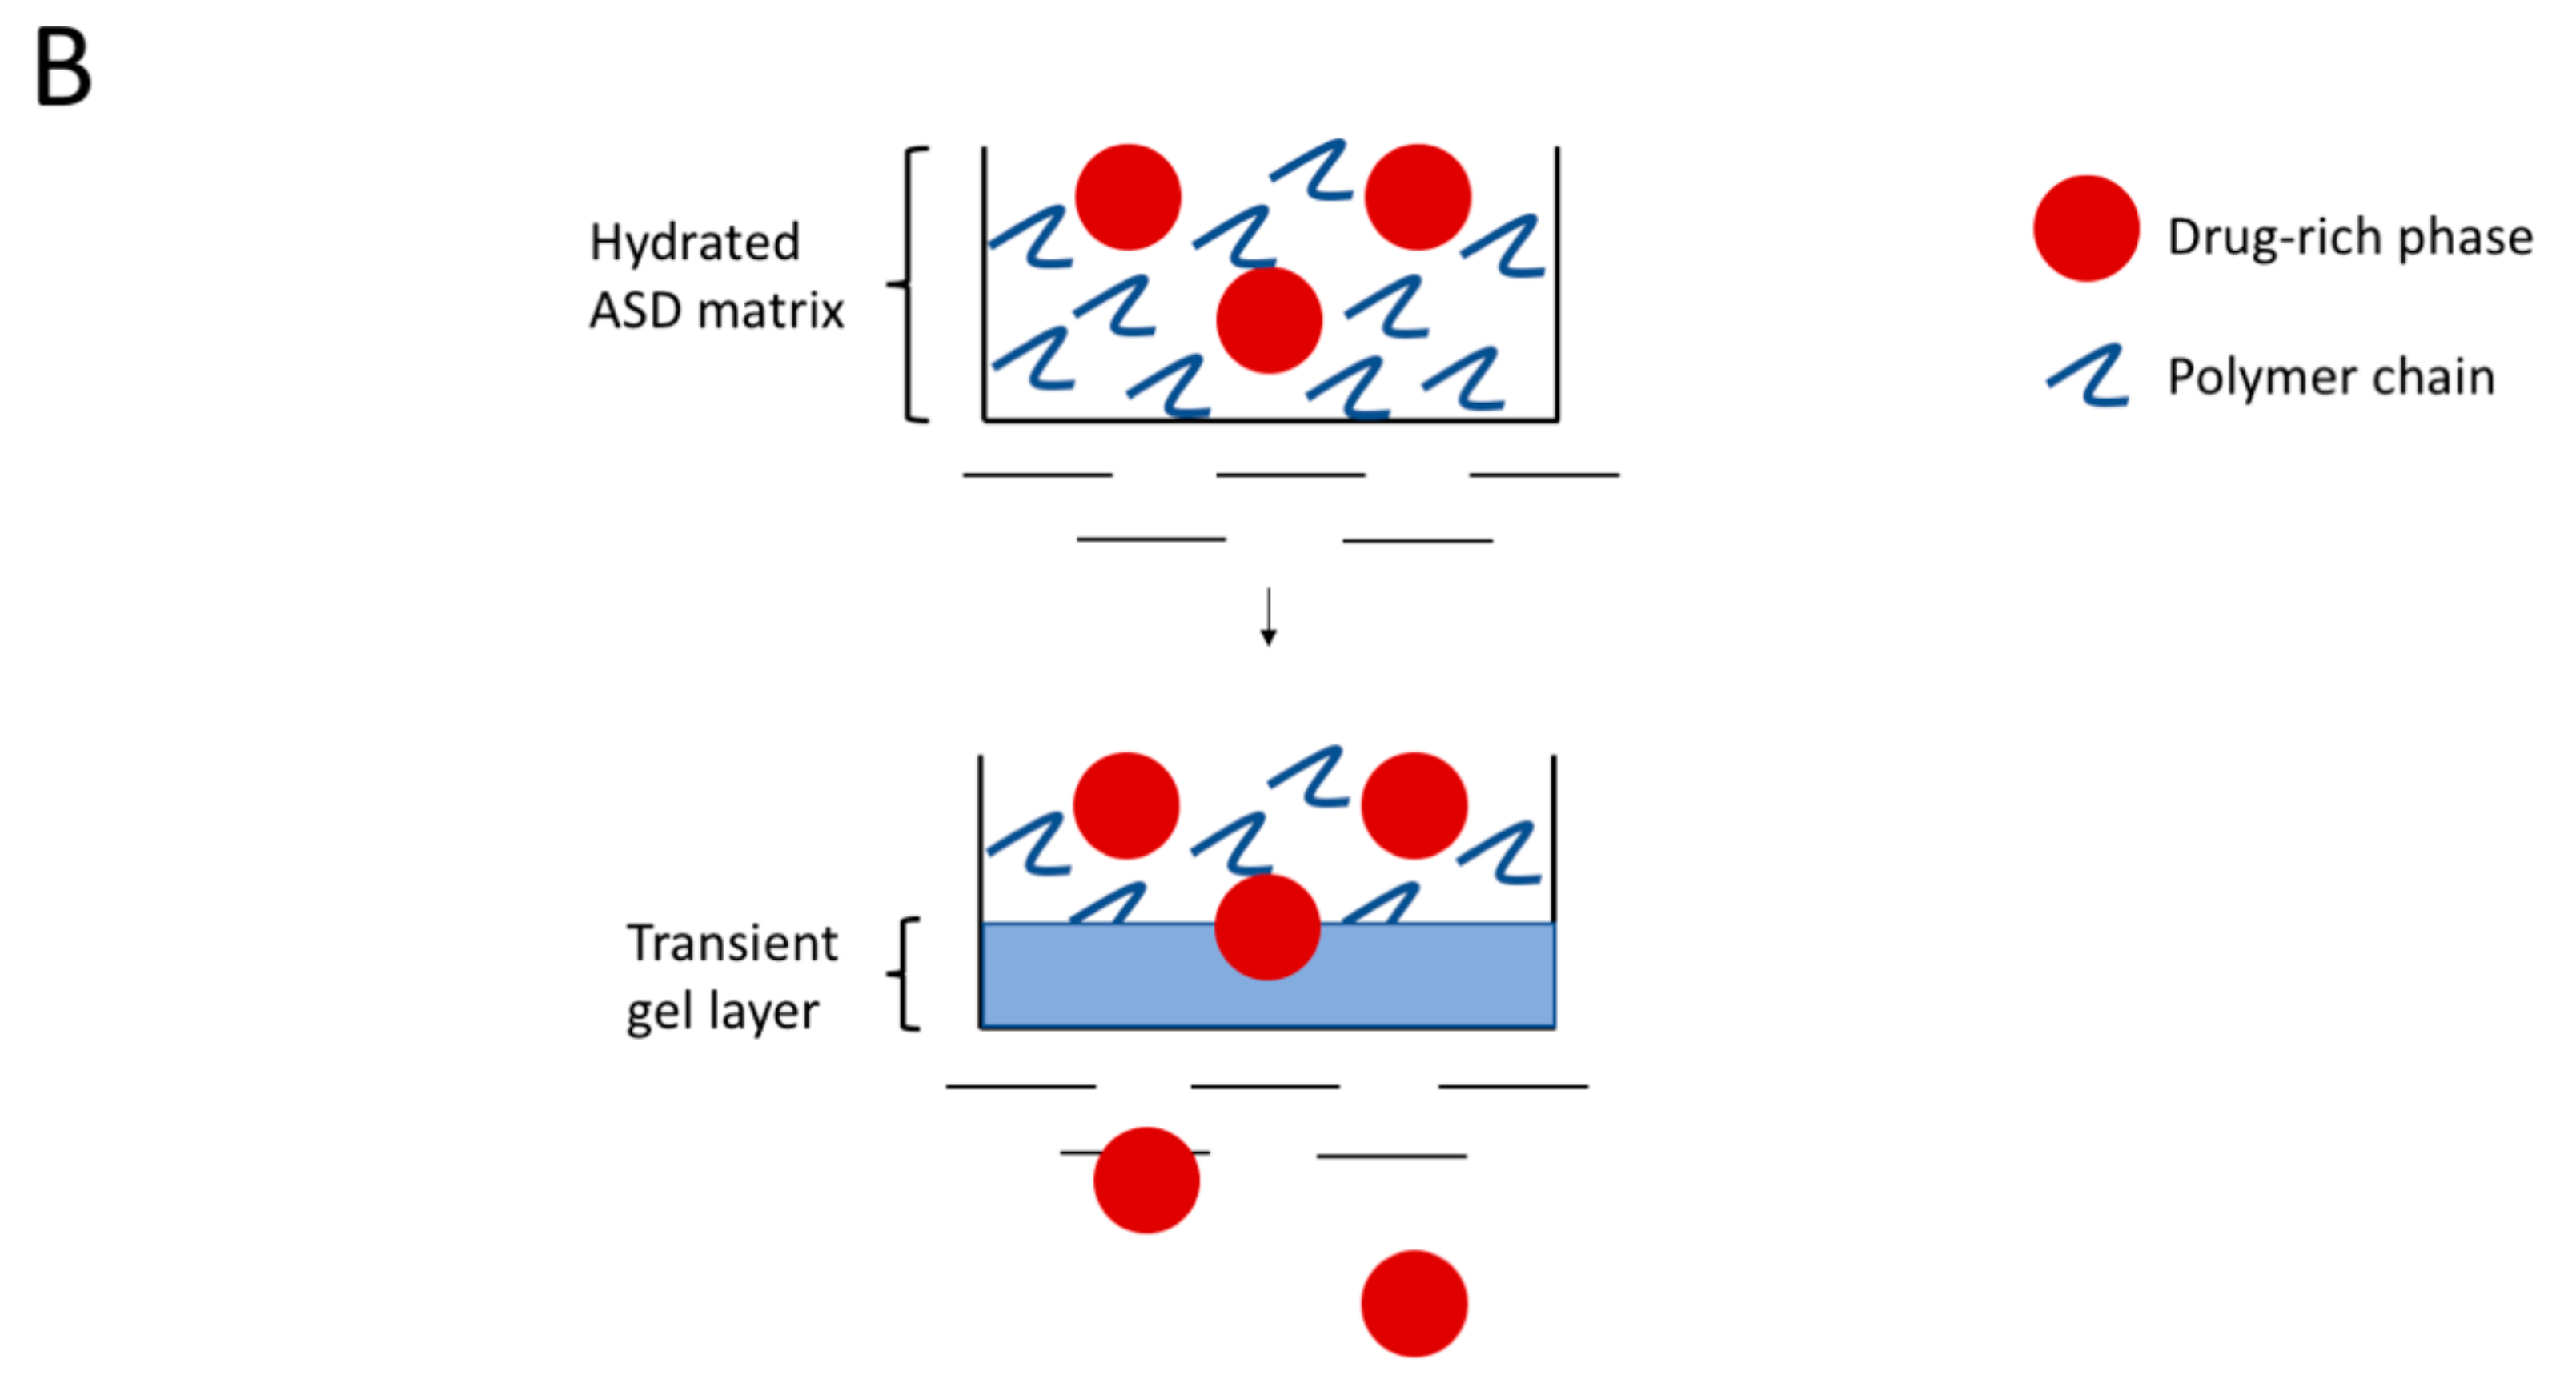
4.2. Hydrated ASD Microstructure and Dissolution
4.3. Molecular Mobility
4.4. Mechanism of Amorphous Nanoparticles Formation
5. Conclusions
Supplementary Materials
Author Contributions
Funding
Institutional Review Board Statement
Informed Consent Statement
Data Availability Statement
Acknowledgments
Conflicts of Interest
References
- Rodriguez-Aller, M.; Guillarme, D.; Veuthey, J.-L.; Gurny, R. Strategies for formulating and delivering poorly water-soluble drugs. J. Drug Deliv. Sci. Technol. 2015, 30, 342–351. [Google Scholar] [CrossRef]
- Benet, L.Z. The role of BCS (biopharmaceutics classification system) and BDDCS (biopharmaceutics drug disposition classification system) in drug development. J. Pharm. Sci. 2013, 102, 34–42. [Google Scholar] [CrossRef] [PubMed] [Green Version]
- Hancock, B.C.; Parks, M. What is the true solubility advantage for amorphous pharmaceuticals? Pharm. Res. 2000, 17, 397–404. [Google Scholar] [CrossRef] [PubMed]
- Saboo, S.; Moseson, D.E.; Kestur, U.S.; Taylor, L.S. Patterns of drug release as a function of drug loading from amorphous solid dispersions: A comparison of five different polymers. Eur. J. Pharm. Sci. 2020, 155, 105514. [Google Scholar] [CrossRef] [PubMed]
- Jermain, S.V.; Brough, C.; Williams, R.O., III. Amorphous solid dispersions and nanocrystal technologies for poorly water-soluble drug delivery—An update. Int. J. Pharm. 2018, 535, 379–392. [Google Scholar] [CrossRef] [PubMed]
- McKelvey, C.A.; Kesisoglou, F. Enabling an HCV Treatment Revolution and the Frontiers of Solid Solution Formulation. J. Pharm. Sci. 2019, 108, 50–57. [Google Scholar] [CrossRef] [Green Version]
- Saboo, S.; Mugheirbi, N.A.; Zemlyanov, D.Y.; Kestur, U.S.; Taylor, L.S. Congruent release of drug and polymer: A “sweet spot” in the dissolution of amorphous solid dispersions. J. Control. Release 2019, 298, 68–82. [Google Scholar] [CrossRef]
- Indulkar, A.S.; Lou, X.; Zhang, G.G.Z.; Taylor, L.S. Insights into the Dissolution Mechanism of Ritonavir-Copovidone Amorphous Solid Dispersions: Importance of Congruent Release for Enhanced Performance. Mol. Pharm. 2019, 16, 1327–1339. [Google Scholar] [CrossRef]
- Ilevbare, G.A.; Taylor, L.S. Liquid-Liquid Phase Separation in Highly Supersaturated Aqueous Solutions of Poorly Water-Soluble Drugs: Implications for Solubility Enhancing Formulations. Cryst. Growth Des. 2013, 13, 1497–1509. [Google Scholar] [CrossRef]
- Kesisoglou, F.; Wang, M.; Galipeau, K.; Harmon, P.; Okoh, G.; Xu, W. Effect of Amorphous Nanoparticle Size on Bioavailability of Anacetrapib in Dogs. J. Pharm. Sci. 2019, 108, 2917–2925. [Google Scholar] [CrossRef]
- Wilson, V.; Lou, X.; Osterling, D.J.; Stolarik, D.F.; Jenkins, G.; Gao, W.; Zhang, G.G.Z.; Taylor, L.S. Relationship between amorphous solid dispersion in vivo absorption and in vitro dissolution: Phase behavior during dissolution, speciation, and membrane mass transport. J. Control. Release 2018, 292, 172–182. [Google Scholar] [CrossRef]
- Jara, M.O.; Warnken, Z.N.; Williams, R.O., III. Amorphous solid dispersions and the confounding effect of nanoparticles in in vitro dissolution and in vivo testing: Niclosamide as a case study. bioRxiv 2020. [Google Scholar] [CrossRef]
- Indulkar, A.S.; Waters, J.E.; Mo, H.; Gao, Y.; Raina, S.A.; Zhang, G.G.Z.; Taylor, L.S. Origin of Nanodroplet Formation Upon Dissolution of an Amorphous Solid Dispersion: A Mechanistic Isotope Scrambling Study. J. Pharm. Sci. 2017, 106, 1998–2008. [Google Scholar] [CrossRef]
- Harmon, P.; Galipeau, K.; Xu, W.; Brown, C.; Wuelfing, W.P. Mechanism of Dissolution-Induced Nanoparticle Formation from a Copovidone-Based Amorphous Solid Dispersion. Mol. Pharm. 2016, 13, 1467–1481. [Google Scholar] [CrossRef] [PubMed]
- Stewart, A.M.; Grass, M.E.; Brodeur, T.J.; Goodwin, A.K.; Morgen, M.M.; Friesen, D.T.; Vodak, D.T. Impact of Drug-Rich Colloids of Itraconazole and HPMCAS on Membrane Flux in Vitro and Oral Bioavailability in Rats. Mol. Pharm. 2017, 14, 2437–2449. [Google Scholar] [CrossRef] [PubMed] [Green Version]
- Que, C.; Lou, X.; Zemlyanov, D.Y.; Mo, H.; Indulkar, A.S.; Gao, Y.; Zhang, G.G.Z.; Taylor, L.S. Insights into the Dissolution Behavior of Ledipasvir-Copovidone Amorphous Solid Dispersions: Role of Drug Loading and Intermolecular Interactions. Mol. Pharm. 2019, 16, 5054–5067. [Google Scholar] [CrossRef] [PubMed]
- Saboo, S.; Kestur, U.S.; Flaherty, D.P.; Taylor, L.S. Congruent Release of Drug and Polymer from Amorphous Solid Dispersions: Insights into the Role of Drug-Polymer Hydrogen Bonding, Surface Crystallization, and Glass Transition. Mol. Pharm. 2020, 17, 1261–1275. [Google Scholar] [CrossRef] [PubMed]
- Lakshman, J.P.; Cao, Y.; Kowalski, J.; Serajuddin, A.T. Application of melt extrusion in the development of a physically and chemically stable high-energy amorphous solid dispersion of a poorly water-soluble drug. Mol. Pharm. 2008, 5, 994–1002. [Google Scholar] [CrossRef]
- Lang, B.; Liu, S.; McGinity, J.W.; Williams, R.O., III. Effect of hydrophilic additives on the dissolution and pharmacokinetic properties of itraconazole-enteric polymer hot-melt extruded amorphous solid dispersions. Drug Dev. Ind. Pharm. 2016, 42, 429–445. [Google Scholar] [CrossRef]
- Lu, Y.; Chen, J.; Yi, S.; Xiong, S. Enhanced felodipine dissolution from high drug loading amorphous solid dispersions with PVP/VA and sodium dodecyl sulfate. J. Drug Deliv. Sci. Technol. 2019, 53, 101151. [Google Scholar] [CrossRef]
- Chen, J.; Ormes, J.D.; Higgins, J.D.; Taylor, L.S. Impact of surfactants on the crystallization of aqueous suspensions of celecoxib amorphous solid dispersion spray dried particles. Mol. Pharm. 2015, 12, 533–541. [Google Scholar] [CrossRef]
- Mosquera-Giraldo, L.I.; Trasi, N.S.; Taylor, L.S. Impact of surfactants on the crystal growth of amorphous celecoxib. Int. J. Pharm. 2014, 461, 251–257. [Google Scholar] [CrossRef]
- Meng, F.; Ferreira, R.; Zhang, F. Effect of surfactant level on properties of celecoxib amorphous solid dispersions. J. Drug Deliv. Sci. Technol. 2019, 49, 301–307. [Google Scholar] [CrossRef]
- Frank, K.J.; Westedt, U.; Rosenblatt, K.M.; Holig, P.; Rosenberg, J.; Magerlein, M.; Fricker, G.; Brandl, M. The amorphous solid dispersion of the poorly soluble ABT-102 forms nano/microparticulate structures in aqueous medium: Impact on solubility. Int. J. Nanomed. 2012, 7, 5757–5768. [Google Scholar] [CrossRef] [Green Version]
- Baghel, S.; Cathcart, H.; O’Reilly, N.J. Investigation into the Solid-State Properties and Dissolution Profile of Spray-Dried Ternary Amorphous Solid Dispersions: A Rational Step toward the Design and Development of a Multicomponent Amorphous System. Mol. Pharm. 2018, 15, 3796–3812. [Google Scholar] [CrossRef]
- Janssens, S.; Nagels, S.; Armas, H.N.; D’Autry, W.; Van Schepdael, A.; Van den Mooter, G. Formulation and characterization of ternary solid dispersions made up of Itraconazole and two excipients, TPGS 1000 and PVPVA 64, that were selected based on a supersaturation screening study. Eur. J. Pharm. Biopharm. 2008, 69, 158–166. [Google Scholar] [CrossRef] [PubMed]
- Feng, D.; Peng, T.; Huang, Z.; Singh, V.; Shi, Y.; Wen, T.; Lu, M.; Quan, G.; Pan, X.; Wu, C. Polymer-Surfactant System Based Amorphous Solid Dispersion: Precipitation Inhibition and Bioavailability Enhancement of Itraconazole. Pharmaceutics 2018, 10, 53. [Google Scholar] [CrossRef] [Green Version]
- Karavas, E.; Georgarakis, M.; Docoslis, A.; Bikiaris, D. Combining SEM, TEM, and micro-Raman techniques to differentiate between the amorphous molecular level dispersions and nanodispersions of a poorly water-soluble drug within a polymer matrix. Int. J. Pharm. 2007, 340, 76–83. [Google Scholar] [CrossRef]
- Konno, H.; Handa, T.; Alonzo, D.E.; Taylor, L.S. Effect of polymer type on the dissolution profile of amorphous solid dispersions containing felodipine. Eur. J. Pharm. Biopharm. 2008, 70, 493–499. [Google Scholar] [CrossRef]
- Sarpal, K.; Delaney, S.; Zhang, G.G.Z.; Munson, E.J. Phase Behavior of Amorphous Solid Dispersions of Felodipine: Homogeneity and Drug–Polymer Interactions. Mol. Pharm. 2019, 16, 4836–4851. [Google Scholar] [CrossRef]
- Saboo, S.; Taylor, L.S. Water-induced phase separation of miconazole-poly (vinylpyrrolidone-co-vinyl acetate) amorphous solid dispersions: Insights with confocal fluorescence microscopy. Int. J. Pharm. 2017, 529, 654–666. [Google Scholar] [CrossRef]
- Grimaudo, M.A.; Pescina, S.; Padula, C.; Santi, P.; Concheiro, A.; Alvarez-Lorenzo, C.; Nicoli, S. Poloxamer 407/TPGS Mixed Micelles as Promising Carriers for Cyclosporine Ocular Delivery. Mol. Pharm. 2018, 15, 571–584. [Google Scholar] [CrossRef] [PubMed]
- Bhardwaj, V.; Trasi, N.S.; Zemlyanov, D.Y.; Taylor, L.S. Surface area normalized dissolution to study differences in itraconazole-copovidone solid dispersions prepared by spray-drying and hot melt extrusion. Int. J. Pharm. 2018, 540, 106–119. [Google Scholar] [CrossRef] [PubMed]
- Yang, R.; Mann, A.K.P.; Van Duong, T.; Ormes, J.D.; Okoh, G.A.; Hermans, A.; Taylor, L.S. Drug Release and Nanodroplet Formation from Amorphous Solid Dispersions: Insight into the Roles of Drug Physicochemical Properties and Polymer Selection. Mol. Pharm. 2021, 18, 2066–2081. [Google Scholar] [CrossRef] [PubMed]
- Li, N.; Taylor, L.S. Microstructure Formation for Improved Dissolution Performance of Lopinavir Amorphous Solid Dispersions. Mol. Pharm. 2019, 16, 1751–1765. [Google Scholar] [CrossRef]
- Han, Y.R.; Ma, Y.; Lee, P.I. Impact of phase separation morphology on release mechanism of amorphous solid dispersions. Eur. J. Pharm. Sci. 2019, 136, 104955. [Google Scholar] [CrossRef]
- Li, N.; Cape, J.L.; Mankani, B.R.; Zemlyanov, D.Y.; Shepard, K.B.; Morgen, M.M.; Taylor, L.S. Water-Induced Phase Separation of Spray-Dried Amorphous Solid Dispersions. Mol. Pharm. 2020, 17, 4004–4017. [Google Scholar] [CrossRef]
- Robard, A.; Patterson, D.; Delmas, G. The “Δη Effect” and Polystyrene-Poly(vinyl methyl ether) Compatibility in Solution. Macromolecules 1977, 10, 706–708. [Google Scholar] [CrossRef]
- Pouchlý, J.; Patterson, D. Polymers in Mixed Solvents. Macromolecules 1976, 9, 574–579. [Google Scholar] [CrossRef]
- Surana, R.; Randall, L.; Pyne, A.; Vemuri, N.M.; Suryanarayanan, R. Determination of glass transition temperature and in situ study of the plasticizing effect of water by inverse gas chromatography. Pharm. Res. 2003, 20, 1647–1654. [Google Scholar] [CrossRef]
- Chen, H.; Pui, Y.; Liu, C.; Chen, Z.; Su, C.C.; Hageman, M.; Hussain, M.; Haskell, R.; Stefanski, K.; Foster, K.; et al. Moisture-Induced Amorphous Phase Separation of Amorphous Solid Dispersions: Molecular Mechanism, Microstructure, and Its Impact on Dissolution Performance. J. Pharm. Sci. 2018, 107, 317–326. [Google Scholar] [CrossRef] [Green Version]
- Purohit, H.S.; Taylor, L.S. Phase Behavior of Ritonavir Amorphous Solid Dispersions during Hydration and Dissolution. Pharm. Res. 2017, 34, 2842–2861. [Google Scholar] [CrossRef]
- Ueda, K.; Taylor, L.S. Polymer Type Impacts Amorphous Solubility and Drug-Rich Phase Colloidal Stability: A Mechanistic Study Using Nuclear Magnetic Resonance Spectroscopy. Mol. Pharm. 2020, 17, 1352–1362. [Google Scholar] [CrossRef]
- Mosquera-Giraldo, L.I.; Li, N.; Wilson, V.R.; Nichols, B.L.B.; Edgar, K.J.; Taylor, L.S. Influence of Polymer and Drug Loading on the Release Profile and Membrane Transport of Telaprevir. Mol. Pharm. 2018, 15, 1700–1713. [Google Scholar] [CrossRef]
- Rangel-Yagui, C.O.; Pessoa, J.A.; Tavares, L.C. Micellar solubilization of drugs. J. Pharm. Pharm. Sci. 2005, 8, 147–165. [Google Scholar]
- Vinarov, Z.; Katev, V.; Radeva, D.; Tcholakova, S.; Denkov, N.D. Micellar solubilization of poorly water-soluble drugs: Effect of surfactant and solubilizate molecular structure. Drug Dev. Ind. Pharm. 2018, 44, 677–686. [Google Scholar] [CrossRef]
- Miller-Chou, B.A.; Koenig, J.L. A review of polymer dissolution. Prog. Polym. Sci. 2003, 28, 1223–1270. [Google Scholar] [CrossRef] [Green Version]
- Craig, D.Q. The mechanisms of drug release from solid dispersions in water-soluble polymers. Int. J. Pharm. 2002, 231, 131–144. [Google Scholar] [CrossRef]
- Wu, J. Solvent Diffusion and Dissolution of Glassy Polymers. Ph.D. Thesis, Purdue University, West Lafayette, IN, USA, 1992. [Google Scholar]


| Method | CMC (µg/mL) | |
|---|---|---|
| Buffer | Buffer + PVPVA | |
| By fluorescence | ≈50 | ≈40 |
| By solubility measurement | 49 ± 4 | 41 ± 3 |
| Material | Glass Transition Temperature (°C) |
|---|---|
| Felodipine | 44.7 ± 1.8 |
| 30% DL ASDs | |
| 0% TPGS | 89.2 ± 1.7 |
| 2% TPGS | 86.0 ± 0.5 |
| 5% TPGS | 80.8 ± 0.8 |
| 10% TPGS | 71.1 ± 0.8 |
| PVPVA | 105.4 ± 1.9 |
Publisher’s Note: MDPI stays neutral with regard to jurisdictional claims in published maps and institutional affiliations. |
© 2021 by the authors. Licensee MDPI, Basel, Switzerland. This article is an open access article distributed under the terms and conditions of the Creative Commons Attribution (CC BY) license (https://creativecommons.org/licenses/by/4.0/).
Share and Cite
Saboo, S.; Bapat, P.; Moseson, D.E.; Kestur, U.S.; Taylor, L.S. Exploring the Role of Surfactants in Enhancing Drug Release from Amorphous Solid Dispersions at Higher Drug Loadings. Pharmaceutics 2021, 13, 735. https://doi.org/10.3390/pharmaceutics13050735
Saboo S, Bapat P, Moseson DE, Kestur US, Taylor LS. Exploring the Role of Surfactants in Enhancing Drug Release from Amorphous Solid Dispersions at Higher Drug Loadings. Pharmaceutics. 2021; 13(5):735. https://doi.org/10.3390/pharmaceutics13050735
Chicago/Turabian StyleSaboo, Sugandha, Pradnya Bapat, Dana E. Moseson, Umesh S. Kestur, and Lynne S. Taylor. 2021. "Exploring the Role of Surfactants in Enhancing Drug Release from Amorphous Solid Dispersions at Higher Drug Loadings" Pharmaceutics 13, no. 5: 735. https://doi.org/10.3390/pharmaceutics13050735