
Image Analysis: A Versatile Tool in the Manufacturing and Quality Control of Pharmaceutical Dosage Forms


Abstract
:
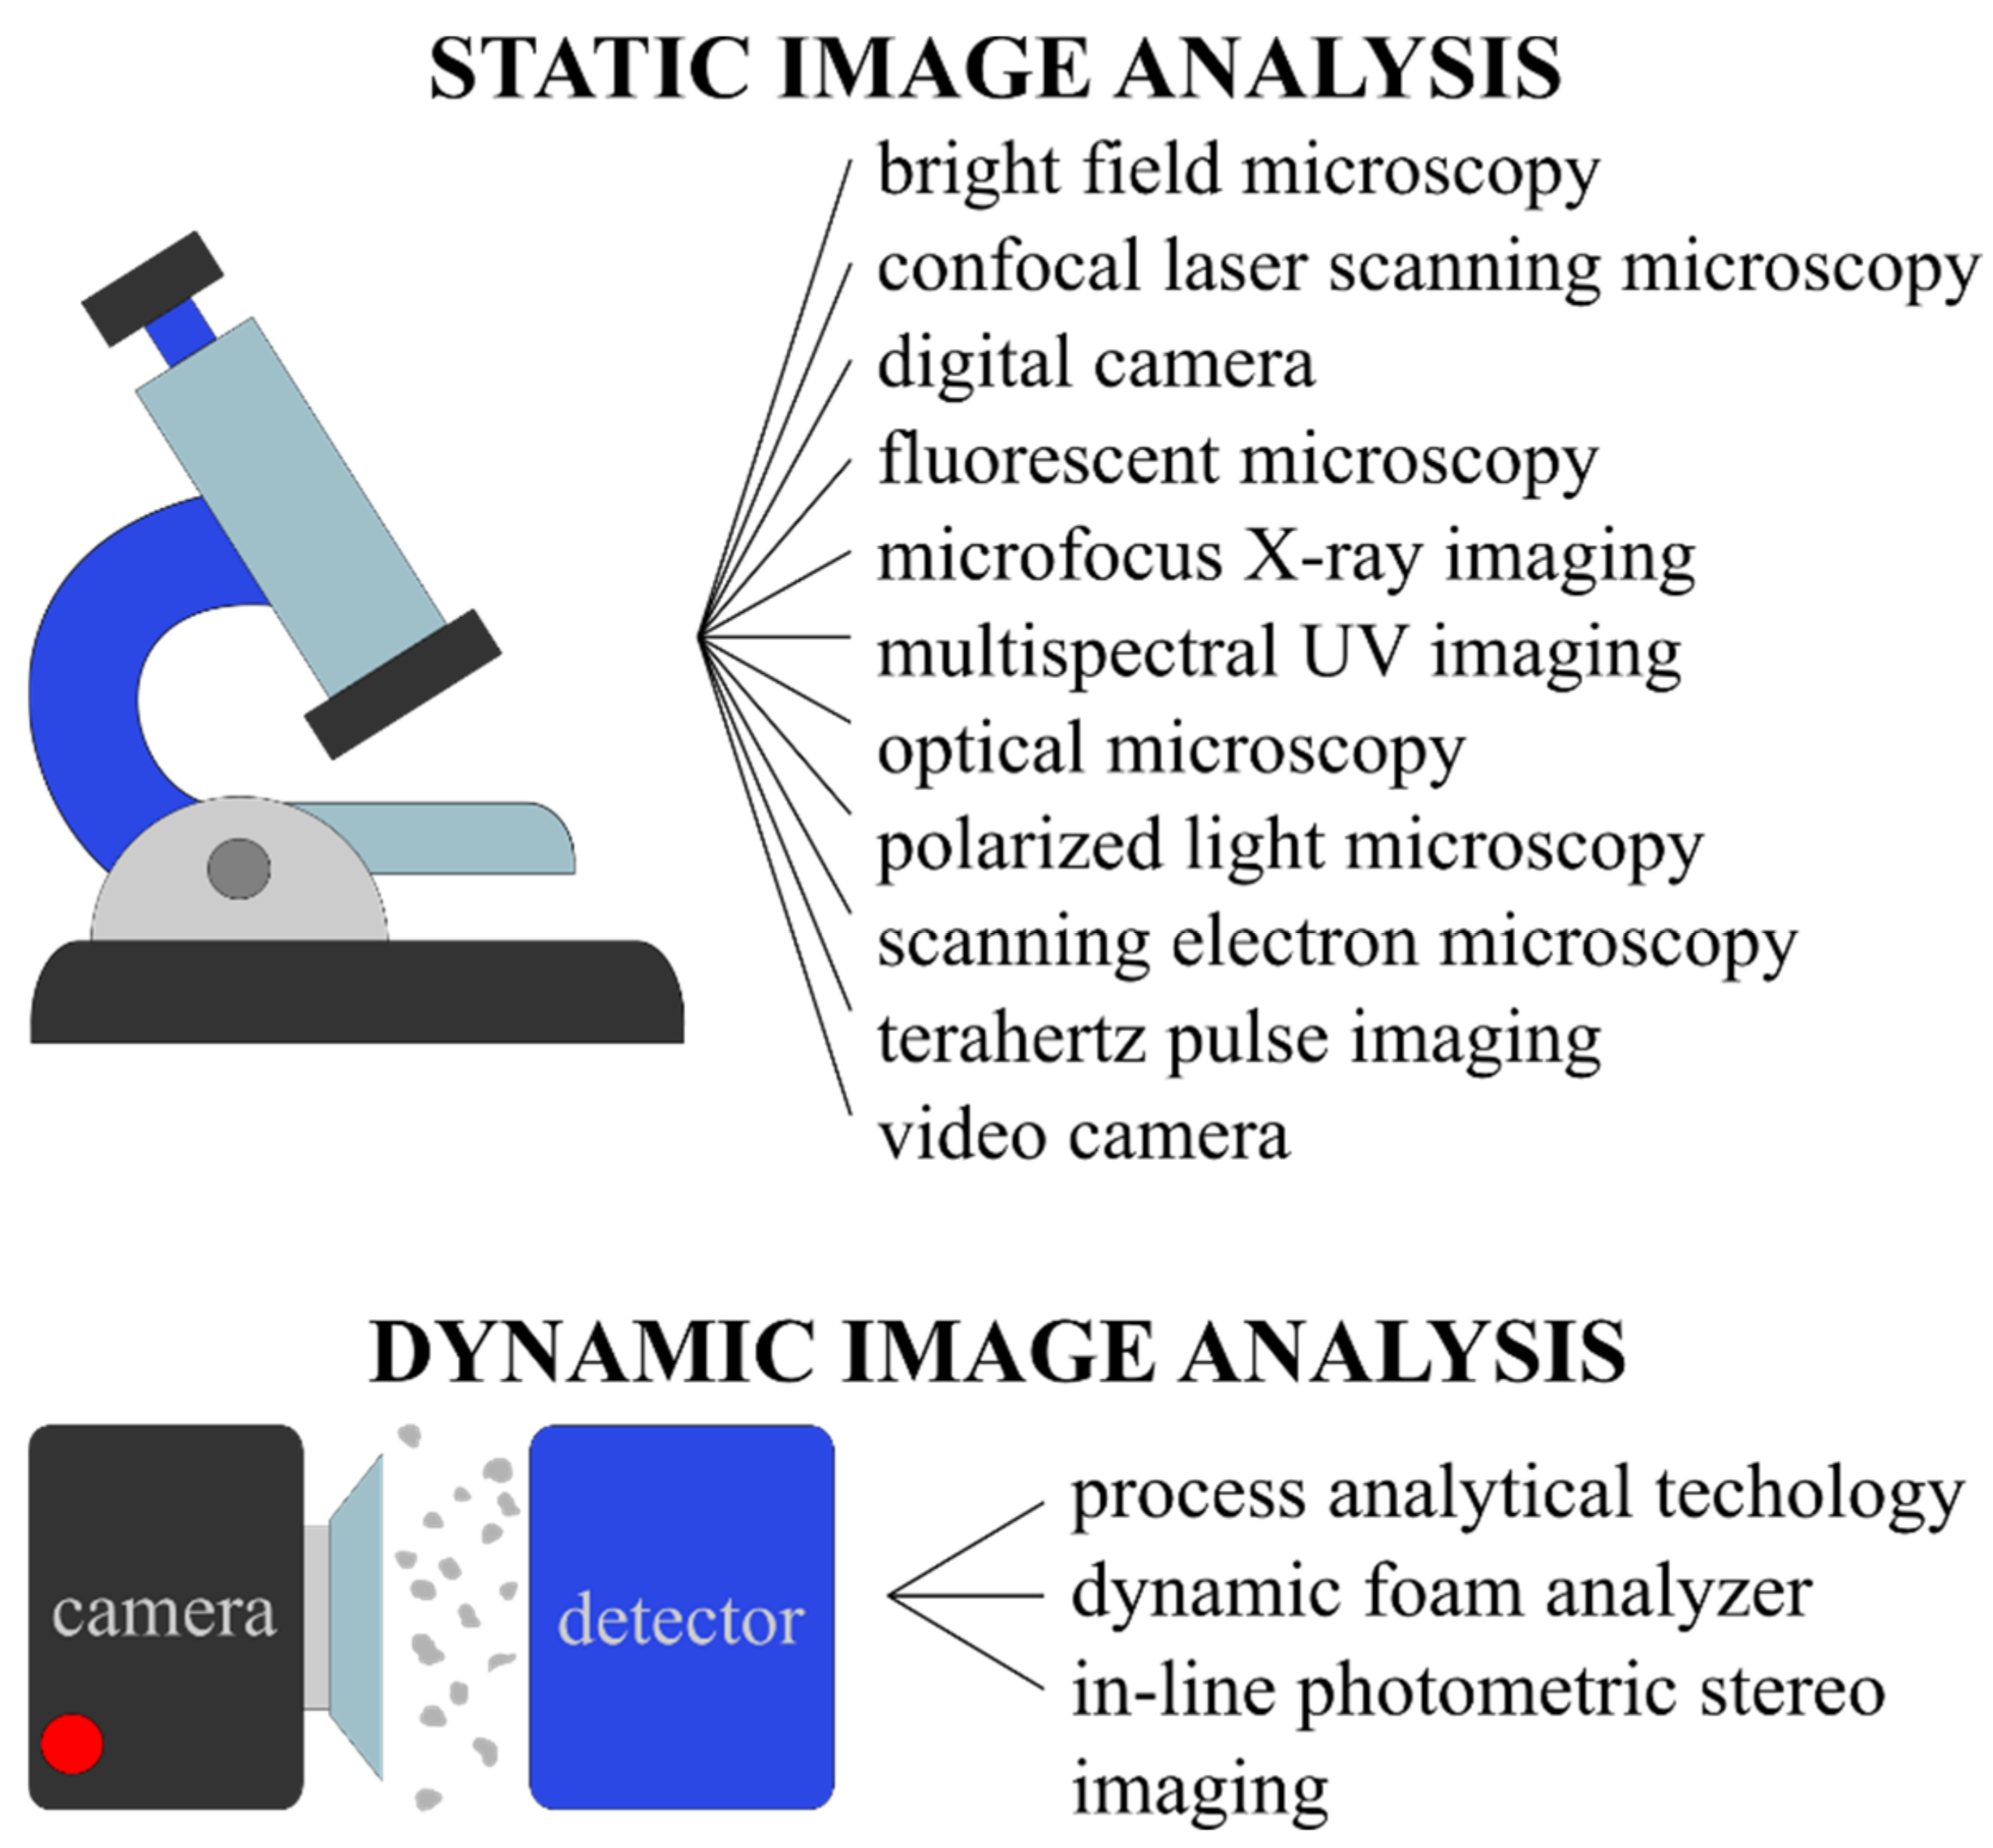
1. Introduction—Image Analysis (IA) for Pharmaceutical Purposes
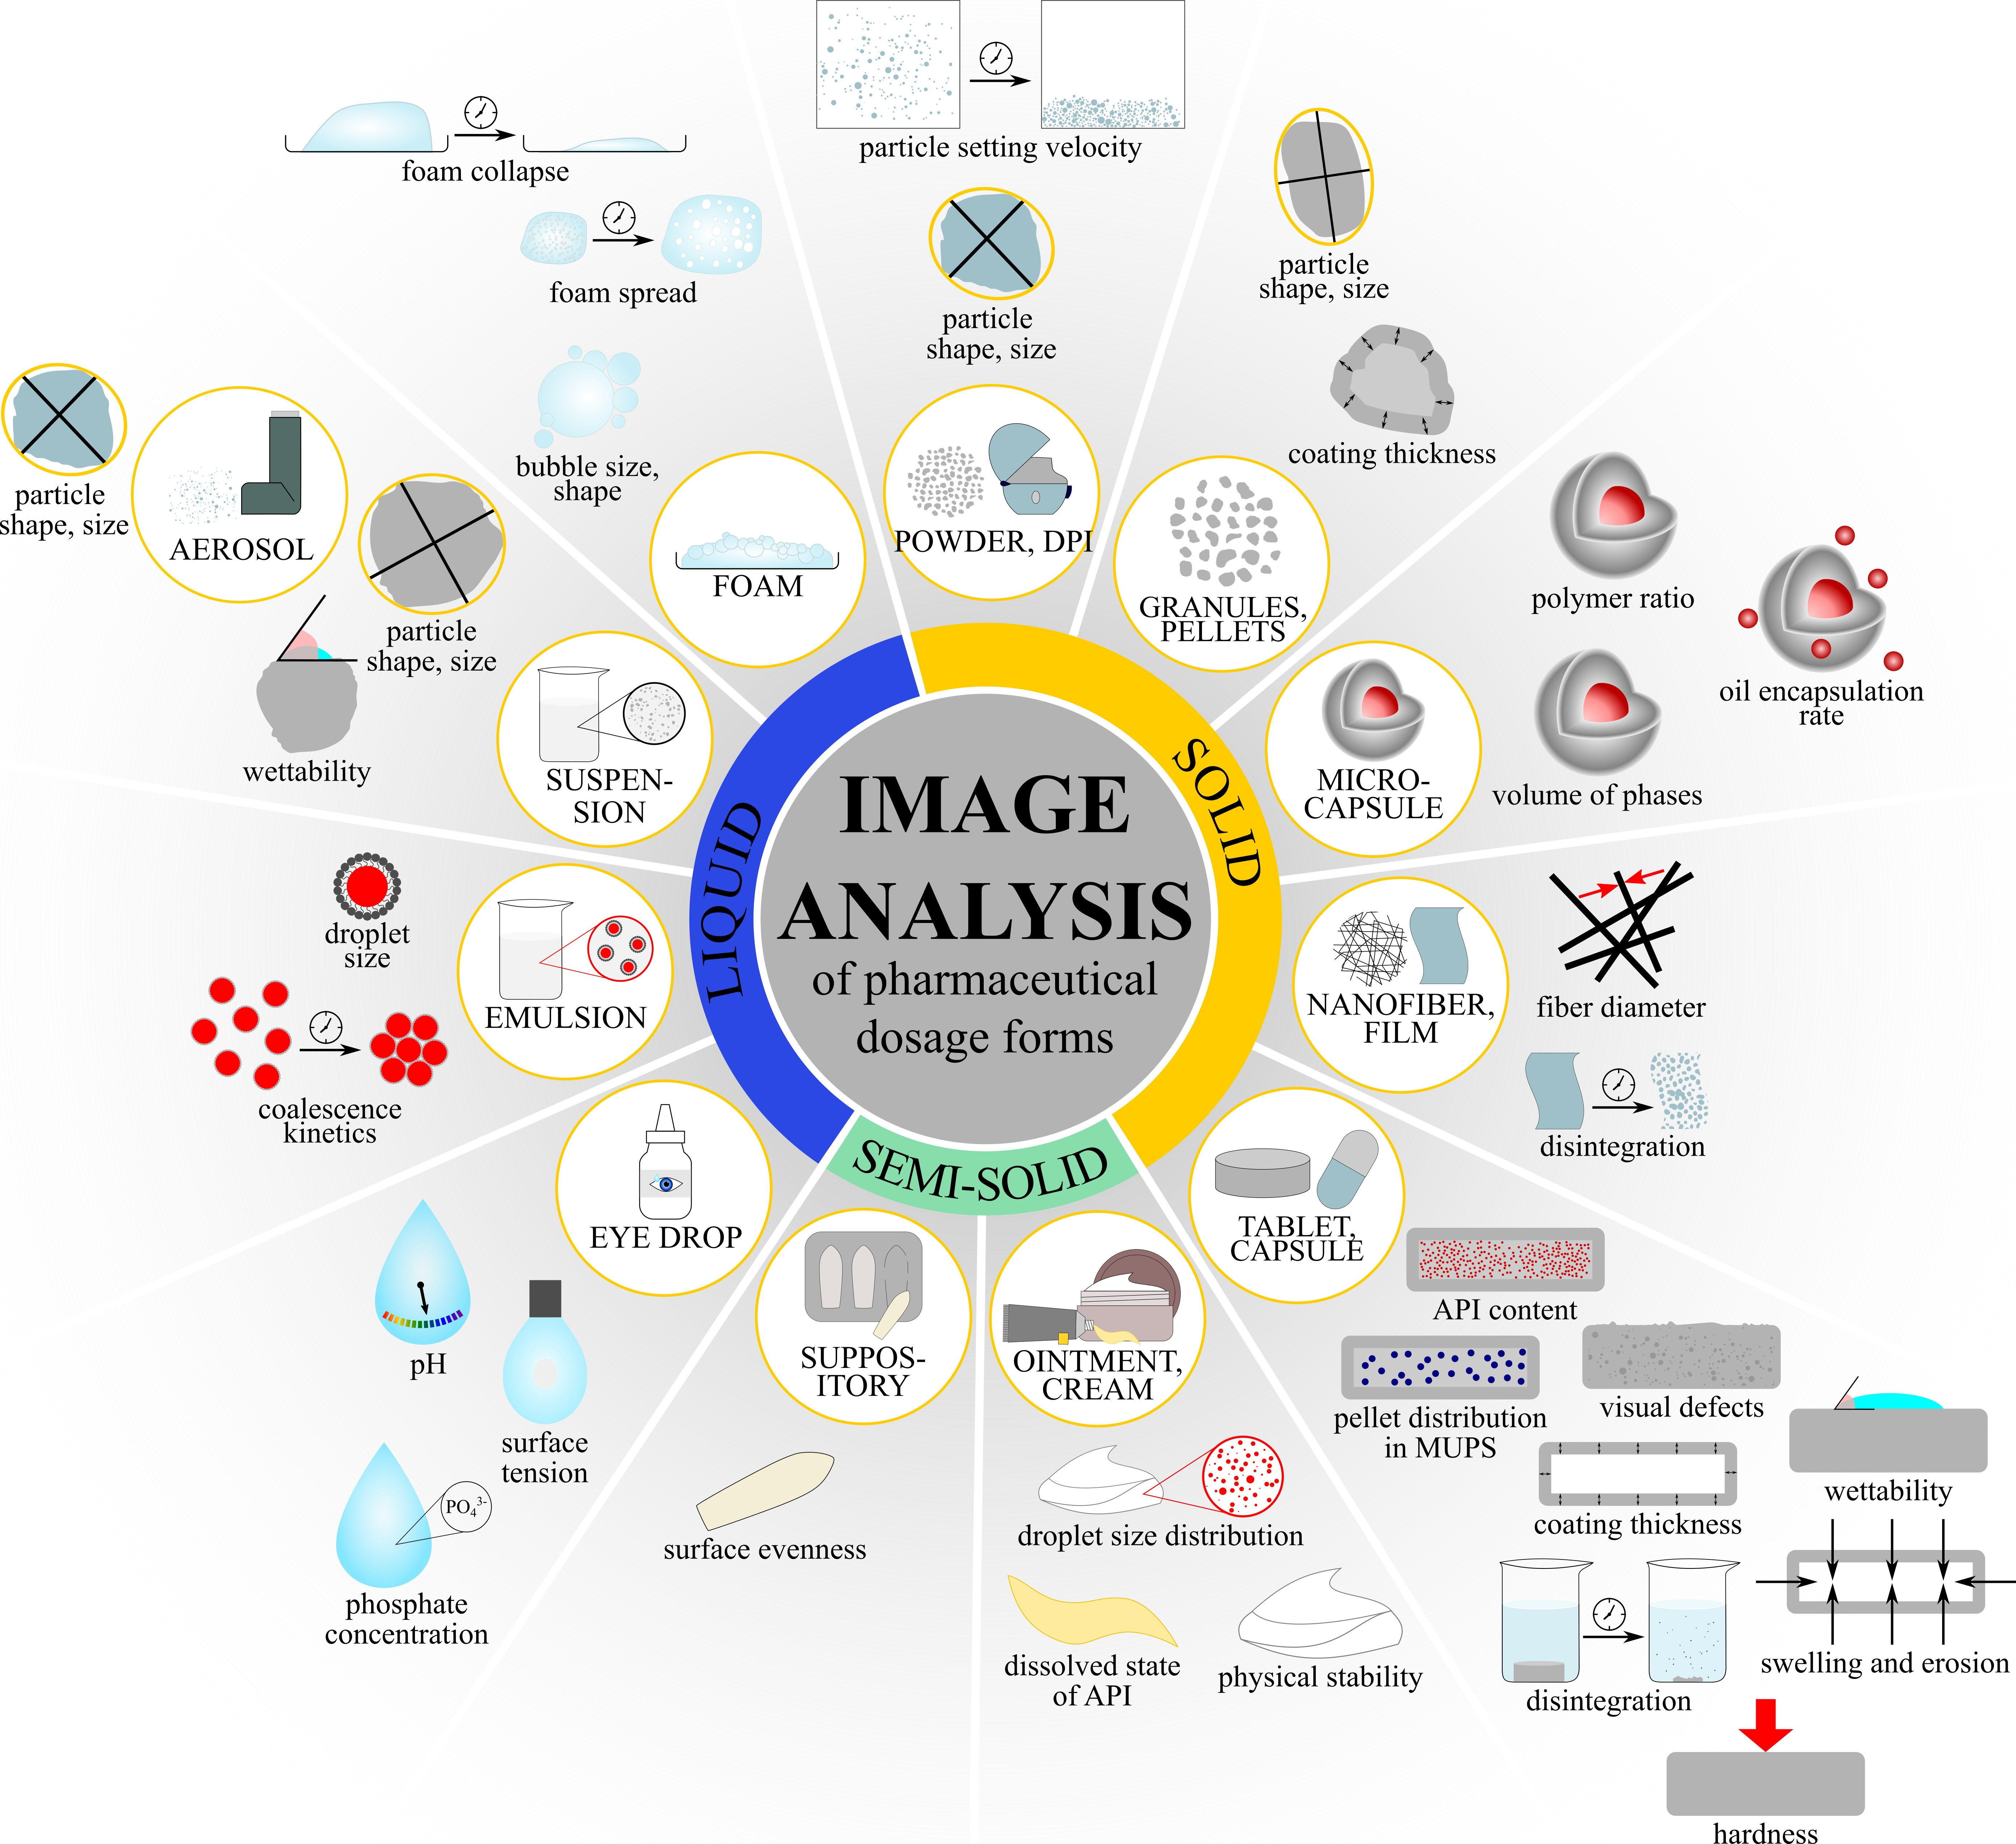
2. Image Analysis of Pharmaceutical Dosage Forms
2.1. Solid Dosage Forms
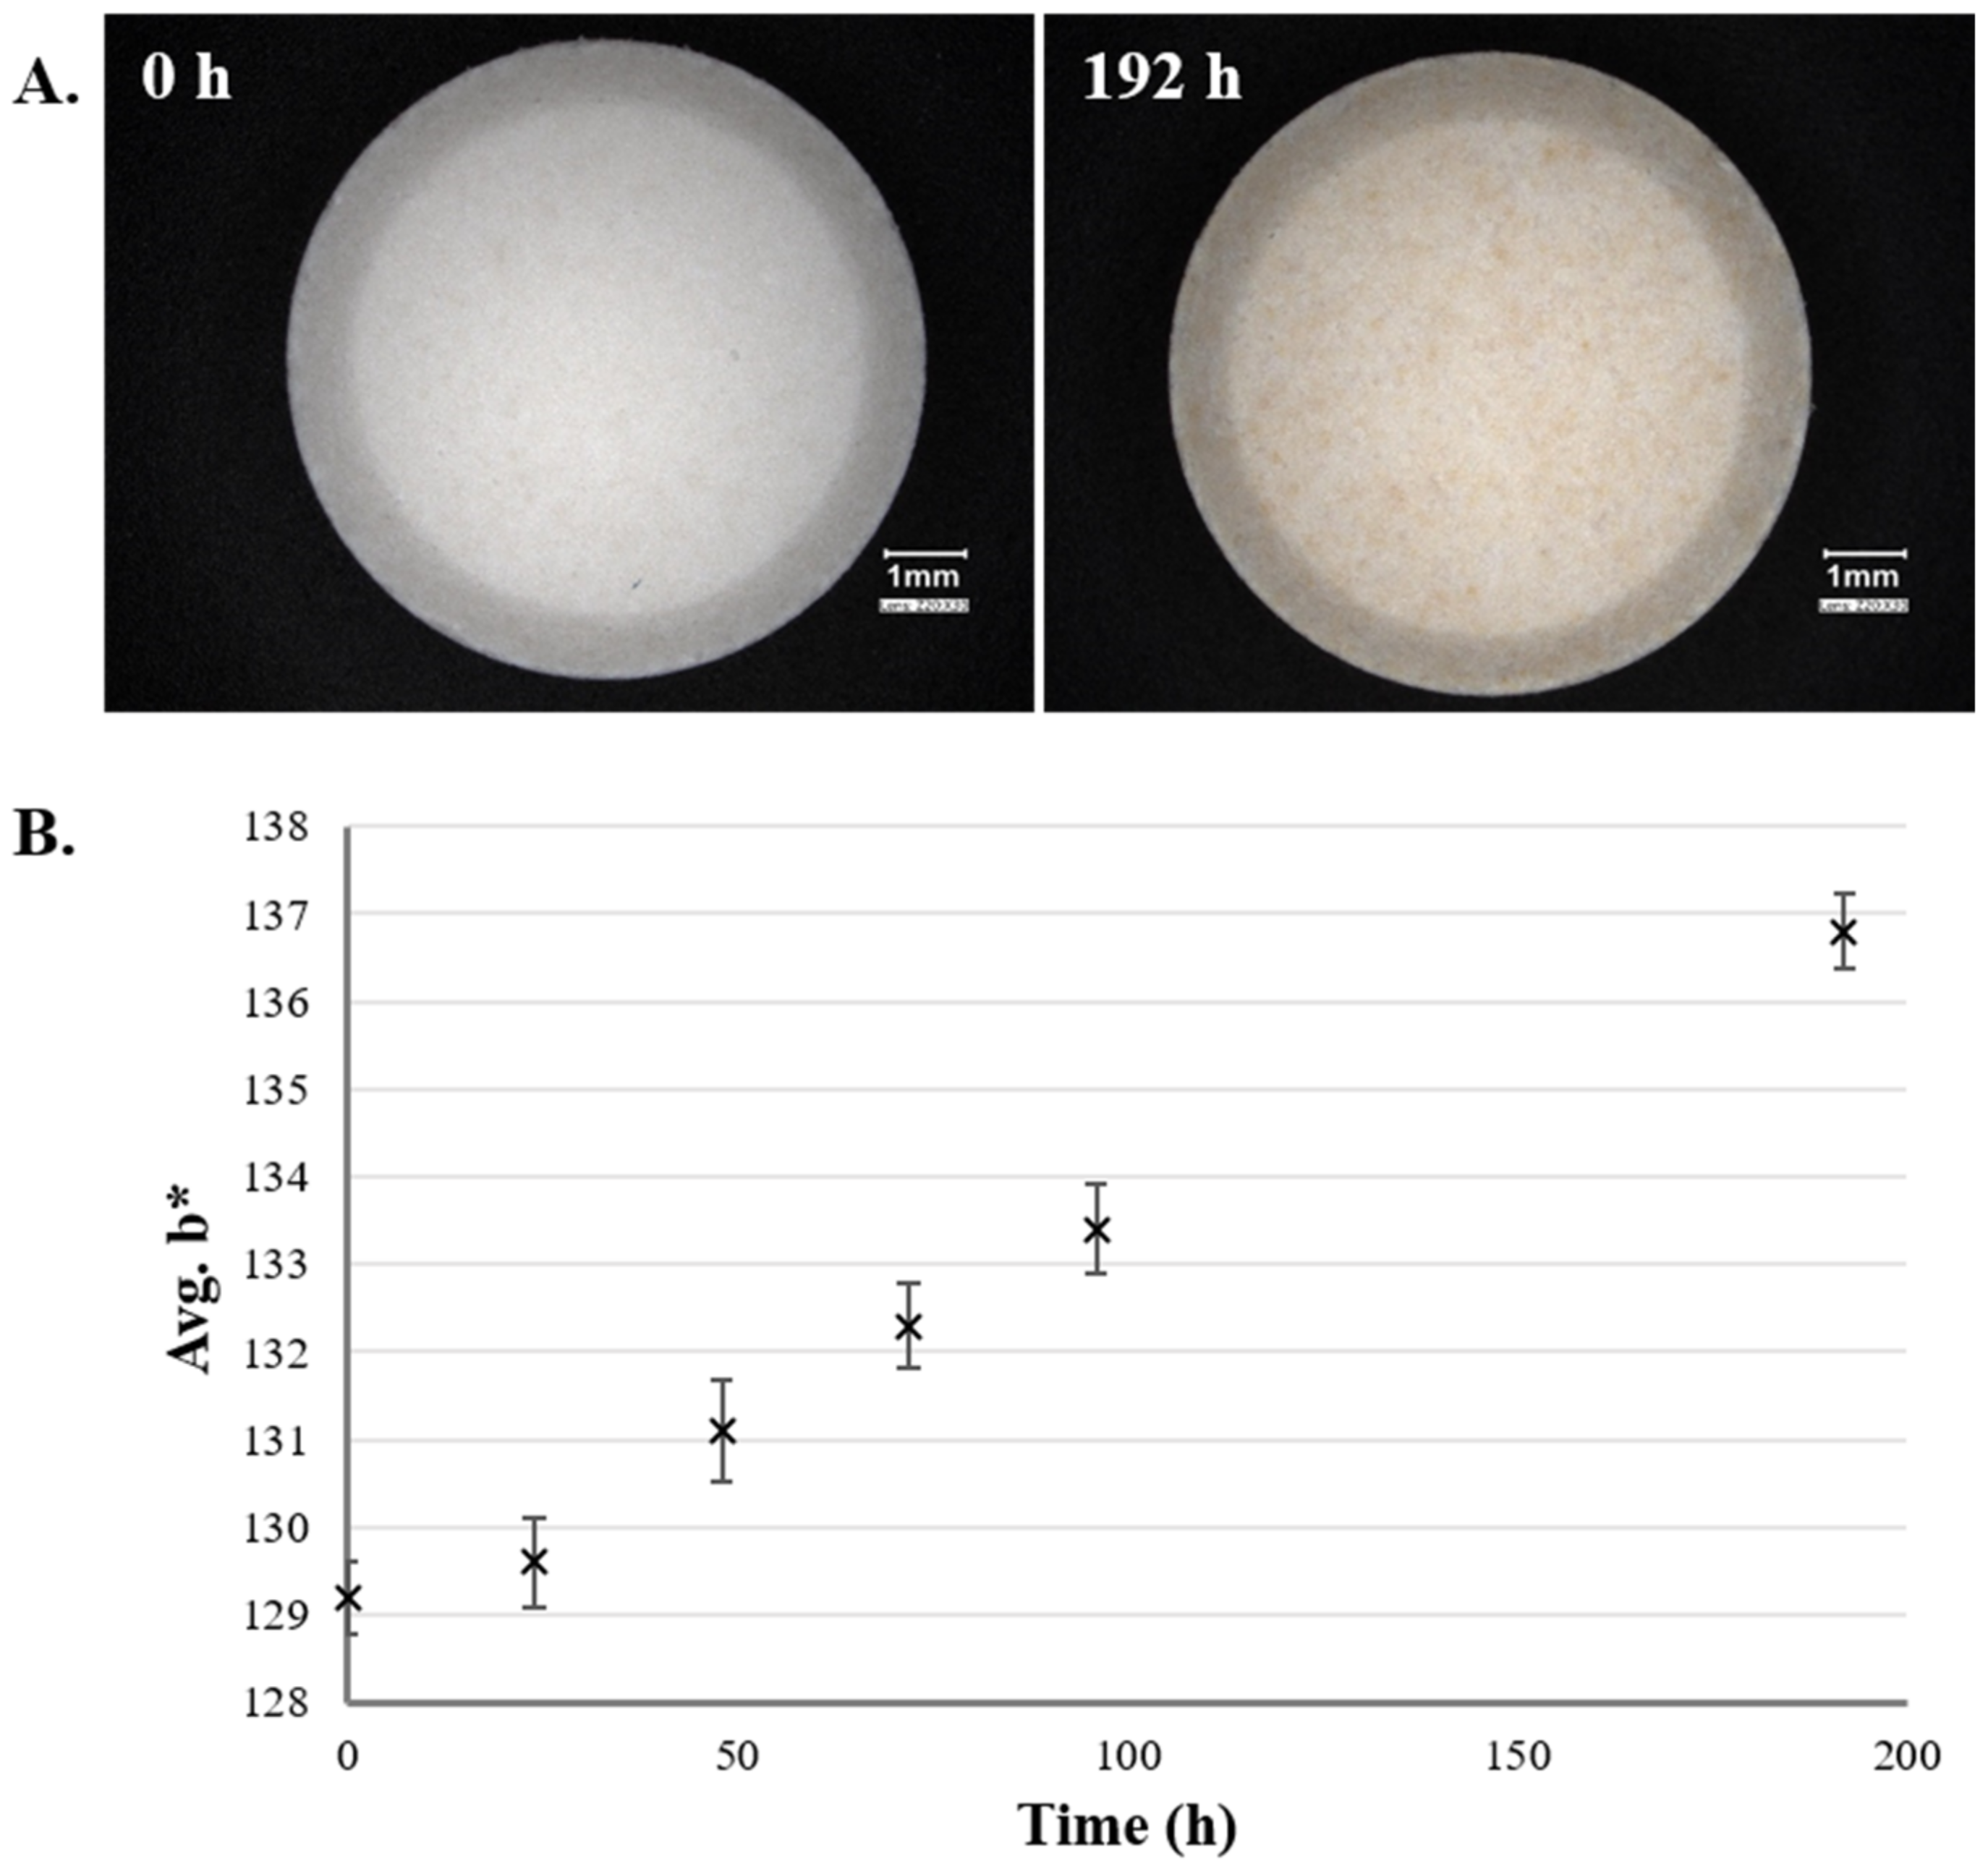
2.1.1. Powders
2.1.2. Dry Powder Inhalers
2.1.3. Granules
2.1.4. Pellets
2.1.5. Solid Microcapsules, Microspheres
2.1.6. Solid Self-Emulsifying Drug Delivery Systems (SEDDS)
2.1.7. Nanofibers
2.1.8. Films
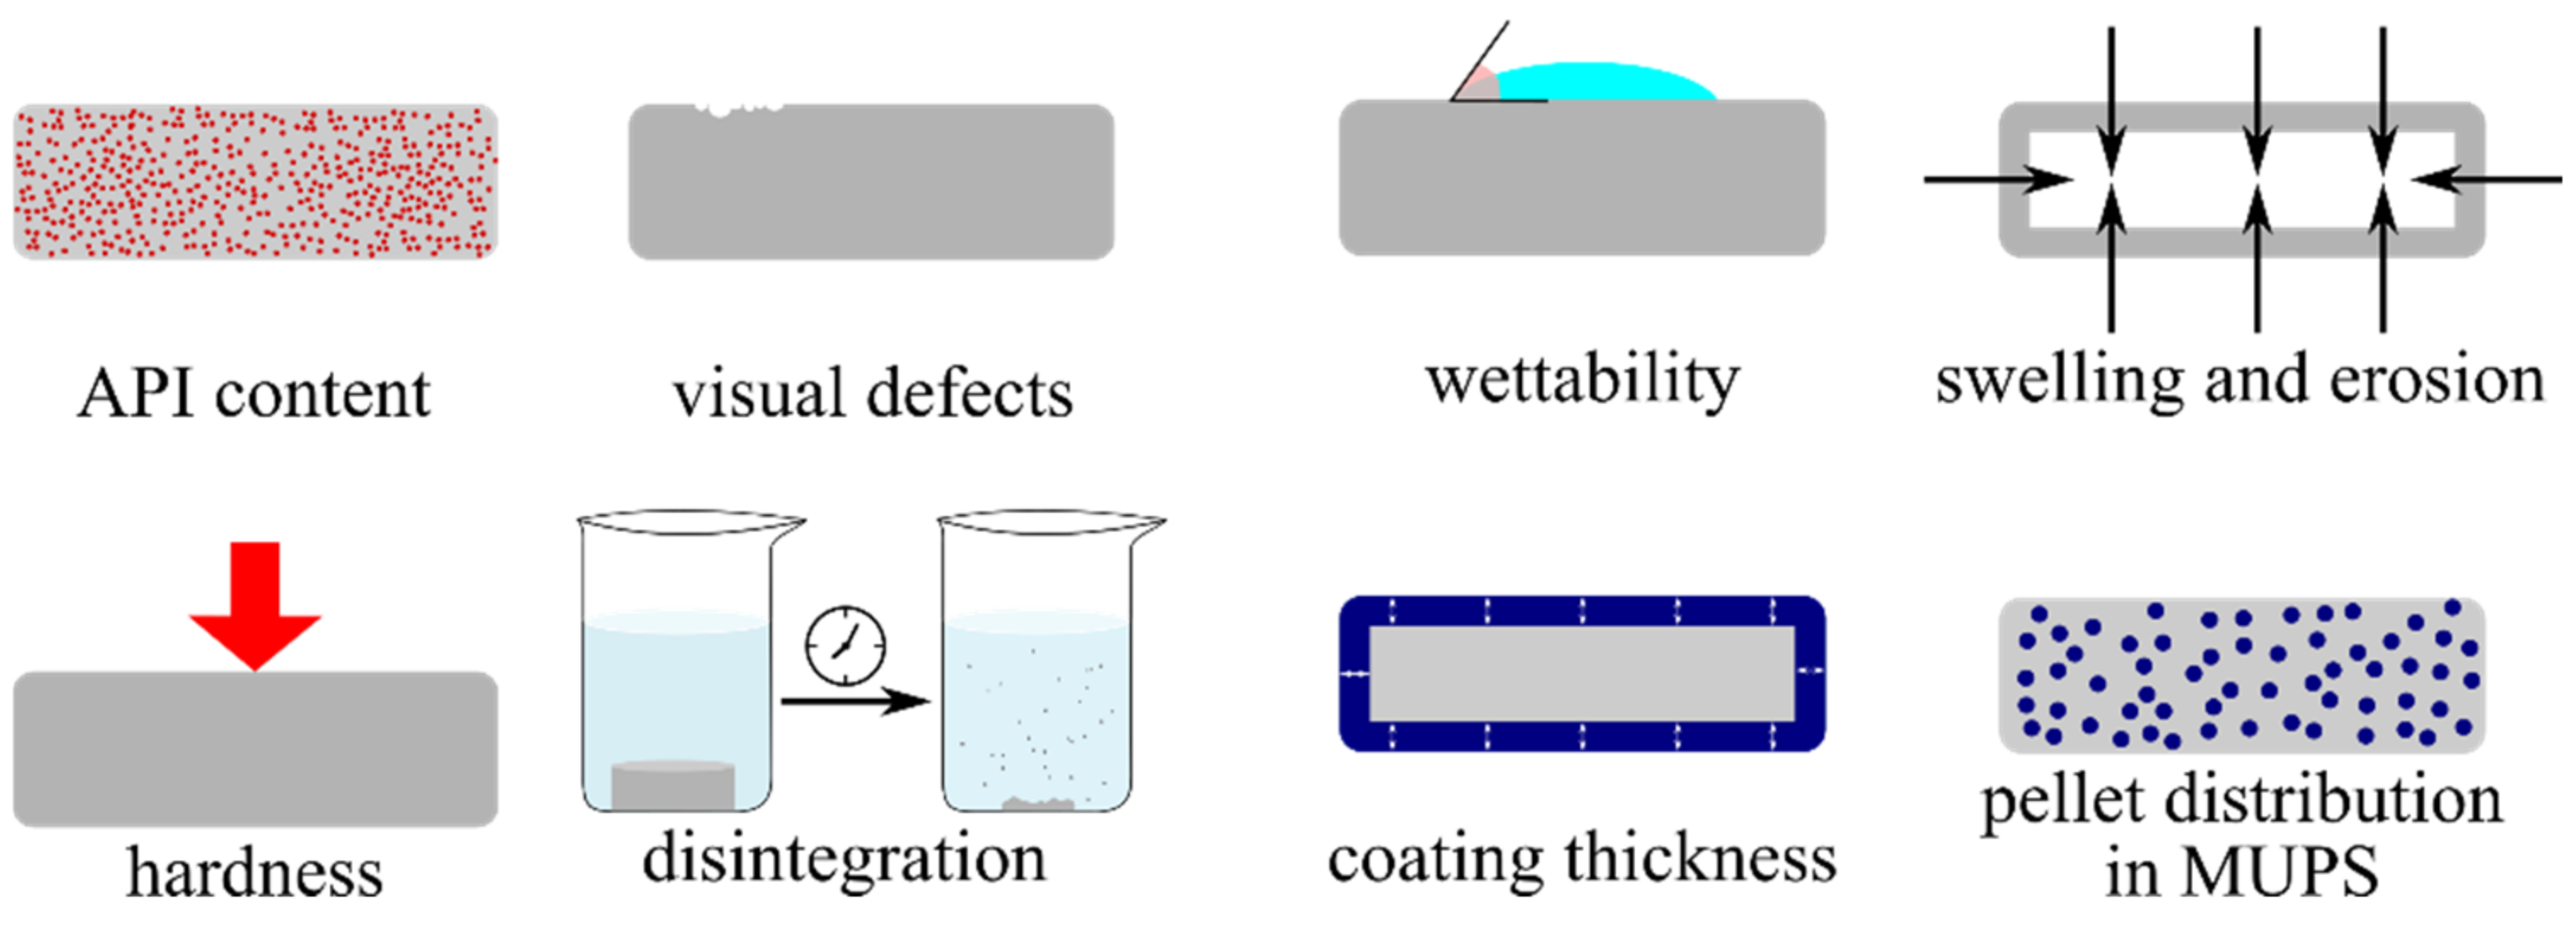
2.1.9. Tablets and Capsules

| Dosage Form | Aim of Measurement | Image Acquisition Method | Software | Reference(s) |
|---|---|---|---|---|
| Powder (Micronized Bulk) | Particle Size | Optical Microscopy, SEM | Olympus Cue-2 Morphometry Software | [31] |
| Powder (Non-Spherical Particles) | Morphology | Optical Microscopy | N/A | [32] |
| Powder | Morphology, Morphometry | Digital Camera, Optical Microscopy | N/A | [33] |
| Powder | Homogeneity | Digital Camera | ImageJ; N/A | [34,35] |
| Powder for Inhalation (DPI) | Aerodynamic Particle Size | Digital Camera | Matlab | [41,42] |
| Granulates | Morphology, Morphometry | Qicpic Dynamic IA System | Qicpic Dynamic IA System | [45] |
| Wet and Dry Dispersion | Size Distribution, Particle Brittleness, Tendency to Agglomerate | Optical Microscopy | Imagepro | [100] |
| Pellet | Form Factors | Optical Microscopy; Digital Camera | Pcimage VGA 24, Imagepro Plus, Sigmascan Pro Image Analysis; Seescan Sonata, ImageJ | [14,20,29,82] |
| Pellet | Size, Shape | Stereomicroscope | Quantimet 500 | [101] |
| Pellet | Particle Size Distribution | Retsch Camsizer Particle Size Analyzer | Retsch Camsizer Particle Size Analyzer | [50] |
| Pellet | Form Factors | Optical Microscopy | PC Image, Sigmascan Pro Image Analysis | [52] |
| Pellet | Coating Thickness | N/A | Morphologi™ G2 Image Analysis System | [55] |
| Pellet | At-Line Monitoring of Coating | Digital Camera | Matlab, Image Processing Toolbox | [56] |
| Pellet | In-Line Monitoring of Coating | Digital Camera | N/A | [57] |
| Pellet | Coating Thickness | CLSM | ImageJ | [58] |
| Pellet | Coating Thickness | Digital Camera | Adobe Photoshop, Image Pro Plus | [21] |
| Pellet | Coating Thickness | Fluorescent Microscopy; CLSM + Optical Microscopy | Matlab Image Processing Toolbox | [59,60] |
| Pellet | Coating Uniformity | Office Scanner | In-House Program | [102] |
| Pellet | Porosity, Pore Size Distribution | CLSM + Optical Microscopy | Matlab Image Processing Toolbox | [60] |
| Pellet (Coated) | Swelling | Optical Microscopy | Image Pro Plus | [61] |
| Microparticles | Encapsulation Rate, Polymer Ratio in the Wall | Confocal Laser Scanning Microscopy | Scion Image | [63,64] |
| Self-Emulsifying Pellet | Pellet Shape (Feret Diameter) | Optical Microscopy | Image C | [68] |
| Solid Self-Emulsifying Particles | Particle Size | Scanning Electron Microscopy | Imageinside | [69] |
| Nanofibers | Fiber Diameter | Scanning Electron Microscopy | ImageJ, N/A | [72,73,74,75] |
| Films | Volume Reduction of the Film Matrix Over Time | Video Camera | Matlab | [77] |
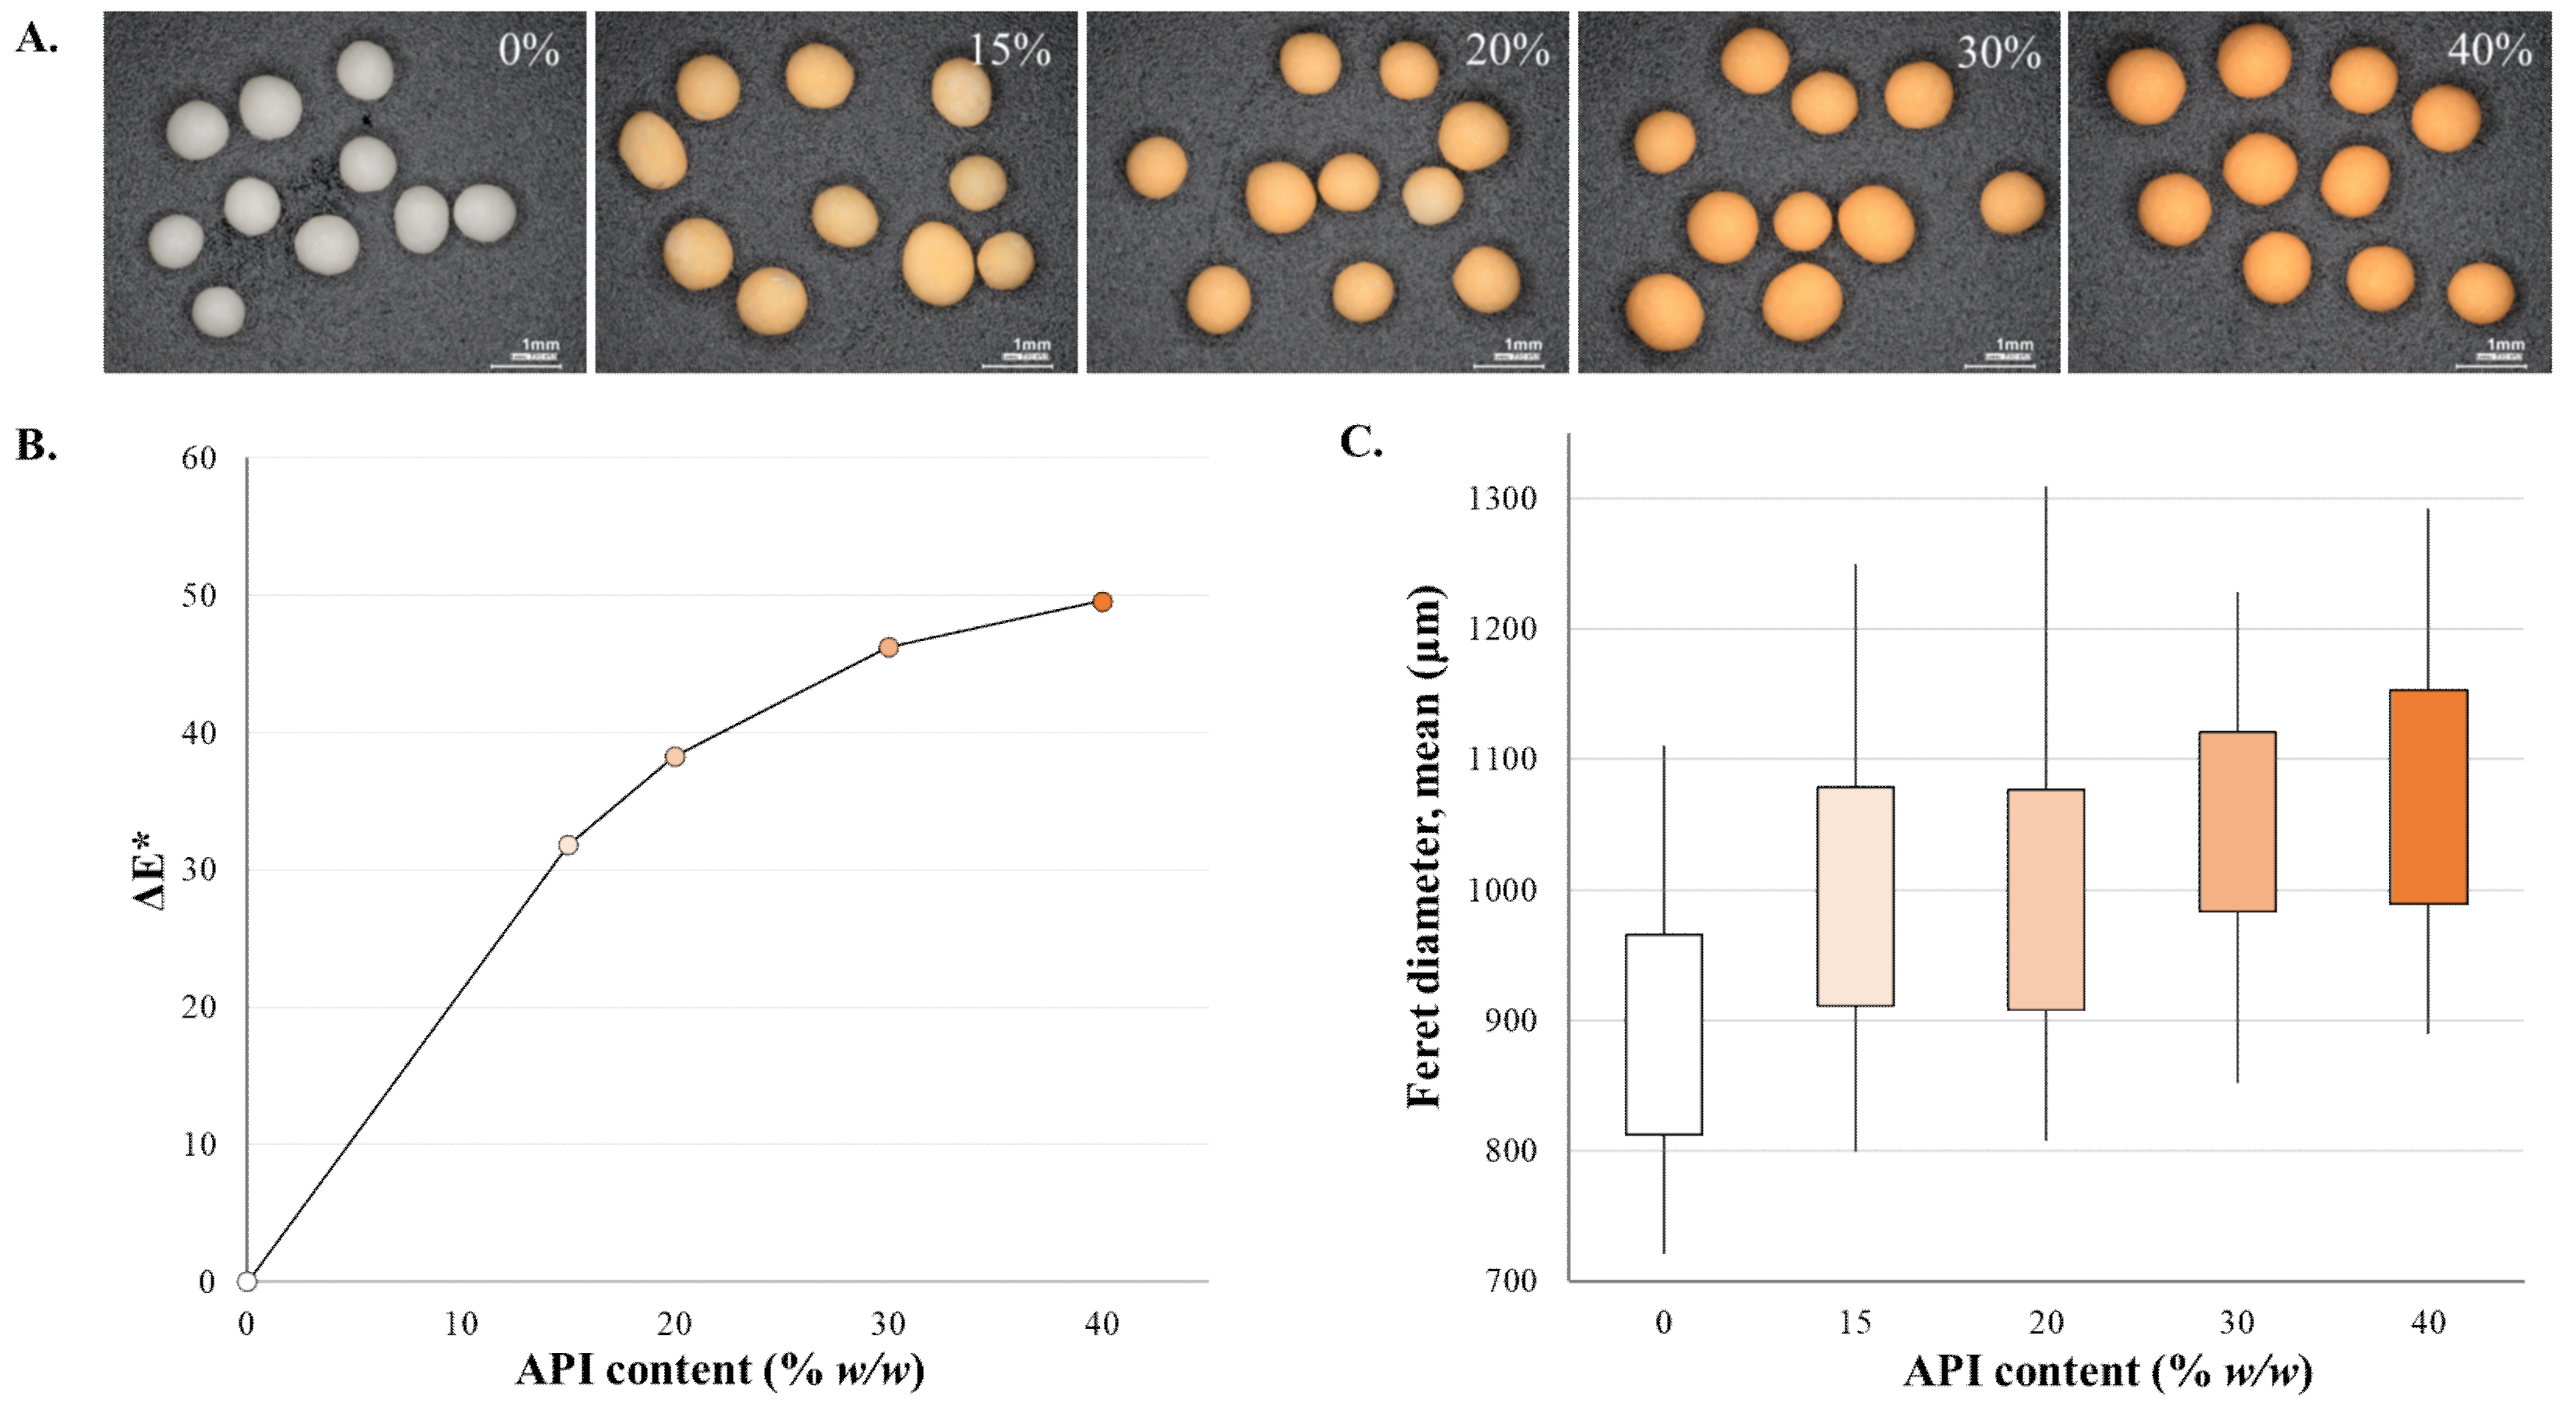
| Tablet | API Content | Digital Camera | Sorbfil TLC | [78] |
| Tablet | (Colored) API Content | Digital Camera | Machine Vision (Matlab) | [17] |
| Tablet | Defects | Digital Camera | Visilog 6.8 | [80] |
| Tablet | Wetting Properties | Digital Camera | ImageJ | [82] |
| Tablet | Swelling Kinetics | Video Camera | Ultimage™/X | [83] |
| Tablet | Swelling and Erosion (Water Mass Fraction) | Video Camera, Digital Camera | Mathcad© | [84] |
| Tablet | Swelling | USB-Microscope | ImageJ | [103] |
| Tablet | Hardness | TPI | N/A | [85] |
| Tablet | Hardness | Digital Camera | Machine Vision (Matlab) | [17] |
| Tablet | Disintegration | Digital Camera | ImageJ | [18] |
| Tablet | Coating Thickness | Near-Infrared Mapping Microscope | Matlab | [86] |
| Tablet | Coating Thickness | Optical Coherence Tomography | N/A | [87] |
| MUPS Tablet | Pellet Distribution at the Surfaces | Reprocamera | Image Pals 2 GO | [88,89] |
| MUPS Tablet | Tablet–Pellet Interface | UV Imaging | Matlab, PLS_Toolbox, Image Processing Toolbox | [90] |
| MUPS Tablet | Pellet Distribution | TPI, Multispectral UV Imaging; Microfocus X-ray Imaging | Mathlab; N/A | [20,91] |
| Capsule | Broken Coated Pellets | Micro-XRT | Matlab | [92] |
| Tablet | Visual Tablet Inspection | N/A | Borland C++ Builder | [96] |
| Tablet | Coating Quality | Office Scanner | Artificial Intelligence | [97] |
| 3D-Printed Tablet | Droplet Size | Drop Watcher of Fujifilm Dimatix Materials Printer DMP-2850 Series | ImageJ | [99] |
| 3D Printlets | Difference Characterization | Raspberry Pi Camera | Custom-Developed Software | [104] |
| Biopolymer Coating | Wettability, Contact Angle | Digital Camera | SCA20 | [105] |
2.2. Semisolid Formulations
2.2.1. Ointments and Creams
2.2.2. Suppositories
| Dosage Form | Aim of Measurement | Image Acquisition Method | Software | Reference(s) |
|---|---|---|---|---|
| (Ophthalmic) Ointment | API Particles in the Ointment | Polarized Light Microscopy | ImageJ | [106] |
| Cream (O/W) | Droplet Size of the Dispersed Phase | Optical Microscopy | Casti Studio Imaging | [107,108] |
| Cream (O/W) | Droplet Size of the Dispersed Phase | Polarized Light Microscopy | Malvern Morphologi G3 | [109] |
| Rectal Suppository | Surface Evenness | Visual Inspection | - | [110] |
| Microparticle-Loaded Suppository | Microparticle Size | Digital Microscope | Motic Images 2000 | [111] |
2.3. Liquid Formulations
2.3.1. Solutions (Eye Drop)
2.3.2. Emulsions
2.3.3. Suspensions
2.3.4. Aerosols
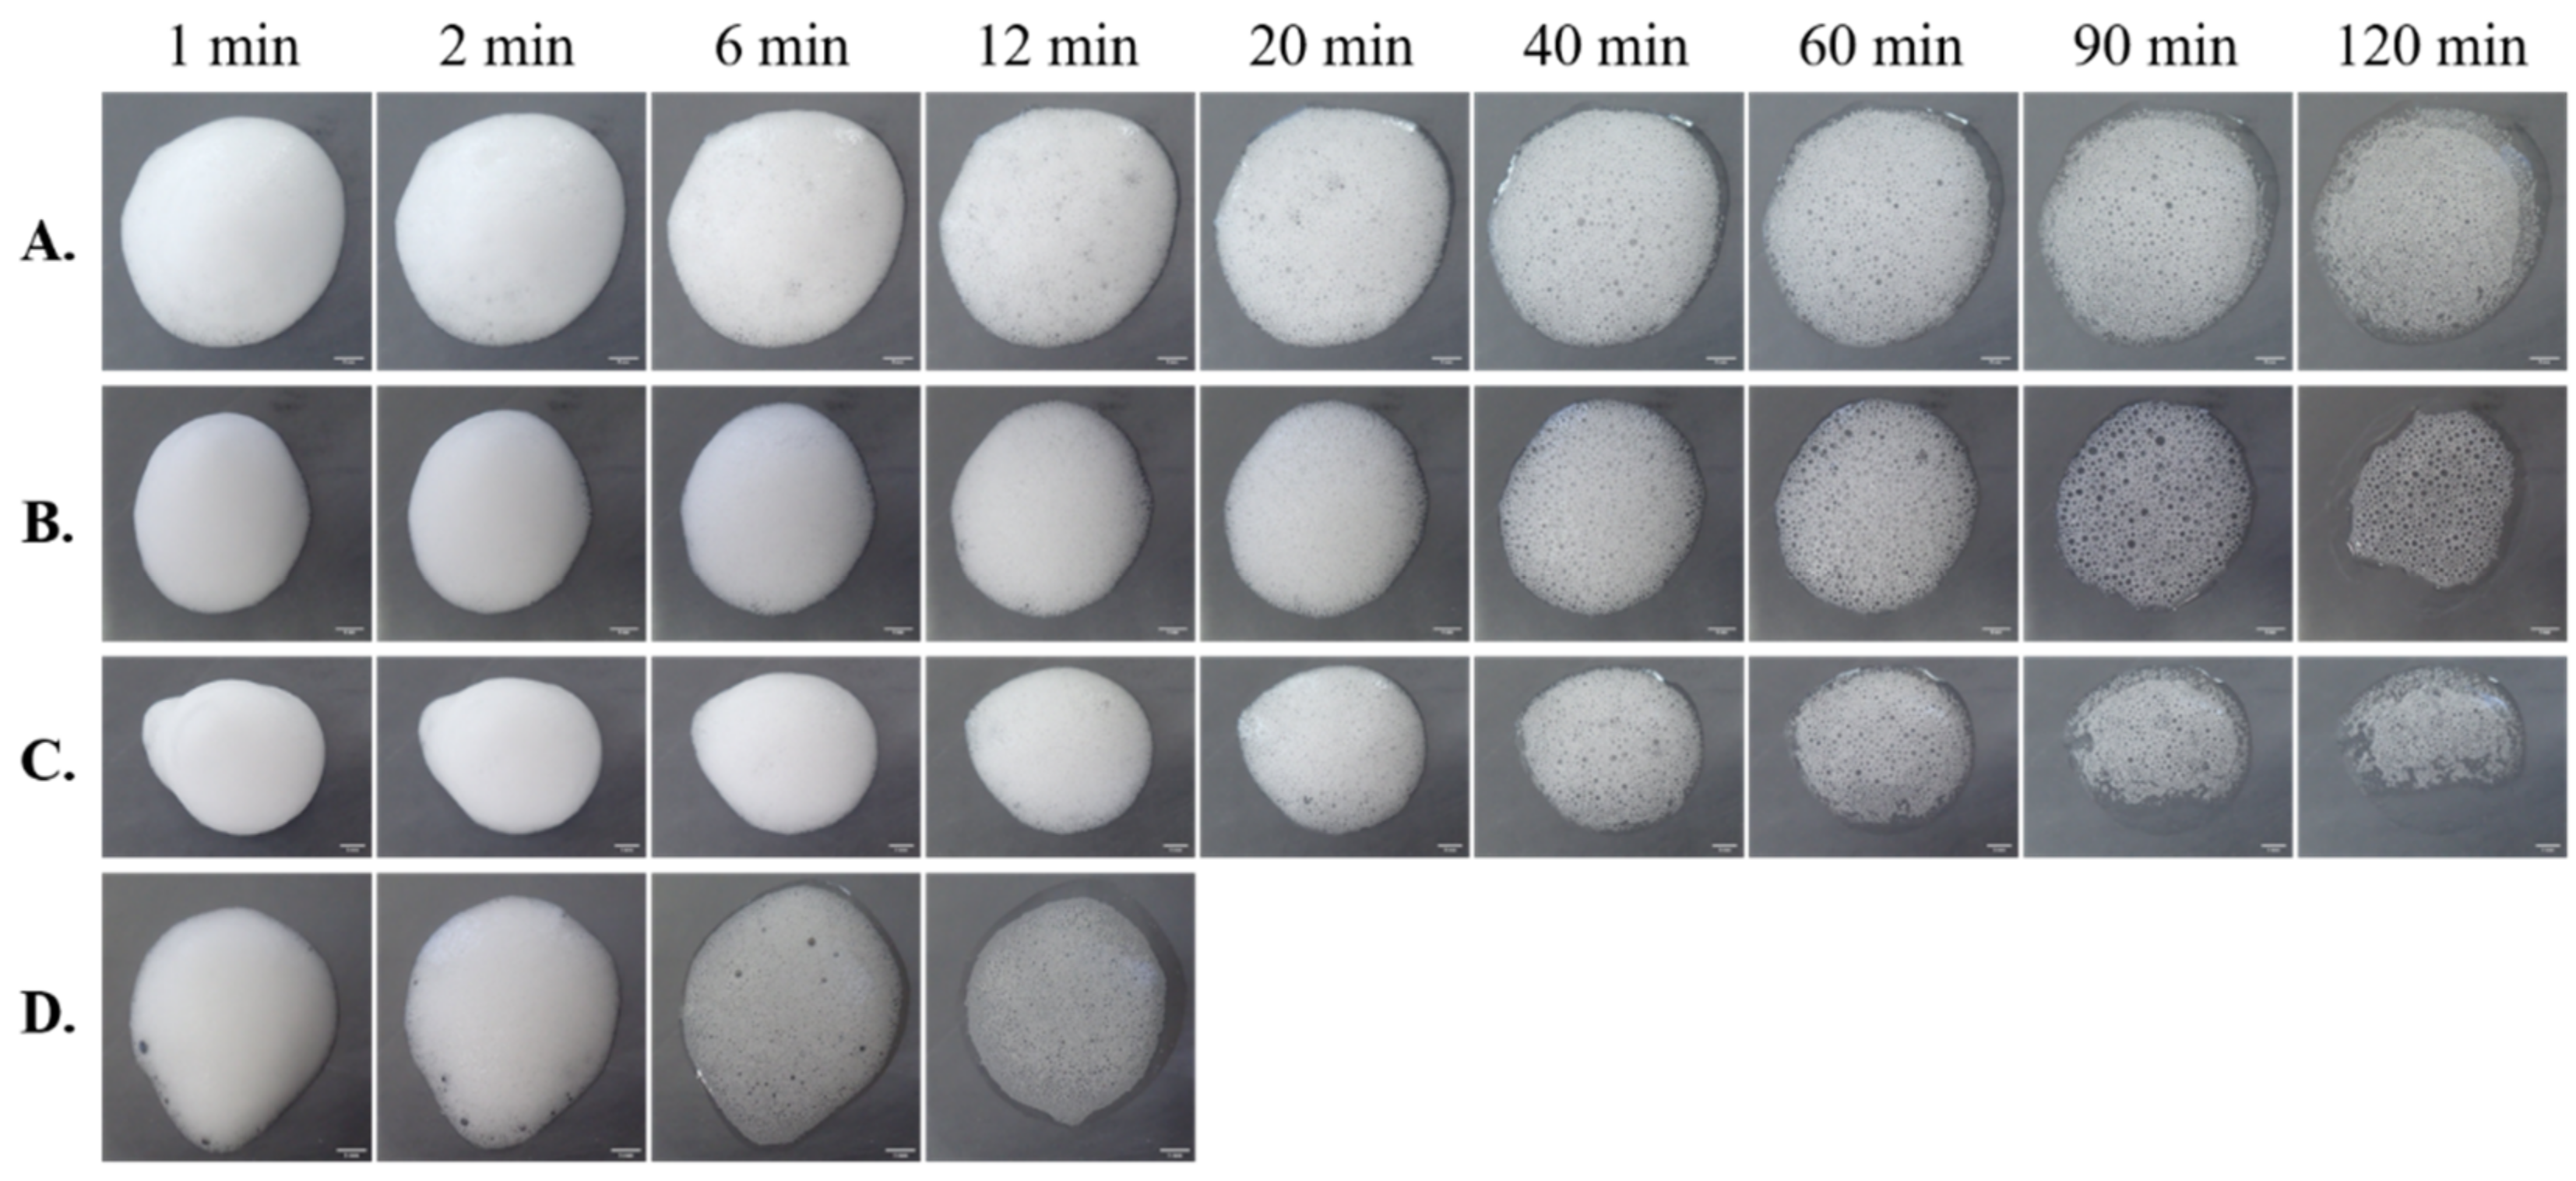
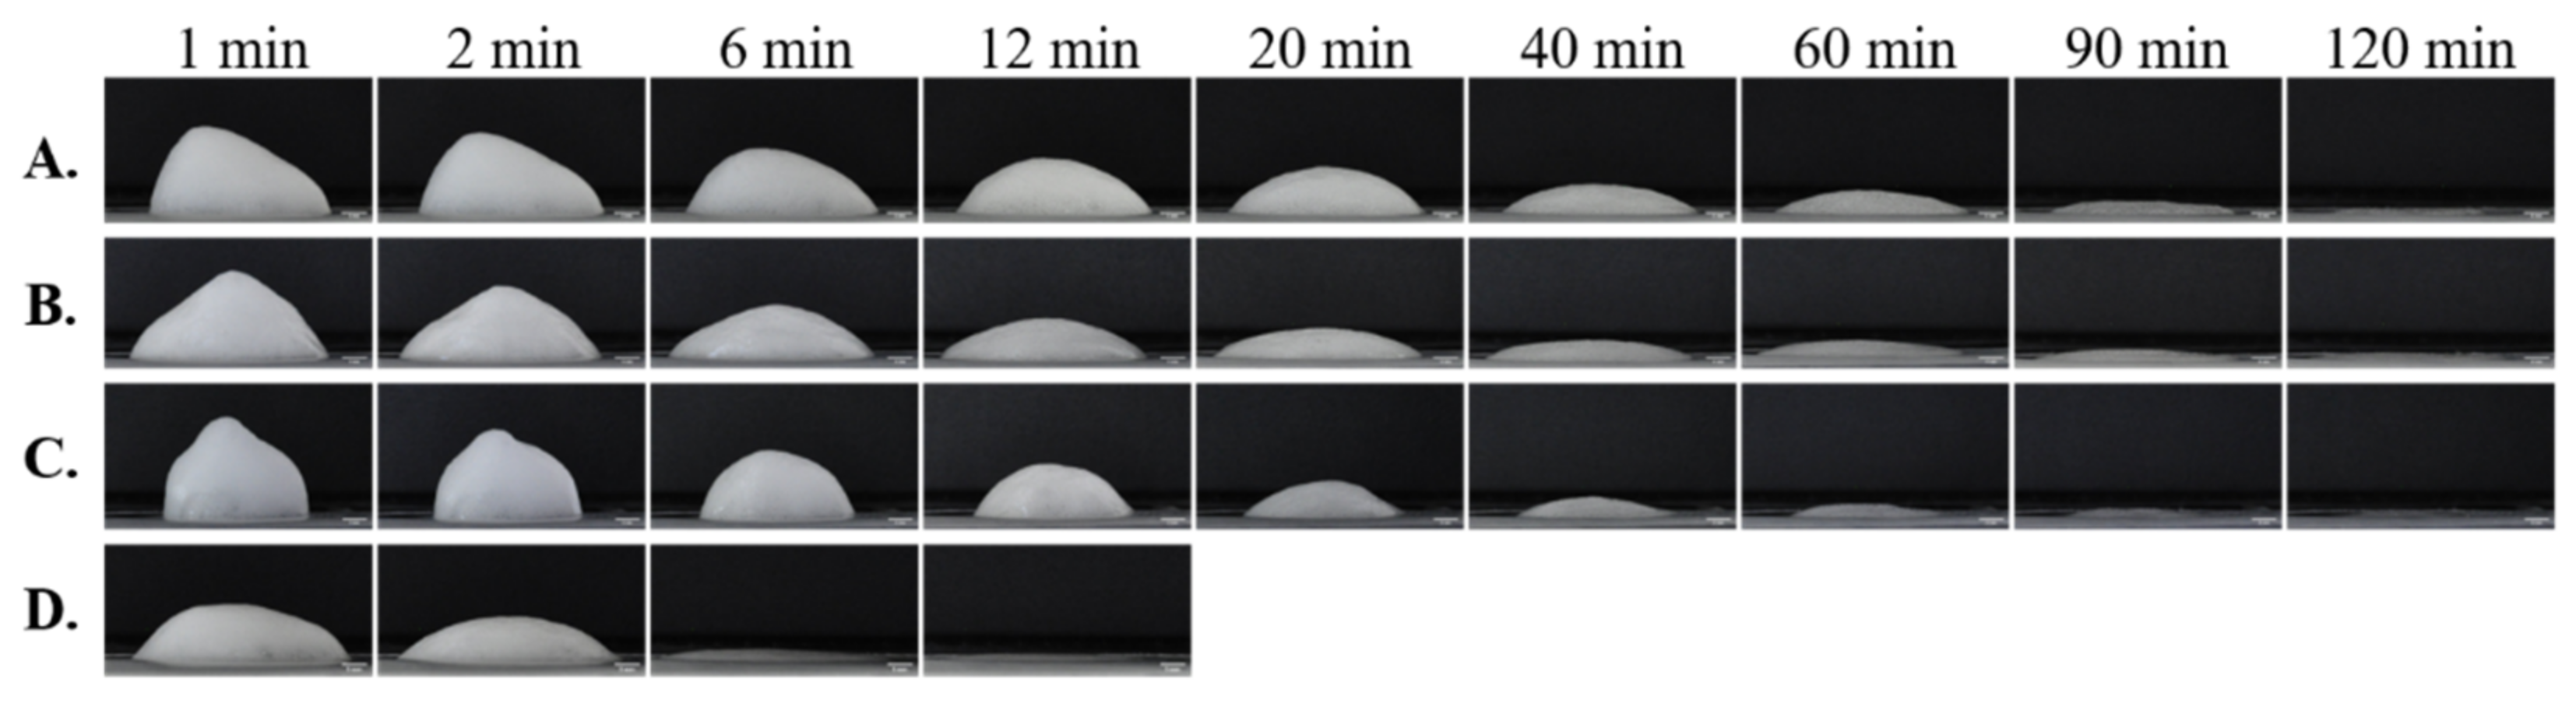
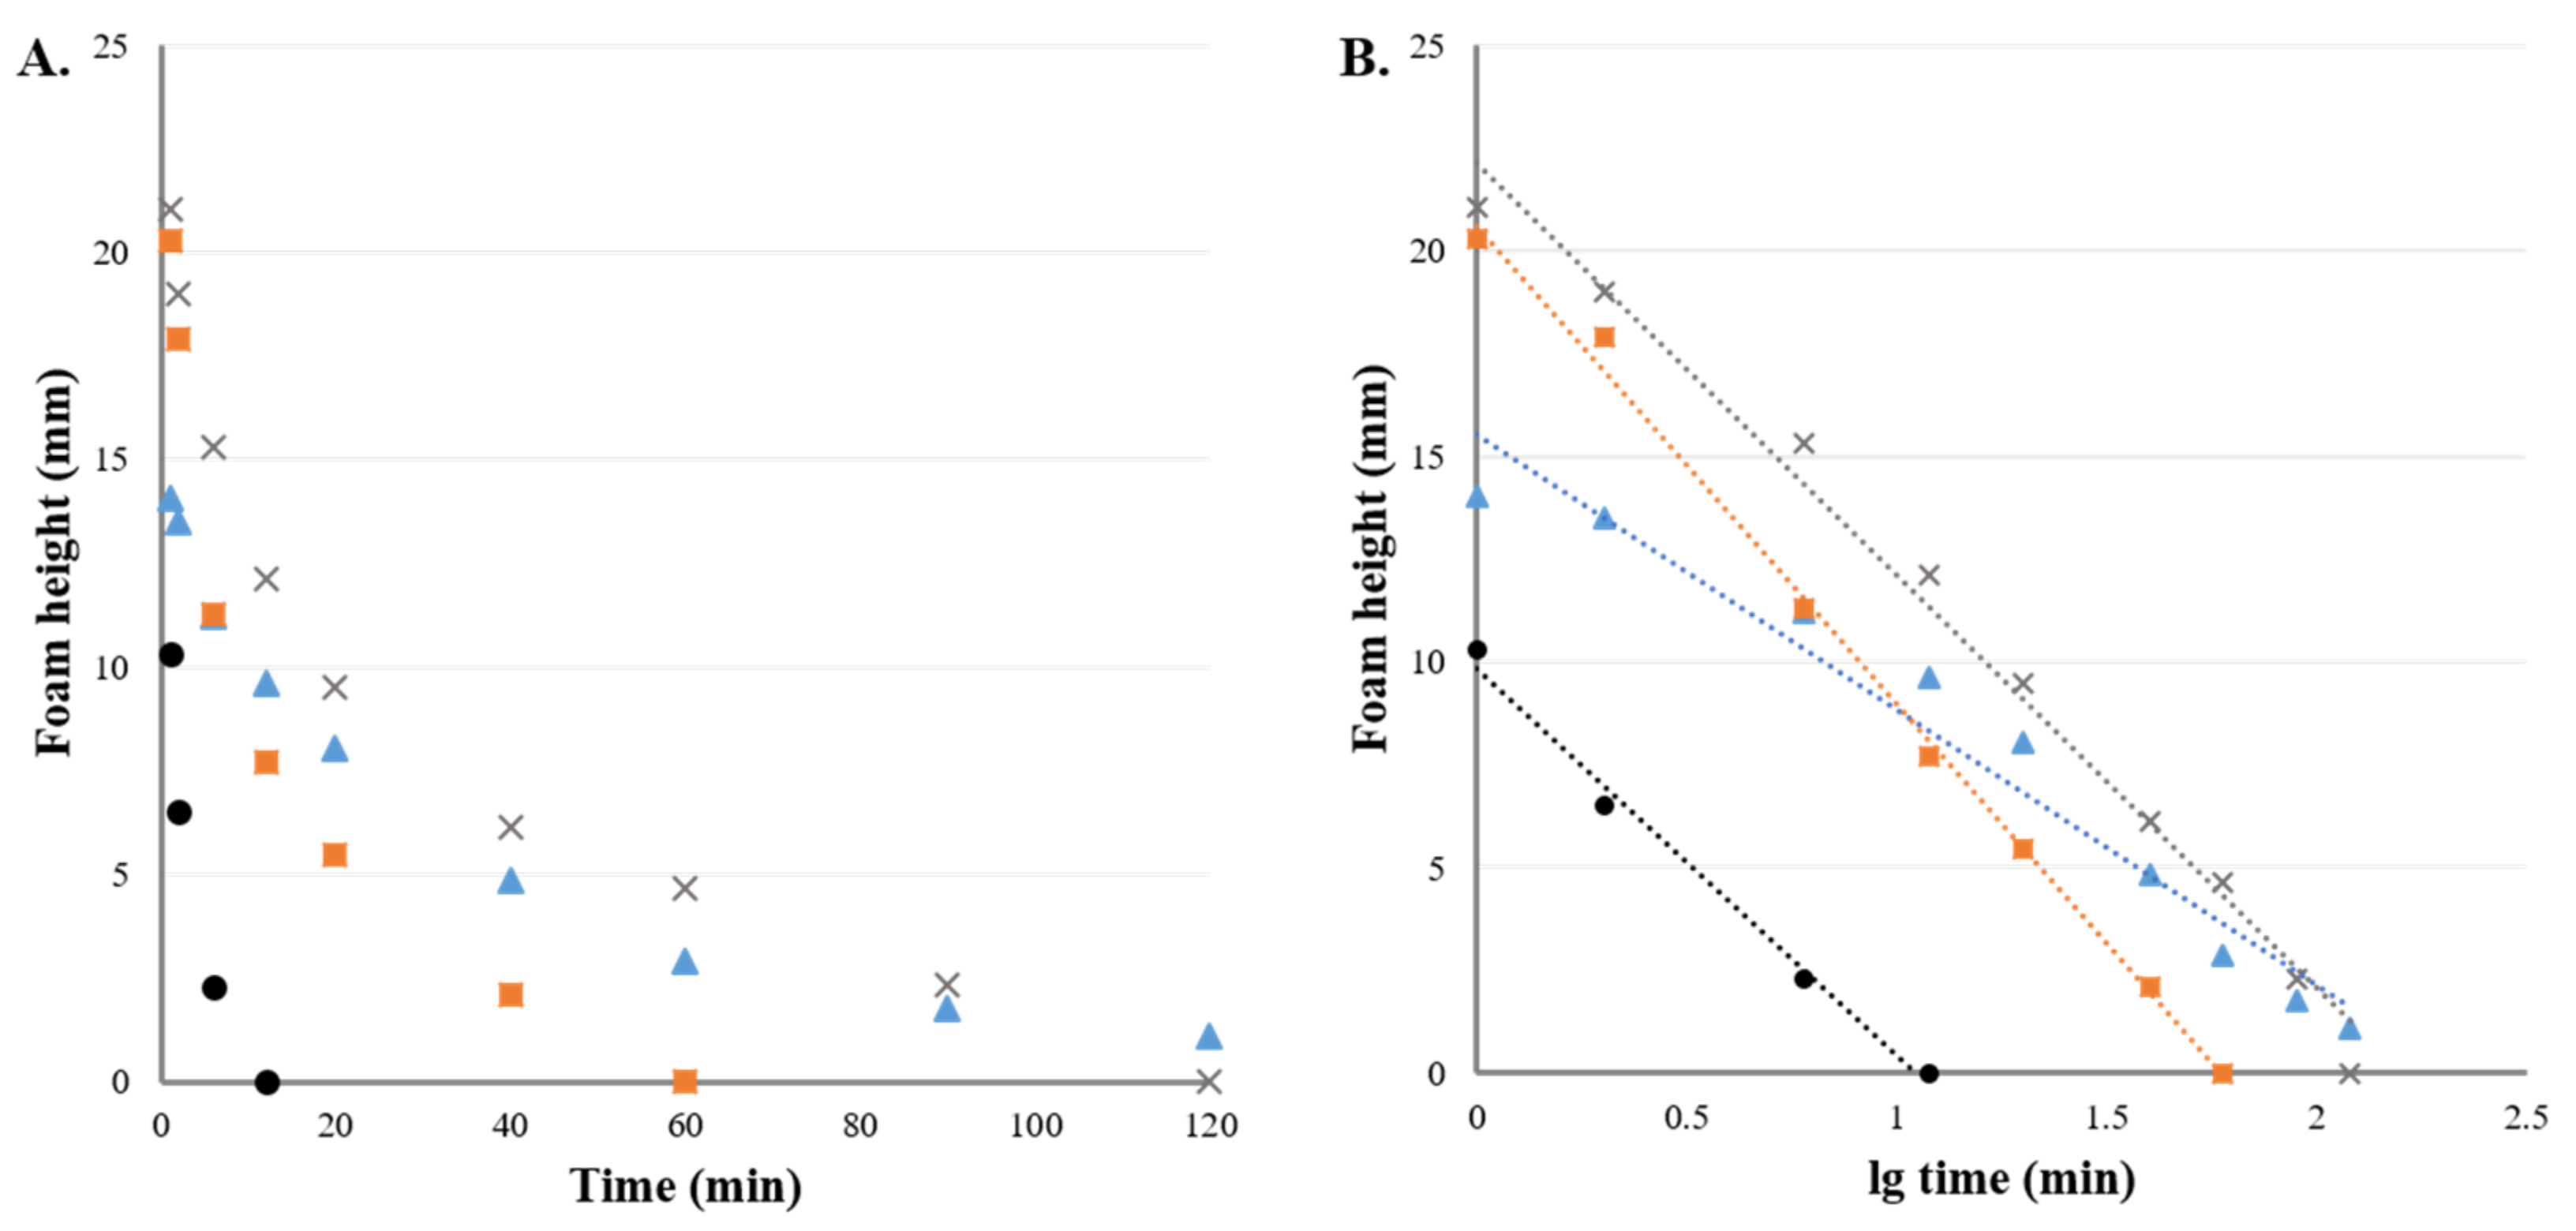
2.3.5. Foams
| Dosage Form | Aim of Measurement | Image Acquisition Method | Software | Refs. |
|---|---|---|---|---|
| Solution (Eye Drop) | Phosphates, pH | Digital Camera | Matlab | [116] |
| Emulsion Cream | Droplet Characterization (Size, Shape) | Optical Microscopy | Fiji Based Machine Learning | [121] |
| Emulsion (O/W) | Droplet Size Distribution | Bright Field Microscopy | ImageJ | [122] |
| Emulsion | Droplet Coalescence Kinetics, Influence of Adsorbed Particles | Optical Microscopy | Optimas Image Analysis System | [124,125] |
| Suspension | Wettability (Contact Angle) | Digital Camera | N/A | [127] |
| Aerosol, Suspension | Particle Size | Quantimet® 720 | Matlab | [128] |
| Foam | Foam Decay, Bubble Size, Shape | Digital Camera | ADVANCE | [135] |
| Foam | Microscopic Properties, Foam Collapse | Digital Camera | ImageJ | [137] |
3. Conclusions
Author Contributions
Funding
Conflicts of Interest
References
- Council of Europe. European Pharmacopoeia 10; European Directorate for the Quality of Medicines & HealthCare of the Council of Europe (EDQM): Strasbourg, France, 2019. [Google Scholar]
- The Ministry of Health, Labour and Welfare. The Japanese Pharmacopoeia, 17th ed.; Pharmaceuticals and Medical Devices Agency: Tokyo, Japan, 2016.
- The United States Pharmacopeial Convention. The United States Pharmacopeia; USP32-NF27 ed.; The United States Pharmacopeial Convention: Rockville, MD, USA, 2020. [Google Scholar]
- Madsen, R.E.; Cherris, R.T.; Shabushnig, J.G.; Hunt, D.G. Visible Particulates in Injections—A History and a Proposal to Revise USP General Chapter Injections H1i. Pharmacop. Forum 2009, 35, 5. [Google Scholar]
- Visual Inspection Group—An Interest Group of the ECA Foundation. Available online: https://www.visual-inspection.org/visual-inspection-home.html (accessed on 13 January 2021).
- Posset, T.; Gaus, H.; Dearden, M.; Eicher, R. Good Practice Paper—Visual Inspection of Medicinal Products for Parenteral Use; ECA Visual Inspection Working Group: Heidelberg, Germany, 2014. [Google Scholar]
- Sonka, M.; Hlavac, V.; Boyle, R. Mathematical morphology. In Image Processing, Analysis and Machine Vision; Sonka, M., Hlavac, V., Boyle, R., Eds.; Springer US: Boston, MA, USA, 1993; pp. 422–442. ISBN 978-1-4899-3216-7. [Google Scholar]
- Soille, P. Morphological Image Analysis: Principles and Applications, 2nd ed.; Springer-Verlag: Berlin/Heidelberg, Germany, 2004; ISBN 978-3-540-42988-3. [Google Scholar]
- ISO. Particle Size Analysis—Image Analysis Methods—Part 1: Static Image Analysis Methods; ISO 13322-1:2014; International Organization for Standardization: Geneva, Switzerland, 2014. [Google Scholar]
- ISO. Particle Size Analysis—Image Analysis Methods—Part 2: Dynamic Image Analysis Methods; ISO 13322-2:2006; International Organization for Standardization: Geneva, Switzerland, 2006. [Google Scholar]
- Bajaj, P.; Guise, O. Particle Size and Shape of Polytetrafluoroethylene (PTFE) Powders Using Static and Dynamic Image Analysis. Microsc. Microanal. 2012, 18, 1244–1245. [Google Scholar] [CrossRef]
- Galata, D.L.; Mészáros, L.A.; Kállai-Szabó, N.; Szabó, E.; Pataki, H.; Marosi, G.; Nagy, Z.K. Applications of Machine Vision in Pharmaceutical Technology: A Review. Eur. J. Pharm. Sci. 2021, 159, 105717. [Google Scholar] [CrossRef]
- LeCun, Y.; Bengio, Y.; Hinton, G. Deep Learning. Nature 2015, 521, 436–444. [Google Scholar] [CrossRef] [PubMed]
- Almeida-Prieto, S.; Blanco-Méndez, J.; Otero-Espinar, F.J. Microscopic Image Analysis Techniques for the Morphological Characterization of Pharmaceutical Particles: Influence of the Software, and the Factor Algorithms Used in the Shape Factor Estimation. Eur. J. Pharm. Biopharm. 2007, 67, 766–776. [Google Scholar] [CrossRef]
- Liu, E.J.; Cashman, K.V.; Rust, A.C. Optimising Shape Analysis to Quantify Volcanic Ash Morphology. Geo. Res. J. 2015, 8, 14–30. [Google Scholar] [CrossRef] [Green Version]
- Particle Analyzer: CAMSIZER P4: Microtrac.Com. Available online: https://www.microtrac.com/products/particle-size-shape-analysis/dynamic-image-analysis/camsizer-p4/ (accessed on 27 April 2021).
- Mészáros, L.A.; Galata, D.L.; Madarász, L.; Köte, Á.; Csorba, K.; Dávid, Á.Z.; Domokos, A.; Szabó, E.; Nagy, B.; Marosi, G.; et al. Digital UV/VIS Imaging: A Rapid PAT Tool for Crushing Strength, Drug Content and Particle Size Distribution Determination in Tablets. Int. J. Pharm. 2020, 578, 119174. [Google Scholar] [CrossRef]
- Berardi, A.; Bisharat, L.; Blaibleh, A.; Pavoni, L.; Cespi, M. A Simple and Inexpensive Image Analysis Technique to Study the Effect of Disintegrants Concentration and Diluents Type on Disintegration. J. Pharm. Sci. 2018, 107, 2643–2652. [Google Scholar] [CrossRef]
- Ma, X.; Kittikunakorn, N.; Sorman, B.; Xi, H.; Chen, A.; Marsh, M.; Mongeau, A.; Piché, N.; Williams, R.O.; Skomski, D. Application of Deep Learning Convolutional Neural Networks for Internal Tablet Defect Detection: High Accuracy, Throughput, and Adaptability. J. Pharm. Sci. 2020, 109, 1547–1557. [Google Scholar] [CrossRef] [Green Version]
- Csobán, Z.; Kállai-Szabó, B.; Kállai-Szabó, N.; Takács, T.; Hurtony, T.; Gordon, P.; Zelkó, R.; Antal, I. Assessment of Distribution of Pellets in Tablets by Non-Destructive Microfocus X-ray Imaging and Image Analysis Technique. Powder Technol. 2016, 301, 228–233. [Google Scholar] [CrossRef]
- Kennedy, J.P.; Niebergall, P.J. Preliminary Assessment of an Image Analysis Method for the Evaluation of Pharmaceutical Coatings. Pharm. Dev. Technol. 1997, 2, 205–212. [Google Scholar] [CrossRef]
- Tatarkiewicz, J.J. Apparatus and Method Generating High Dynamic Range Video. U.S. Patent 8989484B2, 24 March 2015. [Google Scholar]
- Tatarkiewicz, J.J.; Pejcinovic, M. Apparatus and Method for Three-Dimensional Dynamic Image Analysis for Particle Volume Determination. U.S. Patent 6873725B2, 29 March 2005. [Google Scholar]
- Tablet, Capsule, Softgel Inspection and Sorting Machine|Sensum SPINE. Available online: https://www.sensum.eu/product/spine/ (accessed on 27 April 2021).
- Baranska, M.D.-I.; Lunkenheimer, K.D.H.; Malysa, K.D.H.; Wienskol, G.D.-I. Method and Procedure for Swift Characterization of Foamability and Foam Stability. European Patent EP1416261B1, 16 January 2008. [Google Scholar]
- Gamble, J.F.; Tobyn, M.; Hamey, R. Application of Image-Based Particle Size and Shape Characterization Systems in the Development of Small Molecule Pharmaceuticals. J. Pharm. Sci. 2015, 104, 1563–1574. [Google Scholar] [CrossRef] [PubMed]
- Balogh, E.; Kállai, N.; Dredán, J.; Lengyel, M.; Klebovich, I.; Antal, I. Application of computer image analysis for characterization of pellets. Acta Pharm. Hung. 2007, 77, 123–131. (In Hungarian) [Google Scholar] [PubMed]
- Larsen, C.C.; Sonnergaard, J.M.; Bertelsen, P.; Holm, P. Validation of an Image Analysis Method for Estimating Coating Thickness on Pellets. Eur. J. Pharm. Sci. 2003, 18, 191–196. [Google Scholar] [CrossRef]
- Podczeck, F.; Rahman, S.R.; Newton, J.M. Evaluation of a Standardised Procedure to Assess the Shape of Pellets Using Image Analysis. Int. J. Pharm. 1999, 192, 123–138. [Google Scholar] [CrossRef]
- Gao, Z.; Wu, Y.; Bao, Y.; Gong, J.; Wang, J.; Rohani, S. Image Analysis for In-Line Measurement of Multidimensional Size, Shape, and Polymorphic Transformation of l-Glutamic Acid Using Deep Learning-Based Image Segmentation and Classification. Cryst. Growth Des. 2018, 18, 4275–4281. [Google Scholar] [CrossRef]
- Zingerman, J.P.; Mehta, S.C.; Salter, J.M.; Radebaugh, G.W. Validation of a Computerized Image Analysis System for Particle Size Determination Pharmaceutical Applications. Int. J. Pharm. 1992, 88, 303–312. [Google Scholar] [CrossRef]
- Kelly, R.N.; DiSante, K.J.; Stranzl, E.; Kazanjian, J.A.; Bowen, P.; Matsuyama, T.; Gabas, N. Graphical Comparison of Image Analysis and Laser Diffraction Particle Size Analysis Data Obtained from the Measurements of Nonspherical Particle Systems. AAPS PharmSciTech 2006, 7, E93. [Google Scholar] [CrossRef] [PubMed] [Green Version]
- Boschetto, A.; Giordano, V. Powder Sampling and Characterization by Digital Image Analysis. Measurement 2012, 45, 1023–1038. [Google Scholar] [CrossRef]
- Mahdi, Y.; Mouhi, L.; Guemras, N.; Daoud, K. Coupling the Image Analysis and the Artificial Neural Networks to Predict a Mixing Time of a Pharmaceutical Powder. J. Fundam. Appl. Sci. 2016, 8, 655–670. [Google Scholar] [CrossRef]
- Berthiaux, H.; Mosorov, V.; Tomczak, L.; Gatumel, C.; Demeyre, J.F. Principal Component Analysis for Characterising Homogeneity in Powder Mixing Using Image Processing Techniques. Chem. Eng. Process. Process Intensif. 2006, 45, 397–403. [Google Scholar] [CrossRef] [Green Version]
- Goldschmidt, M.J.V.; Link, J.M.; Mellema, S.; Kuipers, J.A.M. Digital Image Analysis Measurements of Bed Expansion and Segregation Dynamics in Dense Gas-Fluidised Beds. Powder Technol. 2003, 138, 135–159. [Google Scholar] [CrossRef]
- Olaofe, O.O.; Buist, K.A.; Deen, N.G.; van der Hoef, M.A.; Kuipers, J.A.M. Improved Digital Image Analysis Technique for the Evaluation of Segregation in Pseudo-2D Beds. Powder Technol. 2013, 244, 61–74. [Google Scholar] [CrossRef]
- Atkins, P.J. Dry Powder Inhalers: An Overview. Respir. Care 2005, 50, 1304–1312. [Google Scholar] [PubMed]
- Magramane, S.; Pápay, Z.; Turbucz, B.; Antal, I. Formulation and Characterization of Pulmonary Drug Delivery Systems. Acta Pharm. Hung. 2019, 89, 63–83. [Google Scholar] [CrossRef] [Green Version]
- Dearnaley, M.P. Direct Measurements of Settling Velocities in the Owen Tube: A Comparison with Gravimetric Analysis. J. Sea Res. 1996, 36, 41–47. [Google Scholar] [CrossRef]
- Fishler, R.; Sznitman, J. A Novel Aerodynamic Sizing Method for Pharmaceutical Aerosols Using Image-Based Analysis of Settling Velocities. Inhalation 2017, 11, 21–25. [Google Scholar] [PubMed]
- Fishler, R.; Verhoeven, F.; de Kruijf, W.; Sznitman, J. Particle Sizing of Pharmaceutical Aerosols via Direct Imaging of Particle Settling Velocities. Eur. J. Pharm. Sci. 2018, 113, 152–158. [Google Scholar] [CrossRef]
- Dry-Powder Inhaler Development Using Laser Diffraction and Automated Imaging. Available online: https://www.azom.com/article.aspx?ArticleID=9827 (accessed on 12 February 2021).
- Malvern Panalytical. Morphologi Range | Automated Imaging For Particle Characterization. Available online: https://www.malvernpanalytical.com/en/products/product-range/morphologi-range (accessed on 12 February 2021).
- Sandler, N.; Wilson, D. Prediction of Granule Packing and Flow Behavior Based on Particle Size and Shape Analysis. J. Pharm. Sci. 2010, 99, 958–968. [Google Scholar] [CrossRef]
- Bruschi, M.L. Modification of drug release. In Strategies to Modify the Drug Release from Pharmaceutical System; Bruschi, M.L., Ed.; Woodhead Publishing: Sawston, UK, 2015; pp. 15–28. [Google Scholar]
- Yun, Y.H.; Lee, B.K.; Park, K. Controlled Drug Delivery: Historical Perspective for the next Generation. J. Controll. Releas. 2015, 219, 2–7. [Google Scholar] [CrossRef] [Green Version]
- GlaxoSmithKline. DX:L58 Prescribing Information—Dexedrine® Spansule® Sustained-Release Capsules and Tablets; GlaxoSmithKline: Research Triangle Park, NC, USA, 2007. [Google Scholar]
- Swarbrick, J. (Ed.) Encyclopedia of Pharmaceutical Technology, 3rd ed.; Informa Healthcare USA, Inc.: New York, NY, USA, 2007. [Google Scholar]
- Heinicke, G.; Schwartz, J.B. Particle Size Distributions of Inert Spheres and Pelletized Pharmaceutical Products by Image Analysis. Pharm. Dev. Technol. 2005, 9, 359–367. [Google Scholar] [CrossRef] [PubMed]
- Treffer, D.; Wahl, P.R.; Hörmann, T.R.; Markl, D.; Schrank, S.; Jones, I.; Cruise, P.; Mürb, R.-K.; Koscher, G.; Roblegg, E.; et al. In-Line Implementation of an Image-Based Particle Size Measurement Tool to Monitor Hot-Melt Extruded Pellets. Int. J. Pharm. 2014, 466, 181–189. [Google Scholar] [CrossRef]
- Almeida-Prieto, S.; Blanco-Méndez, J.; Otero-Espinar, F.J. Image Analysis of the Shape of Granulated Powder Grains. J. Pharm. Sci. 2004, 93, 621–634. [Google Scholar] [CrossRef]
- Kumari, M.H.; Samantha, K.; Balaji, A.; Shankar, U. Recent Novel Advandcements in Pellet Formulation: A Review. Int. J. Pharm. Sci. Res. 2013, 4, 3803–3822. [Google Scholar]
- Chopra, R.; Alderborn, G.; Newton, J.M.; Podczeck, F. The Influence of Film Coating on Pellet Properties. Pharm. Dev. Technol. 2002, 7, 59–68. [Google Scholar] [CrossRef]
- Avalle, P.; Pollitt, M.J.; Bradley, K.; Cooper, B.; Pearce, G.; Djemai, A.; Fitzpatrick, S. Development of Process Analytical Technology (PAT) Methods for Controlled Release Pellet Coating. Eur. J. Pharm. Biopharm. 2014, 87, 244–251. [Google Scholar] [CrossRef] [PubMed]
- Kucheryavski, S.; Esbensen, K.H.; Bogomolov, A. Monitoring of Pellet Coating Process with Image Analysis—A Feasibility Study. J. Chemom. 2010, 24, 472–480. [Google Scholar] [CrossRef]
- Oman Kadunc, N.; Šibanc, R.; Dreu, R.; Likar, B.; Tomaževič, D. In-Line Monitoring of Pellet Coating Thickness Growth by Means of Visual Imaging. Int. J. Pharm. 2014, 470, 8–14. [Google Scholar] [CrossRef]
- Lee, M.-J.; Seo, D.-Y.; Lee, H.-E.; Wang, I.-C.; Kim, W.-S.; Jeong, M.-Y.; Choi, G.J. In Line NIR Quantification of Film Thickness on Pharmaceutical Pellets during a Fluid Bed Coating Process. Int. J. Pharm. 2011, 403, 66–72. [Google Scholar] [CrossRef] [PubMed]
- Andersson, M.; Holmquist, B.; Lindquist, J.; Nilsson, O.; Wahlund, K.-G. Analysis of Film Coating Thickness and Surface Area of Pharmaceutical Pellets Using Fluorescence Microscopy and Image Analysis. J. Pharm. Biomed. Anal. 2000, 22, 325–339. [Google Scholar] [CrossRef]
- Laksmana, F.L.; Van Vliet, L.J.; Hartman Kok, P.J.A.; Vromans, H.; Frijlink, H.W.; Van der Voort Maarschalk, K. Quantitative Image Analysis for Evaluating the Coating Thickness and Pore Distribution in Coated Small Particles. Pharm. Res. 2009, 26, 965–976. [Google Scholar] [CrossRef] [PubMed] [Green Version]
- Kállai, N.; Luhn, O.; Dredán, J.; Kovács, K.; Lengyel, M.; Antal, I. Evaluation of Drug Release From Coated Pellets Based on Isomalt, Sugar, and Microcrystalline Cellulose Inert Cores. AAPS PharmSciTech 2010, 11, 383–391. [Google Scholar] [CrossRef] [PubMed] [Green Version]
- Lengyel, M.; Kállai-Szabó, N.; Antal, V.; Laki, A.J.; Antal, I. Microparticles, Microspheres, and Microcapsules for Advanced Drug Delivery. Sci. Pharm. 2019, 87, 20. [Google Scholar] [CrossRef] [Green Version]
- Lamprecht, A.; Schäfer, U.F.; Lehr, C.-M. Characterization of Microcapsules by Confocal Laser Scanning Microscopy: Structure, Capsule Wall Composition and Encapsulation Rate. Eur. J. Pharm. Biopharm. 2000, 49, 1–9. [Google Scholar] [CrossRef]
- Lamprecht, A.; Schäfer, U.F.; Lehr, C.-M. Visualization and Quantification of Polymer Distribution in Microcapsules by Confocal Laser Scanning Microscopy (CLSM). Int. J. Pharm. 2000, 196, 223–226. [Google Scholar] [CrossRef]
- Lawrence, M.J.; Rees, G.D. Microemulsion-Based Media as Novel Drug Delivery Systems. Adv. Drug Deliv. Rev. 2000, 45, 89–121. [Google Scholar] [CrossRef]
- Buyukozturk, F.; Benneyan, J.C.; Carrier, R.L. Impact of Emulsion-Based Drug Delivery Systems on Intestinal Permeability and Drug Release Kinetics. J. Controll. Releas. 2010, 142, 22–30. [Google Scholar] [CrossRef]
- Jakab, G.; Fülöp, V.; Bozó, T.; Balogh, E.; Kellermayer, M.; Antal, I. Optimization of Quality Attributes and Atomic Force Microscopy Imaging of Reconstituted Nanodroplets in Baicalin Loaded Self-Nanoemulsifying Formulations. Pharmaceutics 2018, 10, 275. [Google Scholar] [CrossRef] [PubMed] [Green Version]
- Abdalla, A.; Mäder, K. Preparation and Characterization of a Self-Emulsifying Pellet Formulation. Eur. J. Pharm. Biopharm. 2007, 66, 220–226. [Google Scholar] [CrossRef]
- Balakrishnan, P.; Lee, B.-J.; Oh, D.H.; Kim, J.O.; Hong, M.J.; Jee, J.-P.; Kim, J.A.; Yoo, B.K.; Woo, J.S.; Yong, C.S.; et al. Enhanced Oral Bioavailability of Dexibuprofen by a Novel Solid Self-Emulsifying Drug Delivery System (SEDDS). Eur. J. Pharm. Biopharm. 2009, 72, 539–545. [Google Scholar] [CrossRef]
- Kenry; Lim, C.T. Nanofiber Technology: Current Status and Emerging Developments. Prog. Polym. Sci. 2017, 70, 1–17. [Google Scholar] [CrossRef]
- Huang, Z.-M.; Zhang, Y.-Z.; Kotaki, M.; Ramakrishna, S. A Review on Polymer Nanofibers by Electrospinning and Their Applications in Nanocomposites. Compos. Sci. Technol. 2003, 63, 2223–2253. [Google Scholar] [CrossRef]
- Hall Barrientos, I.J.; Paladino, E.; Szabó, P.; Brozio, S.; Hall, P.J.; Oseghale, C.I.; Passarelli, M.K.; Moug, S.J.; Black, R.A.; Wilson, C.G.; et al. Electrospun Collagen-Based Nanofibres: A Sustainable Material for Improved Antibiotic Utilisation in Tissue Engineering Applications. Int. J. Pharm. 2017, 531, 67–79. [Google Scholar] [CrossRef] [PubMed] [Green Version]
- Kovács, A.; Kazsoki, A.; Démuth, B.; Szirányi, B.; Madarász, J.; Süvegh, K.; Zelkó, R. Influence of Aqueous Solubility-Enhancing Excipients on the Microstructural Characteristics of Furosemide-Loaded Electrospun Nanofibers. Pharmaceutics 2020, 12, 385. [Google Scholar] [CrossRef]
- He, H.; Wang, Y.; Farkas, B.; Nagy, Z.K.; Molnar, K. Analysis and Prediction of the Diameter and Orientation of AC Electrospun Nanofibers by Response Surface Methodology. Mater. Des. 2020, 194. [Google Scholar] [CrossRef]
- Balogh, A.; Farkas, B.; Faragó, K.; Farkas, A.; Wagner, I.; Van assche, I.; Verreck, G.; Nagy, Z.K.; Marosi, G. Melt-Blown and Electrospun Drug-Loaded Polymer Fiber Mats for Dissolution Enhancement: A Comparative Study. J. Pharm. Sci. 2015, 104, 1767–1776. [Google Scholar] [CrossRef] [PubMed] [Green Version]
- Irfan, M.; Rabel, S.; Bukhtar, Q.; Qadir, M.I.; Jabeen, F.; Khan, A. Orally Disintegrating Films: A Modern Expansion in Drug Delivery System. Saudi Pharm. J. 2016, 24, 537–546. [Google Scholar] [CrossRef] [Green Version]
- Redfearn, A.; Scarpa, M.; Orlu, M.; Hanson, B. In Vitro Oral Cavity Model for Screening the Disintegration Behavior of Orodispersible Films: A Bespoke Design. J. Pharm. Sci. 2019, 108, 1831–1836. [Google Scholar] [CrossRef]
- Soponar, F.; Moţ, A.C.; Sârbu, C. Quantitative Evaluation of Paracetamol and Caffeine from Pharmaceutical Preparations Using Image Analysis and RP-TLC. Chromatographia 2009, 69, 151–155. [Google Scholar] [CrossRef]
- Nokhodchi, A.; Javadzadeh, Y. The Effect of Storage Conditions on the Physical Stability of Tablets. Pharm. Technol. Eur. 2007, 19, 20–26. [Google Scholar]
- Mollereau, G.; Mazel, V.; Busignies, V.; Tchoreloff, P.; Mouveaux, F.; Rivière, P. Image Analysis Quantification of Sticking and Picking Events of Pharmaceutical Powders Compressed on a Rotary Tablet Press Simulator. Pharm. Res. 2013, 30, 2303–2314. [Google Scholar] [CrossRef]
- Quodbach, J.; Kleinebudde, P. A Critical Review on Tablet Disintegration. Pharm. Dev. Technol. 2016, 21, 763–774. [Google Scholar] [CrossRef]
- Csobán, Z.; Kállai-Szabó, B.; Kállai-Szabó, N.; Sebe, I.; Gordon, P.; Antal, I. Improvement of Mechanical Properties of Pellet Containing Tablets by Thermal Treatment. Int. J. Pharm. 2015, 496, 489–496. [Google Scholar] [CrossRef]
- Moussa, I.S.; Cartilier, L.H. Characterization of Moving Fronts in Cross-Linked Amylose Matrices by Image Analysis. J. Controll. Releas. 1996, 42, 47–55. [Google Scholar] [CrossRef]
- Chirico, S.; Dalmoro, A.; Lamberti, G.; Russo, G.; Titomanlio, G. Analysis and Modeling of Swelling and Erosion Behavior for Pure HPMC Tablet. J. Controll. Releas. 2007, 122, 181–188. [Google Scholar] [CrossRef]
- May, R.K.; Han, L.; Alton, J.; Zhong, S.; Elliott, J.A.; Byers, C.; Gladden, L.F.; Evans, M.; Shen, Y.; Zeitler, J.A. Pharmaceutical Tablet Hardness Measurements with Thz Pulsed Imaging. In Proceedings of the 2009 34th International Conference on Infrared Millimeter, and Terahertz Waves, Busan, Korea, 21–25 September 2009; pp. 1–2. [Google Scholar]
- Šašić, S. Determining the Coating Thickness of Tablets by Chiseling and Image Analysis. Int. J. Pharm. 2010, 397, 109–115. [Google Scholar] [CrossRef]
- Koller, D.M.; Hannesschläger, G.; Leitner, M.; Khinast, J.G. Non-Destructive Analysis of Tablet Coatings with Optical Coherence Tomography. Eur. J. Pharm. Sci. 2011, 44, 142–148. [Google Scholar] [CrossRef]
- Wagner, K.G.; Krumme, M.; Schmidt, P.C. Investigation of the Pellet-Distribution in Single Tablets via Image Analysis. Eur. J. Pharm. Biopharm. 1999, 47, 79–85. [Google Scholar] [CrossRef]
- Wagner, K.G.; Krumme, M.; Beckert, T.E.; Schmidt, P.C. Development of Disintegrating Multiple-Unit Tablets on a High-Speed Rotary Tablet Press. Eur. J. Pharm. Biopharm. 2000, 50, 285–292. [Google Scholar] [CrossRef]
- Novikova, A.; Carstensen, J.M.; Rades, T.; Leopold, C.S. Multispectral UV Imaging for Surface Analysis of MUPS Tablets with Special Focus on the Pellet Distribution. Int. J. Pharm. 2016, 515, 374–383. [Google Scholar] [CrossRef] [PubMed]
- Novikova, A.; Markl, D.; Zeitler, J.A.; Rades, T.; Leopold, C.S. A Non-Destructive Method for Quality Control of the Pellet Distribution within a MUPS Tablet by Terahertz Pulsed Imaging. Eur. J. Pharm. Sci. 2018, 111, 549–555. [Google Scholar] [CrossRef] [PubMed] [Green Version]
- Doerr, F.J.S.; Florence, A.J. A Micro-XRT Image Analysis and Machine Learning Methodology for the Characterisation of Multi-Particulate Capsule Formulations. Int. J. Pharm. X 2020, 2. [Google Scholar] [CrossRef] [PubMed]
- Gujral, G.; Kapoor, D.; Jaimini, M. An updated review on modified release tablets. J. Drug Deliv. Ther. 2018, 8, 5–9. [Google Scholar] [CrossRef]
- Babu, A.; Ratna, P.R.V. Controlled-porosity osmotic pump tablets—An overview. Asian J. Pharm. Res. Health Care 2010, 2, 114–126. [Google Scholar]
- Zhang, X.; Wang, D.; Li, X. Recognition and Measurement of Drug-Release Hole Based on Machine Vision Algorithms. In Proceedings of the 2011 4th International Congress on Image and Signal Processing, Shanghai, China, 15–17 October 2011; Volume 4, pp. 1950–1953. [Google Scholar]
- Možina, M.; Tomaževič, D.; Pernuš, F.; Likar, B. Real-Time Image Segmentation for Visual Inspection of Pharmaceutical Tablets. Mach. Vis. Appl. 2011, 22, 145–156. [Google Scholar] [CrossRef]
- Hirschberg, C.; Edinger, M.; Holmfred, E.; Rantanen, J.; Boetker, J. Image-Based Artificial Intelligence Methods for Product Control of Tablet Coating Quality. Pharmaceutics 2020, 12, 877. [Google Scholar] [CrossRef]
- Center for Drug Evaluation and Research (CDER). Approval Package for SPRITAM; CDER: Rockville, MD, USA, 2015.
- Cader, H.K.; Rance, G.A.; Alexander, M.R.; Gonçalves, A.D.; Roberts, C.J.; Tuck, C.J.; Wildman, R.D. Water-Based 3D Inkjet Printing of an Oral Pharmaceutical Dosage Form. Int. J. Pharm. 2019, 564, 359–368. [Google Scholar] [CrossRef]
- Tinke, A.P.; Vanhoutte, K.; Vanhoutte, F.; De Smet, M.; De Winter, H. Laser Diffraction and Image Analysis as a Supportive Analytical Tool in the Pharmaceutical Development of Immediate Release Direct Compression Formulations. Int. J. Pharm. 2005, 297, 80–88. [Google Scholar] [CrossRef] [PubMed]
- Barmpalexis, P.; Partheniadis, I.; Mitra, K.-S.; Toskas, M.; Papadopoulou, L.; Nikolakakis, I. Application of Multiple Linear Regression and Artificial Neural Networks for the Prediction of the Packing and Capsule Filling Performance of Coated and Plain Pellets Differing in Density and Size. Pharmaceutics 2020, 12, 244. [Google Scholar] [CrossRef] [PubMed] [Green Version]
- Šibanc, R.; Luštrik, M.; Dreu, R. Analysis of Pellet Coating Uniformity Using a Computer Scanner. Int. J. Pharm. 2017, 533, 377–382. [Google Scholar] [CrossRef]
- Berardi, A.; Abdel Rahim, S.; Bisharat, L.; Cespi, M. Swelling of Zein Matrix Tablets Benchmarked against HPMC and Ethylcellulose: Challenging the Matrix Performance by the Addition of Co-Excipients. Pharmaceutics 2019, 11, 513. [Google Scholar] [CrossRef] [Green Version]
- Straub, J. Initial Work on the Characterization of Additive Manufacturing (3D Printing) Using Software Image Analysis. Machines 2015, 3, 55–71. [Google Scholar] [CrossRef] [Green Version]
- Farris, S.; Introzzi, L.; Biagioni, P.; Holz, T.; Schiraldi, A.; Piergiovanni, L. Wetting of Biopolymer Coatings: Contact Angle Kinetics and Image Analysis Investigation. Langmuir 2011, 27, 7563–7574. [Google Scholar] [CrossRef] [PubMed]
- Dong, Y.; Qu, H.; Pavurala, N.; Wang, J.; Sekar, V.; Martinez, M.N.; Fahmy, R.; Ashraf, M.; Cruz, C.N.; Xu, X. Formulation Characteristics and in Vitro Release Testing of Cyclosporine Ophthalmic Ointments. Int. J. Pharm. 2018, 544, 254–264. [Google Scholar] [CrossRef]
- Realdon, N.; Perin, F.; Morpurgo, M.; Ragazzi, E. Influence of Processing Conditions in the Manufacture of O/W Creams: I. Effect on Dispersion Grade and Rheological Characteristics. Farmaco 2002, 57, 341–347. [Google Scholar] [CrossRef]
- Realdon, N.; Ragazzi, E.; Morpurgo, M.; Ragazzi, E. Influence of Processing Conditions in the Manufacture of O/W Creams: II. Effect on Drug Availability. Farmaco 2002, 57, 349–353. [Google Scholar] [CrossRef]
- Sutton, M.J.; Osborne, D.W.; Dahl, K.; Bax, V.; Schick, G.A. Characterization of a Liquid Crystal Stabilized Pharmaceutical Oil-in-Water Emulsion Optimized for Skin Delivery. J. Cosmet. Dermatol. Sci. Appl. 2018, 8, 207. [Google Scholar] [CrossRef] [Green Version]
- Saleem, M.A.; Taher, M.; Sanaullah, S.; Najmuddin, M.; Ali, J.; Humaira, S.; Roshan, S. Formulation and Evaluation of Tramadol Hydrochloride Rectal Suppositories. Ind. J. Pharm. Sci. 2008, 70, 640–644. [Google Scholar] [CrossRef] [Green Version]
- Patil, B.S.; Mahajan, H.S.; Surana, S.J. Preparation and Evaluation of Flutamide Mucoadhesive Microparticles Loaded Poloxamer Suppositories. J. Pharm. Investig. 2016, 46, 139–146. [Google Scholar] [CrossRef]
- Azarbayjani, A.F.; Jouyban, A.; Chan, S.Y. Impact of Surface Tension in Pharmaceutical Sciences. J. Pharm. Pharm. Sci. 2009, 12, 218–228. [Google Scholar] [CrossRef] [Green Version]
- Grgurević, M.H.; Juretić, M.; Hafner, A.; Lovrić, J.; Pepić, I. Tear Fluid-Eye Drops Compatibility Assessment Using Surface Tension. Drug Dev. Ind. Pharm. 2017, 43, 275–282. [Google Scholar] [CrossRef]
- Stauffer, C.E. The Measurement of Surface Tension by the Pendant Drop Technique. J. Phys. Chem. 1965, 69, 1933–1938. [Google Scholar] [CrossRef]
- Hansen, F.K.; Rødsrud, G. Surface Tension by Pendant Drop: I. A Fast Standard Instrument Using Computer Image Analysis. J. Colloid Interface Sci. 1991, 141, 1–9. [Google Scholar] [CrossRef]
- Berasarte, I.; Bordagaray, A.; Garcia-Arrona, R.; Ostra, M.; Vidal, M. PH Measurement and Phosphate Determination in Pharmaceutical Eye Drops for Eye Diseases by Digital Image Analysis. Microchem. J. 2021, 162. [Google Scholar] [CrossRef]
- Dickman, S.R.; Bray, R.H. Colorimetric Determination of Phosphate. Available online: https://pubs.acs.org/doi/pdf/10.1021/ac50151a013 (accessed on 16 February 2021).
- Maaß, S.; Rojahn, J.; Hänsch, R.; Kraume, M. Automated Drop Detection Using Image Analysis for Online Particle Size Monitoring in Multiphase Systems. Comput. Chem. Eng. 2012, 45, 27–37. [Google Scholar] [CrossRef]
- Scherze, I.; Knöfel, R.; Muschiolik, G. Automated Image Analysis as a Control Tool for Multiple Emulsions. Food Hydrocoll. 2005, 19, 617–624. [Google Scholar] [CrossRef]
- Khalil, A.; Puel, F.; Chevalier, Y.; Galvan, J.-M.; Rivoire, A.; Klein, J.-P. Study of Droplet Size Distribution during an Emulsification Process Using in Situ Video Probe Coupled with an Automatic Image Analysis. Chem. Eng. J. 2010, 165, 946–957. [Google Scholar] [CrossRef]
- Unnikrishnan, S.; Donovan, J.; Macpherson, R.; Tormey, D. Machine Learning for Automated Quality Evaluation in Pharmaceutical Manufacturing of Emulsions. J. Pharm. Innov. 2020, 15, 392–403. [Google Scholar] [CrossRef]
- Reufer, M.; Machado, A.H.E.; Niederquell, A.; Bohnenblust, K.; Müller, B.; Völker, A.C.; Kuentz, M. Introducing Diffusing Wave Spectroscopy as a Process Analytical Tool for Pharmaceutical Emulsion Manufacturing. J. Pharm. Sci. 2014, 103, 3902–3913. [Google Scholar] [CrossRef]
- Aveyard, R.; Binks, B.P.; Clint, J.H. Emulsions Stabilised Solely by Colloidal Particles. Adv. Colloid Interface Sci. 2003, 100–102, 503–546. [Google Scholar] [CrossRef]
- Prestidge, C.A.; Simovic, S. Nanoparticle Encapsulation of Emulsion Droplets. Int. J. Pharm. 2006, 324, 92–100. [Google Scholar] [CrossRef]
- Simovic, S.; Prestidge, C.A. Nanoparticles of Varying Hydrophobicity at the Emulsion Droplet–Water Interface: Adsorption and Coalescence Stability. Langmuir 2004, 20, 8357–8365. [Google Scholar] [CrossRef] [PubMed]
- Sahoo, S.; Chakraborti, C.K.; Mishra, S.C. Qualitative Analysis of Controlled Release Ciprofloxacin/Carbopol 934 Mucoadhesive Suspension. J. Adv. Pharm. Technol. Res. 2011, 2, 195–204. [Google Scholar] [CrossRef]
- Arias, J.L.; Gómez-Gallo, A.; Delgado, Á.V.; Gallardo, V. Study of the Stability of Kollidon® SR Suspensions for Pharmaceutical Applications. Colloids Surf. Physicochem. Eng. Asp. 2009, 338, 107–113. [Google Scholar] [CrossRef]
- Hallworth, G.W.; Hamilton, R.R. Size Analysis of Metered Suspension Pressurized Aerosols with the Quantimet 720. J. Pharm. Pharmacol. 1976, 28, 890–897. [Google Scholar] [CrossRef] [PubMed]
- Bikerman General. Foam Films. In Foams: The Theory and Industrial Applications; Springer-Verlag: New York, NY, USA, 1973; pp. 1–22. [Google Scholar]
- Kennedy, M.J.; Conroy, M.W.; Dougherty, J.A.; Otto, N.; Williams, B.A.; Ananth, R.; Fleming, J.W. Bubble Coarsening Dynamics in Fluorinated and Non-Fluorinated Firefighting Foams. Colloids Surf. Physicochem. Eng. Asp. 2015, 470, 268–279. [Google Scholar] [CrossRef]
- Campbell, G.M.; Mougeot, E. Creation and Characterisation of Aerated Food Products. Trends Food Sci. Technol. 1999, 10, 283–296. [Google Scholar] [CrossRef]
- Germain, J.C.; Aguilera, J.M. Identifying Industrial Food Foam Structures by 2D Surface Image Analysis and Pattern Recognition. J. Food Eng. 2012, 111, 440–448. [Google Scholar] [CrossRef]
- Russ, J.C. Image Analysis of Food Microstructure; CRC Press: Boca Raton, FL, USA, 2004; ISBN 978-1-4200-3899-6. [Google Scholar]
- Guillerme, C.; Loisel, W.; Bertrand, D.; Popineau, Y. Study of Foam Stability by Video Image Analysis: Relationship with the Quantity of Liquid in the Foams. J. Texture Stud. 1993, 24, 287–302. [Google Scholar] [CrossRef]
- Dynamic Foam Analyzer-DFA100. Available online: http://www.kruss-scientific.com/en/products-services/products/dfa100 (accessed on 20 January 2021).
- Farkas, D.; Kállai-Szabó, N.; Antal, I. Foams as Carrier Systems for Pharmaceuticals and Cosmetics. Acta Pharm. Hung. 2019, 89, 5–15. [Google Scholar] [CrossRef]
- Farkas, D.; Kállai-Szabó, N.; Sárádi-Kesztyűs, Á.; Lengyel, M.; Magramane, S.; Kiss, É.; Antal, I. Investigation of Propellant-Free Aqueous Foams as Pharmaceutical Carrier Systems. Pharm. Dev. Technol. 2021, 26, 253–261. [Google Scholar] [CrossRef]
- Tamarkin, D. Foam: A Unique Delivery Vehicle for Topically Applied Formulations. In Handbook of Formulating Dermal Applications; John Wiley & Sons, Ltd.: Hoboken, NJ, USA, 2016; pp. 233–260. ISBN 978-1-119-36422-1. [Google Scholar]


| Parameters | Conventionally Used Techniques | Advantages of the Image-Based Techniques over the Commonly Used Ones |
|---|---|---|
| Particle Size Distribution (PSD) | Sieve Analysis | Simultaneous Investigation of Particle Shape [16] Real-Time Results Rapidly |
| API Content | HPLC Mass Spectrometry UV-VIS Spectrometry | Nondestructive Ecofriendly (No Chemicals) Quicker and Easier Sample Preparation (if Needed) |
| Tablet Hardness | Tablet Hardness Tester | Nondestructive [17] |
| Disintegration of Tablets | Disintegration Apparat A (Ph.Eur.) | Kinetics and Mechanism can be Studied [18] |
| Pellet Uniformity in MUPS | Manual | Internal Defects can also be Detected [19] Nondestructive [20] Quicker |
| Coating Level of Dosage Forms | In Vitro Dissolution Testing | Not Necessarily Destructive Quicker Cost-Effective [21] |
Publisher’s Note: MDPI stays neutral with regard to jurisdictional claims in published maps and institutional affiliations. |
© 2021 by the authors. Licensee MDPI, Basel, Switzerland. This article is an open access article distributed under the terms and conditions of the Creative Commons Attribution (CC BY) license (https://creativecommons.org/licenses/by/4.0/).
Share and Cite
Farkas, D.; Madarász, L.; Nagy, Z.K.; Antal, I.; Kállai-Szabó, N. Image Analysis: A Versatile Tool in the Manufacturing and Quality Control of Pharmaceutical Dosage Forms. Pharmaceutics 2021, 13, 685. https://doi.org/10.3390/pharmaceutics13050685
Farkas D, Madarász L, Nagy ZK, Antal I, Kállai-Szabó N. Image Analysis: A Versatile Tool in the Manufacturing and Quality Control of Pharmaceutical Dosage Forms. Pharmaceutics. 2021; 13(5):685. https://doi.org/10.3390/pharmaceutics13050685
Chicago/Turabian StyleFarkas, Dóra, Lajos Madarász, Zsombor K. Nagy, István Antal, and Nikolett Kállai-Szabó. 2021. "Image Analysis: A Versatile Tool in the Manufacturing and Quality Control of Pharmaceutical Dosage Forms" Pharmaceutics 13, no. 5: 685. https://doi.org/10.3390/pharmaceutics13050685