
Development and Validation of an HPLC–MS/MS Method for Pioglitazone from Nanocarriers Quantitation in Ex Vivo and In Vivo Ocular Tissues †

 , and
, and
Abstract
:1. Introduction
2. Materials and Methods
2.1. Chemicals and Reagents
2.2. Chromatographic Conditions
2.3. Pioglitazone Standards
2.4. Biological Material
2.5. Preparation of Pioglitazone Nanoparticles
2.6. Pioglitazone Solutions for Biological Matrix Spiking
2.7. Extraction Procedure
2.8. Method Validation
2.8.1. Selectivity and Specificity: Matrix Effect
2.8.2. Recovery
2.8.3. Dilution Integrity
2.8.4. Calibration Curve
2.8.5. Accuracy and Precision
2.8.6. Limits of Quantification (LOQ) and Detection (LOD)
2.8.7. Stability Experiments
2.9. Bioavailability Experiment: In Vivo
3. Results
3.1. Nanoparticle Preparation
3.2. Method Validation
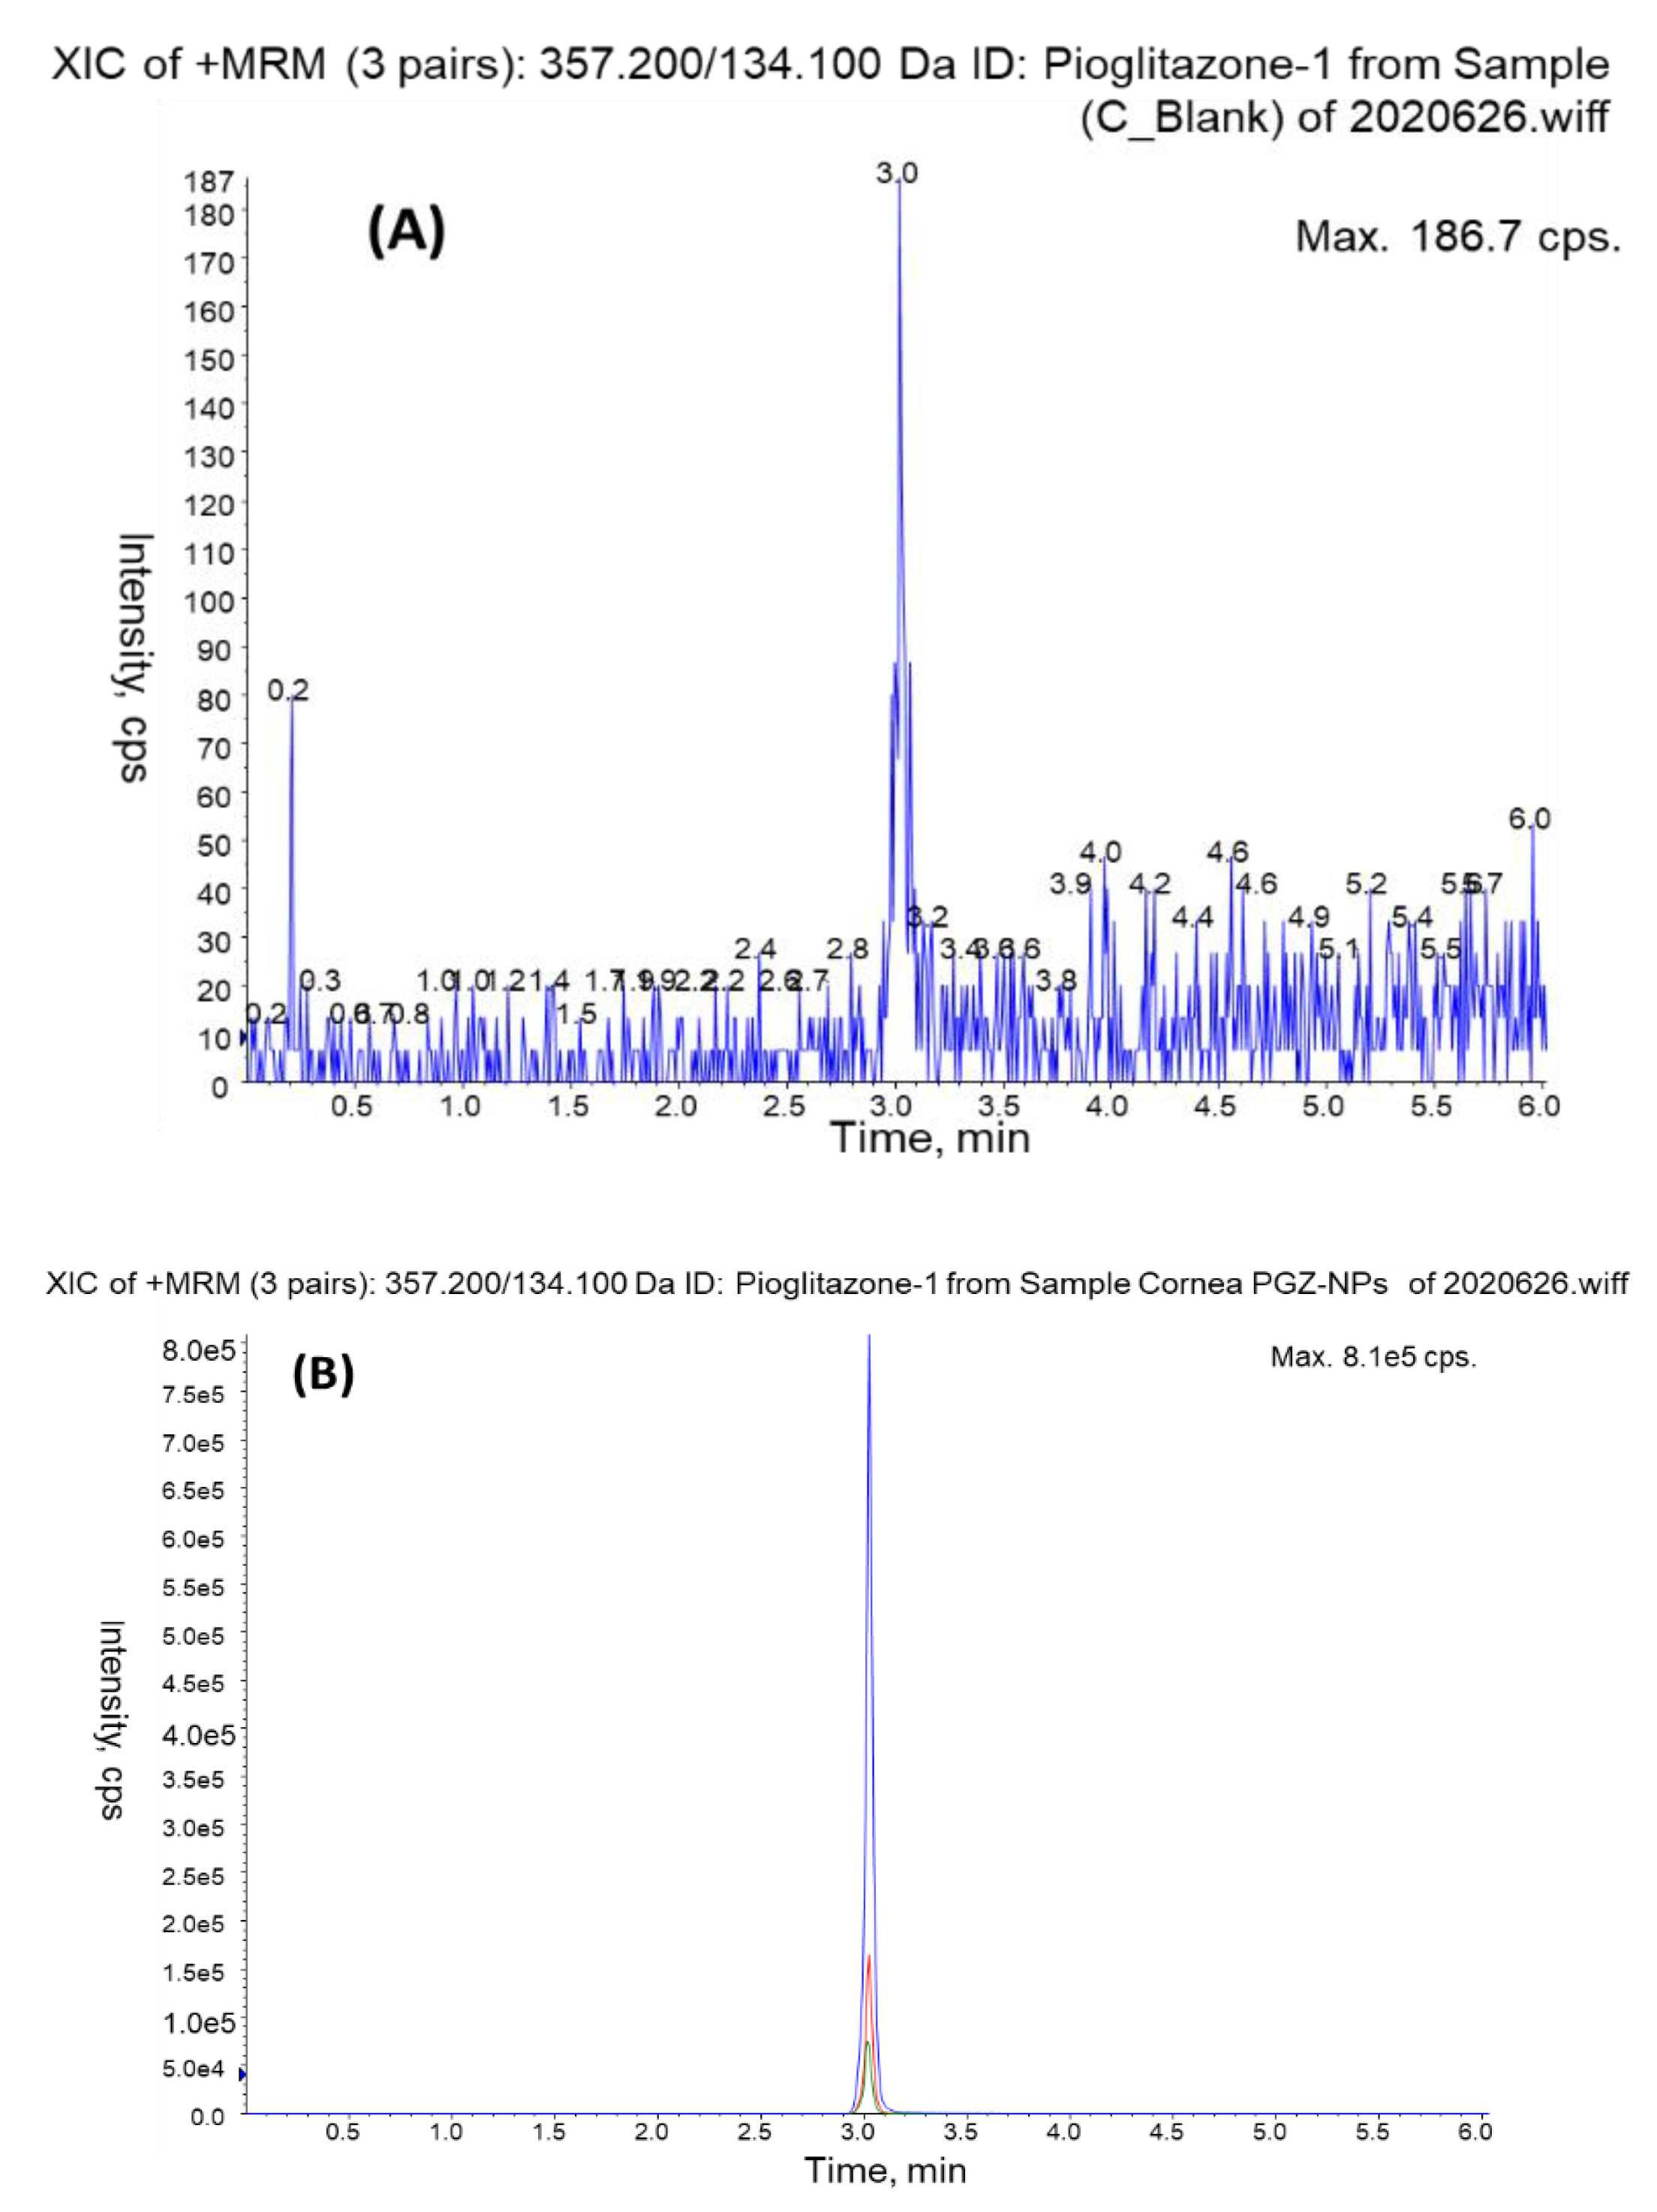
3.2.1. Selectivity and Specificity
3.2.2. Matrix Effect
3.2.3. Recovery
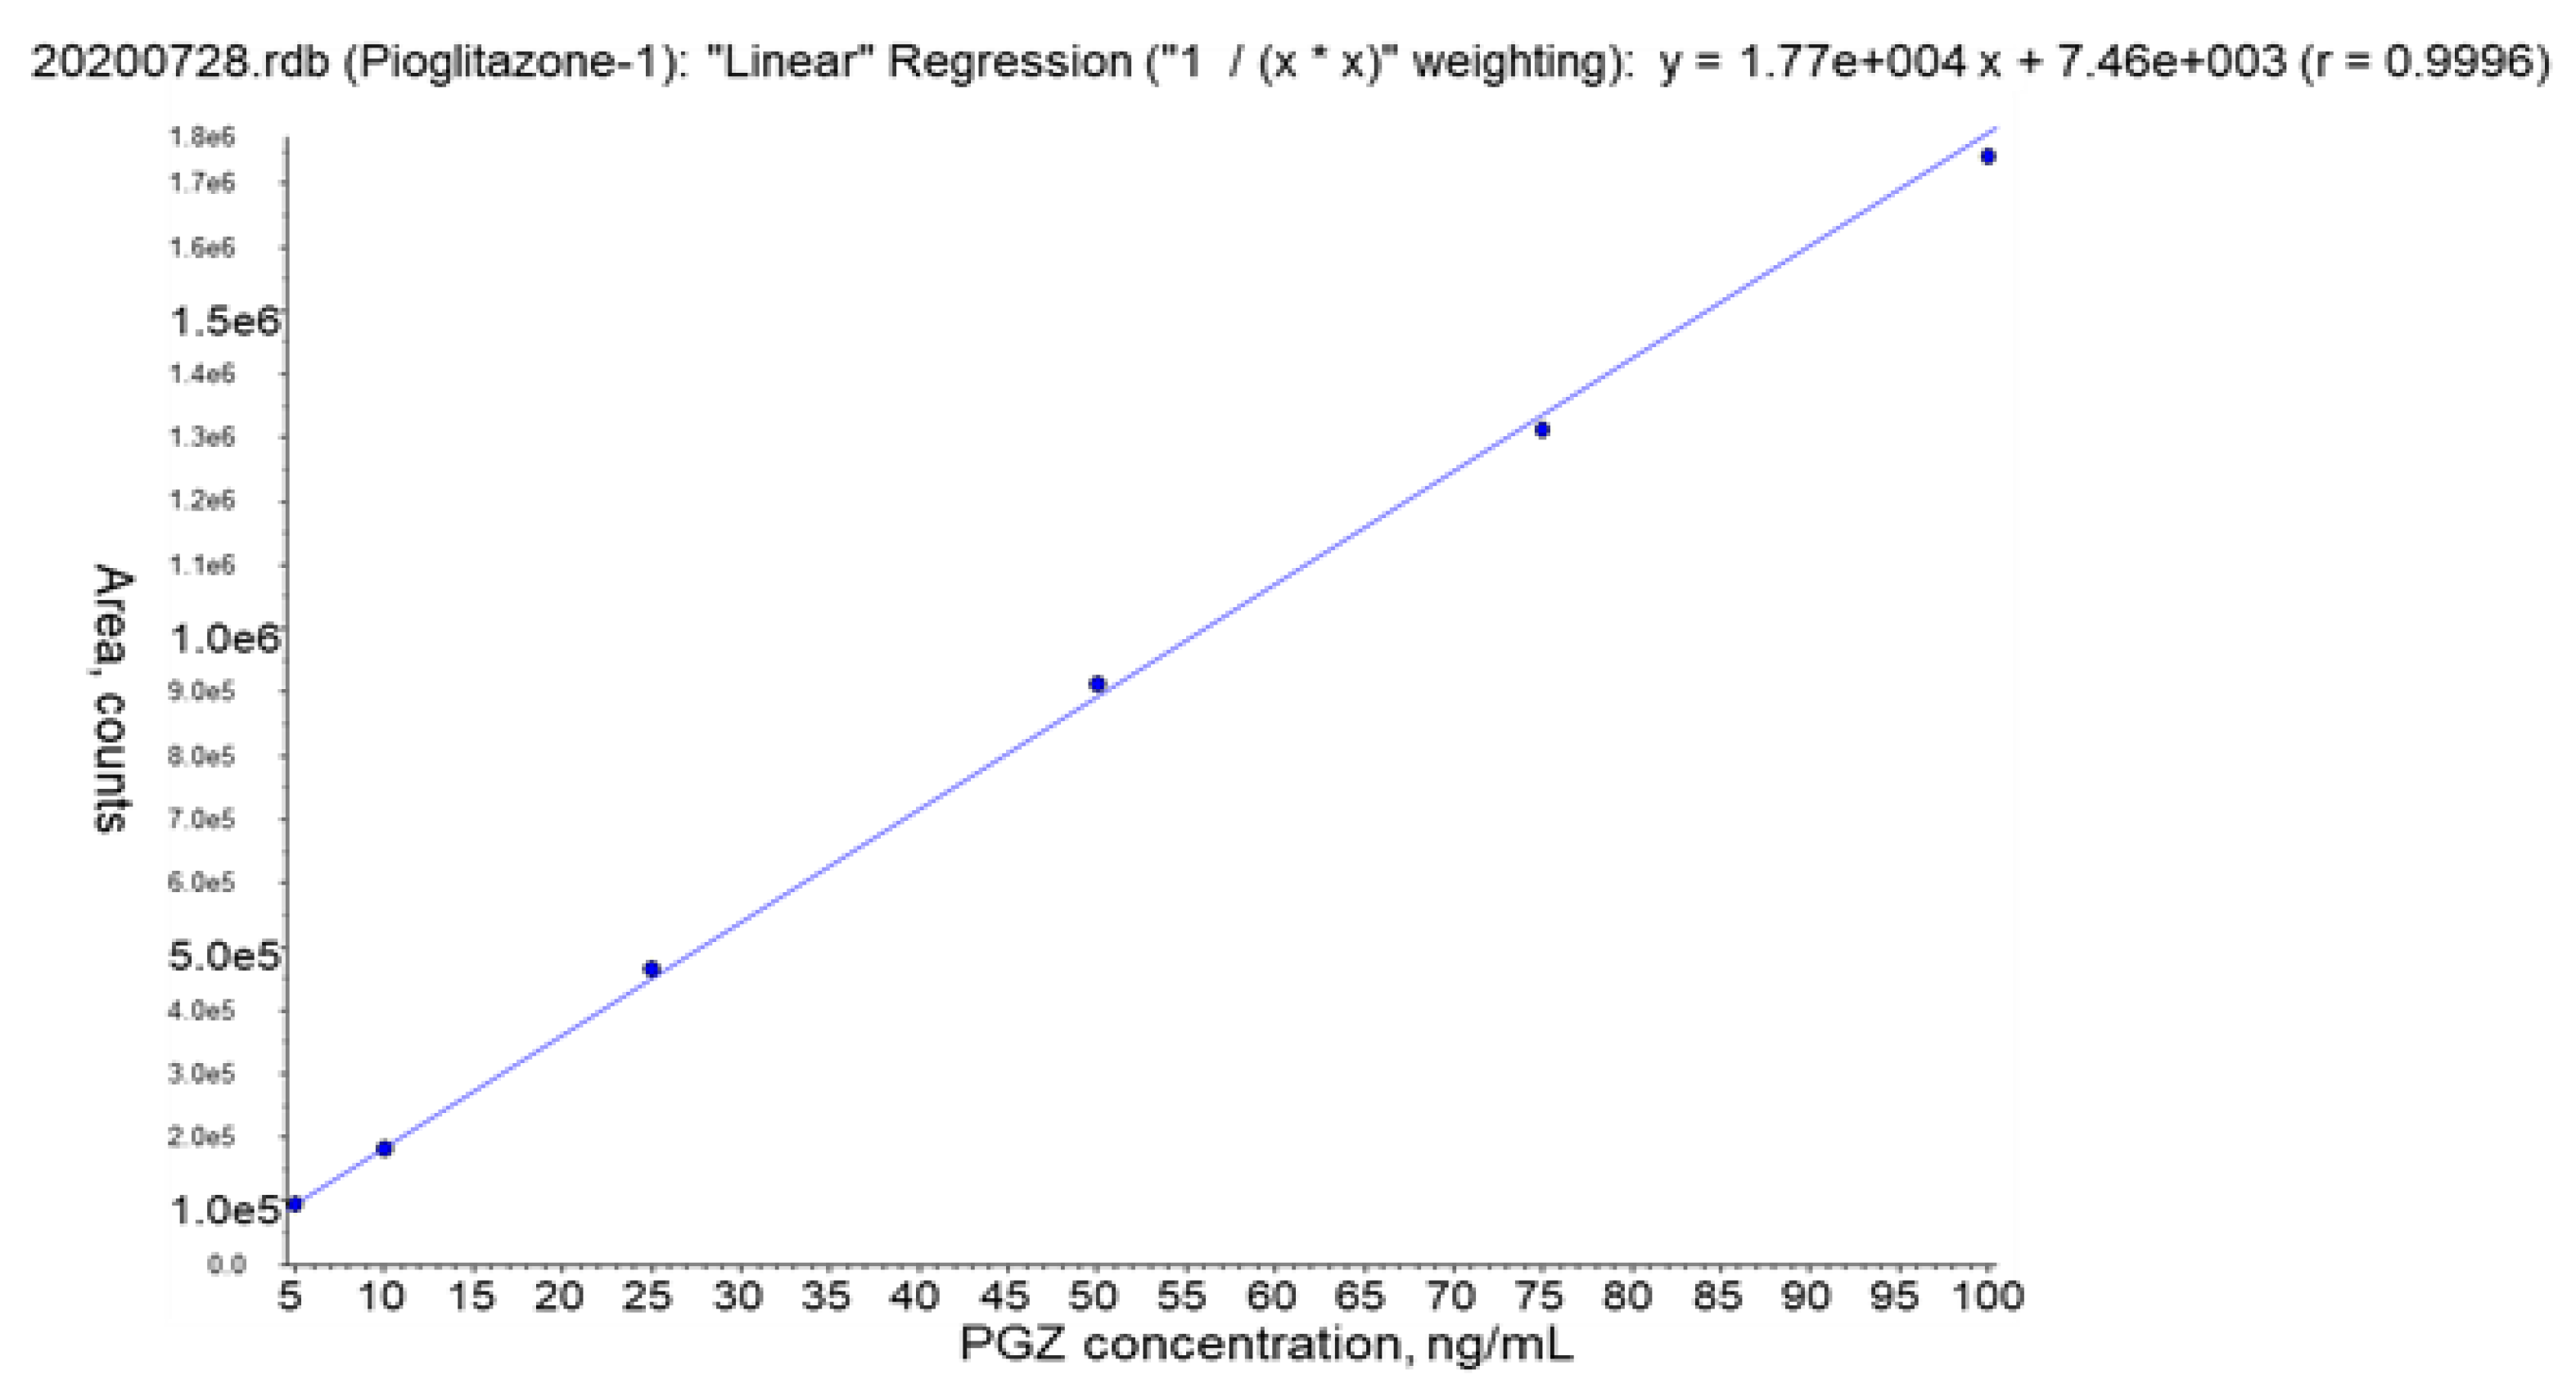
3.2.4. Calibration Curve
3.2.5. Accuracy and Precision
3.2.6. Dilution Integrity
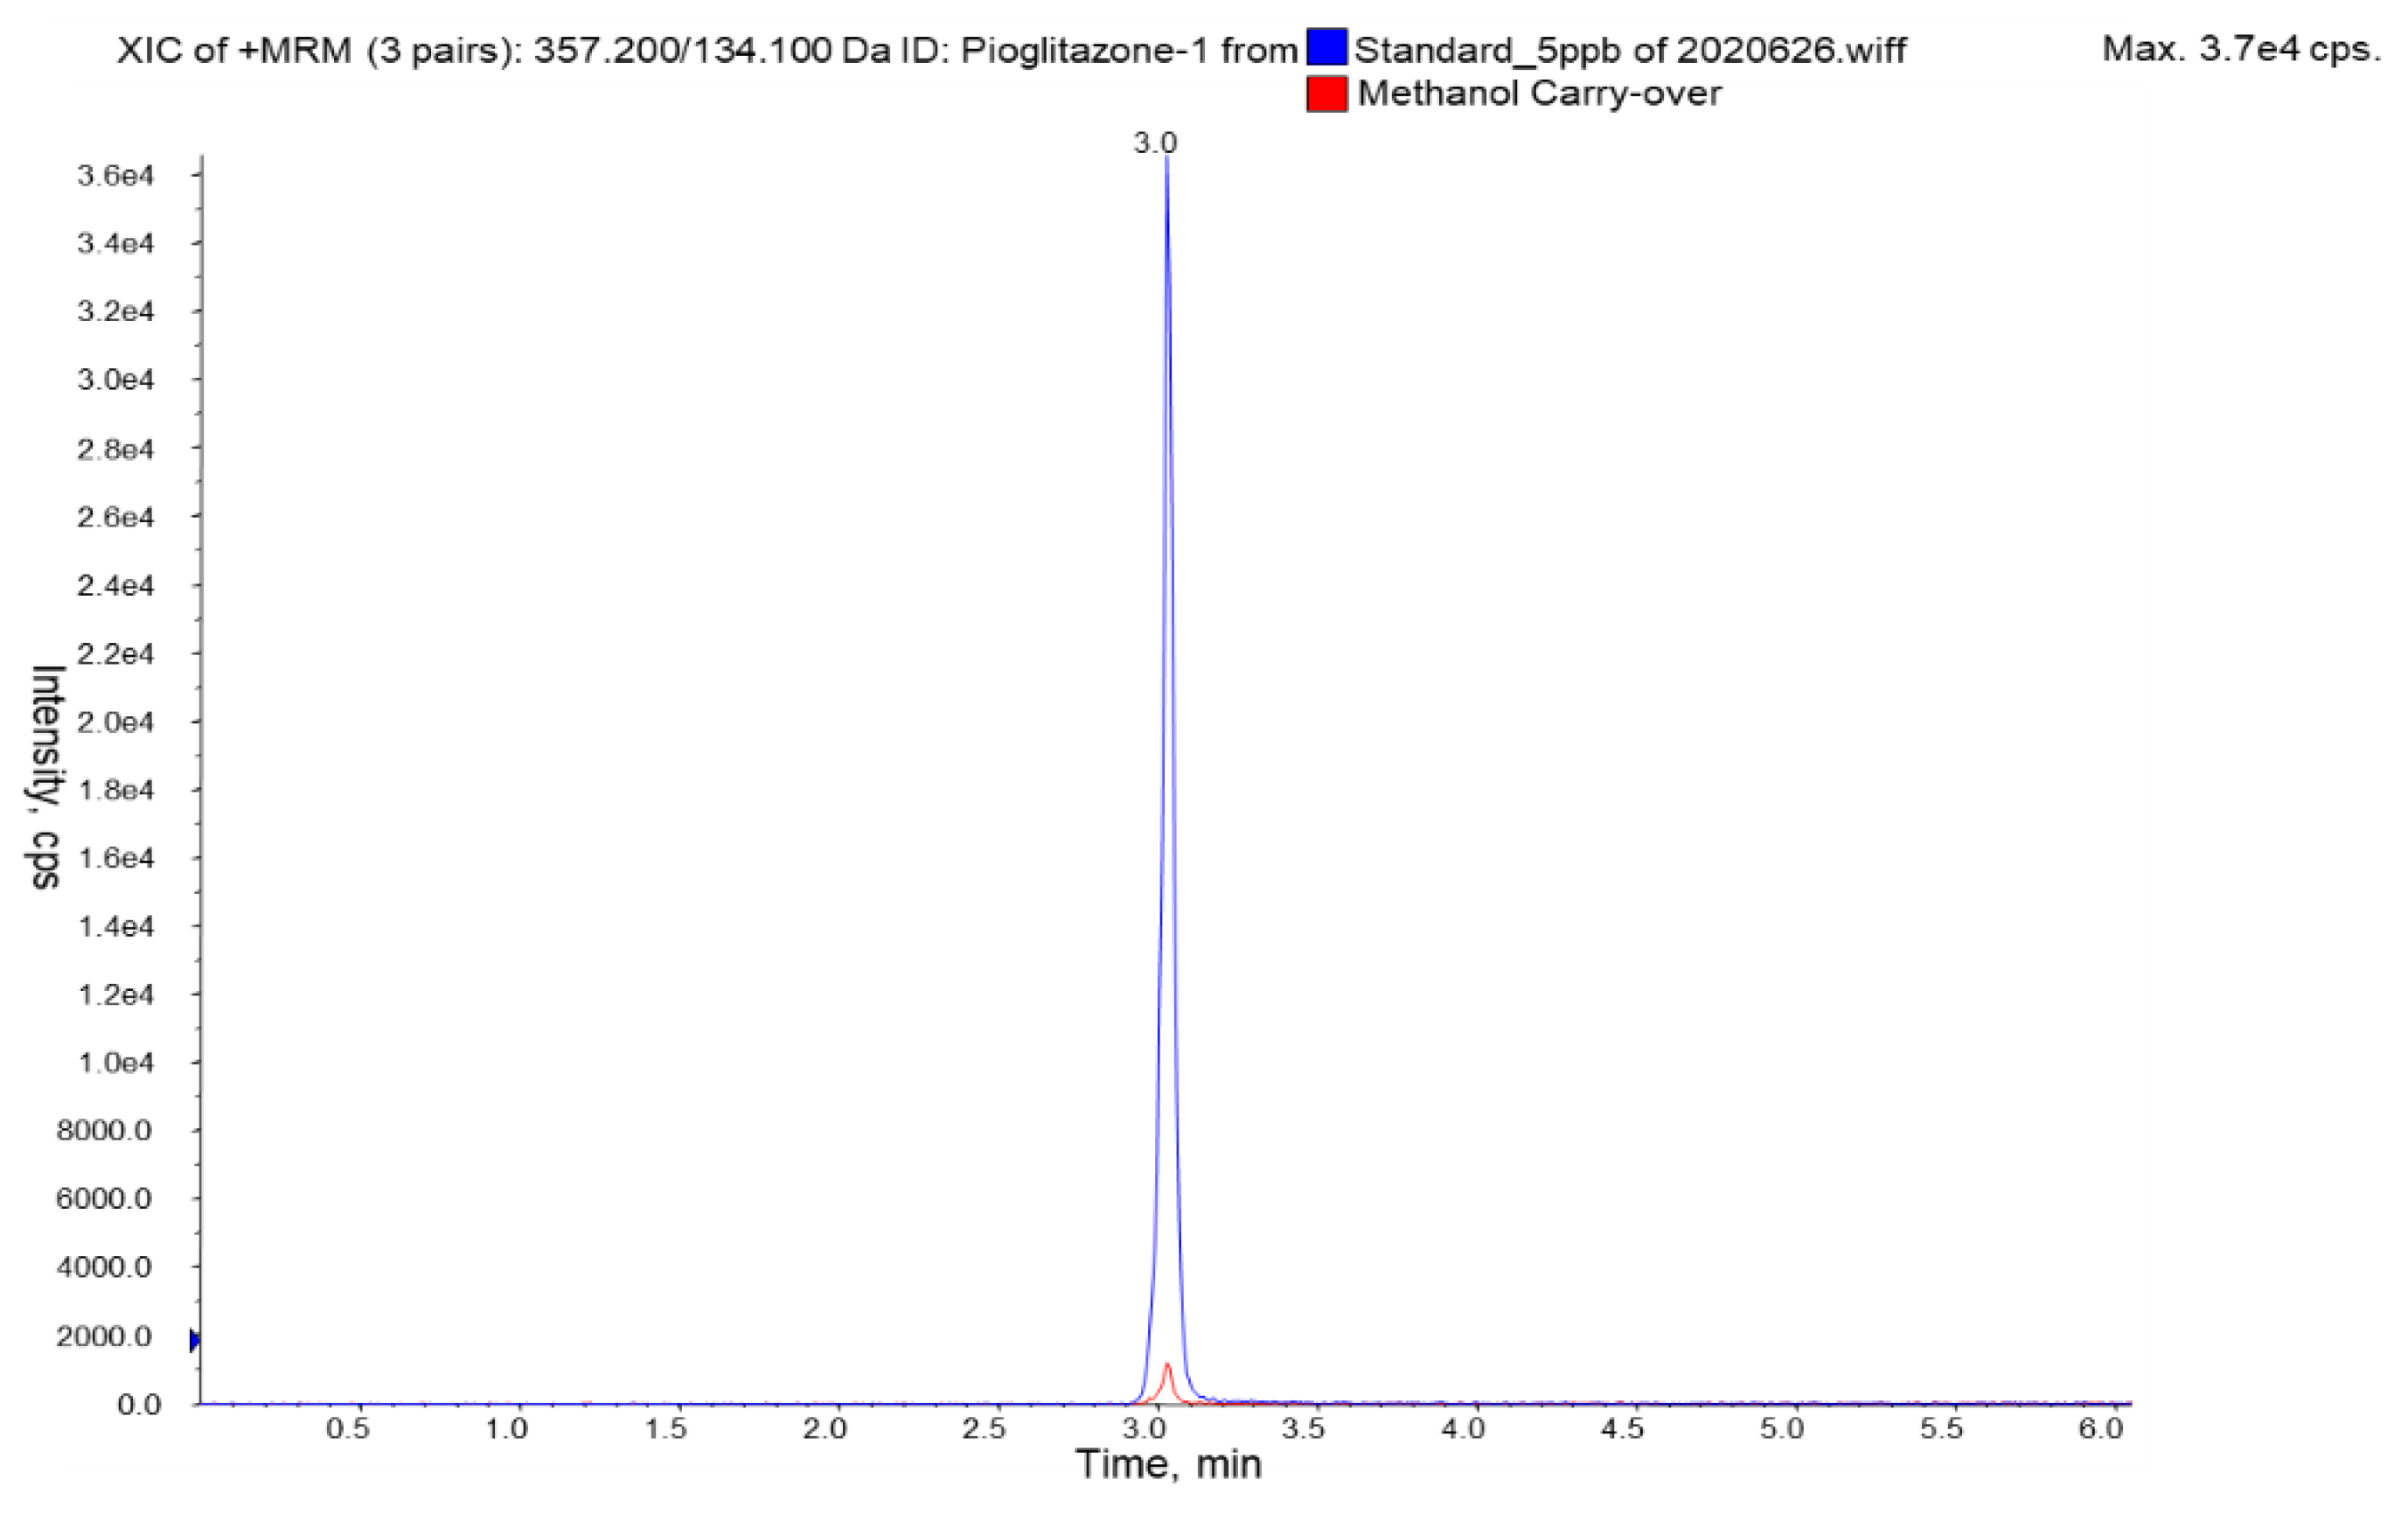
3.2.7. Carry-Over
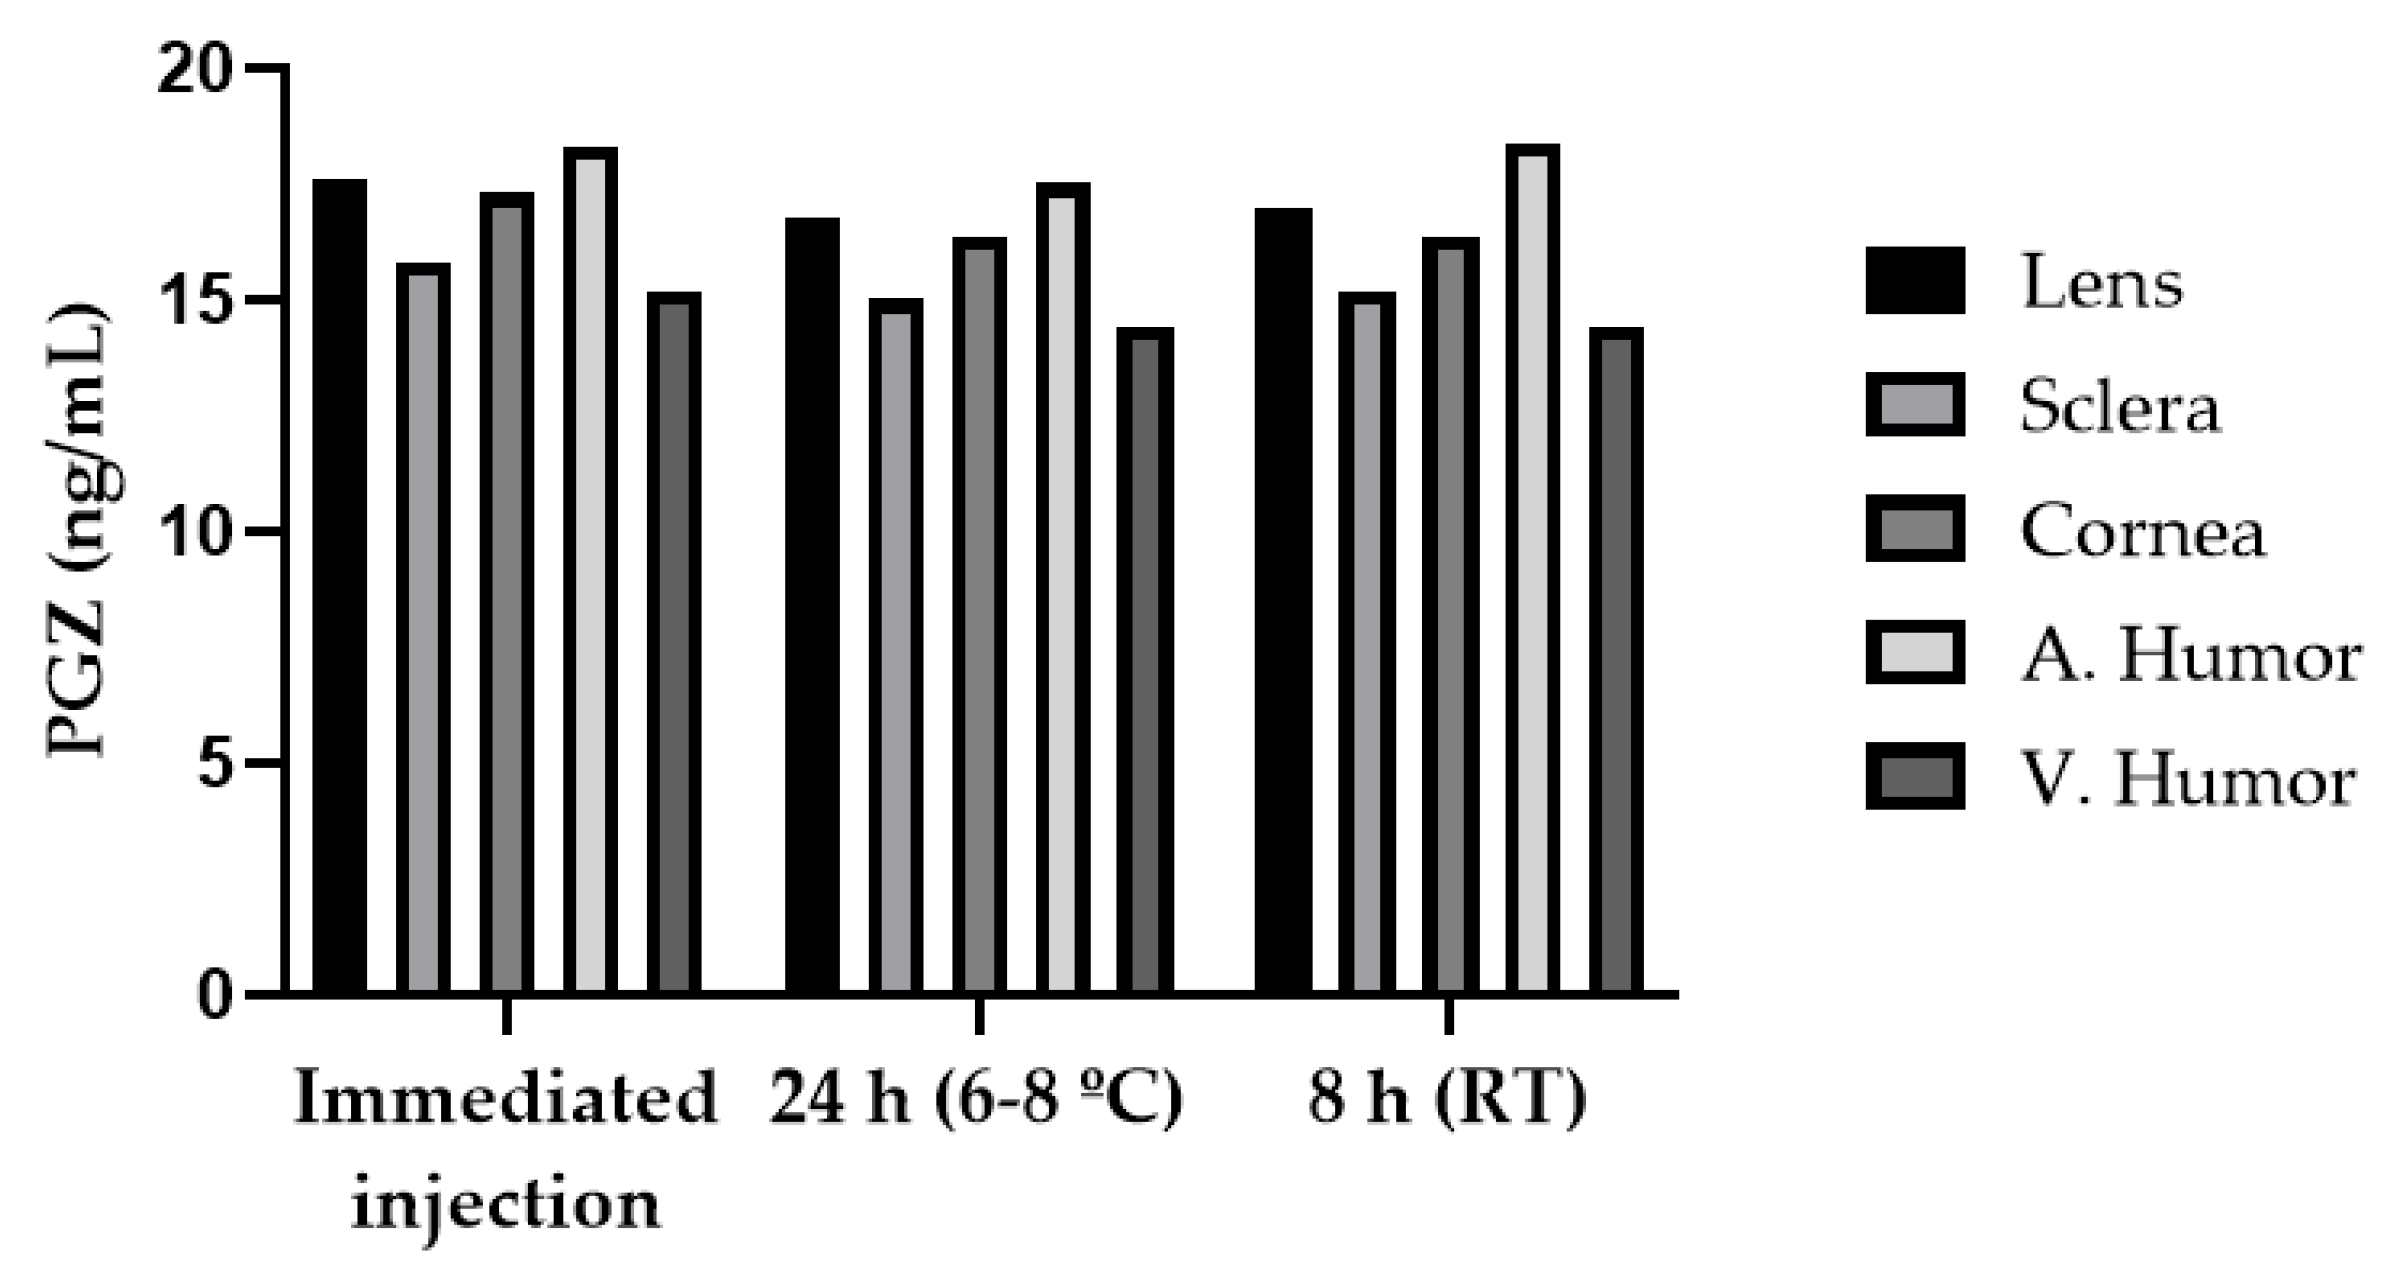
3.2.8. Stability
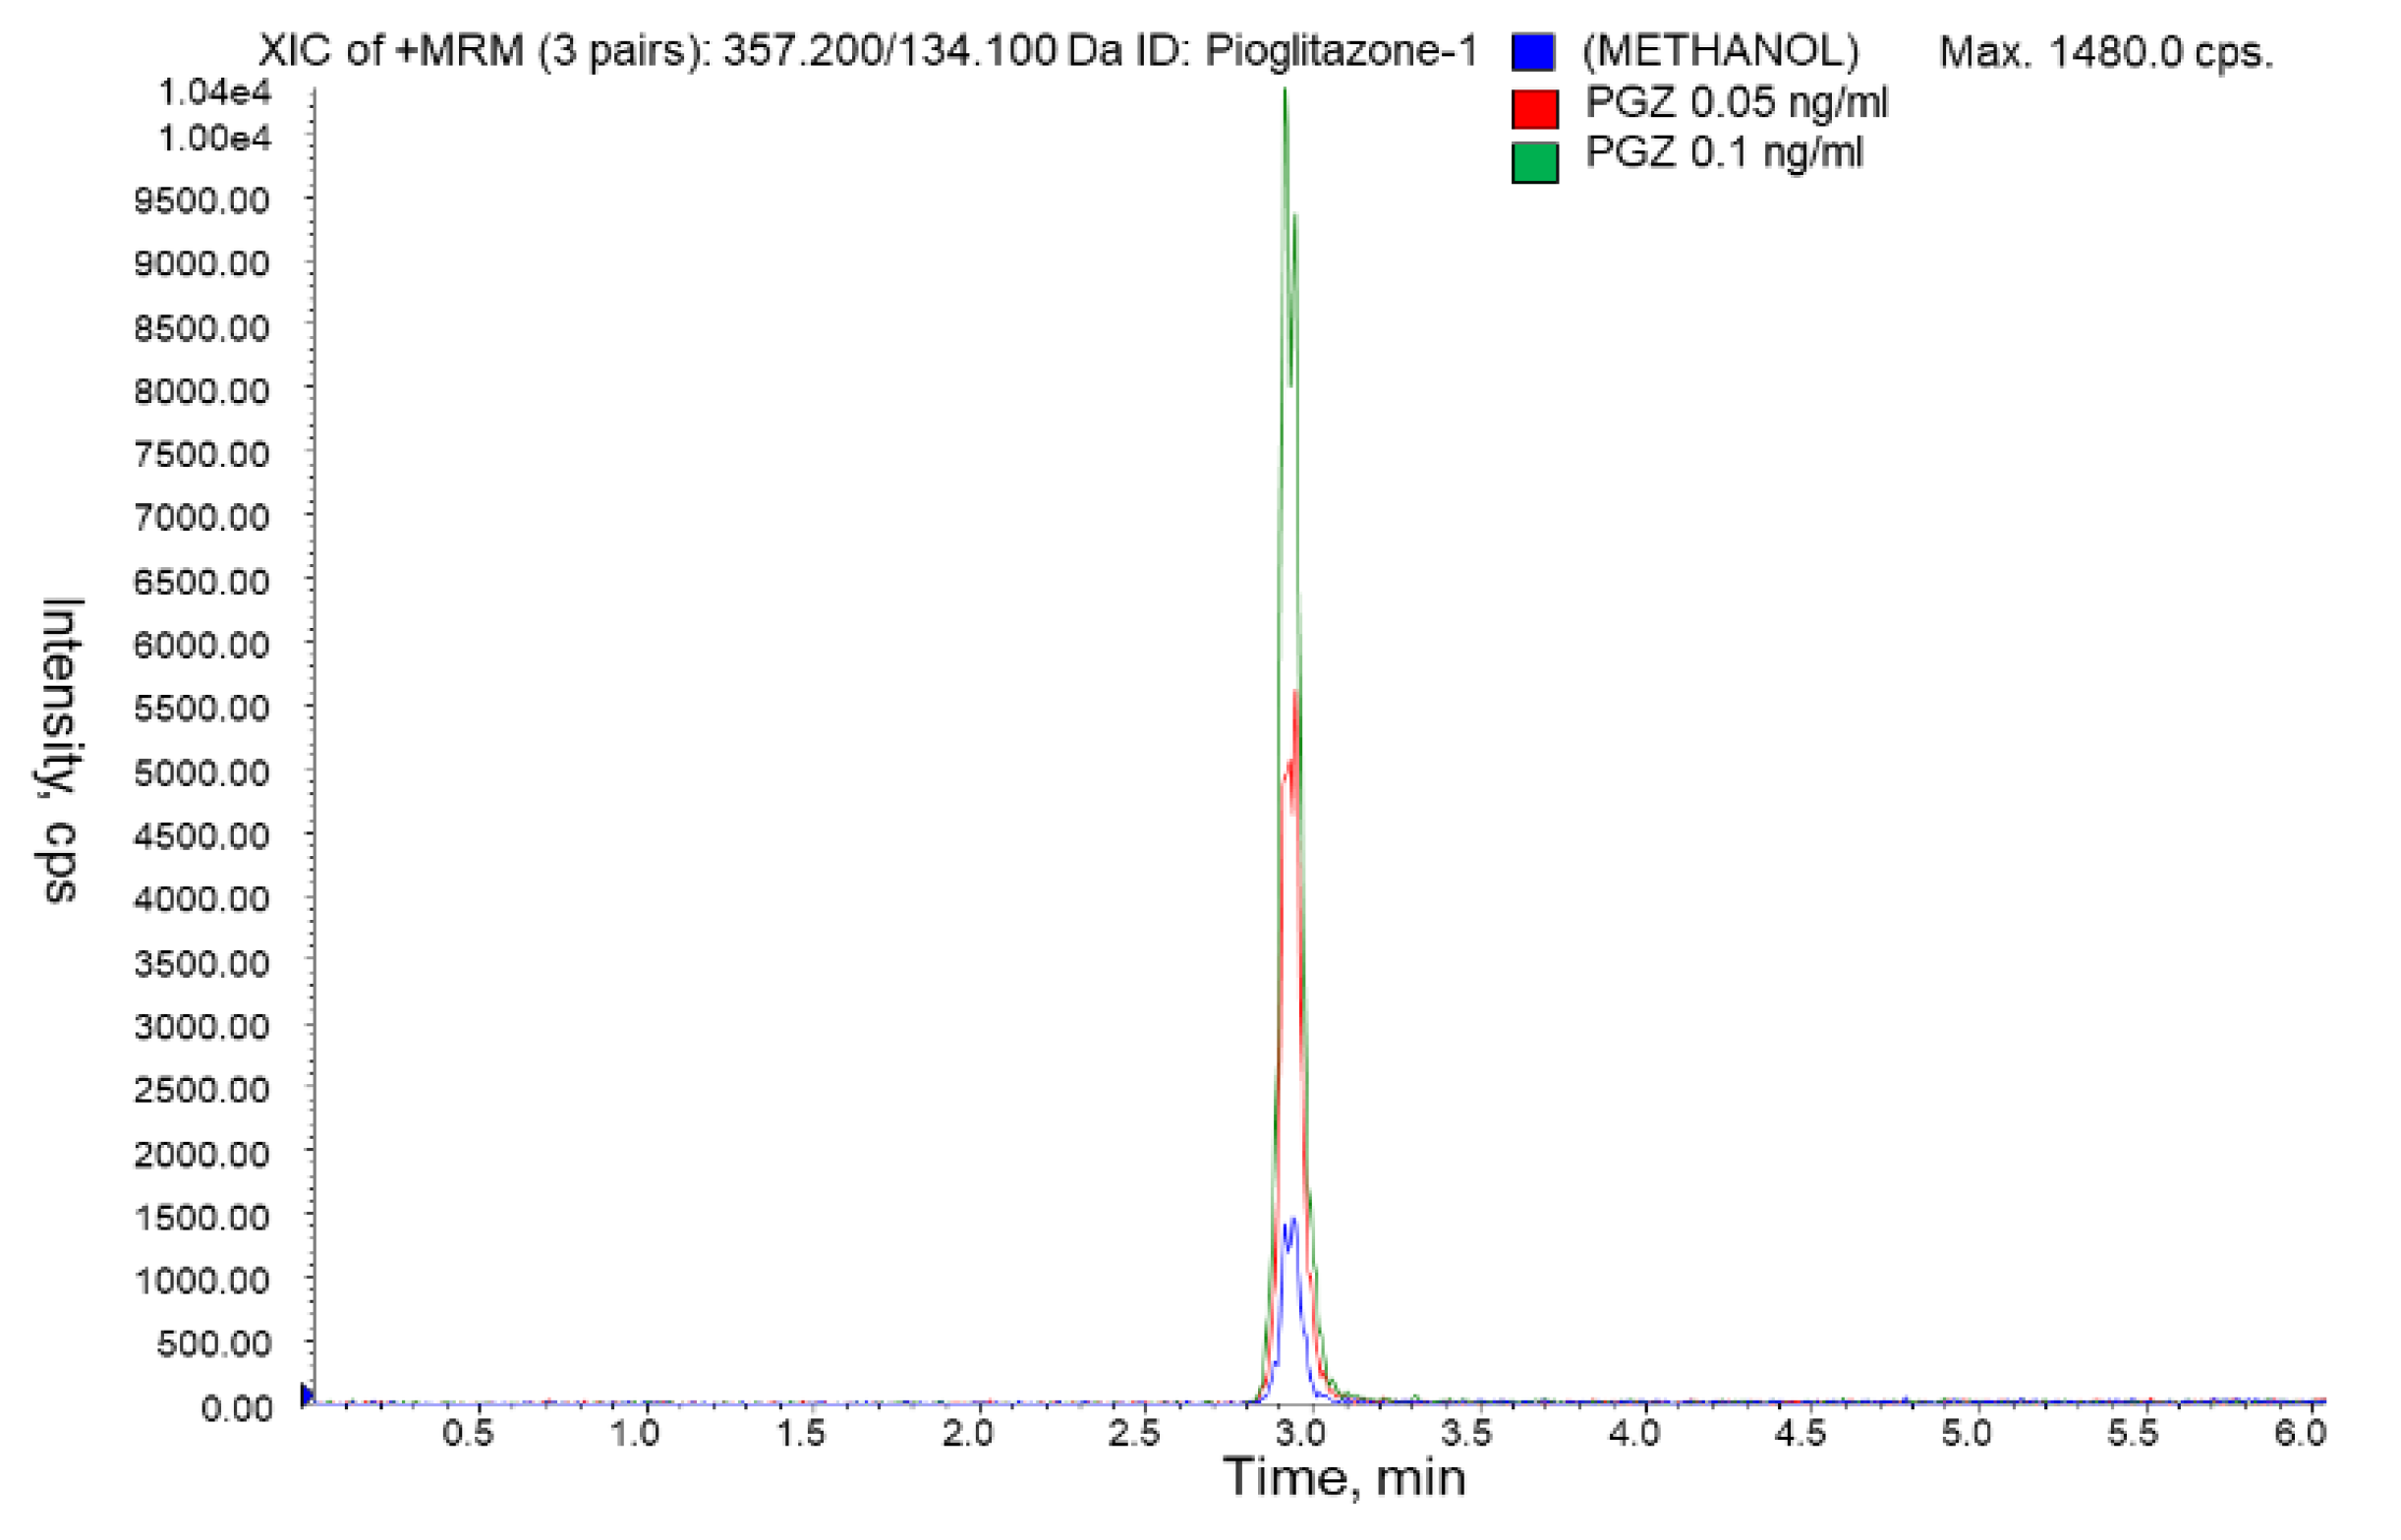
3.2.9. Limits of Quantification (LOQ) and Detection (LOD)
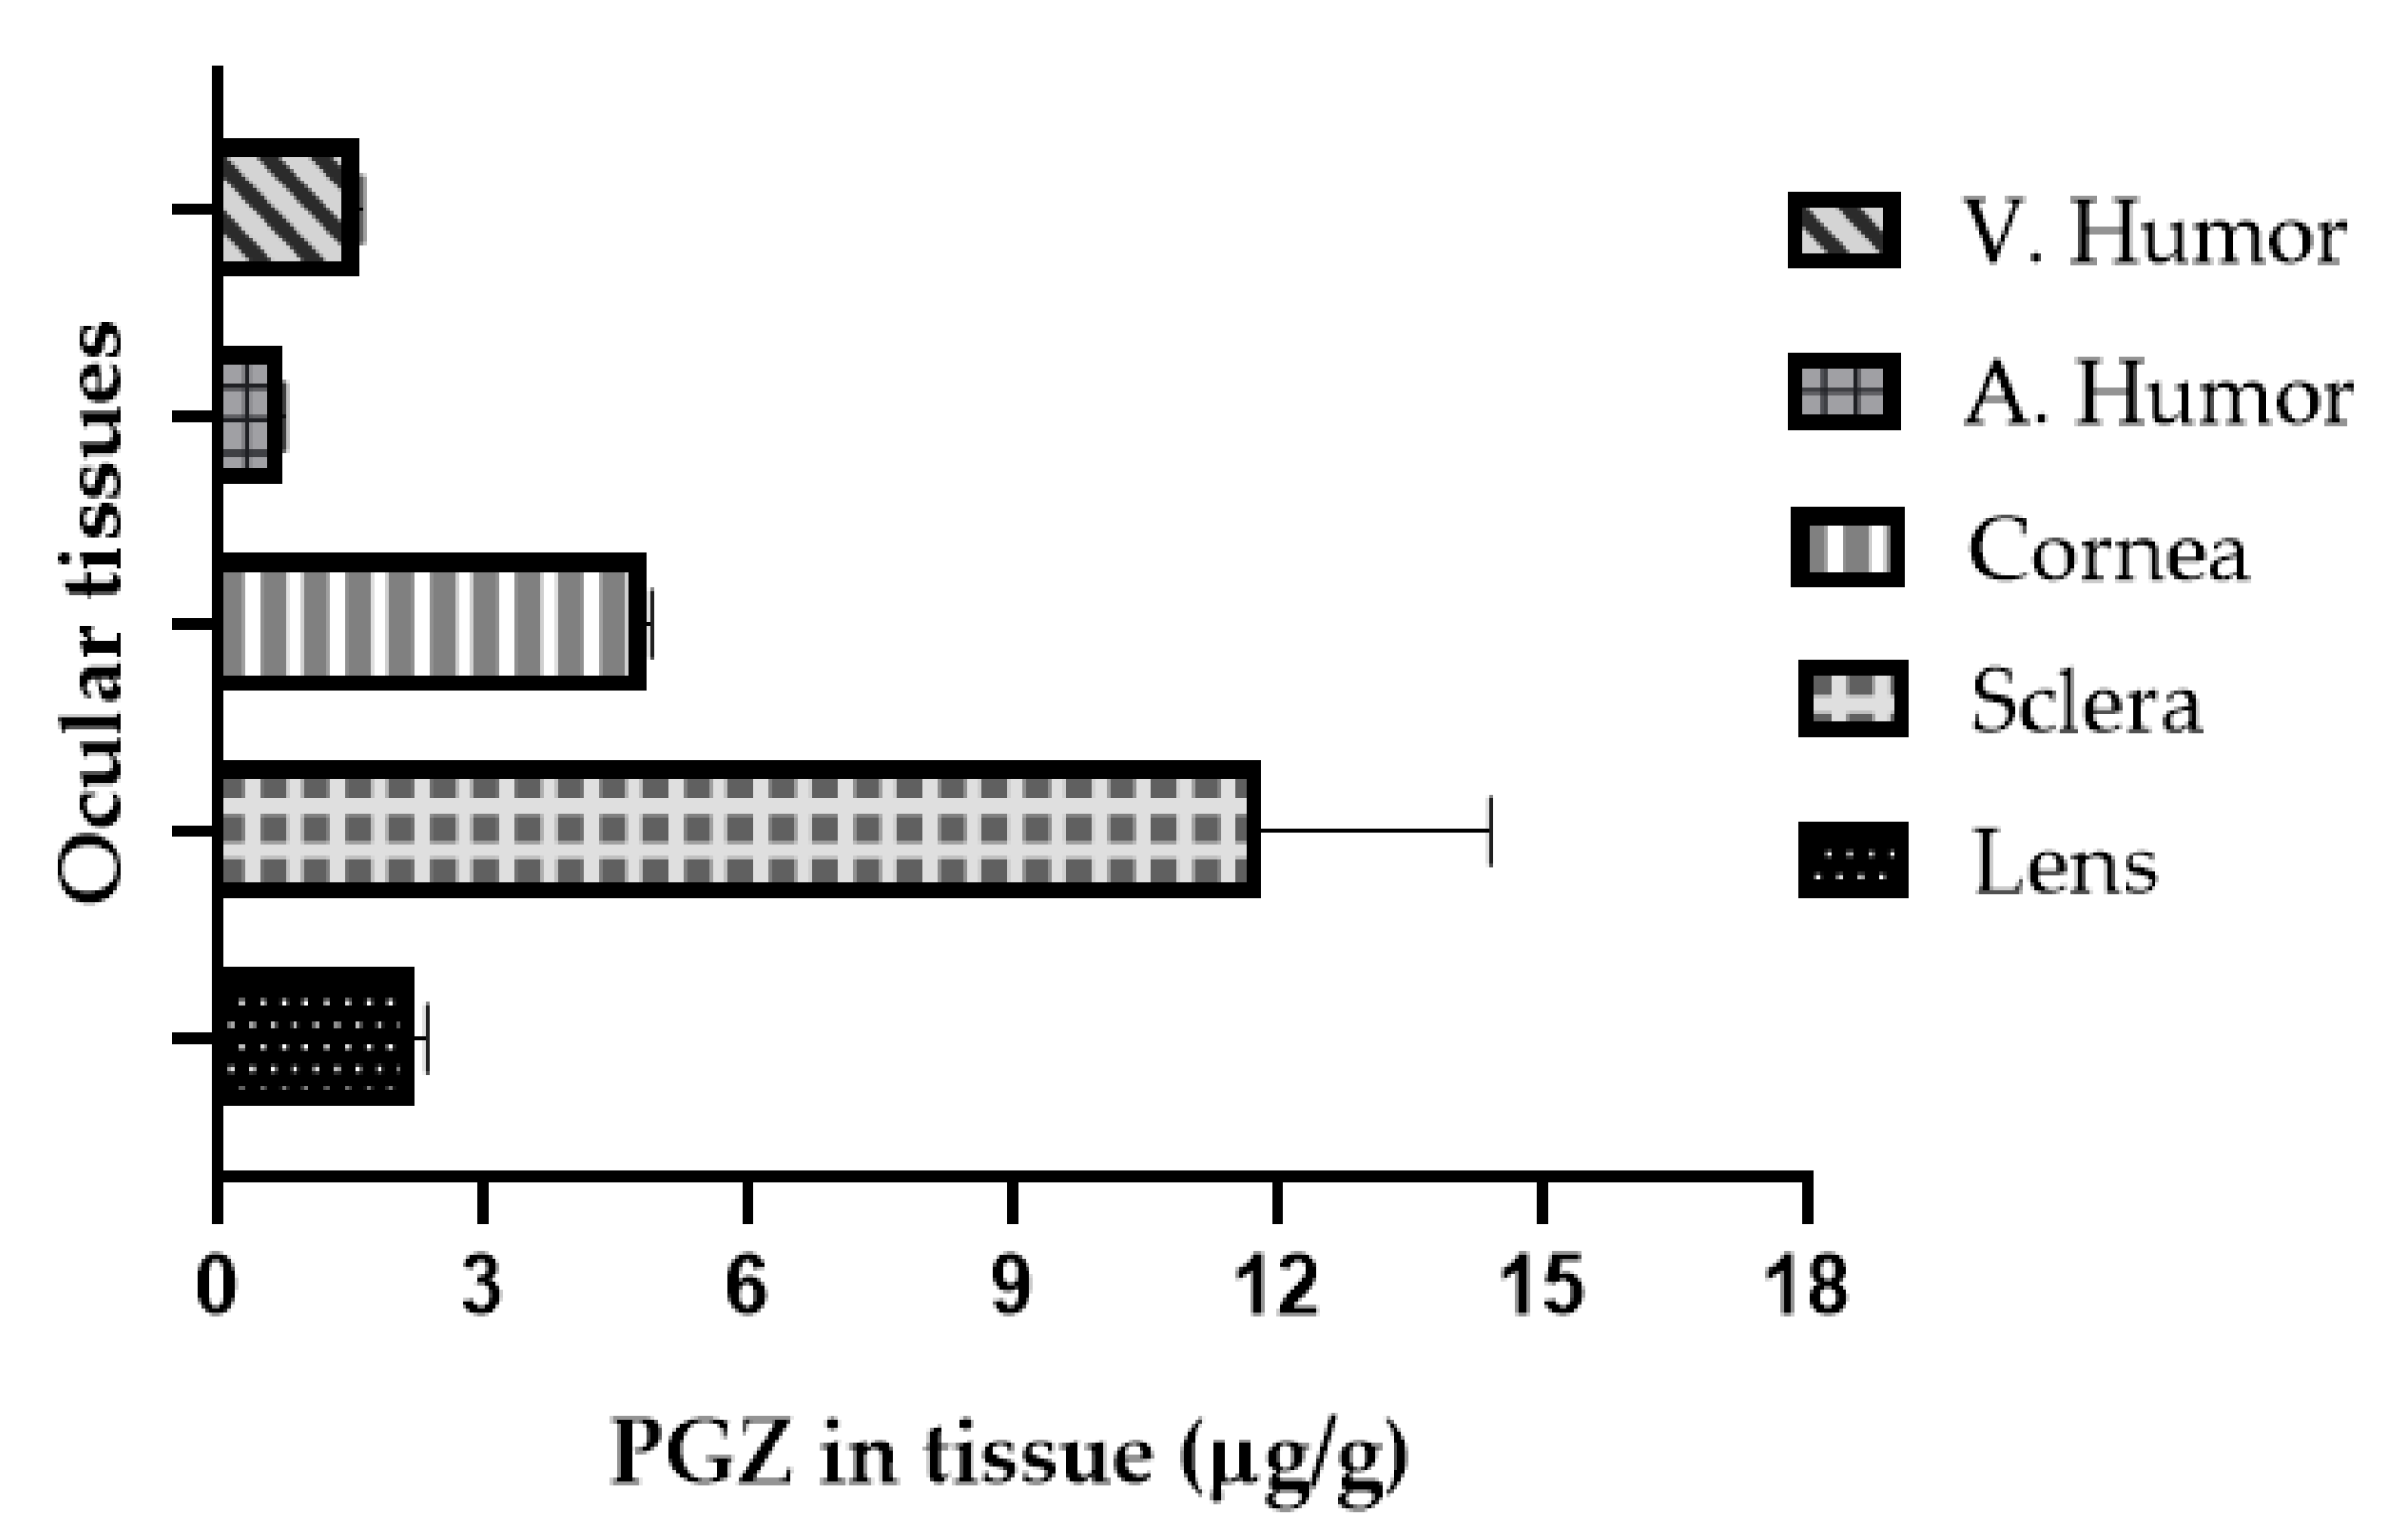
3.3. In Vivo Bioavailability Study
4. Discussion
Author Contributions
Funding
Institutional Review Board Statement
Informed Consent Statement
Data Availability Statement
Acknowledgments
Conflicts of Interest
References
- Miyazaki, Y.; Mahankali, A.; Matsuda, M.; Glass, L.; Mahankali, S.; Ferrannini, E.; Cusi, K.; Mandarino, L.J.; DeFronzo, R.A. Improved glycemic control and enhanced insulin sensitivity in type 2 diabetic subjects treated with pioglitazone. Diabetes Care 2001, 24, 710–719. [Google Scholar] [CrossRef] [Green Version]
- Lehrke, M.; Lazar, M.A. The many faces of PPARγ. Cell 2005, 123, 993–999. [Google Scholar] [CrossRef] [Green Version]
- Bouhlel, M.A.; Derudas, B.; Rigamonti, E.; Dièvart, R.; Brozek, J.; Haulon, S.; Zawadzki, C.; Jude, B.; Torpier, G.; Marx, N.; et al. PPARγ activation primes human monocytes into alternative M2 macrophages with anti-inflammatory properties. Cell Metab. 2007, 6, 137–143. [Google Scholar] [CrossRef] [PubMed] [Green Version]
- Chinetti, G.; Fruchart, J.C.; Staels, B. Peroxisome proliferator-activated receptors: New targets for the pharmacological modulation of macrophage gene expression and function. Curr. Opin. Lipidol. 2003, 14, 459–468. [Google Scholar] [CrossRef] [PubMed]
- Yamamoto, A.; Kakuta, H.; Miyachi, H.; Sugimoto, Y. Involvement of the retinoid X receptor ligand in the anti-inflammatory effect induced by peroxisome proliferator-activated receptor agonist in vivo. PPAR Res. 2011, 2011, 840194. [Google Scholar] [CrossRef] [PubMed] [Green Version]
- Tokutome, M.; Matoba, T.; Nakano, Y.; Okahara, A.; Fujiwara, M.; Koga, J.I.; Nakano, K.; Tsutsui, H.; Egashira, K. Peroxisome proliferator-activated receptor-gamma targeting nanomedicine promotes cardiac healing after acute myocardial infarction by skewing monocyte/macrophage polarization in preclinical animal models. Cardiovasc. Res. 2019, 115, 419–431. [Google Scholar] [CrossRef]
- Chang, K.; Francis, S.A.; Aikawa, E.; Figueiredo, J.L.; Kohler, R.H.; McCarthy, J.R.; Weissleder, R.; Plutzky, J.; Jaffer, F.A. Pioglitazone suppresses inflammation in vivo in murine carotid atherosclerosis: Novel detection by dual-target fluorescence molecular imaging. Arterioscler. Thromb. Vasc. Biol. 2010, 30, 1933–1939. [Google Scholar] [CrossRef] [PubMed] [Green Version]
- Matoba, T.; Koga, J.I.; Nakano, K.; Egashira, K.; Tsutsui, H. Nanoparticle-mediated drug delivery system for atherosclerotic cardiovascular disease. J. Cardiol. 2017, 70, 206–211. [Google Scholar] [CrossRef] [Green Version]
- Silva-Abreu, M.; Espinoza, L.C.; Rodríguez-Lagunas, M.J.; Fábrega, M.J.; Espina, M.; García, M.L.; Calpena, A.C. Human skin permeation studies with PPARγ agonist to improve its permeability and efficacy in inflammatory processes. Int. J. Mol. Sci. 2017, 18, 2548. [Google Scholar] [CrossRef] [PubMed] [Green Version]
- Kanemaru, M.; Asai, J.; Jo, J.I.; Arita, T.; Kawai-Ohnishi, M.; Tsutsumi, M.; Wada, M.; Tabata, Y.; Katoh, N. Nanoparticle-mediated local delivery of pioglitazone attenuates bleomycin-induced skin fibrosis. J. Dermatol. Sci. 2019, 93, 41–49. [Google Scholar] [CrossRef] [Green Version]
- Okunuki, Y.; Usui, Y.; Nakagawa, H.; Tajima, K.; Matsuda, R.; Ueda, S.; Hattori, T.; Kezuka, T.; Goto, H. Peroxisome proliferator-activated receptor-γ agonist pioglitazone suppresses experimental autoimmune uveitis. Exp. Eye Res. 2013, 116, 291–297. [Google Scholar] [CrossRef]
- Silva-Abreu, M.; Calpena, A.C.; Espina, M.; Silva, A.M.; Gimeno, A.; Egea, M.A.; García, M.L. Optimization, biopharmaceutical profile and therapeutic efficacy of pioglitazone-loaded PLGA-PEG nanospheres as a novel strategy for ocular inflammatory disorders. Pharm. Res. 2018, 35, 11. [Google Scholar] [CrossRef] [Green Version]
- Uchiyama, M.; Shimizu, A.; Masuda, Y.; Nagasaka, S.; Fukuda, Y.; Takahashi, H. An ophthalmic solution of a peroxisome proliferator-activated receptor gamma agonist prevents corneal inflammation in a rat alkali burn model. Mol. Vis. 2013, 19, 2135–2150. [Google Scholar]
- Aoki, Y.; Maeno, T.; Aoyagi, K.; Ueno, M.; Aoki, F.; Aoki, N.; Nakagawa, J.; Sando, Y.; Shimizu, Y.; Suga, T.; et al. Pioglitazone, a peroxisome proliferator-activated receptor gamma ligand, suppresses bleomycin-induced acute lung injury and fibrosis. Respiration 2009, 77, 311–319. [Google Scholar] [CrossRef]
- Pan, H.; Chen, J.; Xu, J.; Chen, M.; Ma, R. Antifibrotic effect by activation of peroxisome proliferator-activated receptor-gamma in corneal fibroblasts. Mol. Vis. 2009, 15, 2279–2286. [Google Scholar] [PubMed]
- Zhang, Y.X.; Zhang, M.C. Inhibitory effects of pioglitazone on alkaline burn induced corneal neovascularization in rats. Int. J. Ophthalmol. 2007, 7, 1202–1205. [Google Scholar]
- Laddha, U.D.; Kshirsagar, S.J. Formulation of nanoparticles loaded in situ gel for treatment of dry eye disease: In vitro, ex vivo and in vivo evidences. J. Drug Deliv. Sci. Technol. 2021, 61, 102112. [Google Scholar] [CrossRef]
- Silva-Abreu, M.; Gonzalez-Pizarro, R.; Espinoza, L.C.; Rodríguez-Lagunas, M.J.; Espina, M.; García, M.L.; Calpena, A.C. Thiazolidinedione as an alternative to facilitate oral administration in geriatric patients with Alzheimer’s disease. Eur. J. Pharm. Sci. 2019, 129, 173–180. [Google Scholar] [CrossRef]
- Wong, L.R.; Wong, P.; Ho, P.C.L. Metabolic profiling of female tg2576 mouse brains provides novel evidence supporting intranasal low-dose pioglitazone for long-term treatment at an early stage of alzheimer’s disease. Biomedicines 2020, 8, 589. [Google Scholar] [CrossRef]
- Jojo, G.M.; Kuppusamy, G. Scope of new formulation approaches in the repurposing of pioglitazone for the management of Alzheimer’s disease. J. Clin. Pharm. Ther. 2019, 44, 337–348. [Google Scholar] [CrossRef] [PubMed] [Green Version]
- Mehta, M. Biopharmaceutics Classification System (BCS): Development, Implementation, and Growth; Wiley: Hoboken, NJ, USA, 2016; ISBN 978-1-118-47661-1. [Google Scholar]
- Silva-Abreu, M.; Calpena, A.C.; Andrés-Benito, P.; Aso, E.; Romero, I.A.; Roig-Carles, D.; Gromnicova, R.; Espina, M.; Ferrer, I.; García, M.L.; et al. PPARγ agonist-loaded PLGA-PEG nanocarriers as a potential treatment for Alzheimer’s disease: In vitro and in vivo studies. Int. J. Nanomed. 2018, 13, 5577–5590. [Google Scholar] [CrossRef] [Green Version]
- Jojo, G.M.; Kuppusamy, G.; De, A.; Karri, V.V.S.N.R. Formulation and optimization of intranasal nanolipid carriers of pioglitazone for the repurposing in Alzheimer’s disease using Box-Behnken design. Drug Dev. Ind. Pharm. 2019, 45, 1061–1072. [Google Scholar] [CrossRef] [PubMed]
- Sakai, S.; Sato, K.; Tabata, Y.; Kishi, K. Local release of pioglitazone (a peroxisome proliferator-activated receptor γ agonist) accelerates proliferation and remodeling phases of wound healing. Wound Repair Regen. 2016, 24, 57–64. [Google Scholar] [CrossRef] [PubMed] [Green Version]
- Espinoza, L.C.; Silva-Abreu, M.; Calpena, A.C.; Rodríguez-Lagunas, M.J.; Fábrega, M.J.; Garduño-Ramírez, M.L.; Clares, B. Nanoemulsion strategy of pioglitazone for the treatment of skin inflammatory diseases. Nanomed. Nanotechnol. Biol. Med. 2019, 19, 115–125. [Google Scholar] [CrossRef] [PubMed]
- Anderson, J.M.; Shive, M.S. Biodegradation and biocompatibility of PLA and PLGA microspheres. Adv. Drug Deliv. Rev. 1997, 28, 2–24. [Google Scholar] [CrossRef]
- Danhier, F.; Ansorena, E.; Silva, J.M.; Coco, R.; Le Breton, A.; Préat, V. PLGA-based nanoparticles: An overview of biomedical applications. J. Control. Release 2012, 161, 505–522. [Google Scholar] [CrossRef] [PubMed]
- Kim, K.T.; Lee, J.Y.; Kim, D.D.; Yoon, I.S.; Cho, H.J. Recent progress in the development of poly(lactic-co-glycolic acid)-based nanostructures for cancer imaging and therapy. Pharmaceutics 2019, 11, 280. [Google Scholar] [CrossRef] [PubMed] [Green Version]
- Rezvantalab, S.; Drude, N.I.; Moraveji, M.K.; Güvener, N.; Koons, E.K.; Shi, Y.; Lammers, T.; Kiessling, F. PLGA-based nanoparticles in cancer treatment. Front. Pharmacol. 2018, 9, 1–19. [Google Scholar] [CrossRef] [Green Version]
- Mir, M.; Ahmed, N.; Rehman, A. Ur Recent applications of PLGA based nanostructures in drug delivery. Colloids Surf. B Biointerfaces 2017, 159, 217–231. [Google Scholar] [CrossRef]
- Tornesello, A.L.; Tagliamonte, M.; Tornesello, M.L.; Buonaguro, F.M.; Buonaguro, L. Nanoparticles to improve the efficacy of peptide-based cancer vaccines. Cancers 2020, 20, 1049. [Google Scholar] [CrossRef]
- Guterres, S.S.; Alves, M.P.; Pohlmann, A.R. Polymeric nanoparticles, nanospheres and nanocapsules, for cutaneous applications. Drug Target Insights 2007, 2, 147–157. [Google Scholar] [CrossRef] [PubMed] [Green Version]
- Gonzalez-Pizarro, R.; Silva-Abreu, M.; Calpena, A.C.; Egea, M.A.; Espina, M.; García, M.L. Development of fluorometholone-loaded PLGA nanoparticles for treatment of inflammatory disorders of anterior and posterior segments of the eye. Int. J. Pharm. 2018, 547, 338–346. [Google Scholar] [CrossRef] [Green Version]
- Arafa, M.G.; Girgis, G.N.S.; El-Dahan, M.S. Chitosan-coated PLGA nanoparticles for enhanced ocular anti-inflammatory efficacy of atorvastatin calcium. Int. J. Nanomed. 2020, 15, 1335–1347. [Google Scholar] [CrossRef] [PubMed] [Green Version]
- Phm, T.L.; Kim, D.W. Poly(lactic-co-glycolic acid) nanomaterial-based treatment options for pain management: A review. Nanomedicine 2020, 15, 1897–1913. [Google Scholar] [CrossRef] [PubMed]
- Suk, J.S.; Xu, Q.; Kim, N.; Hanes, J.; Ensign, L.M. PEGylation as a strategy for improving nanoparticle-based drug and gene delivery. Adv. Drug Deliv. Rev. 2016, 99, 28–51. [Google Scholar] [CrossRef] [PubMed] [Green Version]
- Bachu, R.D.; Chowdhury, P.; Al-Saedi, Z.H.F.; Karla, P.K.; Boddu, S.H.S. Ocular drug delivery barriers—Role of nanocarriers in the treatment of anterior segment ocular diseases. Pharmaceutics 2018, 10, 28. [Google Scholar] [CrossRef] [PubMed] [Green Version]
- Ghafoorianfar, S.; Ghorani-Azam, A.; Mohajeri, S.A.; Farzin, D. Efficiency of nanoparticles for treatment of ocular infections: Systematic literature review. J. Drug Deliv. Sci. Technol. 2020, 57, 101765. [Google Scholar] [CrossRef]
- Agarwal, R.; Iezhitsa, I.; Agarwal, P.; Abdul Nasir, N.A.; Razali, N.; Alyautdin, R.; Ismail, N.M. Liposomes in topical ophthalmic drug delivery: An update. Drug Deliv. 2016, 23, 1075–1091. [Google Scholar] [CrossRef]
- Karn, P.R.; Do Kim, H.; Kang, H.; Sun, B.K.; Jin, S.E.; Hwang, S.J. Supercritical fluid-mediated liposomes containing cyclosporin A for the treatment of dry eye syndrome in a rabbit model: Comparative study with the conventional cyclosporin A emulsion. Int. J. Nanomed. 2014, 9, 3791–3800. [Google Scholar] [CrossRef] [Green Version]
- Luis de Redín, I.; Boiero, C.; Martínez-Ohárriz, M.C.; Agüeros, M.; Ramos, R.; Peñuelas, I.; Allemandi, D.; Llabot, J.M.; Irache, J.M. Human serum albumin nanoparticles for ocular delivery of bevacizumab. Int. J. Pharm. 2018, 541, 214–223. [Google Scholar] [CrossRef]
- Silva, B.; Marto, J.; Braz, B.S.; Delgado, E.; Almeida, A.J.; Gonçalves, L. New nanoparticles for topical ocular delivery of erythropoietin. Int. J. Pharm. 2020, 576, 119020. [Google Scholar] [CrossRef]
- Abrego, G.; Alvarado, H.; Souto, E.B.; Guevara, B.; Bellowa, L.H.; Parra, A.; Calpena, A.; Garcia, M.L. Biopharmaceutical profile of pranoprofen-loaded PLGA nanoparticles containing hydrogels for ocular administration. Eur. J. Pharm. Biopharm. 2015, 95, 261–270. [Google Scholar] [CrossRef] [PubMed] [Green Version]
- Cañadas, C.; Alvarado, H.; Calpena, A.C.; Silva, A.M.; Souto, E.B.; García, M.L.; Abrego, G. In vitro, ex vivo and in vivo characterization of PLGA nanoparticles loading pranoprofen for ocular administration. Int. J. Pharm. 2016, 511, 719–727. [Google Scholar] [CrossRef] [PubMed]
- Parra, A.; Mallandrich, M.; Clares, B.; Egea, M.A.; Espina, M.; García, M.L.; Calpena, A.C. Biointerfaces Design and elaboration of freeze-dried PLGA nanoparticles for the transcorneal permeation of carprofen: Ocular anti-inflammatory applications. Colloids Surf. B 2015, 136, 935–943. [Google Scholar] [CrossRef] [PubMed]
- Sánchez-López, E.; Esteruelas, G.; Ortiz, A.; Espina, M.; Prat, J.; Muñoz, M.; Cano, A.; Calpena, A.C.; Ettcheto, M.; Camins, A.; et al. Article dexibuprofen biodegradable nanoparticles: One step closer towards a better ocular interaction study. Nanomaterials 2020, 10, 720. [Google Scholar] [CrossRef] [Green Version]
- Silva-Abreu, M.; Espinoza, L.C.; Halbaut, L.; Espina, M.; García, M.L.; Calpena, A.C. Comparative study of Ex Vivo transmucosal permeation of pioglitazone nanoparticles for the treatment of Alzheimer’s disease. Polymers 2018, 10, 316. [Google Scholar] [CrossRef] [Green Version]
- European Medicines Agency. EMA/CHMP/ICH/172948/2019. ICH Guideline M10 on Bioanalytical Method Validation. 2019. Available online: https://www.ema.europa.eu/en/ich-m10-bioanalytical-method-validation (accessed on 7 January 2021).
- U.S. Food and Drug Administration. Bioanalytical Method Validation, Guidance for Industry; U.S. Food and Drug Administration: Silver Spring, MD, USA, 2018.
- Fessi, H.; Puisieux, F.; Devissaguet, J.P.; Ammoury, N.; Benita, S. Nanocapsule formation by interfacial polymer deposition following solvent displacement. Int. J. Pharm. 1989, 55. [Google Scholar] [CrossRef]
- Almeida, A.M.; Castel-Branco, M.M.; Falcão, A.C. Linear regression for calibration lines revisited: Weighting schemes for bioanalytical methods. J. Chromatogr. B Anal. Technol. Biomed. Life Sci. 2002, 774. [Google Scholar] [CrossRef]
- ICH. Validation of Analytical Procedures: Text and Methodology, Q2(R1). 2005. Available online: https://www.ich.org (accessed on 20 January 2021).
- Sengupta, P.; Chatterjee, B.; Mandal, U.K.; Gorain, B.; Pal, T.K. Development and validation of a high throughput LC–MS/MS method for simultaneous quantitation of pioglitazone and telmisartan in rat plasma and its application to a pharmacokinetic study. J. Pharm. Anal. 2017, 7, 381–387. [Google Scholar] [CrossRef]
- Satheeshkumar, N.; Shantikumar, S.; Srinivas, R. Pioglitazone: A review of analytical methods. J. Pharm. Anal. 2014, 4, 295–302. [Google Scholar] [CrossRef] [Green Version]


| PGZ Matrix Condition | Mean Found (ng/mL) | SD | CV (%) | Variation (%) |
|---|---|---|---|---|
| Methanol | 51.8 | 0.56 | 1.07 | - |
| Sclera extract | 54.6 | 1.65 | 3.02 | +5.34 |
| Cornea extract | 53.5 | 1.47 | 2.75 | +3.12 |
| Lens extract | 52.2 | 0.55 | 1.06 | +0.69 |
| Aqueous humor extract | 52.5 | 0.20 | 0.38 | +1.34 |
| Vitreous humor extract | 49.0 | 1.10 | 2.24 | −5.27 |
| Level of Concentration in Extract | Recovery (%) | ||||
|---|---|---|---|---|---|
| ng/mL | Lens | Cornea | Sclera | Aqueous Humor | Vitreous Humor |
| 10 | 89.0 ± 1.9 * CV (%) = 2.1 | 96.9 ± 0.5 CV (%) = 0.5 | 97.7 ± 3.3 CV (%) = 3.4 | 92.2 ± 0.4 CV (%) = 0.4 | 89.5 ± 1.6 CV (%) = 1.7 |
| 20 | 85.0 ± 1.4 CV (%) = 1.7 | 100.9 ± 2.2 CV (%) = 2.2 | 98.5 ± 2.7 CV (%) = 2.7 | 91.6 ± 1.2 CV (%) = 1.3 | 89.4 ± 0.4 CV (%) = 0.4 |
| 100 | 85.2 ± 0.5 CV (%) = 0.6 | 93.9 ± 3.2 CV (%) = 3.4 | 88.4 ± 2.7 CV (%) = 3.1 | 86.4 ± 1.1 CV (%) = 1.3 | 86.7 ± 1.7 CV (%) = 1.9 |
| 2500 | 109.6 ± 3.8 CV (%) = 3.5 | 85.0 ± 0.7 CV (%) = 0.8 | 88.0 ± 0.4 CV (%) = 0.4 | 97.2 ±1.8 CV (%) = 1.9 | 99.6 ± 0.4 CV (%) = 0.4 |
| Level Concentration in Extract | Recovery (%) | ||||
|---|---|---|---|---|---|
| ng/mL | Lens | Cornea | Sclera | Aqueous Humor | Vitreous Humor |
| 10 | 93.1 ± 4.9 * CV (%) = 5.2 | 97.8 ± 1.5 CV (%) = 1.5 | 89.7 ± 7.9 CV (%) = 8.8 | 92.3 ± 8.4 CV (%) = 9.1 | 98.3 ± 6.7 CV (%) = 6.8 |
| 20 | 91.8 ± 5.3 CV (%) = 5.8 | 97.4 ± 3.1 CV (%) = 3.2 | 89.1 ± 8.2 CV (%) = 9.2 | 92.5 ± 5.7 CV (%) = 6.2 | 98.5 ± 6.9 CV (%) = 7.0 |
| 100 | 87.8 ± 2.2 CV (%) = 2.4 | 93.0 ± 6.9 CV (%) = 7.4 | 85.0 ± 3.1 CV (%) = 3.6 | 87.7 ± 4.8 CV (%) = 5.4 | 92.3 ± 4.3 CV (%) = 4.7 |
| Tissue | Nominal Concentration in Extract | ||||
|---|---|---|---|---|---|
| Added (ng/mL) | Found (ng/mL) | SD | CV (%) | Recovery (%) | |
| Lens | 8.4 | 7.2 | 0.2 | 2.7 | 85.9 |
| 17.5 | 18.9 | 0.6 | 3.0 | 108.0 | |
| 87.7 | 90.2 | 1.9 | 2.2 | 102.8 | |
| 2094 | 2294.6 | 79.2 | 3.5 | 109.6 | |
| Cornea | 8.4 | 7.8 | 0.3 | 4.0 | 93.0 |
| 16.8 | 15.5 | 0.2 | 1.1 | 92.1 | |
| 84.2 | 76.0 | 1.4 | 1.8 | 90.2 | |
| 2094 | 1779.1 | 13.6 | 0.8 | 85.0 | |
| Sclera | 8.4 | 7.8 | 0.3 | 3.7 | 92.0 |
| 16.8 | 16.0 | 0.4 | 2.4 | 94.9 | |
| 84.2 | 74.6 | 0.9 | 1.3 | 88.5 | |
| 2094 | 1842.8 | 7.6 | 0.4 | 88.0 | |
| Aqueous | 7.4 | 6.4 | 0.3 | 4.2 | 87.4 |
| Humor | 14.8 | 12.6 | 0.2 | 1.3 | 85.2 |
| 73.8 | 62.9 | 0.4 | 0.7 | 85.3 | |
| 1931 | 2139.0 | 40.1 | 1.9 | 110.8 | |
| Vitreous | 7.4 | 7.3 | 0.4 | 6.1 | 99.1 |
| humor | 14.8 | 14.6 | 0.3 | 2.0 | 98.8 |
| 73.8 | 70.7 | 1.8 | 2.5 | 95.8 | |
| 1937 | 1925.3 | 7.2 | 0.4 | 99.4 | |
Publisher’s Note: MDPI stays neutral with regard to jurisdictional claims in published maps and institutional affiliations. |
© 2021 by the authors. Licensee MDPI, Basel, Switzerland. This article is an open access article distributed under the terms and conditions of the Creative Commons Attribution (CC BY) license (https://creativecommons.org/licenses/by/4.0/).
Share and Cite
Miralles-Cardiel, E.; Silva-Abreu, M.; Calpena, A.C.; Casals, I. Development and Validation of an HPLC–MS/MS Method for Pioglitazone from Nanocarriers Quantitation in Ex Vivo and In Vivo Ocular Tissues. Pharmaceutics 2021, 13, 650. https://doi.org/10.3390/pharmaceutics13050650
Miralles-Cardiel E, Silva-Abreu M, Calpena AC, Casals I. Development and Validation of an HPLC–MS/MS Method for Pioglitazone from Nanocarriers Quantitation in Ex Vivo and In Vivo Ocular Tissues. Pharmaceutics. 2021; 13(5):650. https://doi.org/10.3390/pharmaceutics13050650
Chicago/Turabian StyleMiralles-Cardiel, Esther, Marcelle Silva-Abreu, Ana Cristina Calpena, and Isidre Casals. 2021. "Development and Validation of an HPLC–MS/MS Method for Pioglitazone from Nanocarriers Quantitation in Ex Vivo and In Vivo Ocular Tissues" Pharmaceutics 13, no. 5: 650. https://doi.org/10.3390/pharmaceutics13050650