
Effect of Application Amounts on In Vitro Dermal Absorption Test Using Caffeine and Testosterone

 ,
,
Abstract
: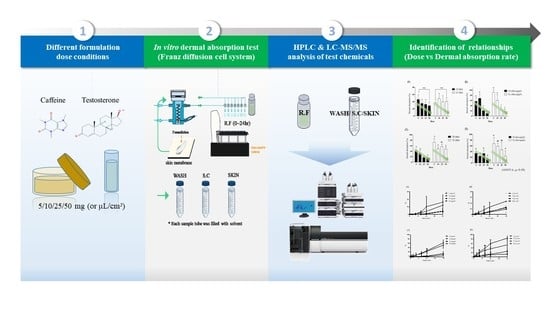
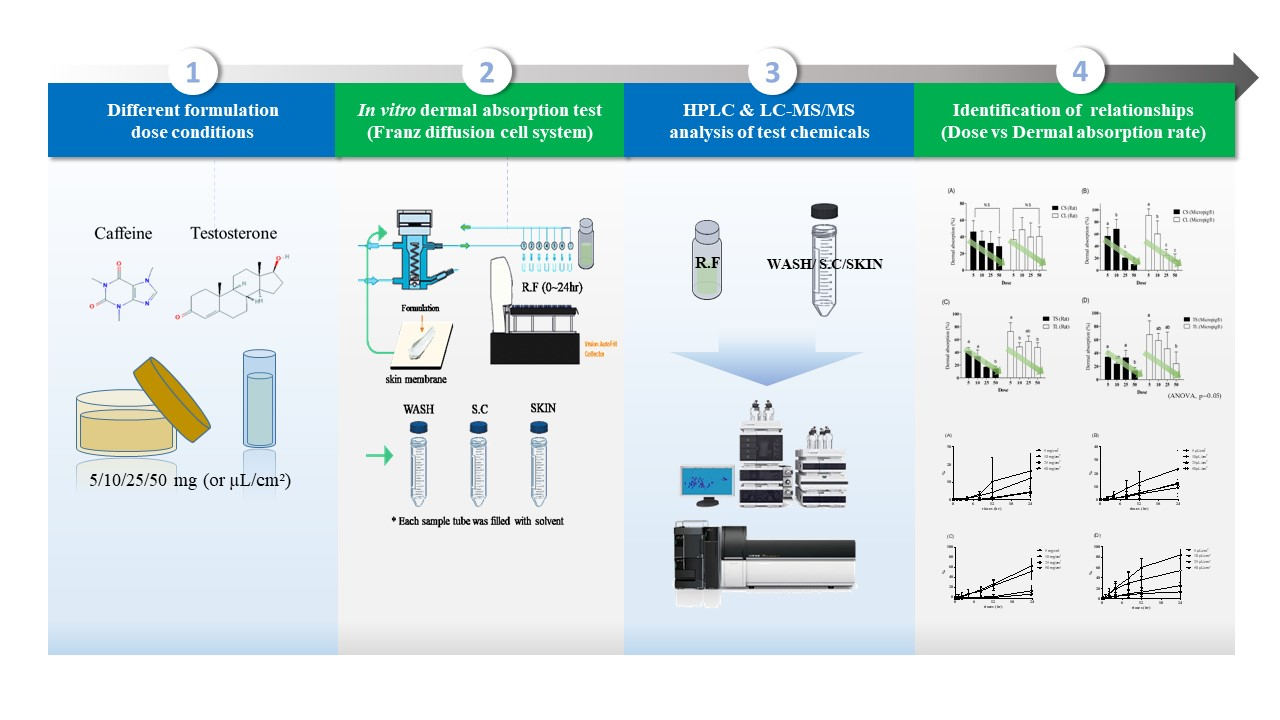
1. Introduction
2. Materials and Methods
2.1. Chemicals
2.2. Formulations
2.3. Skin Preparation
2.4. In Vitro Franz Diffusion Cell Equipment
2.5. Dermal Absorption Test of Caffeine
2.5.1. Sample Preparation
2.5.2. Caffeine Analysis
2.6. Dermal Absorption Test of Testosterone
2.6.1. Sample Preparation
2.6.2. Testosterone Analysis
2.7. Statistics
3. Results
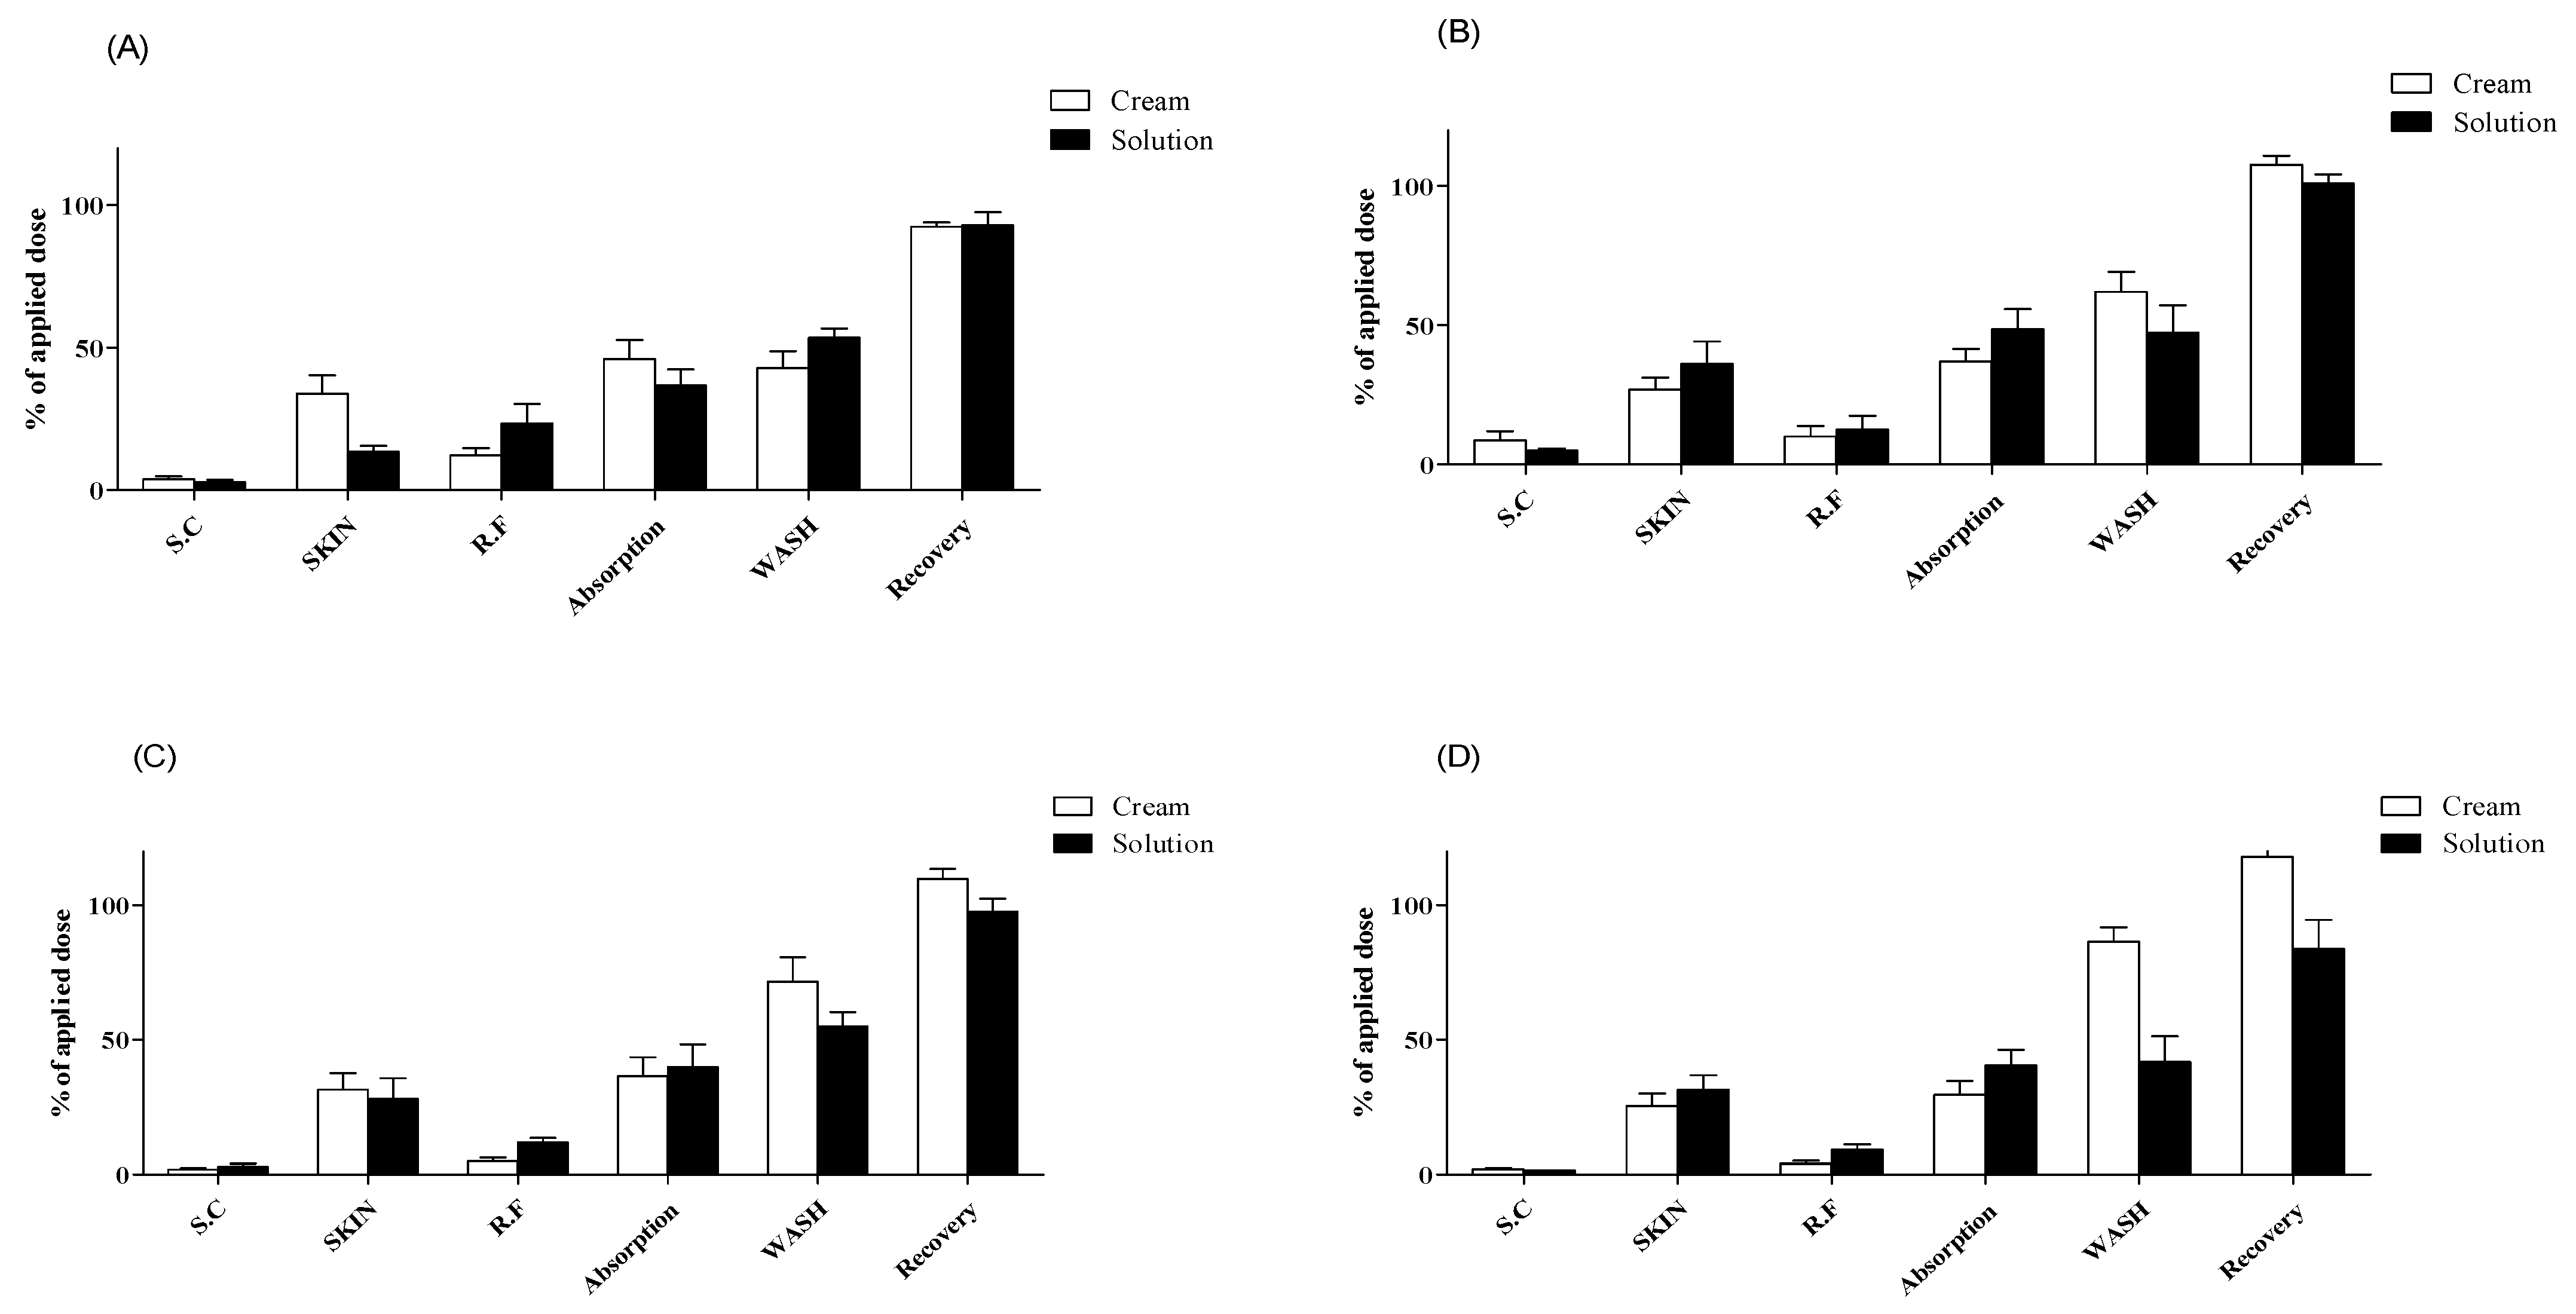
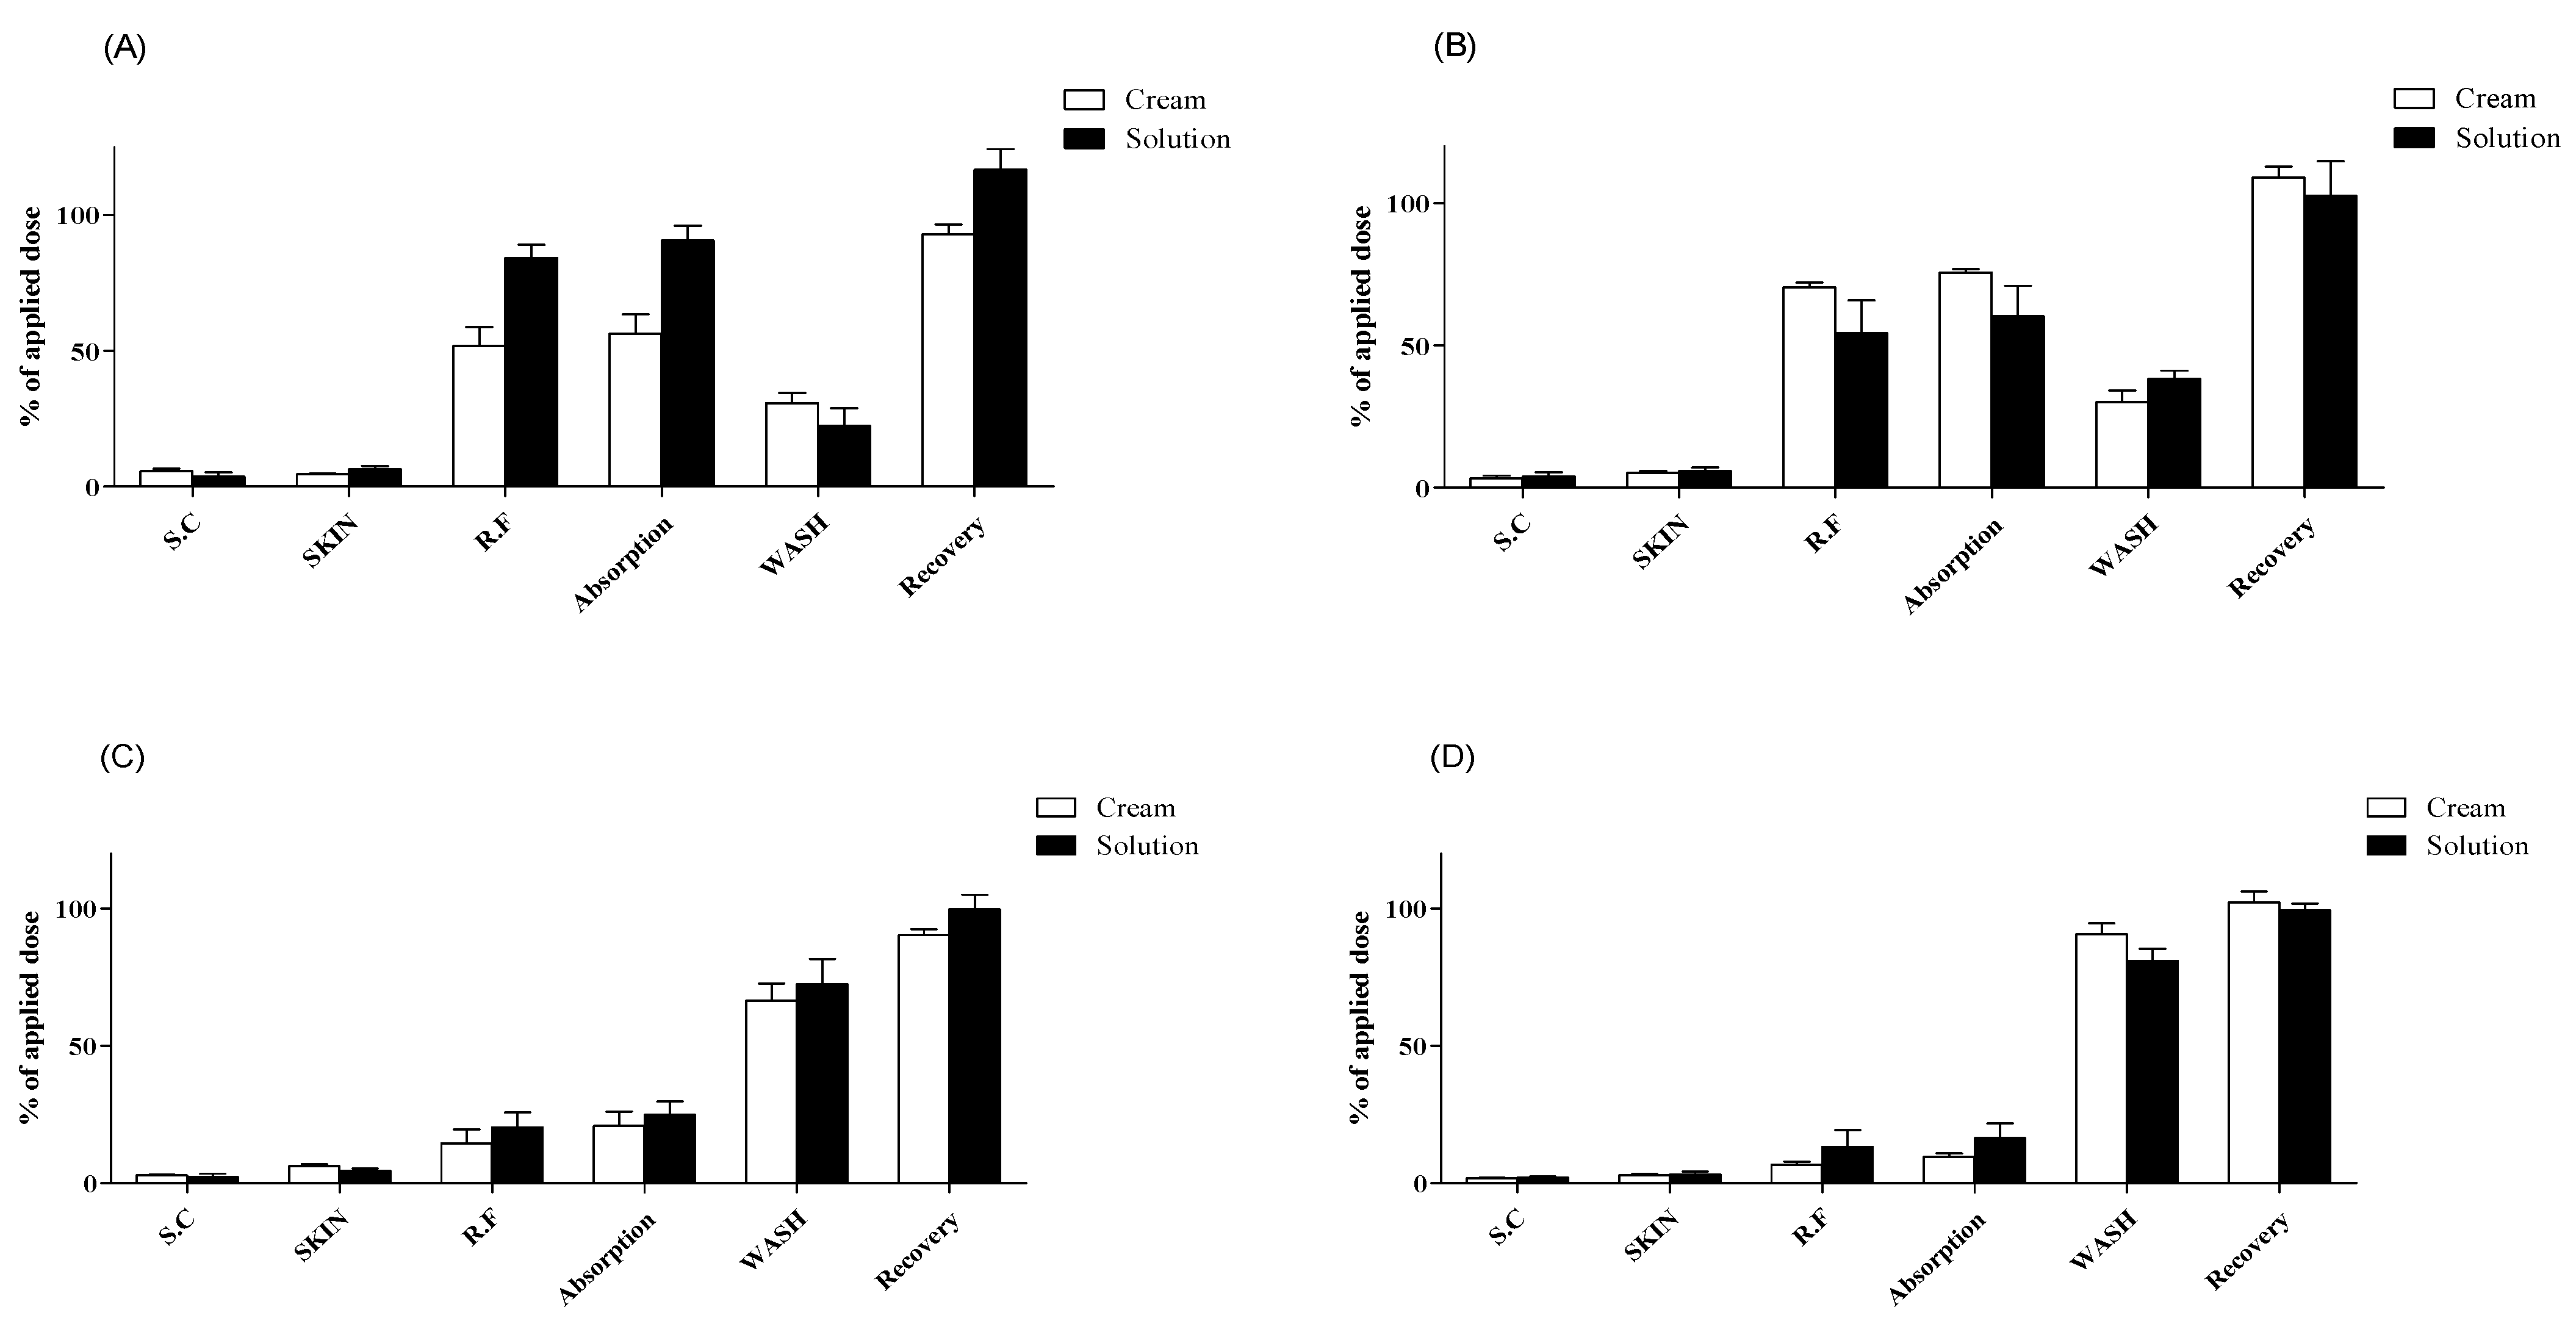
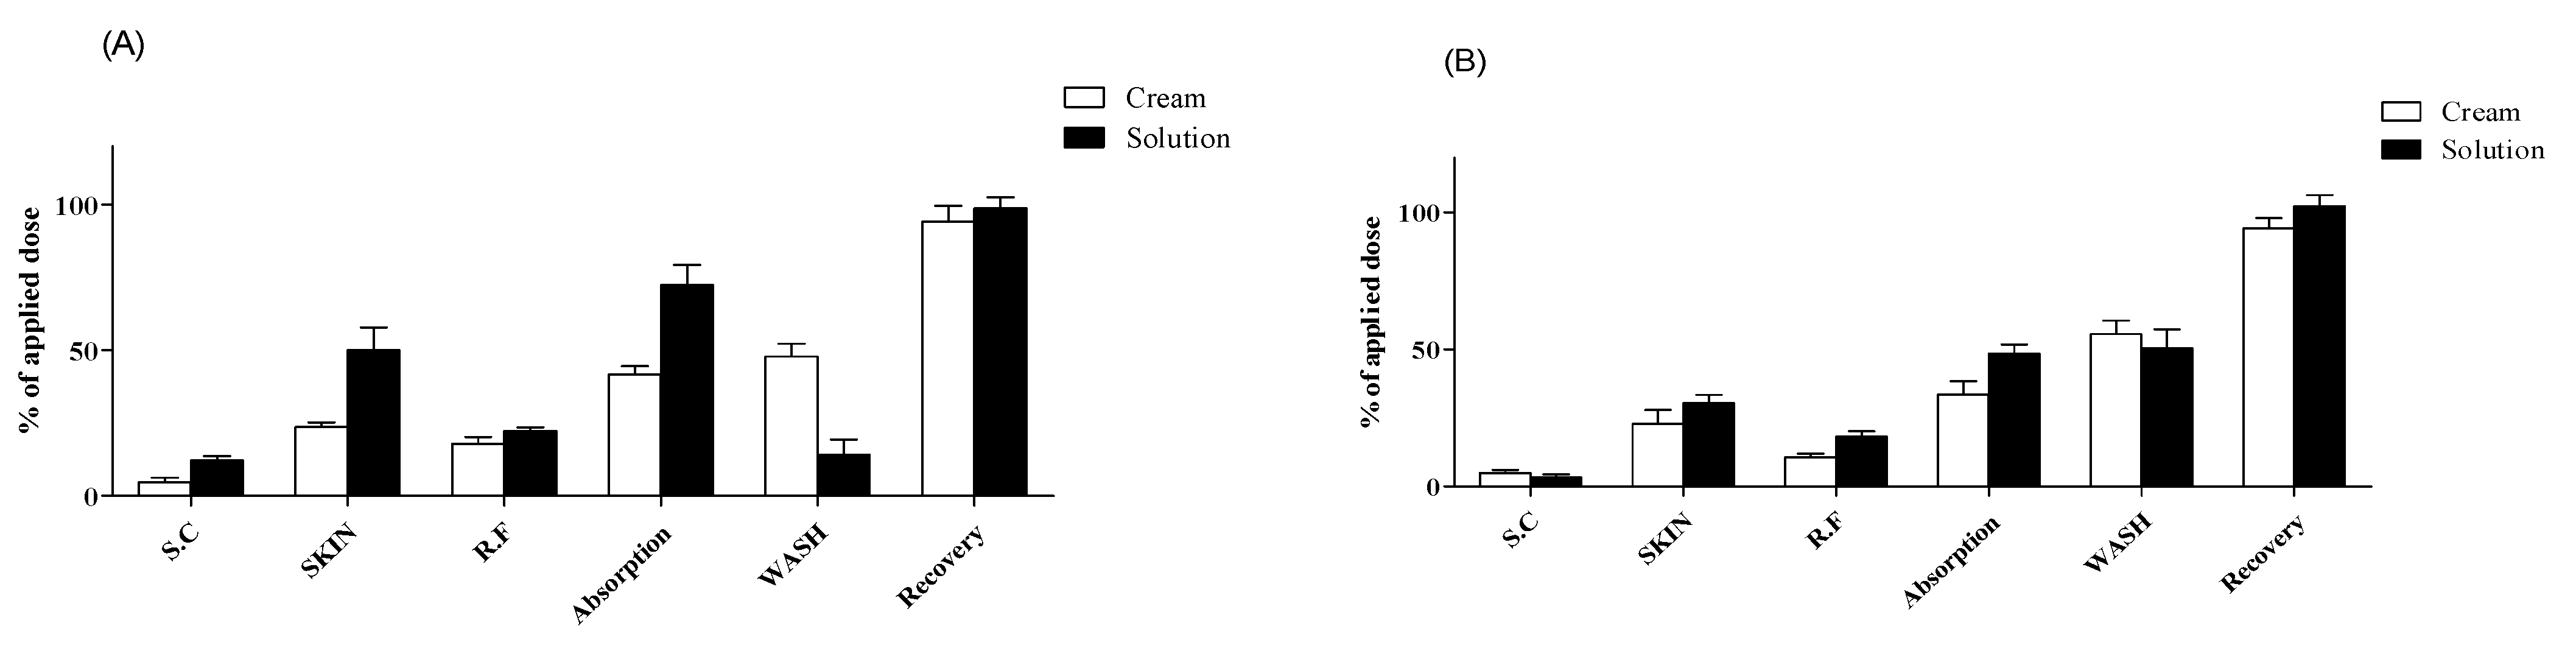
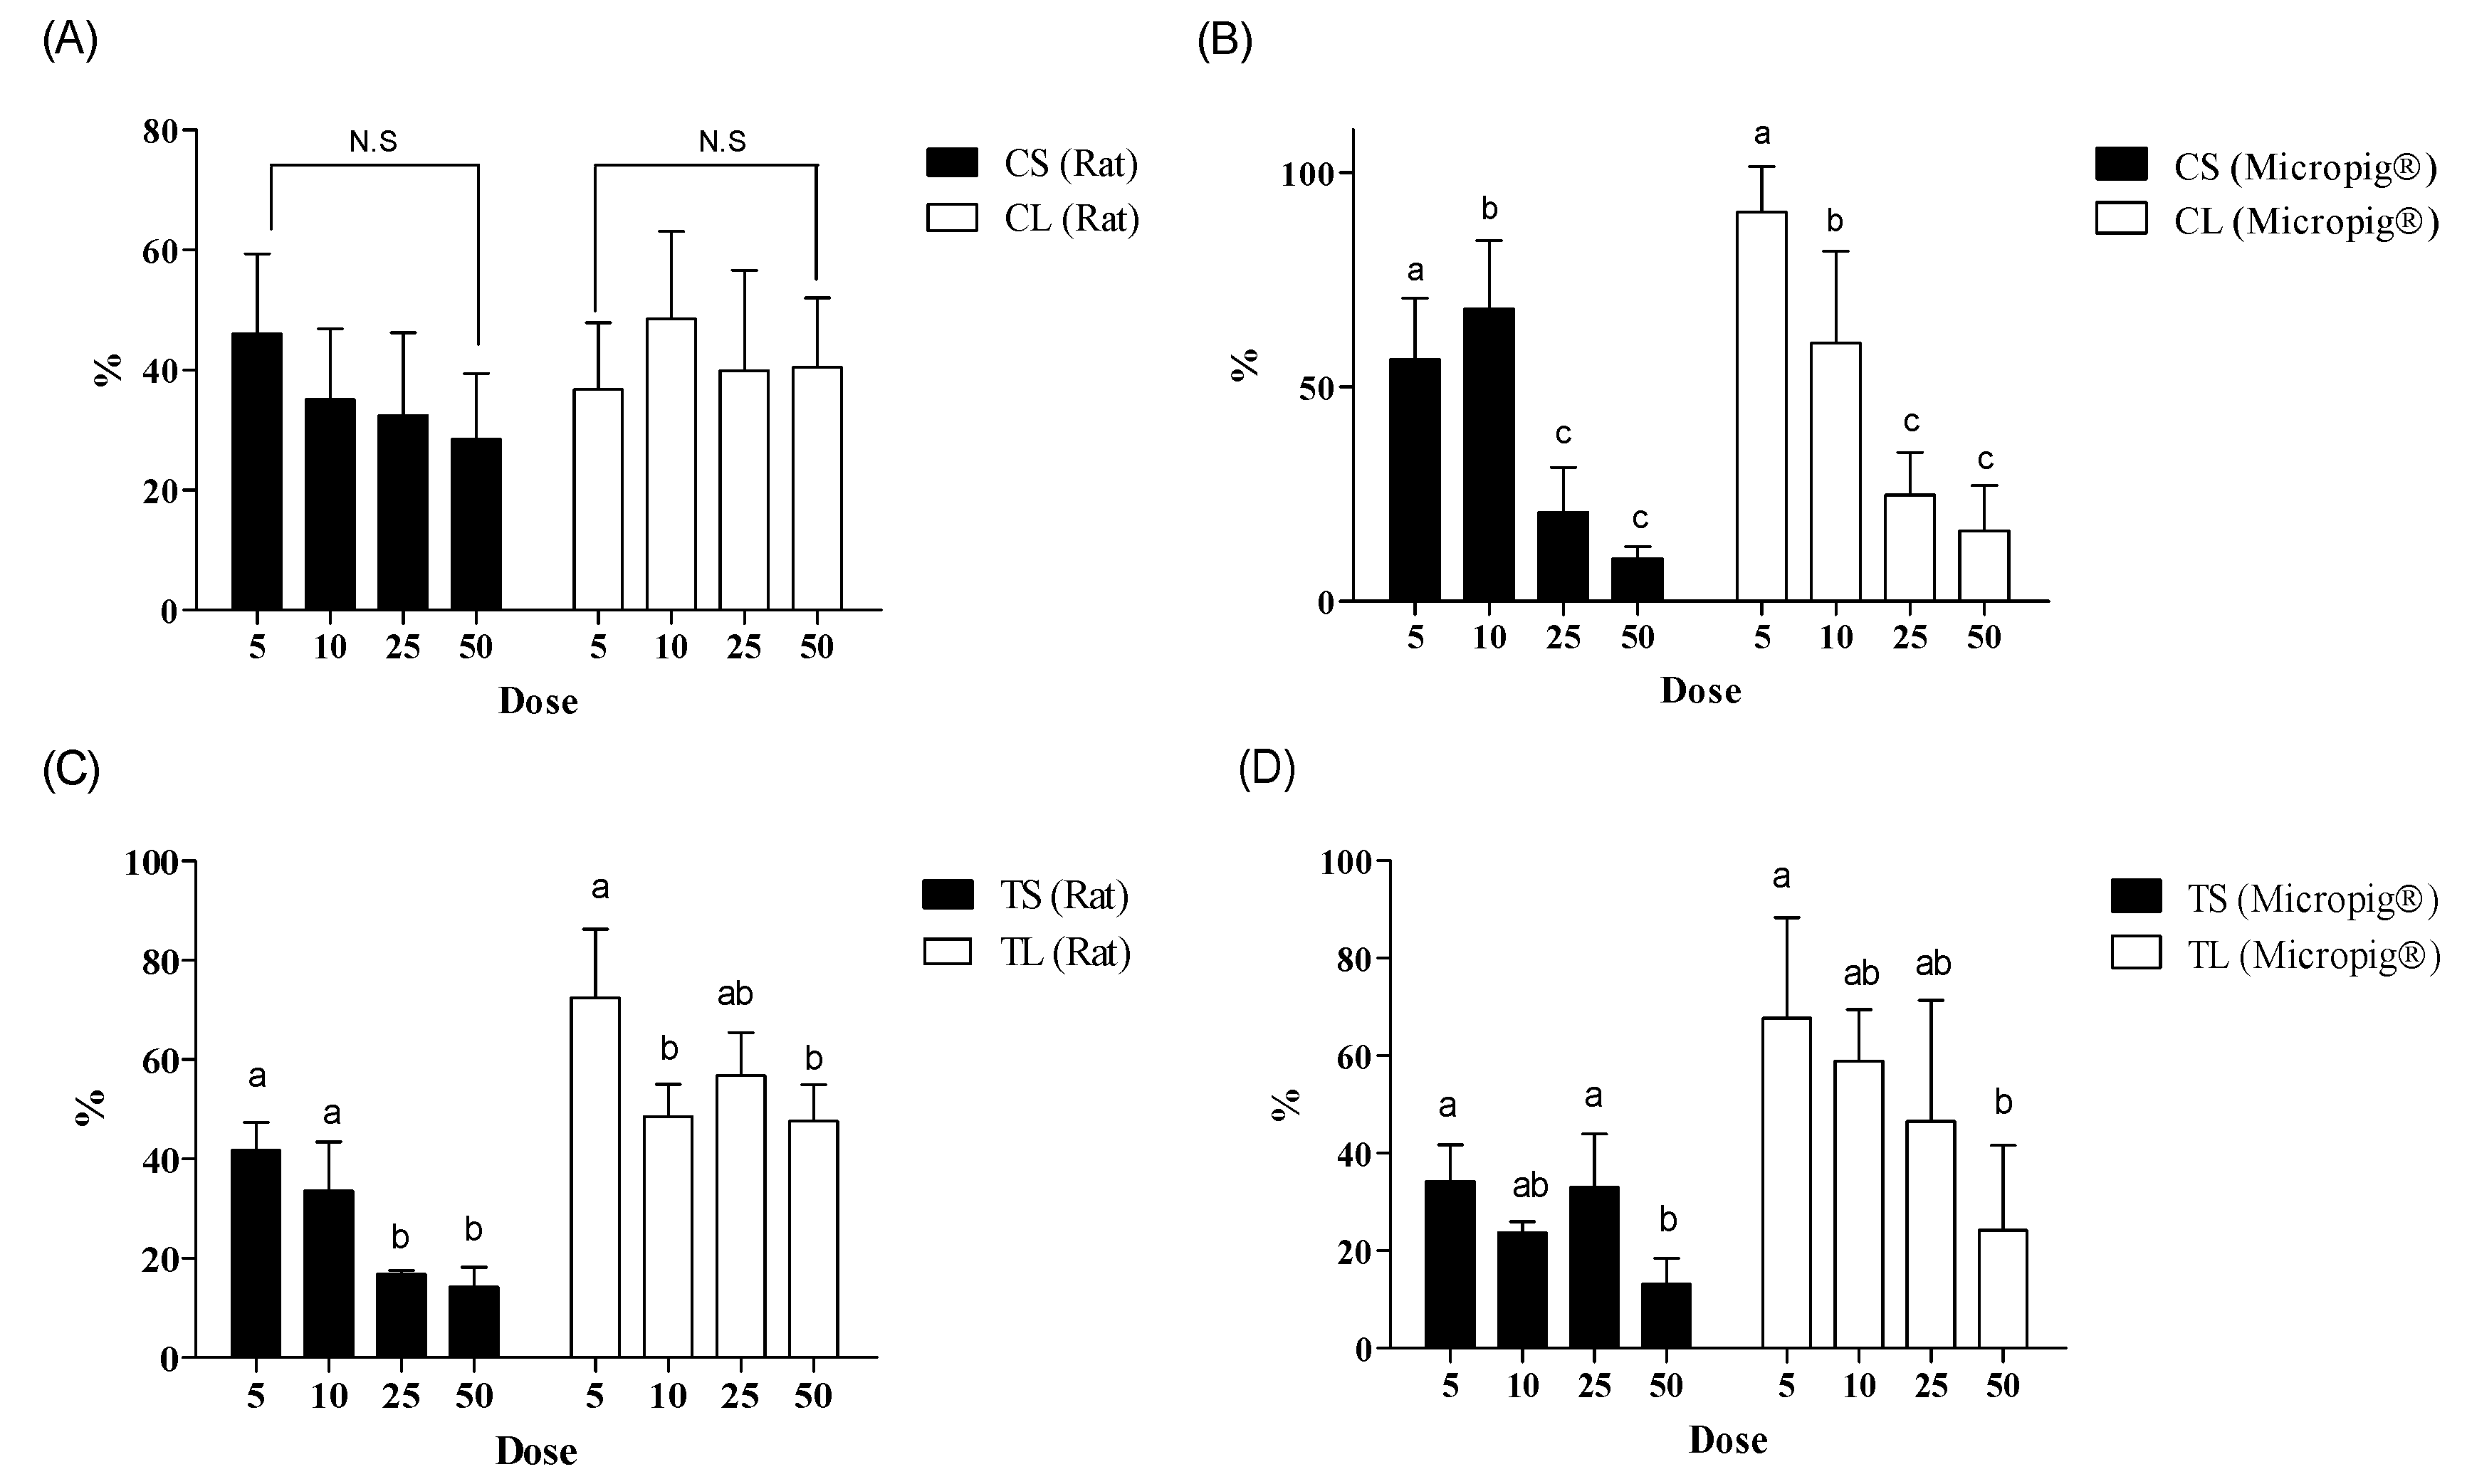
3.1. In Vitro Dermal Absorption Study of Caffeine
3.1.1. Rat Skin
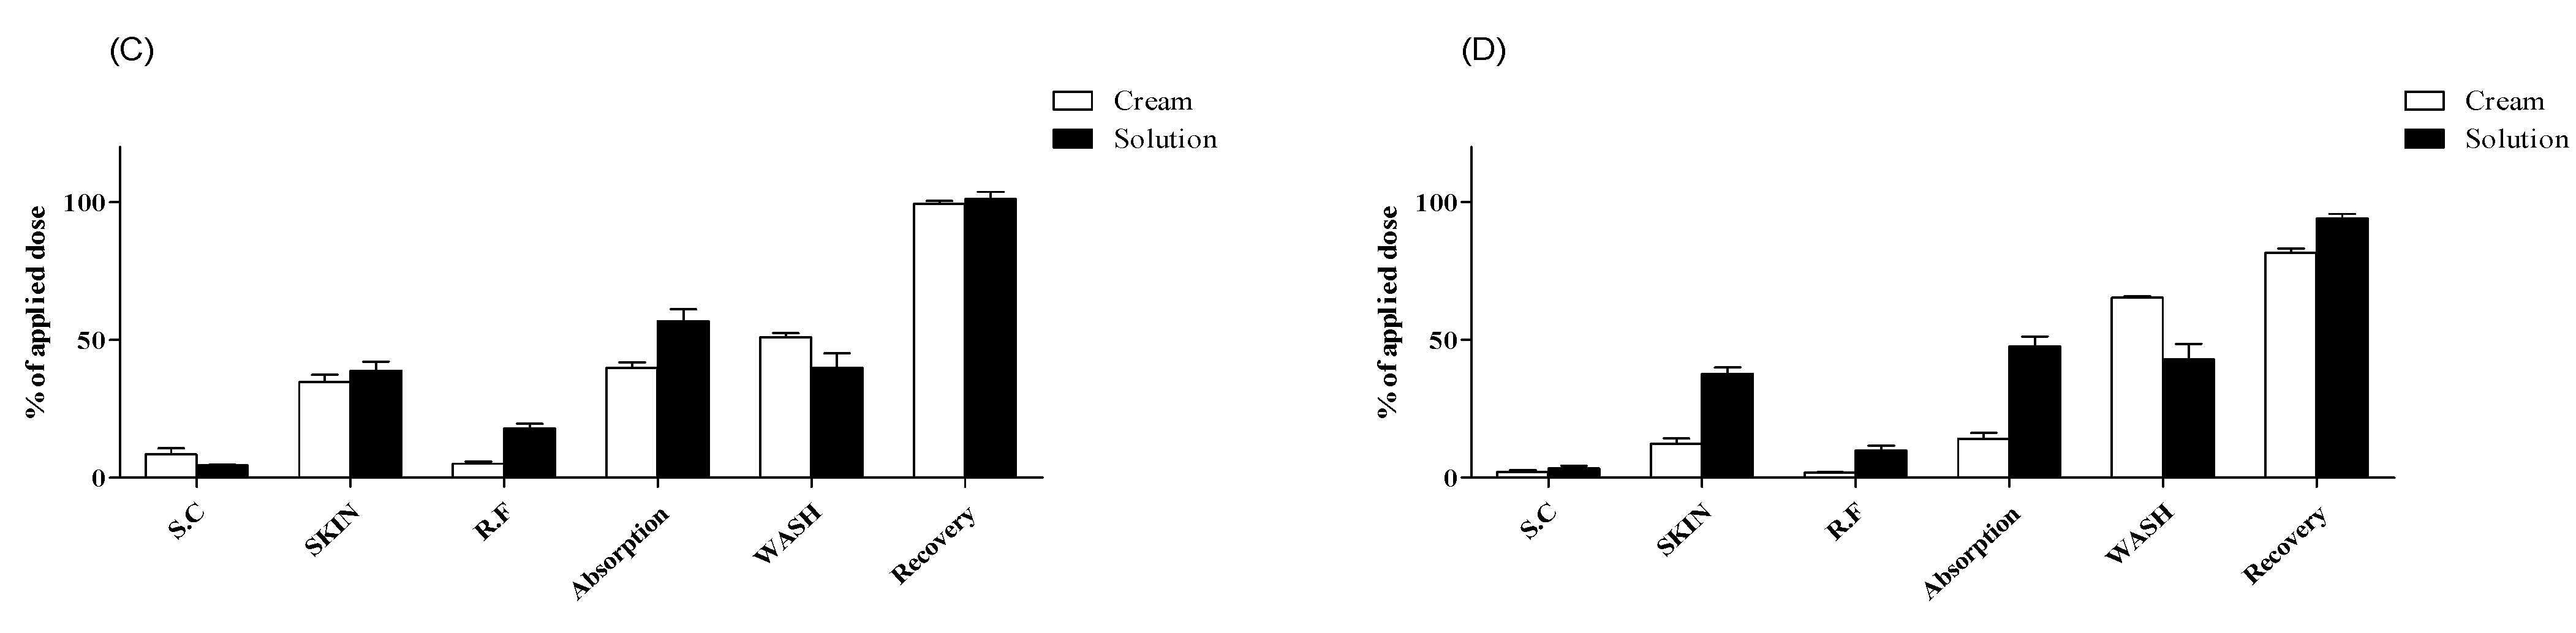
3.1.2. Minipig Skin
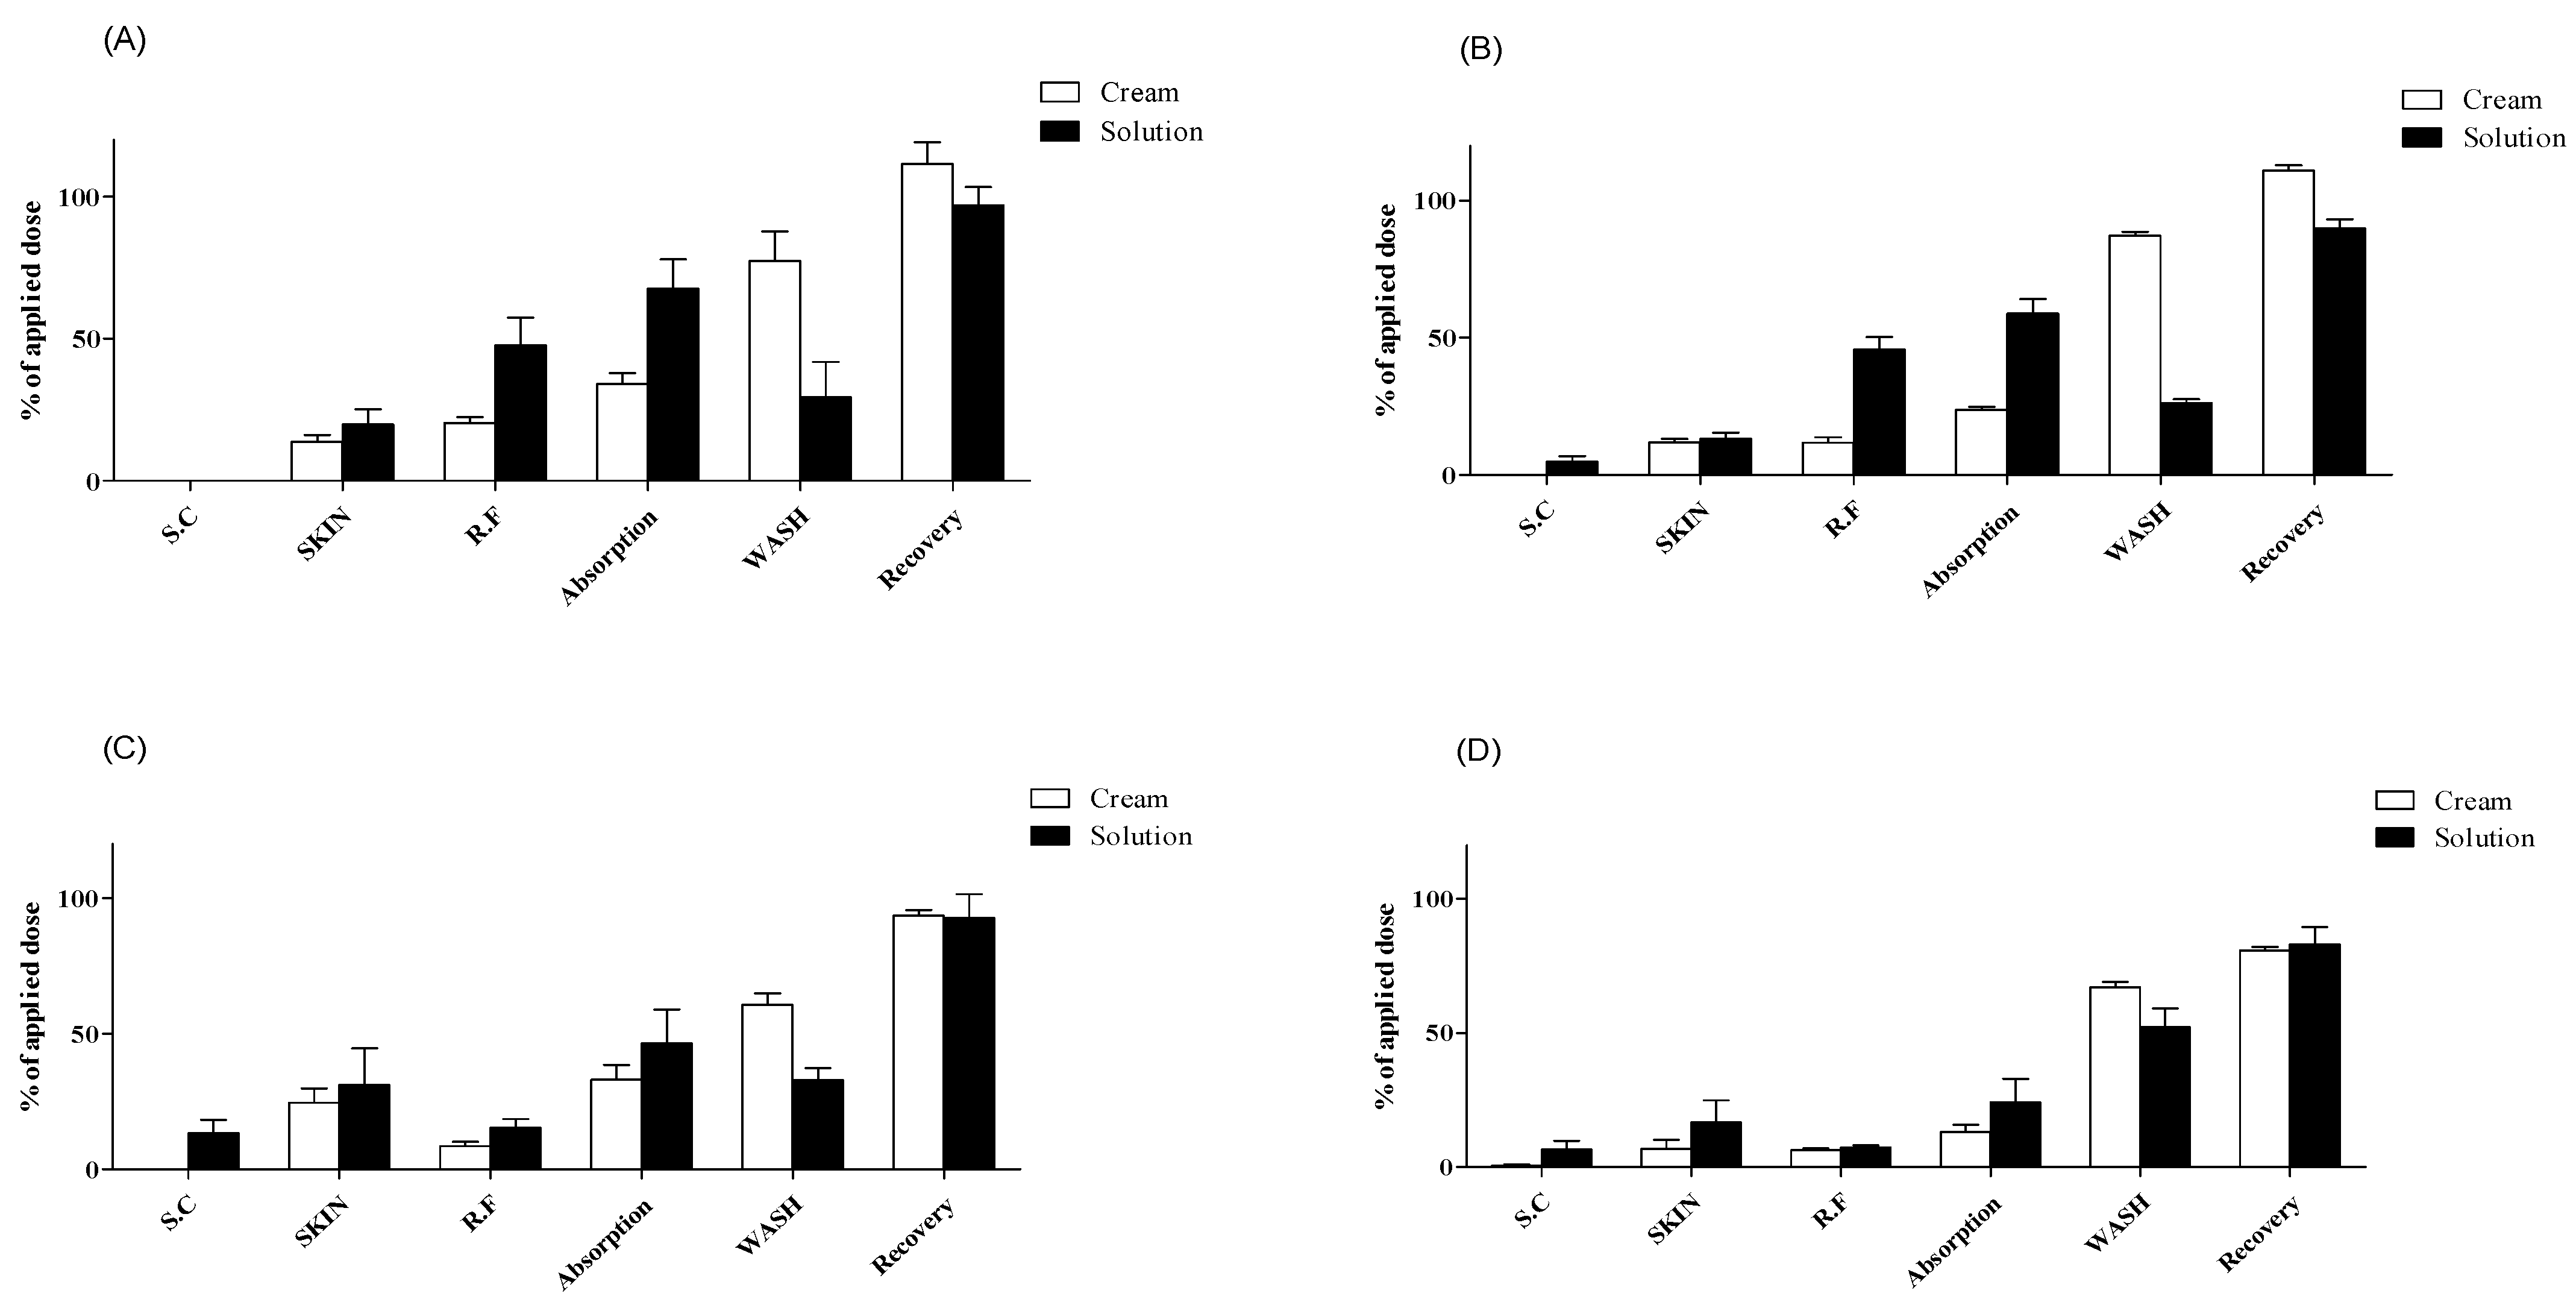
3.2. In Vitro Dermal Absorption Study of Testosterone
3.2.1. Rat Skin
3.2.2. Minipig Skin
4. Discussion
Supplementary Materials
Author Contributions
Funding
Institutional Review Board Statement
Informed Consent Statement
Data Availability Statement
Conflicts of Interest
References
- Banton, M.I.; Bus, J.S.; Collins, J.J.; Delzell, E.; Gelbke, H.P.; Kester, J.E.; Moore, M.M.; Waites, R.; Sarang, S.S. Evaluation of potential health effects associated with occupational and environmental exposure to styrene—An update. J. Toxicol. Environ. Health B Crit. Rev. 2019, 22, 255–259. [Google Scholar] [CrossRef] [Green Version]
- Jung, D.S.; Jung, G.H.; Lee, E.H.; Park, H.R.; Kim, J.H.; Kim, K.B.; Kim, H.R.; Kim, H.G. Effect of combined exposure to EDTA and zinc pyrithione on pyrithione absorption in rats. Toxicol. Res. 2019, 35, 155–160. [Google Scholar] [CrossRef] [PubMed] [Green Version]
- Kim, M.K.; Kim, K.B.; Lee, J.Y.; Kwack, S.J.; Kwon, Y.C.; Kang, J.S.; Kim, H.S.; Lee, B.M. Risk assessment of 5-chloro-2-methylisothiazol-3(2H)-one/2-methylisothiazol-3(2H)-one (CMIT/MIT) used as a preservative in cosmetics. Toxicol. Res. 2019, 35, 103–117. [Google Scholar] [CrossRef]
- Kim, H.Y.; Lee, J.D.; Kim, J.Y.; Lee, J.Y.; Bae, O.N.; Choi, Y.K.; Baek, E.; Kang, S.; Min, C.; Seo, K.; et al. Risk assessment of volatile organic compounds (VOCs) detected in sanitary pads. J. Toxicol. Environ. Health A 2019, 82, 678–695. [Google Scholar] [CrossRef]
- Lee, J.D.; Kim, J.; Jang, H.J.; Lee, B.-M.; Kim, K.-B. Percutaneous permeability of 1-phenoxy-2-propanol, a preservative in cosmetics. Regul. Toxicol. Pharmacol. 2019, 103, 56–62. [Google Scholar] [CrossRef]
- Lee, J.D.; Lee, J.Y.; Kwack, S.J.; Shin, C.Y.; Jang, H.J.; Kim, H.Y.; Kim, M.K.; Seo, D.W.; Lee, B.M.; Kim, K.B. Risk assessment of triclosan, a cosmetic preservative. Toxicol. Res. 2019, 35, 137–154. [Google Scholar] [CrossRef]
- Lee, J.K.; Kim, K.-B.; Lee, J.D.; Shin, C.Y.; Kwack, S.J.; Lee, B.-M.; Lee, J.Y. Risk assessment of drometrizole, a cosmetic ingredient used as an ultraviolet light absorber. Toxicol. Res. 2019, 35, 119–129. [Google Scholar] [CrossRef] [PubMed]
- Sung, C.R.; Kim, K.-B.; Lee, J.Y.; Lee, B.-M.; Kwack, S.J. Risk assessment of ethylhexyl dimethyl PABA in cosmetics. Toxicol. Res. 2019, 35, 131–136. [Google Scholar] [CrossRef] [PubMed]
- Bronaugh, R.L.; Stewart, R.F.; Congdon, E.R. Differences in permeability of rat skin related to sex and body site. J. Soc. Cosmet. Chem. 1983, 34, 135. [Google Scholar]
- Moon, K.C.; Maibach, H.I. Percutaneous absorption in diseased skin: Relationship to exogenous dermatosis. In Exogenous Dermatoses: Environmental Dermatitis; Menné, T., Maibach, H.I., Eds.; CRC Press: Boca Raton, FL, USA, 1991; pp. 217–224. [Google Scholar]
- Roskos, K.V.; Maibach, H.I. Percutaneous absorption and age: Implications for therapy. Drugs Aging. 1992, 2, 432–449. [Google Scholar] [CrossRef] [PubMed]
- Kompaore, F.; Tsuruta, H. In vivo differences between asian, black and white in the stratum corneum barrier function. Int. Arch. Occup. Environ. Health 1993, 65, S223–S225. [Google Scholar] [CrossRef] [PubMed]
- Hilton, J.; Woollen, B.H.; Scott, R.C.; Auton, T.R.; Trebilcock, K.L.; Wilks, M.F. Vehicle effects on in vitro percutaneous absorption through rat and human skin. Pharm. Res. 1994, 11, 1396–1400. [Google Scholar] [CrossRef] [PubMed]
- Lien, E.J.; Tong, G.L. Physicochemical properties and percutaneous absorption of drugs. J. Soc. Cosmet. Chem. 1973, 24, 371–384. [Google Scholar]
- Rubio, L.; Marcos, R.; Hernández, A. Potential adverse health effects of ingested micro- and nanoplastics on humans. Lessons learned from in vivo and in vitro mammalian models. J. Toxicol. Environ. Health B 2019, 23, 51–68. [Google Scholar] [CrossRef]
- Elias, P.M. Lipids and the epidermal permeability barrier. Arch. Dermatol. Res. 1981, 270, 95–117. [Google Scholar] [CrossRef] [PubMed]
- Behl, C.R.; Flynn, G.L.; Kurihara, T.; Harper, N.; Smith, W.; Higuchi, W.I.; Ho, N.F.; Pierson, C.L. Hydration and percutaneous absorption: I. Influence of hydration on alkanol permeation through hairless mouse skin. J. Invest. Dermatol. 1980, 75, 346–352. [Google Scholar] [CrossRef] [PubMed] [Green Version]
- Allenby, A.C.; Fletcher, J.; Schock, C.; Tees, T.F.S. The effect of heat, pH and organic solvents on the electrical impedance and permeability of excised human skin. Br. J. Dermatol. 1969, 81, 31–39. [Google Scholar] [CrossRef]
- Denda, M.; Tsuchiya, T.; Elias, P.M.; Feingold, K.R. Stress alters cutaneous permeability barrier homeostasis. Am. J. Physiol. Regul. Integr. Comp. Physiol. 2000, 278, R367–R372. [Google Scholar] [CrossRef]
- Wahlberg, J.E. Impairment of skin barrier function by depilatories. J. Investig. Dermatol. 1972, 59, 160–162. [Google Scholar] [CrossRef] [Green Version]
- Bronaugh, R.L.; Franz, T.J. Vehicle effects on percutaneous absorption: In vivo and in vitro comparisons with human skin. Br. J. Dermatol. 1986, 115, 1–11. [Google Scholar] [CrossRef]
- Dreher, F.; Fouchard, F.; Patouillet, C.; Andrian, M.; Simonnet, J.T.; Benech-Kieffer, F. Comparison of cutaneous bioavailability of cosmetic preparations containing caffeine or α-tocopherol applied on human skin models or human skin ex vivo at finite doses. Skin Pharmacol. Appl. Skin Physiol. 2002, 15, 40–58. [Google Scholar] [CrossRef]
- El-Kamel, A.; Al-Fagih, I.; Alsarra, I. Effect of Sonophoresis and Chemical Enhancers on Testosterone Transdermal Delivery from Solid Lipid Microparticles: An in vitro Study. Curr. Drug Deliv. 2008, 5, 20–26. [Google Scholar] [CrossRef]
- Guth, K.; Schäfer-Korting, M.; Fabian, E.; Landsiedel, R.; van Ravenzwaay, B. Suitability of skin integrity tests for dermal absorption studies in vitro. Toxicol. In Vitro 2015, 29, 113–123. [Google Scholar] [CrossRef] [Green Version]
- Schäfer-Korting, M.; Bock, U.; Diembeck, W.; Düsing, H.J.; Gamer, A.; Haltner-Ukomadu, E.; Hoffmann, C.; Kaca, M.; Kamp, H.; Kersen, S.; et al. The use of reconstructed human epidermis for skin absorption testing: Results of the validation study. Altern. Lab. Anim. 2008, 36, 161–187. [Google Scholar] [CrossRef] [PubMed]
- Wester, R.C.; Maibach, H.I. Relationship of topical dose and percutaneous absorption in rhesus monkey and man. J. Invest. Dermatol. 1976, 67, 518–520. [Google Scholar] [CrossRef] [Green Version]
- Lehman, P.A.; Raney, S.G.; Franz, T.J. Percutaneous absorption in man: In vitro-in vivo correlation. Skin Pharmacol. Physiol. 2011, 24, 224–230. [Google Scholar] [CrossRef]
- Lehman, P.A.; Raney, S.G. In vitro percutaneous absorption of ketoprofen and testosterone: Comparison of pluronic lecithin organogel vs. pentravan cream. Int. J. Pharm. Compd. 2012, 16, 248–252. [Google Scholar] [CrossRef] [Green Version]
- Trauer, S.; Patzelt, A.; Otberg, N.; Knorr, F.; Rozycki, C.; Balizs, G.; Büttemeyer, R.; Linscheid, M.; Liebsch, M.; Lademann, J. Permeation of topically applied caffeine through human skin—A comparison of in vivo and in vitro data. Br. J. Clin. Pharmacol. 2009, 68, 181–186. [Google Scholar] [CrossRef] [PubMed] [Green Version]
- Trauer, S.; Lademann, J.; Knorr, F.; Richter, H.; Liebsch, M.; Rozycki, C.; Balizs, G.; Büttemeyer, R.; Linscheid, M.; Patzelt, A. Development of an in vitro modified skin absorption test for the investigation of the follicular penetration pathway of caffeine. Skin Pharm. Physiol. 2010, 23, 320–327. [Google Scholar] [CrossRef]
- Veryser, L.; Boonen, J.; Mehuys, E.; Roche, N.; Remon, J.-P.; Peremans, K.; Burvenich, C.; De Spiegeleer, B. Transdermal evaluation of caffeine in different formulations and excipients. J. Caffeine Res. 2013, 3, 41–46. [Google Scholar] [CrossRef] [Green Version]
- Van De Sandt, J.J.M.; Van Burgsteden, J.A.; Cage, S.; Carmichael, P.L.; Dick, I.; Kenyon, S.; Korinth, G.; Larese, F.; Limasset, J.C.; Maas, W.J.M.; et al. In vitro predictions of skin absorption of caffeine, testosterone, and benzoic acid: A multi-centre comparison study. Regul. Toxicol. Pharmacol. 2004, 39, 271–281. [Google Scholar] [CrossRef] [PubMed]
- OECD (Organization for Economic Cooperation and Development). Guideline for the Testing of Chemicals. OECD Guideline Notes on Dermal Absorption. 2010. Available online: https://www.oecd.org/chemicalsafety/testing/48532204.pdf (accessed on 27 April 2021).
- SCCS (Scientific Committee on Consumer Safety). The SCCS Notes of Guidance for the Testing of Cosmetic Ingredients and Their Safety Evaluation 10th Revision. 2018. Available online: https://ec.europa.eu/health/sites/health/files/scientific_committees/consumer_safety/docs/sccs_o_224.pdf (accessed on 27 April 2021).
- OECD (Organization for Economic Cooperation and Development), OECD Guideline for the Testing of Chemicals Skin Absorption: In Vitro Method. 2004. Available online: https://ntp.niehs.nih.gov/iccvam/suppdocs/feddocs/oecd/oecdtg428-508.pdf (accessed on 27 April 2021).
- OECD (Organization for Economic Cooperation and Development). Guidance Document for the Conduct of Skin Absorption Studies. Paris. 2004. Available online: https://www.oecd-ilibrary.org/docserver/9789264078796-en.pdf?expires=1572270815&id=id&accname=guest&checksum=1D8489D0F7EEE8B0A43ADA6EA4DFAEBE (accessed on 27 April 2021).
- MFDS (Ministry of Food and Drug Safety). Guideline on Bioanalytical Method Validation. 11-1471000-000028-01. 2013. Available online: http://www.nifds.go.kr/brd/m_15/view.do?seq=7018&srchFr=&srchTo=&srchWord=&srchTp=&itm_seq_1=0&itm_seq_2=0&multi_itm_seq=0&company_cd=&company_nm=&page=85 (accessed on 27 April 2021).
- FDA (Food and Drug Administration), Bioanalytical Method Validation Guidance for Industry. 2018. Available online: https://www.fda.gov/files/drugs/published/Bioanalytical-Method-Validation-Guidance-for-Industry.pdf (accessed on 27 April 2021).
- Mendes, V.M.; Coelho, M.; Tomé, A.R.; Cunha, R.A.; Manadas, B. Validation of an LC-MS/MS Method for the Quantification of Caffeine and Theobromine Using Non-Matched Matrix Calibration Curve. Molecules 2019, 24, 2863. [Google Scholar] [CrossRef] [Green Version]
- Erkoç, F.U.; Ozsar, S.; Güven, B.; Kalkandelen, G.; Uğrar, E. High-performance liquid chromatographic analysis of steroid hormones. J. Chromatogr. Sci. 1989, 27, 86–90. [Google Scholar] [CrossRef] [PubMed]
- OECD (Organization for Economic Cooperation and Development). Guidance Document for Single Laboratory Validation of Quantitative. Paris. 2014. Available online: https://www.oecd.org/officialdocuments/publicdisplaydocumentpdf/?cote=ENV/JM/MONO (accessed on 27 April 2021).
- Elkeeb, R.; Hui, X.; Chan, H.; Tian, L.; Maibach, H. Correlation of transepidermal water loss with skin barrier properties in vitro: Comparison of three evaporimeters. Skin Res. Technol. 2010, 16, 9–15. [Google Scholar] [CrossRef] [PubMed]
- WHO (World Health Organization). Environmental Health Criteria 235 Dermal Absorption. 2006. Available online: http://www.inchem.org/documents/ehc/ehc/ehc235.pdf (accessed on 27 April 2021).
- Reddy, M.B.; Bunge, A. Dermal absorption from pesticide residues. In The Practical Applicability of Toxicokinetic Models in the Risk Assessment of Chemicals; Krüse, J., Verhaar, H.J.M., de Raat, W.K., Eds.; Springer: Dordrecht, The Netherlands, 2002. [Google Scholar] [CrossRef]
- Selzer, D.; Abdel-Mottaleb, M.M.; Hahn, T.; Schaefer, U.F.; Neumann, D. Finite and infinite dosing: Difficulties in measurements, evaluations and predictions. Adv. Drug Deliv. Rev. 2013, 65, 278–294. [Google Scholar] [CrossRef] [PubMed]
- Frasch, H.F.; Dotson, G.S.; Bunge, A.L.; Chen, C.P.; Cherrie, J.W.; Kasting, G.B.; Kissel, J.C.; Sahmel, J.; Semple, S.; Wilkinson, S. Analysis of finite dose dermal absorption data: Implications for dermal exposure assessment. J. Exp. Sci. Environ. Epidemiol. 2014, 24, 65–73. [Google Scholar] [CrossRef] [Green Version]
- MFDS (Ministry of Food and Drug Safety). Guideline on Risk Assessment of Cosmetics. 2017. Available online: https://nifds.go.kr/brd/m_15/down.do?brd_id=167&seq=10872&data_tp=A&file_seq=1 (accessed on 27 April 2021).
- Lau, W.M.; Ng, K.W. Finite and Infinite Dosing. In Percutaneous Penetration Enhancers Drug Penetration Into/Through the Skin: Methodology and General Considerations; Dragicevic, N., Maibach, H.I., Eds.; Springer: Berlin/Heidelberg, Germany, 2017; pp. 35–44. [Google Scholar] [CrossRef]


| Properties | Caffeine | Testosterone |
|---|---|---|
| Chemical structure |  | |
| INCI name | Caffeine | Testosterone |
| IUPAC name | 1,3,7-trimethylpurine-2,6-dione | (8R,9S,10R,13S,14S,17S)-17-hydroxy-10,13-dimethyl-1,2,6,7,8,9,11,12,14,15,16,17-dodecahydrocyclopenta[a]phenanthren-3-one |
| CAS Number | 58-08-2 | 58-22-0 |
| EC Number | 200-362-1 | 200-370-5 |
| Molecular formula | C8H10N4O2 | C19H28O2 |
| Molecular weight | 194.19 g/mol | 288.4 g/mol |
| Log Kow | −0.07 | 3.32 |
| Solubility | In water, 2.16 × 10⁴ mg/L at 25 °C | In water, 23.4 mg/L at 25 °C |
Publisher’s Note: MDPI stays neutral with regard to jurisdictional claims in published maps and institutional affiliations. |
© 2021 by the authors. Licensee MDPI, Basel, Switzerland. This article is an open access article distributed under the terms and conditions of the Creative Commons Attribution (CC BY) license (https://creativecommons.org/licenses/by/4.0/).
Share and Cite
Im, J.-E.; Kim, H.Y.; Lee, J.D.; Park, J.-J.; Kang, K.-S.; Kim, K.-B. Effect of Application Amounts on In Vitro Dermal Absorption Test Using Caffeine and Testosterone. Pharmaceutics 2021, 13, 641. https://doi.org/10.3390/pharmaceutics13050641
Im J-E, Kim HY, Lee JD, Park J-J, Kang K-S, Kim K-B. Effect of Application Amounts on In Vitro Dermal Absorption Test Using Caffeine and Testosterone. Pharmaceutics. 2021; 13(5):641. https://doi.org/10.3390/pharmaceutics13050641
Chicago/Turabian StyleIm, Jueng-Eun, Hyang Yeon Kim, Jung Dae Lee, Jin-Ju Park, Kyung-Soo Kang, and Kyu-Bong Kim. 2021. "Effect of Application Amounts on In Vitro Dermal Absorption Test Using Caffeine and Testosterone" Pharmaceutics 13, no. 5: 641. https://doi.org/10.3390/pharmaceutics13050641