
A Model-Informed Drug Development (MIDD) Approach for a Low Dose of Empagliflozin in Patients with Type 1 Diabetes

 , , and
Abstract
:1. Introduction
2. Materials and Methods
2.1. Included Study Data
2.2. Software
2.3. Population PK Model
2.3.1. Model Development
2.3.2. Model Evaluation
2.4. Exposure–Response Analyses
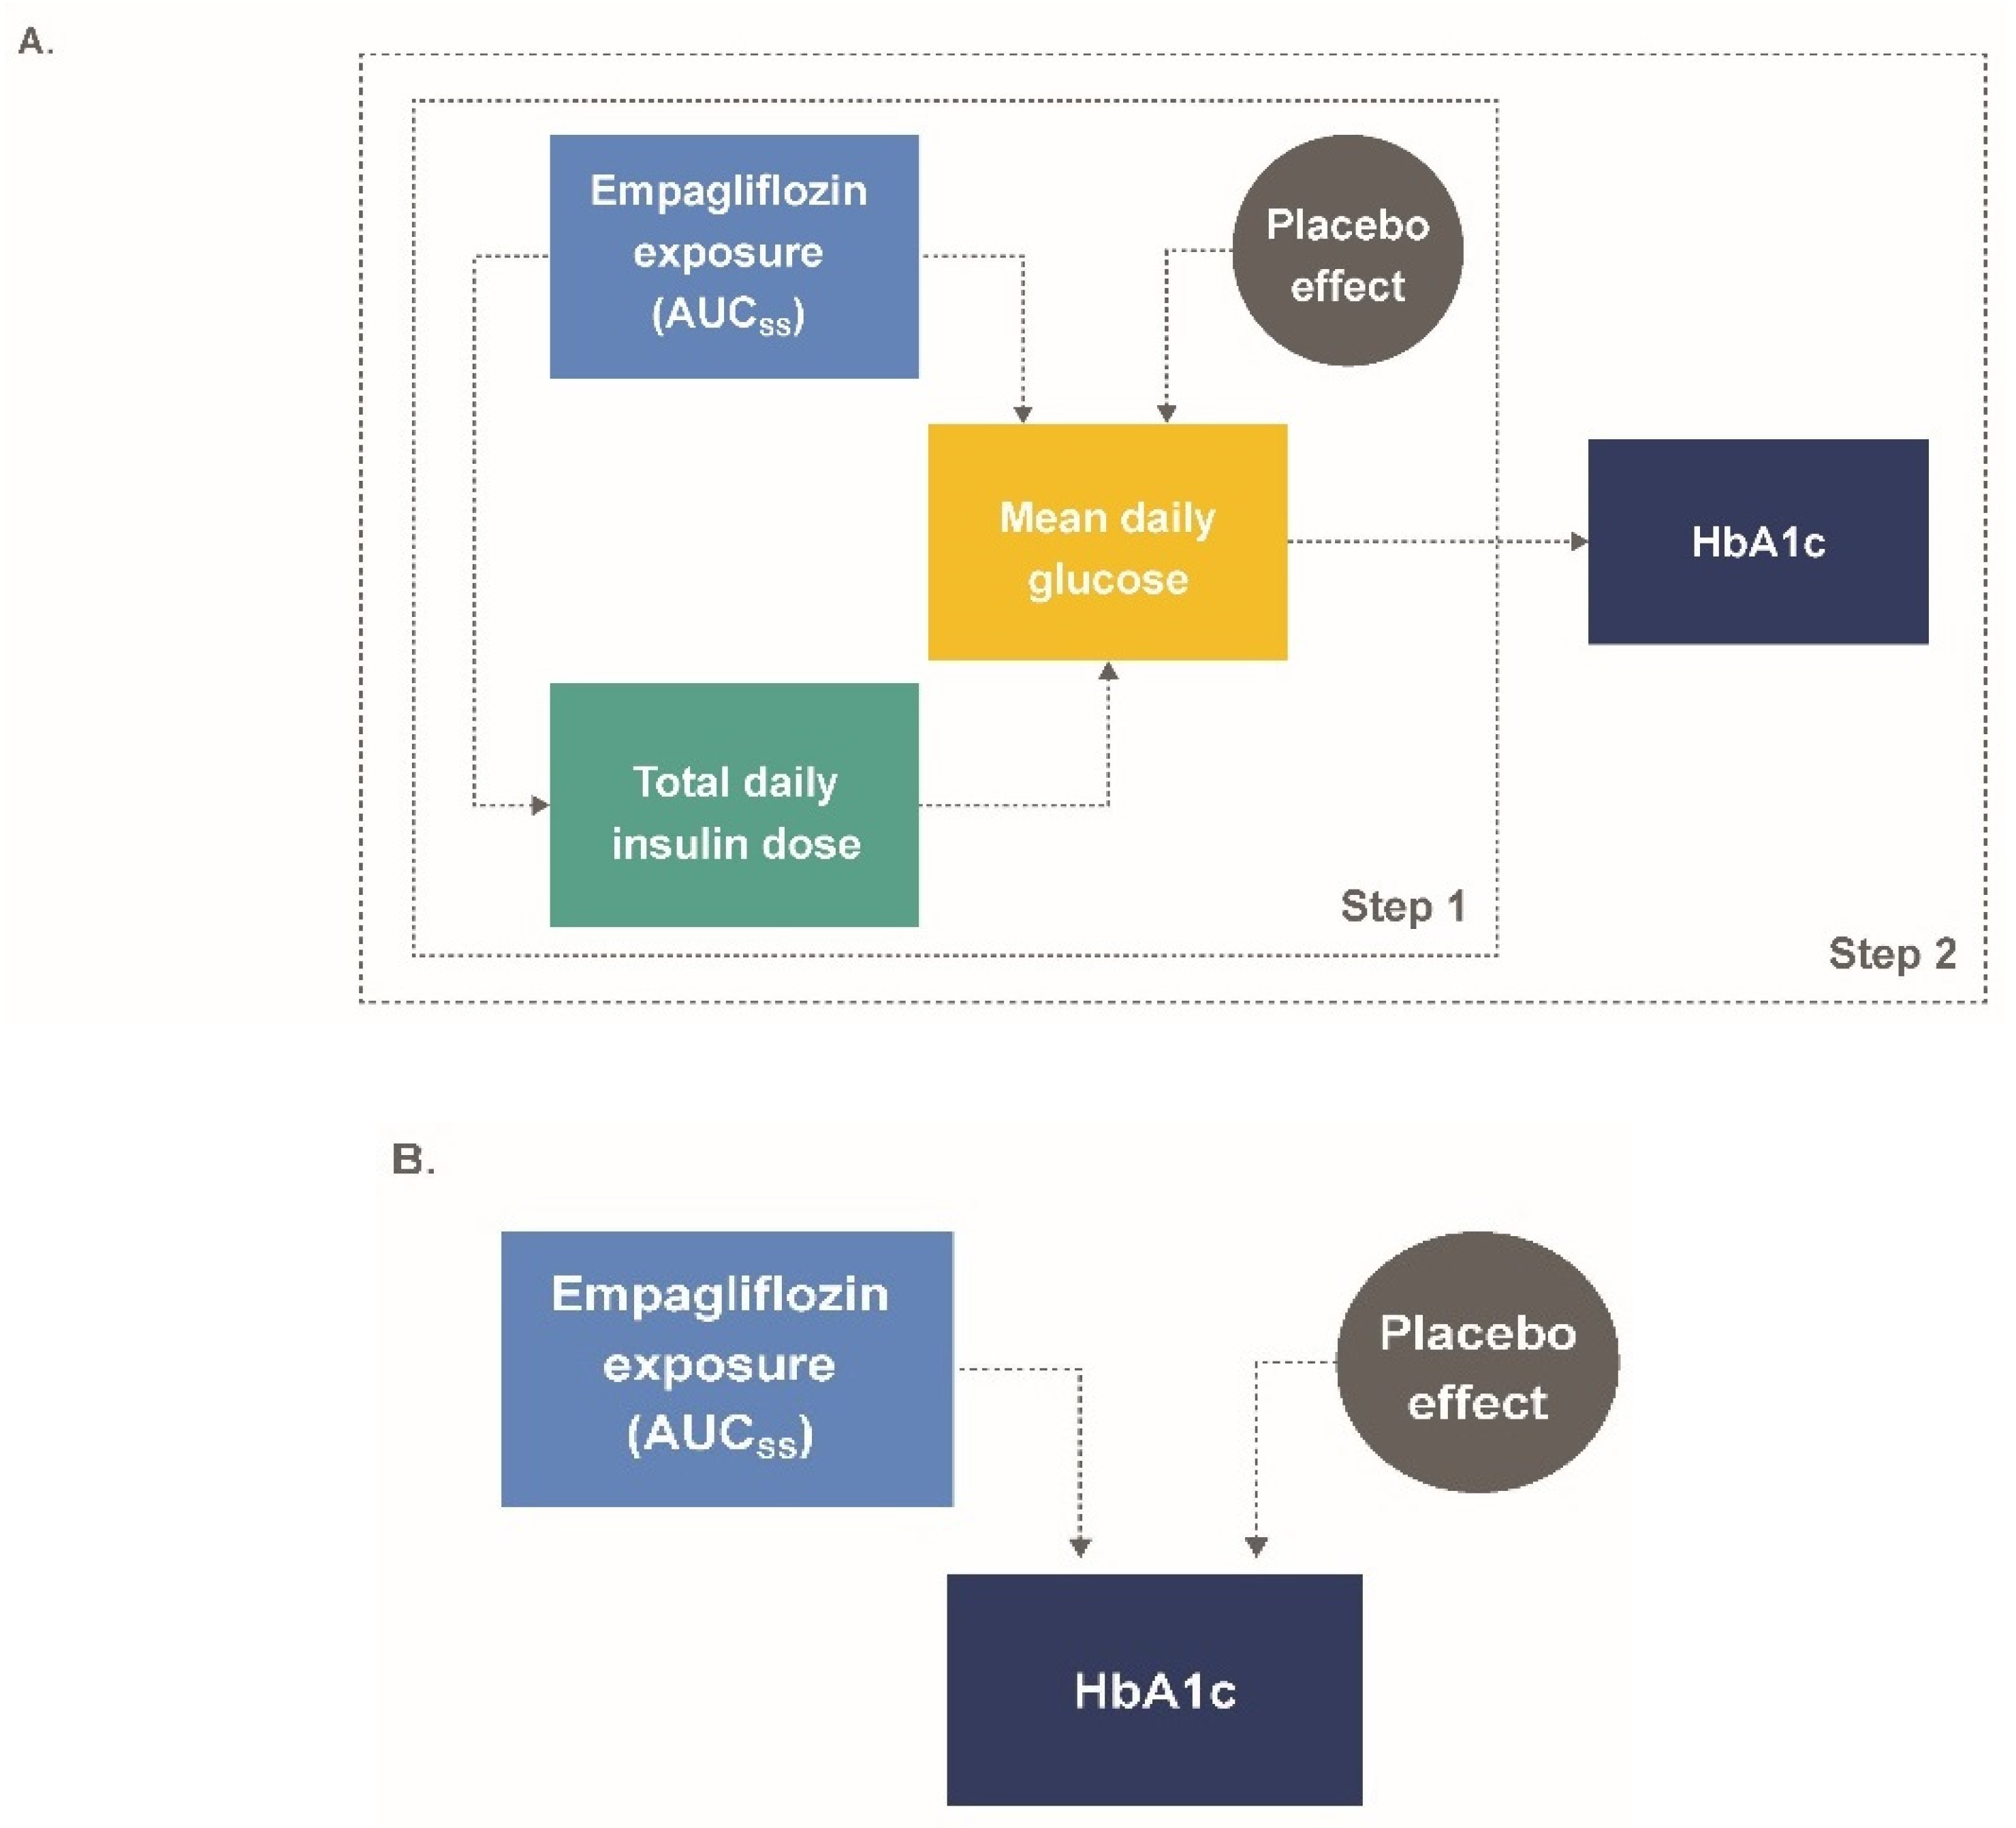
2.4.1. Model Development: Semi-Mechanistic Model (M-EASE-1)
2.4.2. Model Evaluation: Semi-Mechanistic Model (M-EASE-1)
2.4.3. Applied Simulations: Semi-Mechanistic Model (M-EASE-1)
2.4.4. Model Development: Descriptive Model (M-EASE-2)
2.4.5. Model Evaluation: Descriptive Model (M-EASE-2)
2.4.6. Applied Simulations: Descriptive Model (M-EASE-2)
3. Results
3.1. Population PK Model
3.2. Semi-Mechanistic Model (M-EASE-1)
3.3. Model Evaluation: Semi-Mechanistic Model (M-EASE-1)
3.4. Applied Simulations: Semi-Mechanistic Model (M-EASE-1)
3.5. Descriptive Model (M-EASE-2)
3.6. Model Evaluation: Descriptive Model (M-EASE-2)
3.7. Applied Simulations: Descriptive Model (M-EASE-2)
4. Discussion
5. Conclusions
Supplementary Materials
Author Contributions
Funding
Institutional Review Board Statement
Informed Consent Statement
Data Availability Statement
Acknowledgments
Conflicts of Interest
References
- IDF Diabetes Atlas, 8th ed. Available online: https://www.idf.org/e-library/epidemiology-research/diabetes-atlas/134-idf-diabetes-atlas-8th-edition.html (accessed on 17 July 2020).
- Livingstone, S.J.; Levin, D.; Looker, H.C.; Lindsay, R.S.; Wild, S.H.; Joss, N.; Leese, G.; Leslie, P.; McCrimmon, R.J.; Metcalfe, W.; et al. Estimated life expectancy in a Scottish cohort with type 1 diabetes, 2008–2010. JAMA 2015, 313, 37–44. [Google Scholar] [CrossRef] [PubMed]
- Dandona, P.; Mathieu, C.; Phillip, M.; Hansen, L.; Griffen, S.C.; Tschope, D.; Thoren, F.; Xu, J.; Langkilde, A.M. Efficacy and safety of dapagliflozin in patients with inadequately controlled type 1 diabetes (DEPICT-1): 24 week results from a multicentre, double-blind, phase 3, randomised controlled trial. Lancet Diabetes Endocrinol. 2017, 5, 864–876. [Google Scholar] [CrossRef]
- Dandona, P.; Mathieu, C.; Phillip, M.; Hansen, L.; Tschope, D.; Thoren, F.; Xu, J.; Langkilde, A.M. Efficacy and safety of dapagliflozin in patients with inadequately controlled type 1 diabetes: The DEPICT-1 52-week study. Diabetes Care 2018, 41, 2552–2559. [Google Scholar] [CrossRef] [PubMed] [Green Version]
- Henry, R.R.; Thakkar, P.; Tong, C.; Polidori, D.; Alba, M. Efficacy and safety of canagliflozin, a sodium-glucose cotransporter 2 inhibitor, as add-on to insulin in patients with type 1 diabetes. Diabetes Care 2015, 38, 2258–2265. [Google Scholar] [CrossRef] [PubMed] [Green Version]
- Mathieu, C.; Dandona, P.; Gillard, P.; Senior, P.; Hasslacher, C.; Araki, E.; Lind, M.; Bain, S.C.; Jabbour, S.; Arya, N.; et al. Efficacy and safety of dapagliflozin in patients with inadequately controlled type 1 diabetes (the DEPICT-2 study): 24-week results from a randomized controlled trial. Diabetes Care 2018, 41, 1938–1946. [Google Scholar] [CrossRef] [PubMed] [Green Version]
- Sands, A.T.; Zambrowicz, B.P.; Rosenstock, J.; Lapuerta, P.; Bode, B.W.; Garg, S.K.; Buse, J.B.; Banks, P.; Heptulla, R.; Rendell, M.; et al. Sotagliflozin, a dual SGLT1 and SGLT2 inhibitor, as adjunct therapy to insulin in type 1 diabetes. Diabetes Care 2015, 38, 1181–1188. [Google Scholar] [CrossRef] [PubMed] [Green Version]
- Rosenstock, J.; Marquard, J.; Laffel, L.M.; Neubacher, D.; Kaspers, S.; Cherney, D.Z.; Zinman, B.; Skyler, J.S.; George, J.; Soleymanlou, N.; et al. Empagliflozin as adjunctive to insulin therapy in type 1 diabetes: The EASE trials. Diabetes Care 2018, 41, 2560–2569. [Google Scholar] [CrossRef] [PubMed] [Green Version]
- Shimada, A.; Hanafusa, T.; Yasui, A.; Lee, G.; Taneda, Y.; Sarashina, A.; Shiki, K.; George, J.; Soleymanlou, N.; Marquard, J. Empagliflozin as adjunct to insulin in Japanese participants with type 1 diabetes: Results of a 4-week, double-blind, randomized, placebo-controlled phase 2 trial. Diabetes Obes. Metab. 2018, 20, 2190–2199. [Google Scholar] [CrossRef] [PubMed]
- Famulla, S.; Pieber, T.R.; Eilbracht, J.; Neubacher, D.; Soleymanlou, N.; Woerle, H.J.; Broedl, U.C.; Kaspers, S. Glucose exposure and variability with empagliflozin as adjunct to insulin in patients with type 1 diabetes: Continuous glucose monitoring data from a 4-week, randomized, placebo-controlled trial (EASE-1). Diabetes Technol. Ther. 2017, 19, 49–60. [Google Scholar] [CrossRef] [PubMed]
- U.S. Government Publishing Office (GPO). Food and Drug Administration Modernization Act of 1997; Pub. L. No. 105-115; 111 Stat. 2295; U.S. Government Publishing Office (GPO): Atlanta, GA, USA, 1997.
- Guidance for Industry: Exposure-Response Relationships—Study Design, Data Analysis, and Regulatory Applications. Available online: https://www.fda.gov/media/71277/download (accessed on 17 July 2020).
- Lee, J.Y.; Garnett, C.E.; Gobburu, J.V.; Bhattaram, V.A.; Brar, S.; Earp, J.C.; Jadhav, P.R.; Krudys, K.; Lesko, L.J.; Li, F.; et al. Impact of pharmacometric analyses on new drug approval and labelling decisions: A review of 198 submissions between 2000 and 2008. Clin. Pharmacokinet. 2011, 50, 627–635. [Google Scholar] [CrossRef] [PubMed]
- Madabushi, R.; Wang, Y.; Zineh, I. A holistic and integrative approach for advancing model-informed drug development. CPT Pharmacomet. Syst. Pharmacol. 2019, 8, 9–11. [Google Scholar] [CrossRef] [PubMed] [Green Version]
- Perkins, B.A.; Soleymanlou, N.; Rosenstock, J.; Skyler, J.S.; Laffel, L.M.; Liesenfeld, K.H.; Neubacher, D.; Riggs, M.M.; Johnston, C.K.; Eudy-Byrne, R.J.; et al. Low-dose empagliflozin as adjunct-to-insulin therapy in type 1 diabetes: A valid modelling and simulation analysis to confirm efficacy. Diabetes Obes. Metab. 2020, 22, 427–433. [Google Scholar] [CrossRef] [PubMed]
- Pieber, T.R.; Famulla, S.; Eilbracht, J.; Cescutti, J.; Soleymanlou, N.; Johansen, O.E.; Woerle, H.J.; Broedl, U.C.; Kaspers, S. Empagliflozin as adjunct to insulin in patients with type 1 diabetes: A 4-week, randomized, placebo-controlled trial (EASE-1). Diabetes Obes. Metab. 2015, 17, 928–935. [Google Scholar] [CrossRef] [PubMed]
- Elmokadem, A.; Riggs, M.M.; Baron, K.T. Quantitative systems pharmacology and physiologically-based pharmacokinetic modeling with mrgsolve: A hands-on tutorial. CPT Pharmacomet. Syst. Pharmacol. 2019, 8, 883–893. [Google Scholar] [CrossRef] [PubMed] [Green Version]
- Mondick, J.; Riggs, M.; Kaspers, S.; Soleymanlou, N.; Marquard, J.; Nock, V. Population pharmacokinetic- pharmacodynamic analysis to characterize the effect of empagliflozin on renal glucose threshold in patients with type 1 diabetes mellitus. J. Clin. Pharmacol. 2018, 58, 640–649. [Google Scholar] [CrossRef] [PubMed]
- Gastonguay, M.R. Full covariate models as an alternative to methods relying on statistical significance for inferences about covariate effects: A review of methodology and 42 case studies. In Proceedings of the 20th Annual Meeting of the Population Approach Group Europe (PAGE) 2011, Athens, Greece, 7–10 June 2011. [Google Scholar]
- Nguyen, T.H.T.; Mouksassi, M.S.; Holford, N.; Al-Huniti, N.; Freedman, I.; Hooker, A.C.; John, J.; Karlsson, M.O.; Mould, D.R.; Perez Ruixo, J.J.; et al. Model evaluation of continuous data pharmacometric models: Metrics and graphics. CPT Pharmacomet. Syst. Pharmacol. 2017, 6, 87–109. [Google Scholar] [CrossRef] [PubMed]
- Parke, J.; Holford, N.H.; Charles, B.G. A procedure for generating bootstrap samples for the validation of nonlinear mixed-effects population models. Comput. Methods Programs Biomed. 1999, 59, 19–29. [Google Scholar] [CrossRef]
- Yafune, A.; Ishiguro, M. Bootstrap approach for constructing confidence intervals for population pharmacokinetic parameters. I: A use of bootstrap standard error. Stat. Med. 1999, 18, 581–599. [Google Scholar] [CrossRef]
- Baron, K.T.; Macha, S.; Broedl, U.C.; Nock, V.; Retlich, S.; Riggs, M. Population pharmacokinetics and exposure–response (efficacy and safety/tolerability) of empagliflozin in patients with type 2 diabetes. Diabetes Ther. 2016, 7, 455–471. [Google Scholar] [CrossRef] [PubMed] [Green Version]
- Gelman, A.; Carlin, J.B.; Stern, H.S.; Dunson, D.B.; Vehtari, A.; Rubin, D.B. Bayesian Data Analysis, 3rd ed.; Chapman & Hall: New York, NY, USA, 2013. [Google Scholar]
- FDA Briefing Document: Endocrinologic and Metabolic Drugs Advisory Committee Meeting. Available online: https://www.fda.gov/media/132422/download (accessed on 14 February 2020).
- Marshall, S.F.; Burghaus, R.; Cosson, V.; Cheung, S.Y.; Chenel, M.; DellaPasqua, O.; Frey, N.; Hamren, B.; Harnisch, L.; Ivanow, F.; et al. Good practices in model-informed drug discovery and development: Practice, application, and documentation. CPT Pharmacomet. Syst. Pharmacol. 2016, 5, 93–122. [Google Scholar]


| Study | Phase | Description | Study Population | Patient Demographics: Median (95% Confidence Interval) |
|---|---|---|---|---|
| EASE-1 [16] | II | Once-daily EMPA 2.5, 10, 25 mg, or placebo for 28 days | 75 patients with T1D | Age (y): 43.0 (21.7–61.0) Weight (kg): 79.0 (52.0–107) eGFR (mL/min/1.73 m2): 102 (78.7–128) TDID (IU/kg): 0.640 (0.361–1.13) HbA1c (%): 8.20 (7.18–9.61) |
| EASE-2 [8] | III | Once-daily EMPA 10, 25 mg, or placebo for 52 weeks | 721 patients with T1D | Age (y): 46.0 (21.0–69.0) Weight (kg): 84.0 (55.0–126) eGFR (mL/min/1.73 m2): 97.0 (57.0–127) TDID (IU/kg): 0.680 (0.370–1.34) HbA1c (%): 8.00 (7.20–9.50) |
| EASE-3 [8] a | III | Once-daily EMPA 2.5, 10, 25 mg, or placebo for 26 weeks | 948 patients with T1D | Age (y): 43.0 (21.0–69.0) Weight (kg): 81.0 (55.0–121) eGFR (mL/min/1.73 m2): 99.0 (54.7–129) TDID (IU/kg): 0.660 (0.360–1.24) HbA1c (%): 8.10 (7.20–9.50) |
| Scenario | Data Used | Description |
|---|---|---|
| M-EASE-2 descriptive and M-EASE-1 semi-mechanistic | ||
| Internal PPC | EASE-1 and EASE-2 | PPCs were generated via 500 Monte Carlo simulation replicates, which were generated and summarized as longitudinal VPCs and landmark checks at each observation timepoint. Parameter uncertainty was incorporated via the covariance matrix and the posterior distribution for M-EASE-1 and M-EASE-2, respectively |
| External “out-of-sample” PPC | EASE-3 | |
| M-EASE-2 descriptive and M-EASE-1 semi-mechanistic | ||
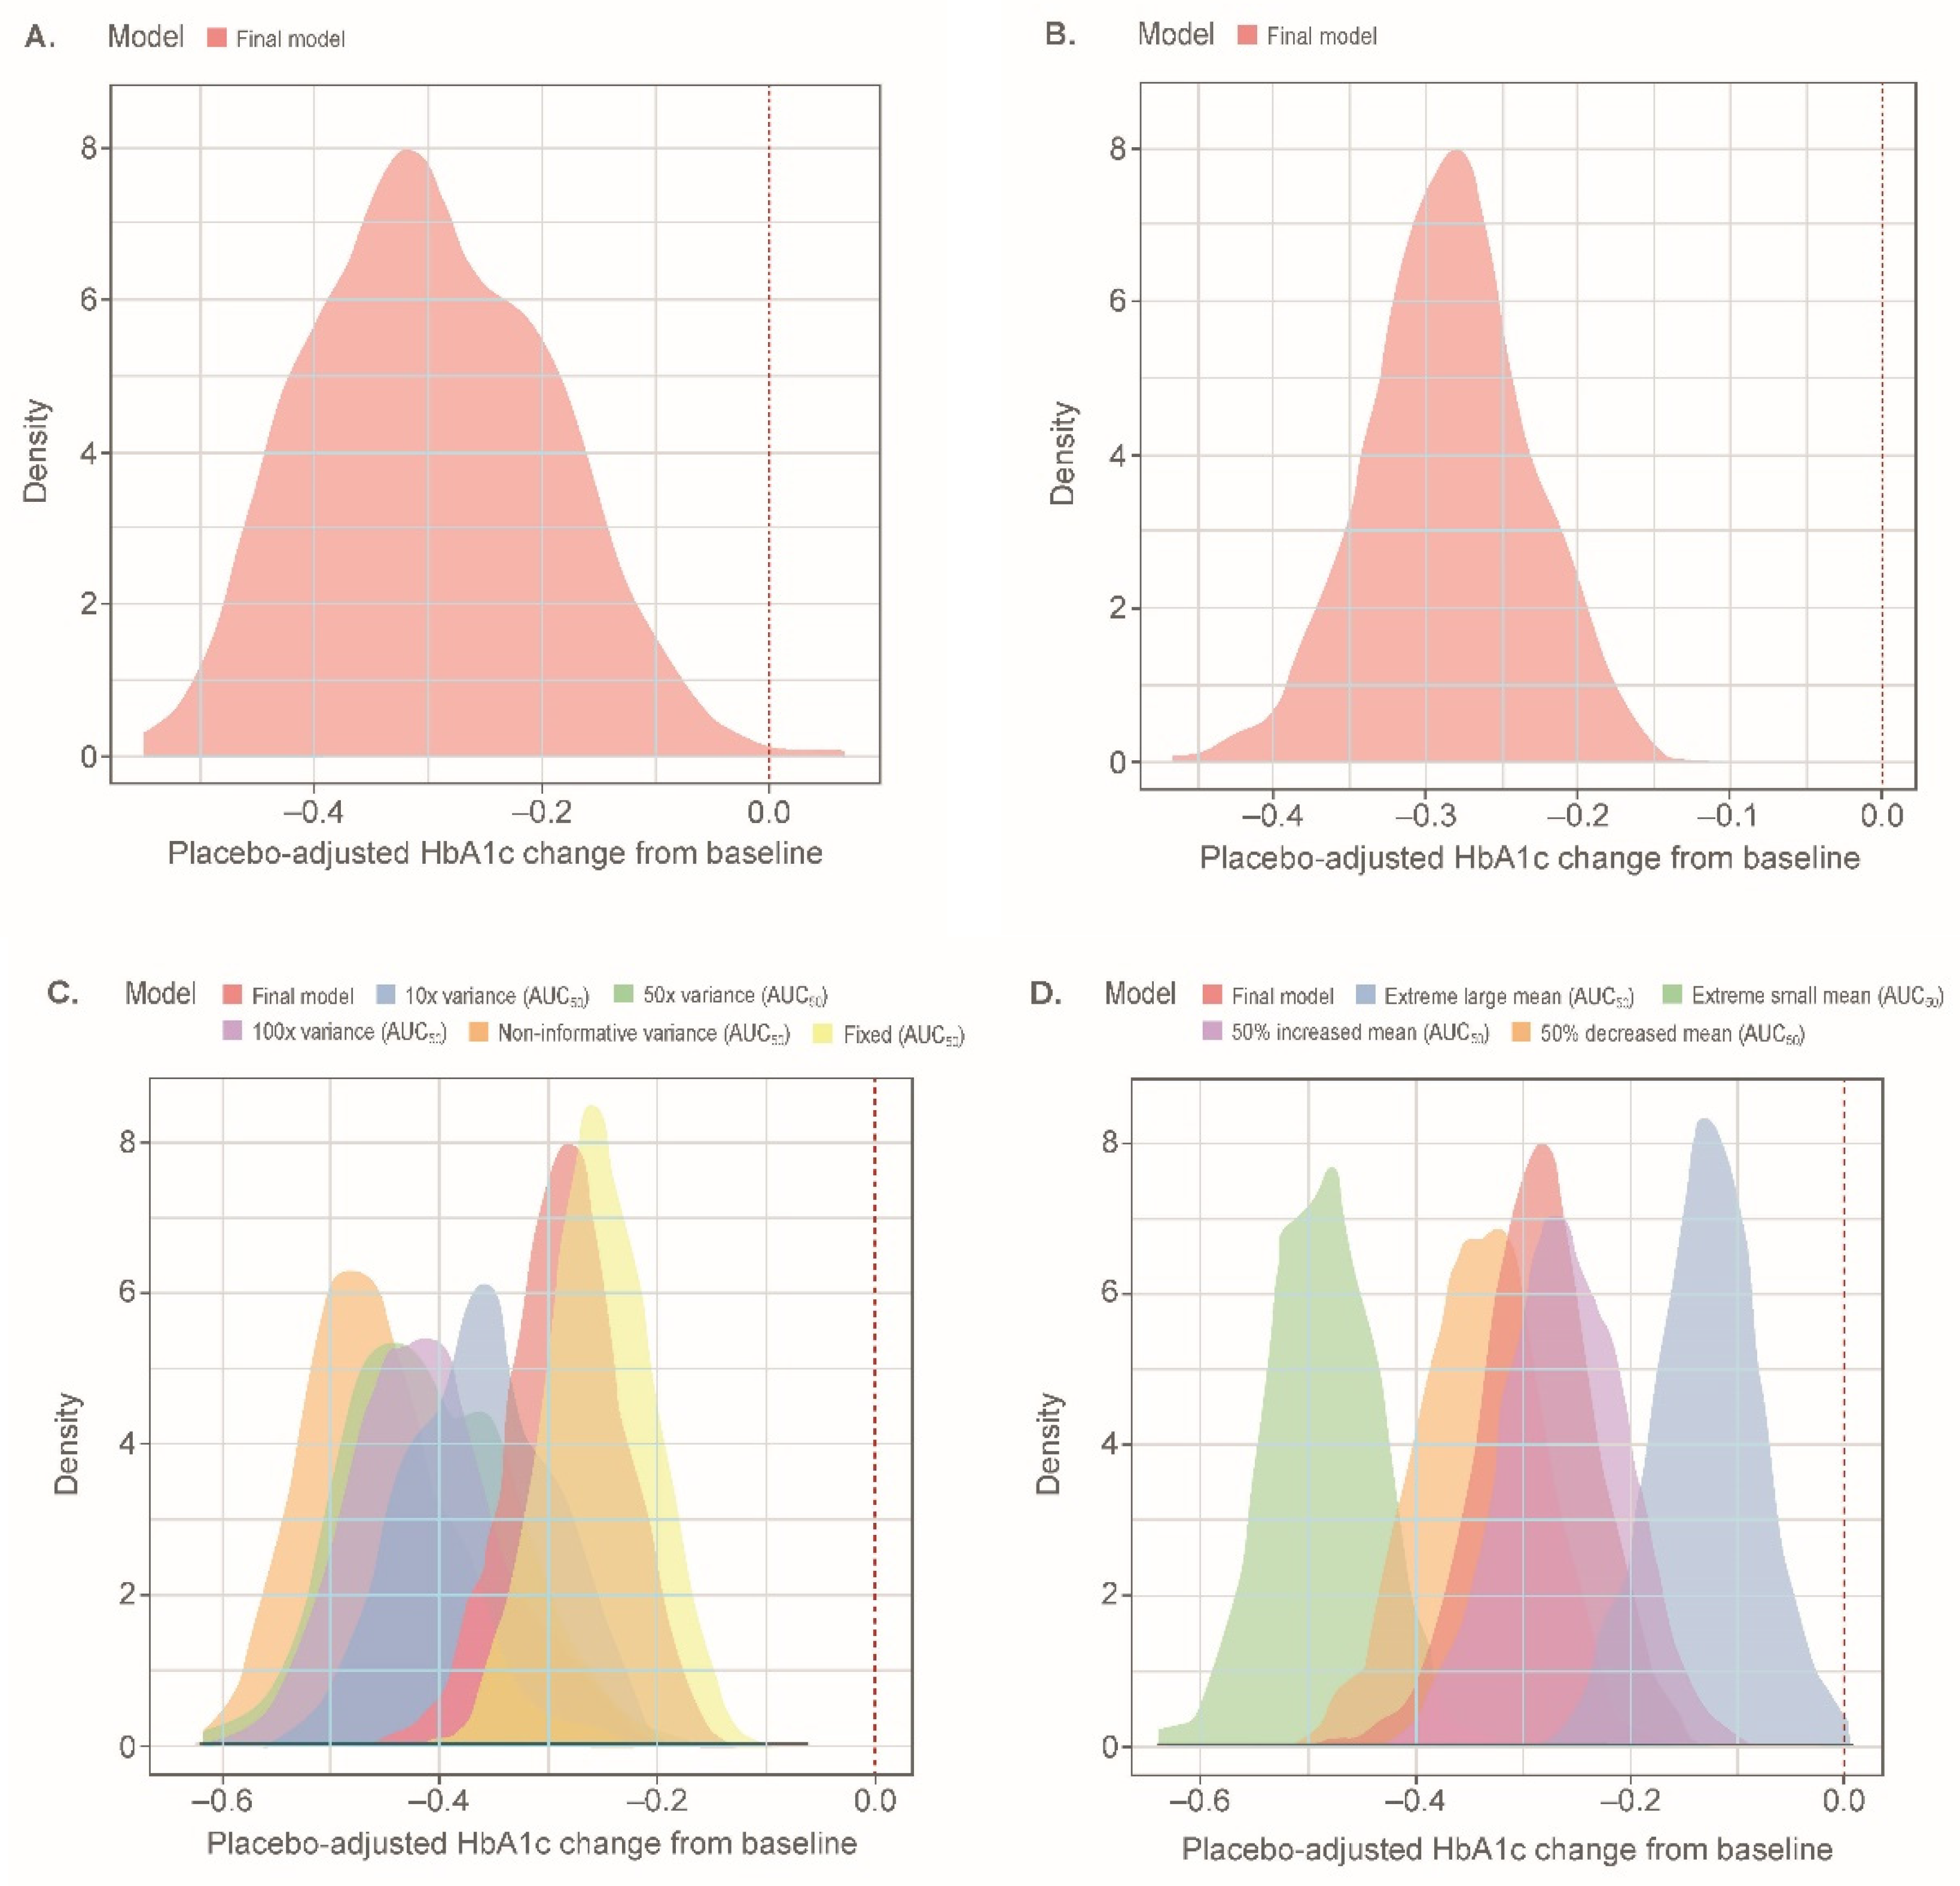
| Sensitivity analysis and predictions of response | EASE-2 (empagliflozin-treated patients) | Steady-state exposures at the 2.5-mg dose level were generated using individual-specific empirical Bayes estimate of the PK parameters. 239 patients from the M-EASE-2 population were randomly sampled, without replacement, for each of the 500 simulations. Parameter uncertainty was incorporated via the covariance matrix and the posterior distribution for M-EASE-1 and M-EASE-2, respectively |
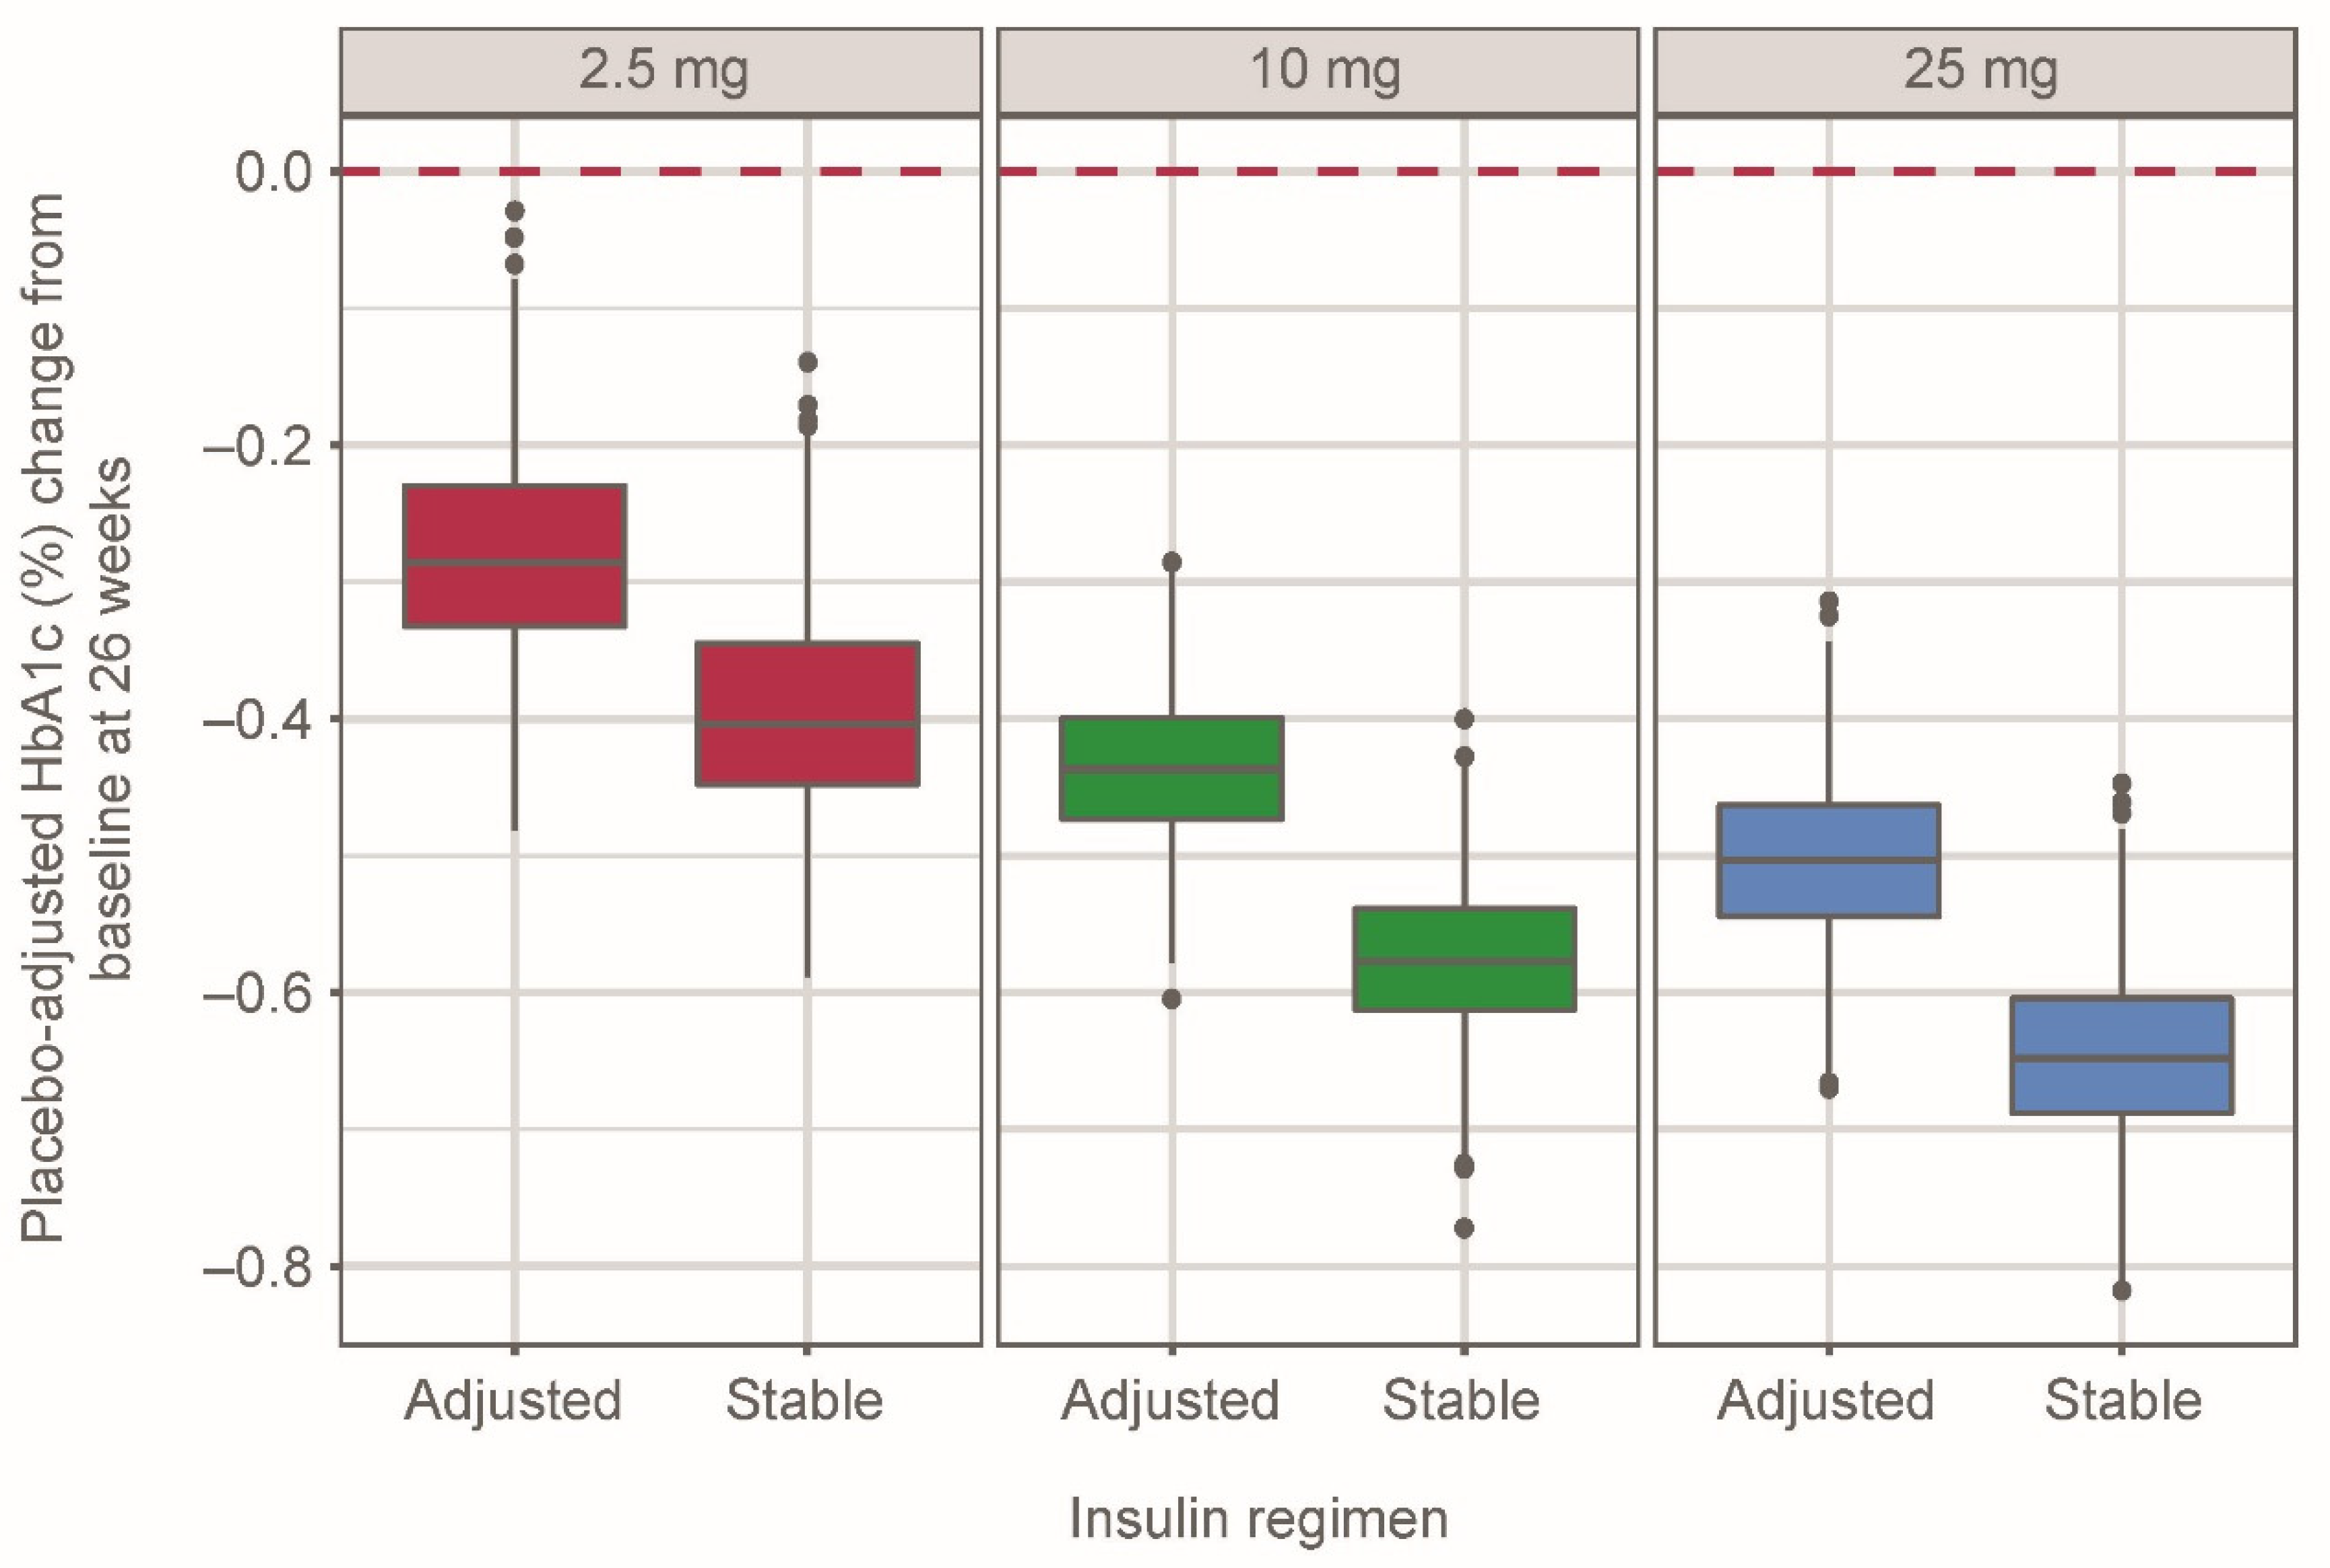
| M-EASE-1 semi-mechanistic | ||
| Stable vs. adjustable insulin | EASE-1, EASE-2, EASE-3 | Each of the 500 simulations included 500 patients per dose group (placebo, EMPA 2.5, 10, and 25 mg qd) randomly sampled from the full data set (EASE-1, -2, and -3 populations); parameter uncertainty was incorporated via the covariance matrix. Two scenarios with and without an EMPA exposure effect on TDID (hypothetical stable insulin) were performed |
| Key Parameters in M-EASE-2 | Reference patient: Male, MDI of insulin, baseline total daily dose = 0.660 U/kg, HbA1c = 8.1%, eGFR = 98 mL/min/1.73 m2, and baseline body weight = 82 kg. | |
| Parameter | Estimate, median | 95% CI |
| Baseline HbA1c, % | 8.14 | 8.07, 8.22 |
| AUC50, nmol·h/L | 498 | 296, 819 |
| Emax, % | 0.579 | 0.491, 0.678 |
| Placebo effect, %/h | 2.61 × 10⁻⁵ | 1.96 × 10⁻⁵, 3.29 × 10⁻⁵ |
| Key parameters in M-EASE-1 | Reference patient: Male, eGFR = 99 mL/min/1.73 m2, body weight = 82 kg, cumulative MDG over 24 h, MDG = 4266 mg·day/dL | |
| Parameter | Estimate, median | 95% CI |
| Baseline HbA1c, % | 8.15 | 8.09, 8.21 |
| AUC50 for TDIDEASE-1, nmol·h/L | 110 | 14.3, 836 |
| Emax for TDID | 0.186 | 0.145, 0.238 |
| AUC50 for MDG, nmol·h/L | 370 | 83.9, 1630 |
| Emax for MDG, mg·day/dL | 634 | 534, 753 |
| WTHbA1c | −0.0258 | −0.0528, 0.00125 |
| SEXHbA1c | 0.99 | 0.98, 1 |
| γMDG EFF | 0.487 | 0.445, 0.532 |
Publisher’s Note: MDPI stays neutral with regard to jurisdictional claims in published maps and institutional affiliations. |
© 2021 by the authors. Licensee MDPI, Basel, Switzerland. This article is an open access article distributed under the terms and conditions of the Creative Commons Attribution (CC BY) license (https://creativecommons.org/licenses/by/4.0/).
Share and Cite
Johnston, C.K.; Eudy-Byrne, R.J.; Elmokadem, A.; Nock, V.; Marquard, J.; Soleymanlou, N.; Riggs, M.M.; Liesenfeld, K.-H. A Model-Informed Drug Development (MIDD) Approach for a Low Dose of Empagliflozin in Patients with Type 1 Diabetes. Pharmaceutics 2021, 13, 485. https://doi.org/10.3390/pharmaceutics13040485
Johnston CK, Eudy-Byrne RJ, Elmokadem A, Nock V, Marquard J, Soleymanlou N, Riggs MM, Liesenfeld K-H. A Model-Informed Drug Development (MIDD) Approach for a Low Dose of Empagliflozin in Patients with Type 1 Diabetes. Pharmaceutics. 2021; 13(4):485. https://doi.org/10.3390/pharmaceutics13040485
Chicago/Turabian StyleJohnston, Curtis K., Rena J. Eudy-Byrne, Ahmed Elmokadem, Valerie Nock, Jan Marquard, Nima Soleymanlou, Matthew M. Riggs, and Karl-Heinz Liesenfeld. 2021. "A Model-Informed Drug Development (MIDD) Approach for a Low Dose of Empagliflozin in Patients with Type 1 Diabetes" Pharmaceutics 13, no. 4: 485. https://doi.org/10.3390/pharmaceutics13040485