
Synthesis of Poly(Ethylene Brassylate-Co-squaric Acid) as Potential Essential Oil Carrier

 , , ,
, , ,  ,
,  and
and
Abstract
:
1. Introduction
2. Materials and Methods
2.1. Materials
2.2. Synthesis Procedure
2.3. PEBSA Copolymer Characterization
2.3.1. Spectroscopic Analyses
2.3.2. Thermal Analysis
2.3.3. Size Measurement
2.3.4. X-ray Diffraction (XRD) Measurements
2.3.5. Microscopy Analyses
2.4. PEBSA_Thymol Bioactive Complex Preparation
2.5. PEBSA_Thymol Bioactive Compound Characterization
Antimicrobial Activity
2.6. Statistical Analysis
3. Results and Discussion
3.1. 1H NMR Spectra
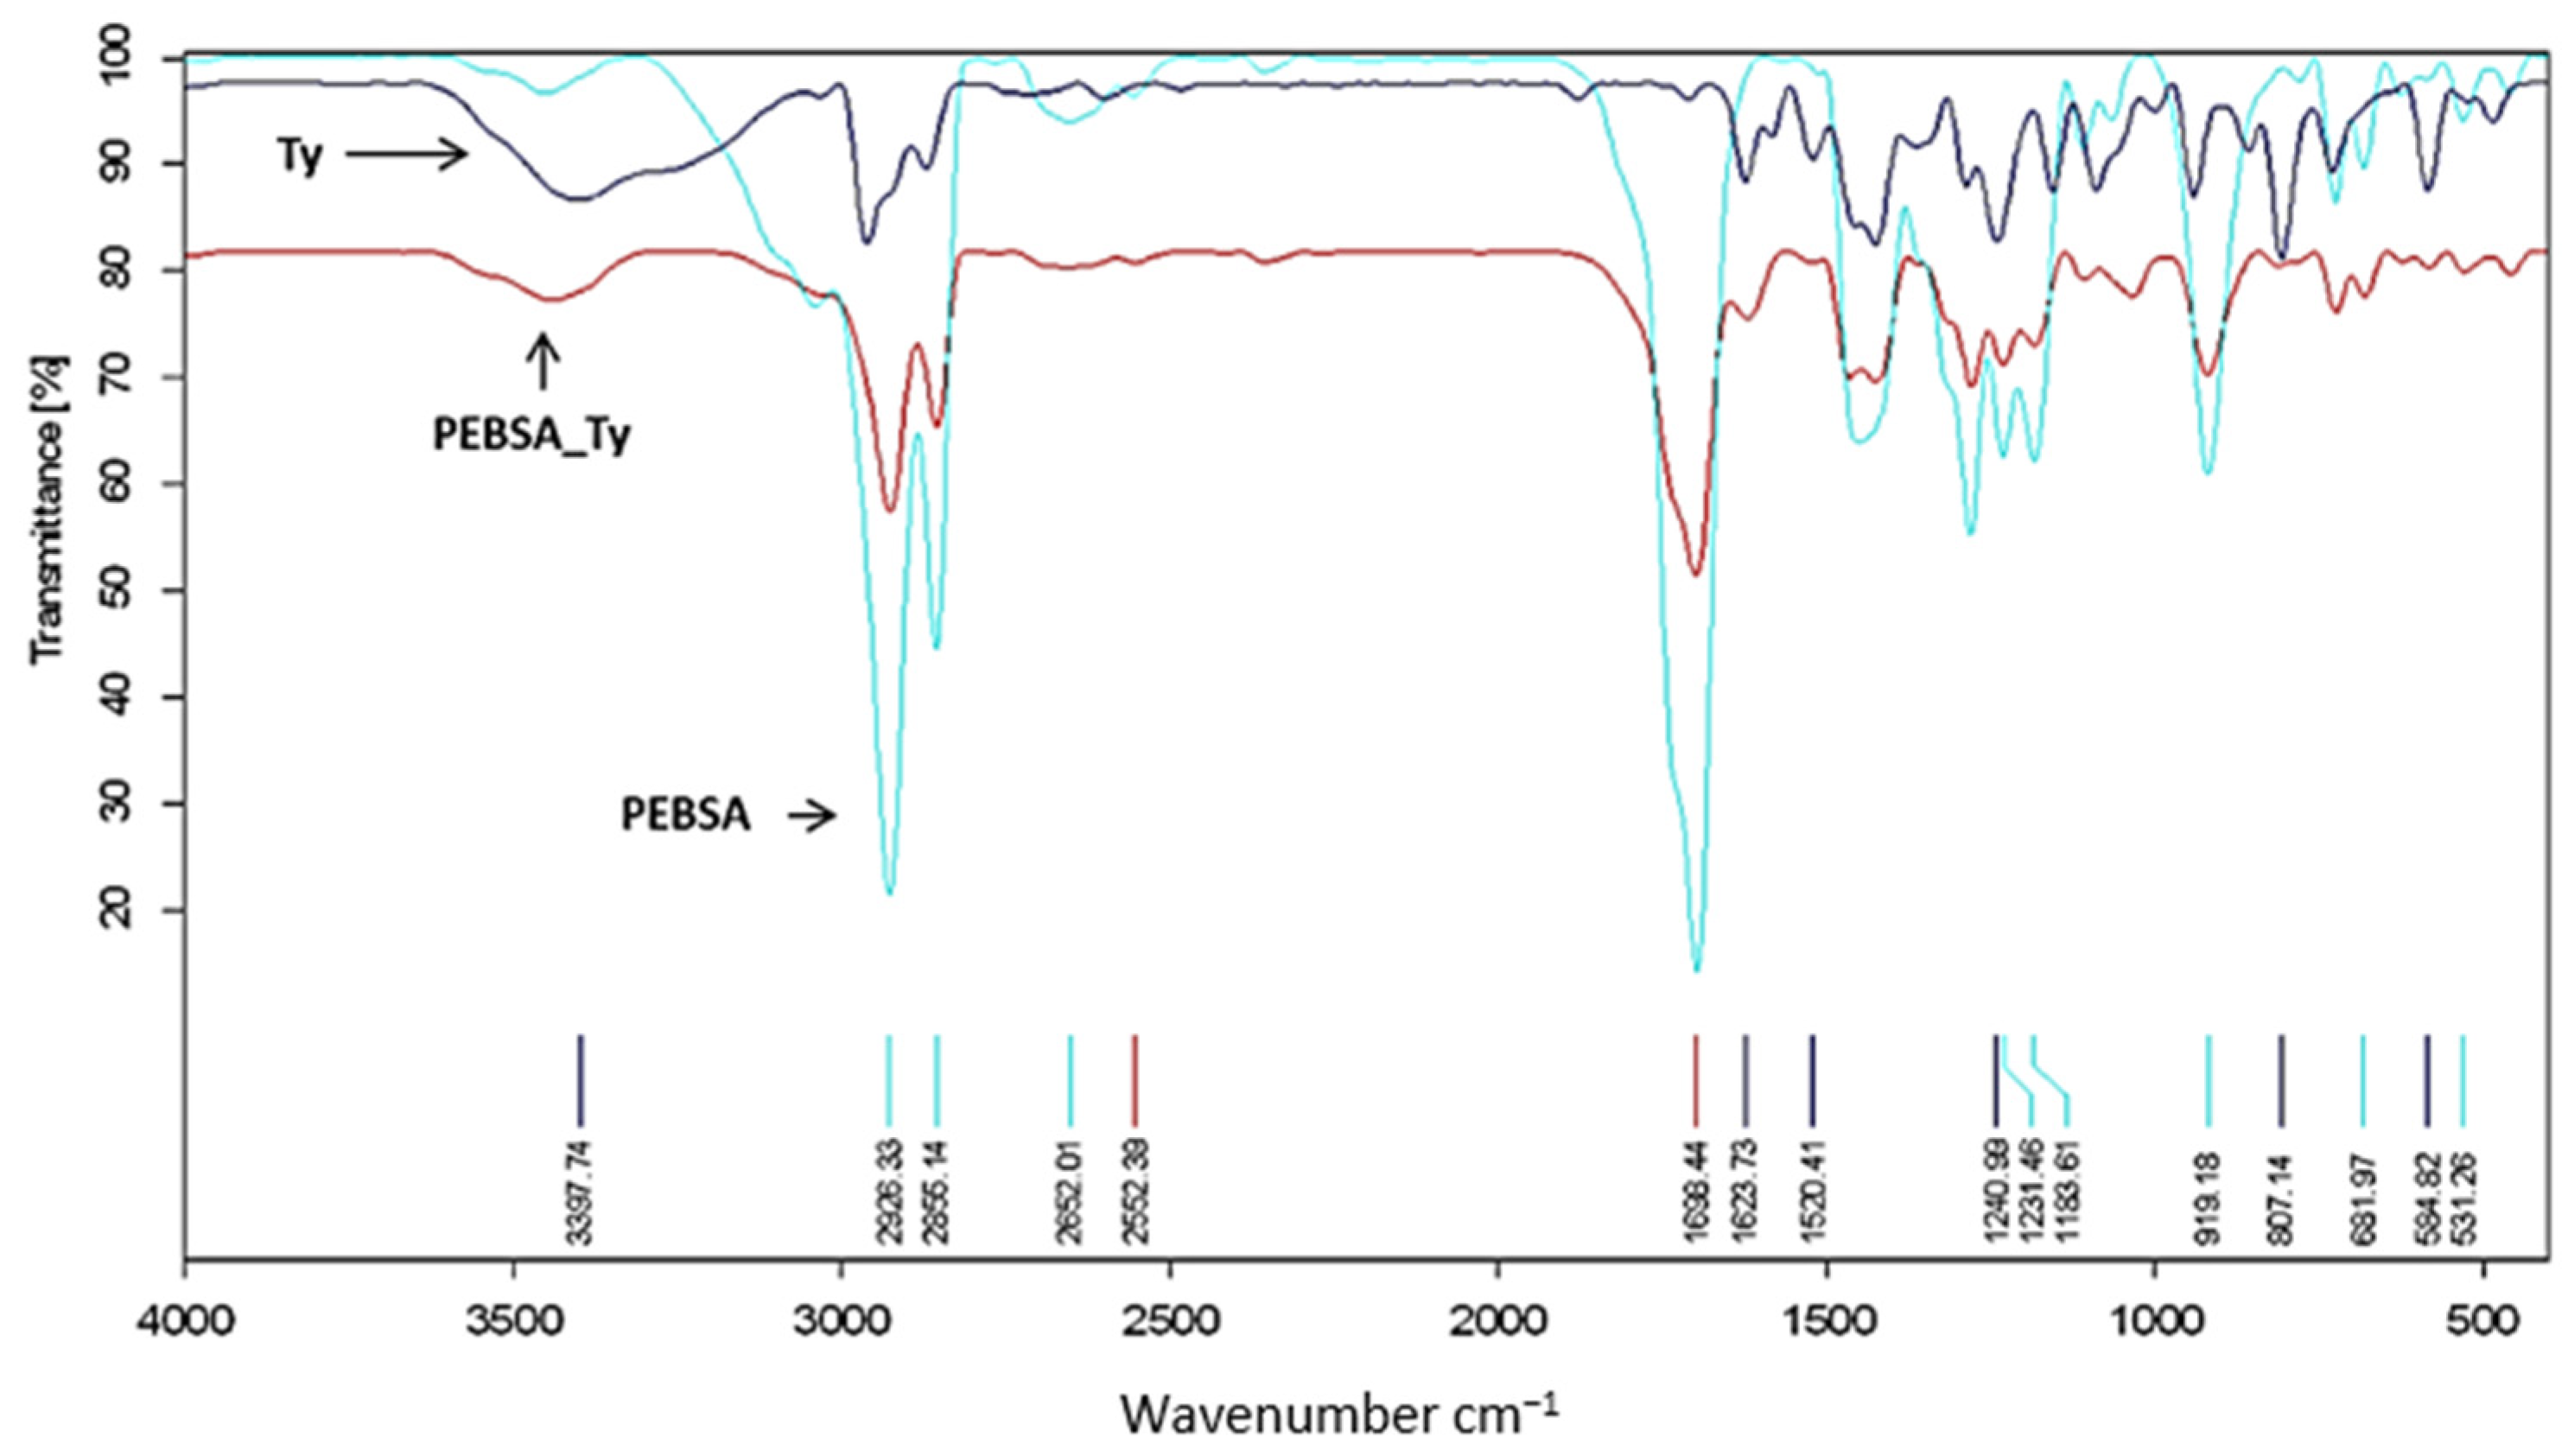
3.2. FTIR Spectra
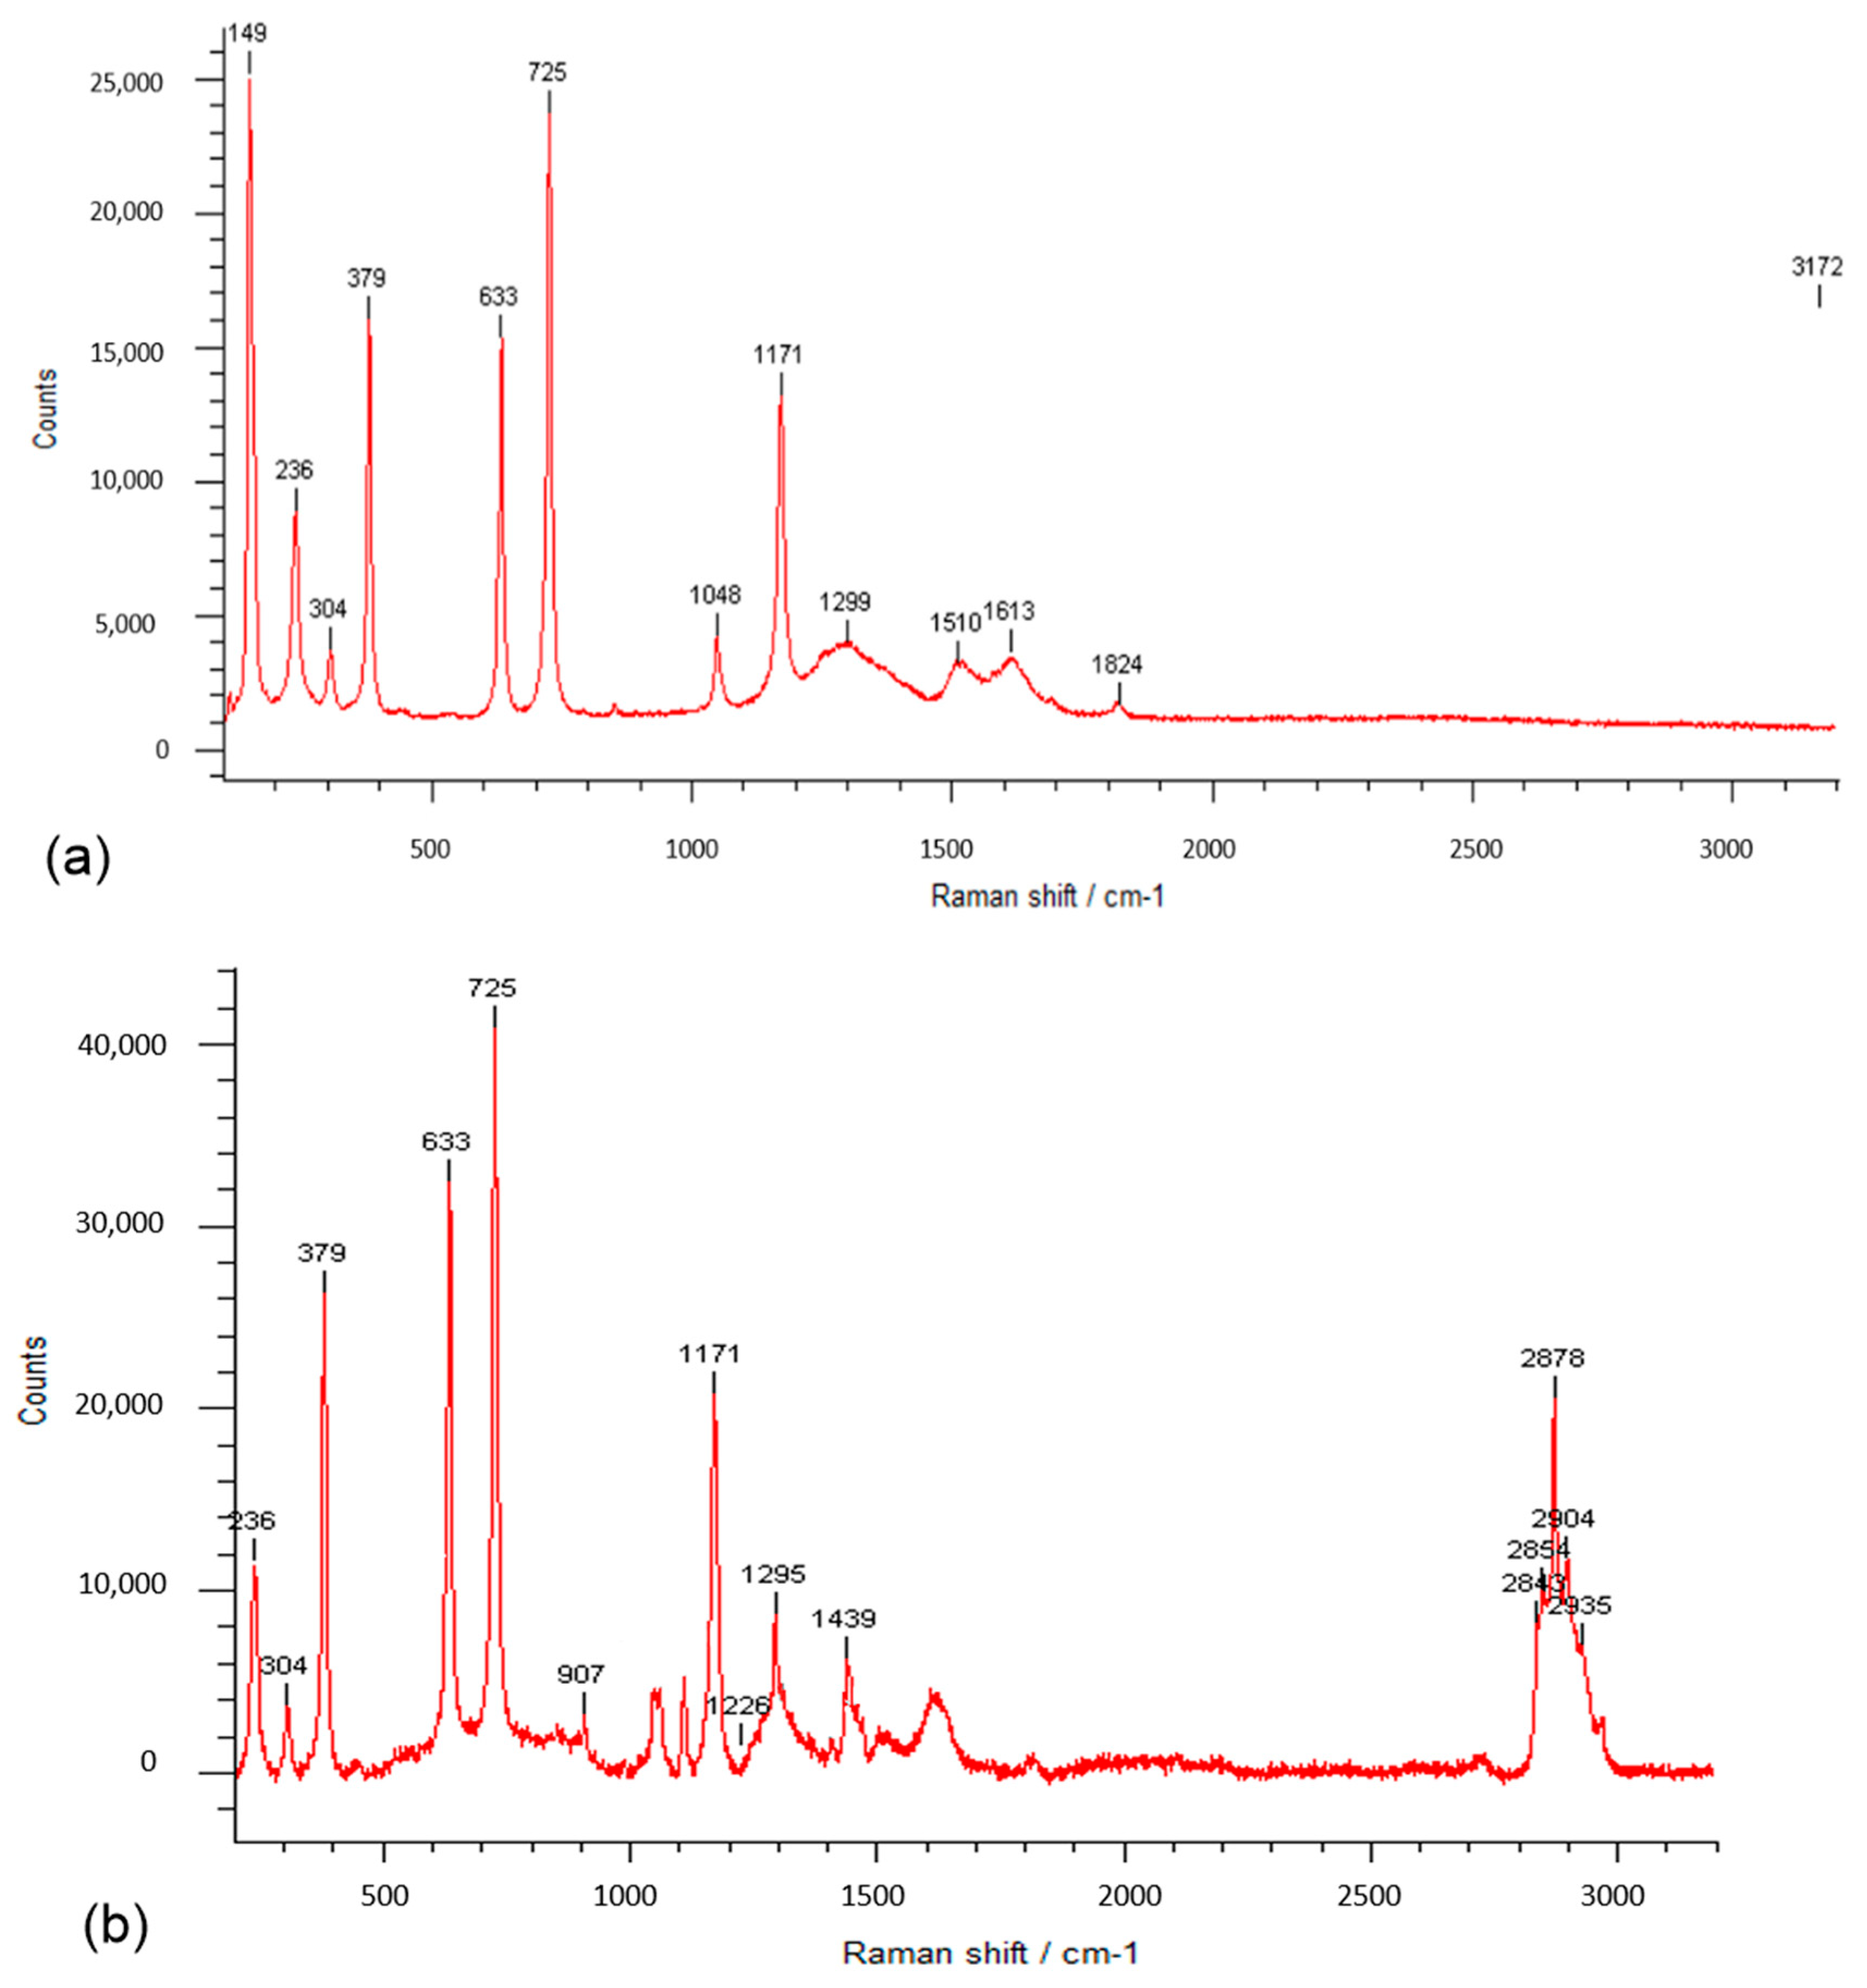
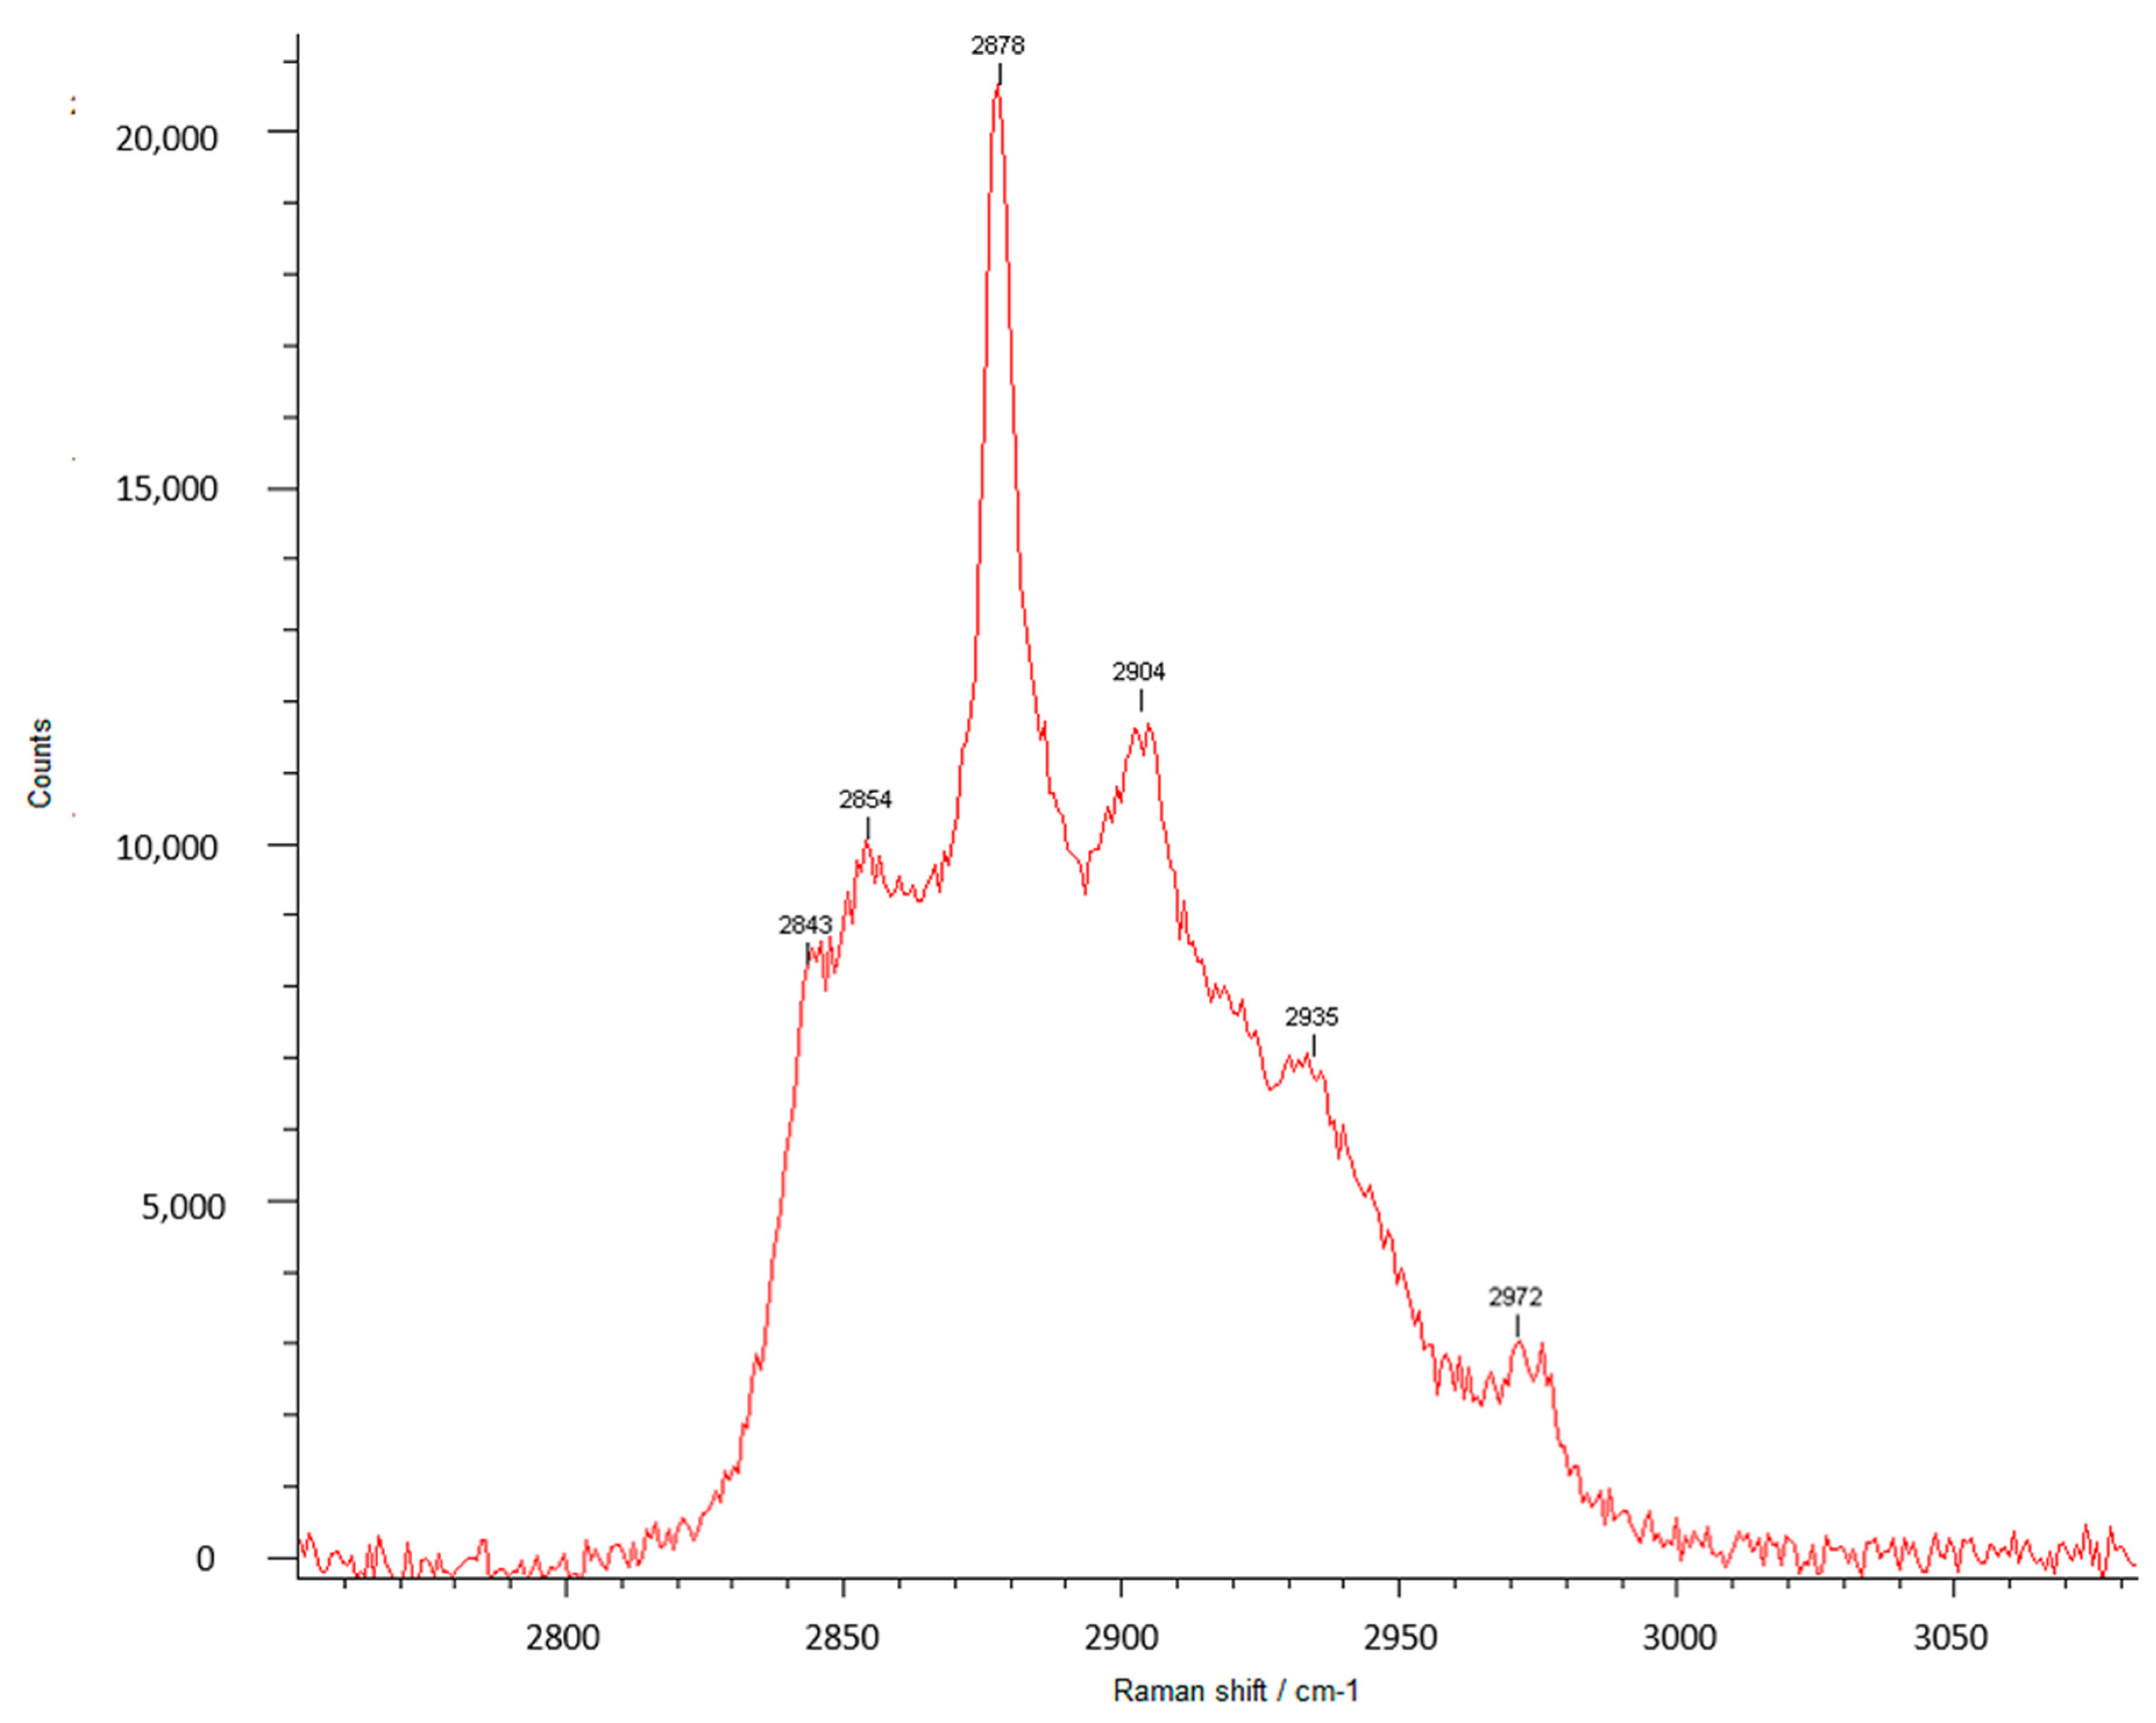
3.3. Raman Spectra
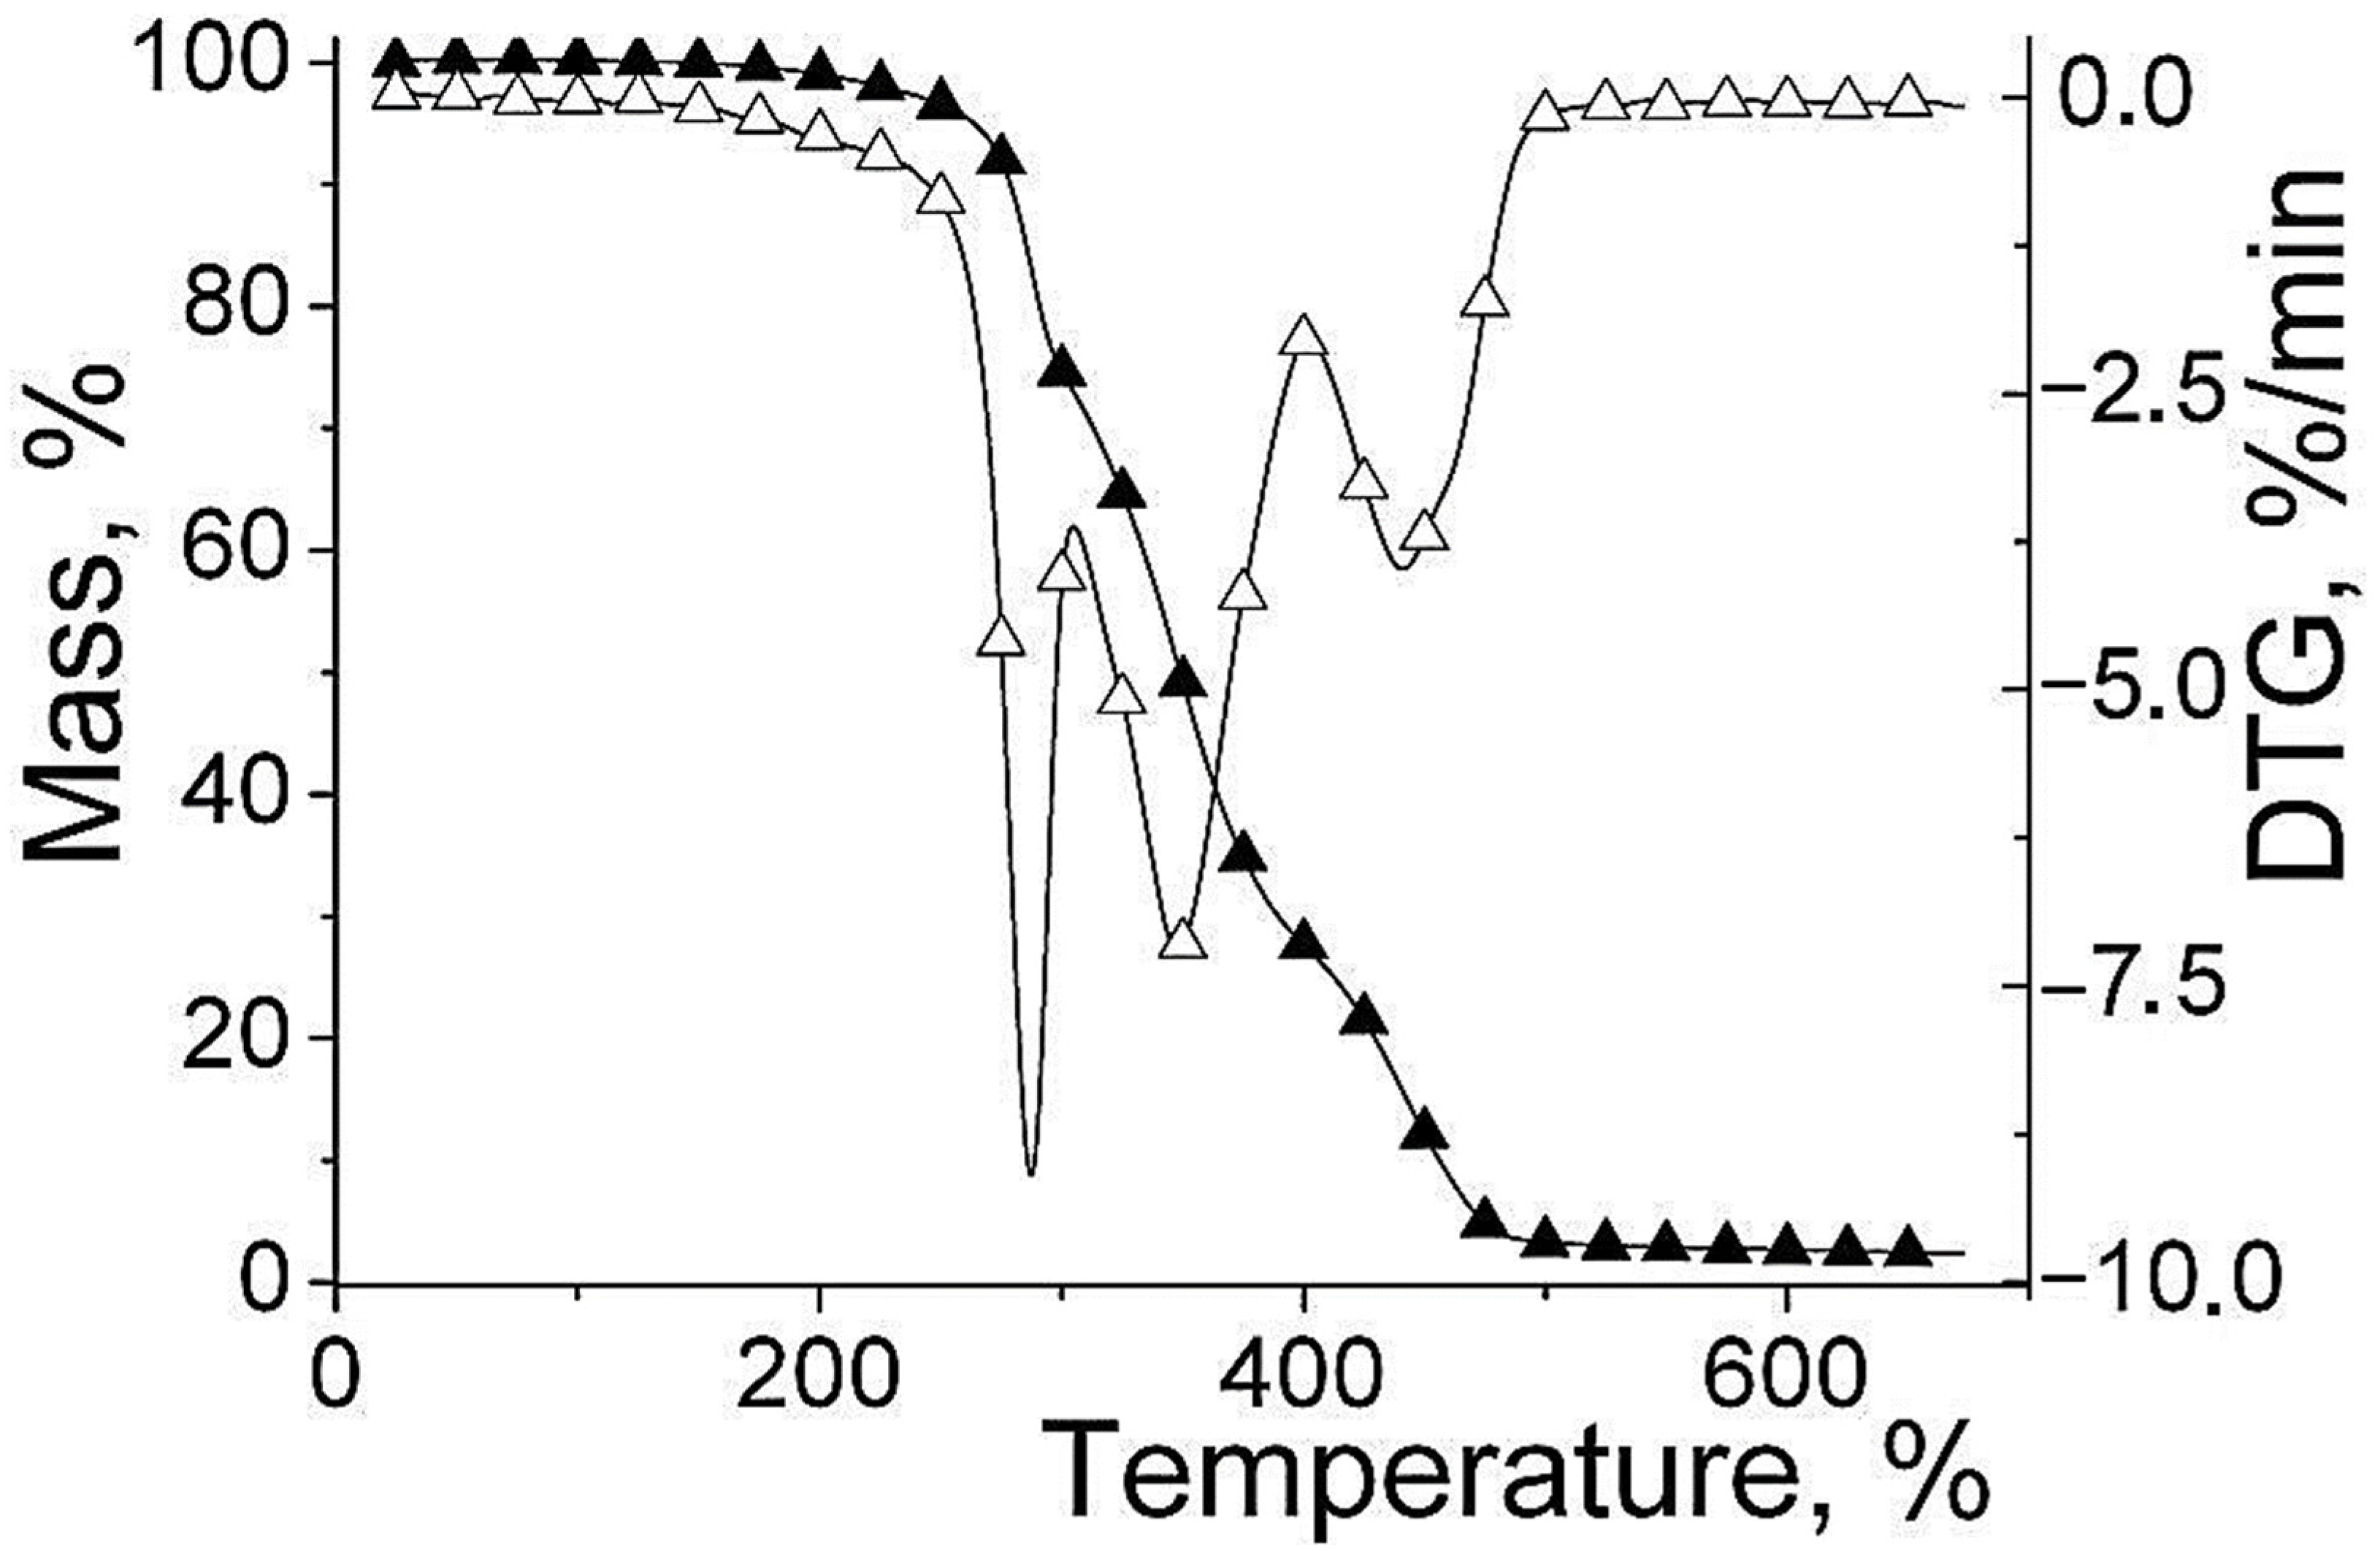
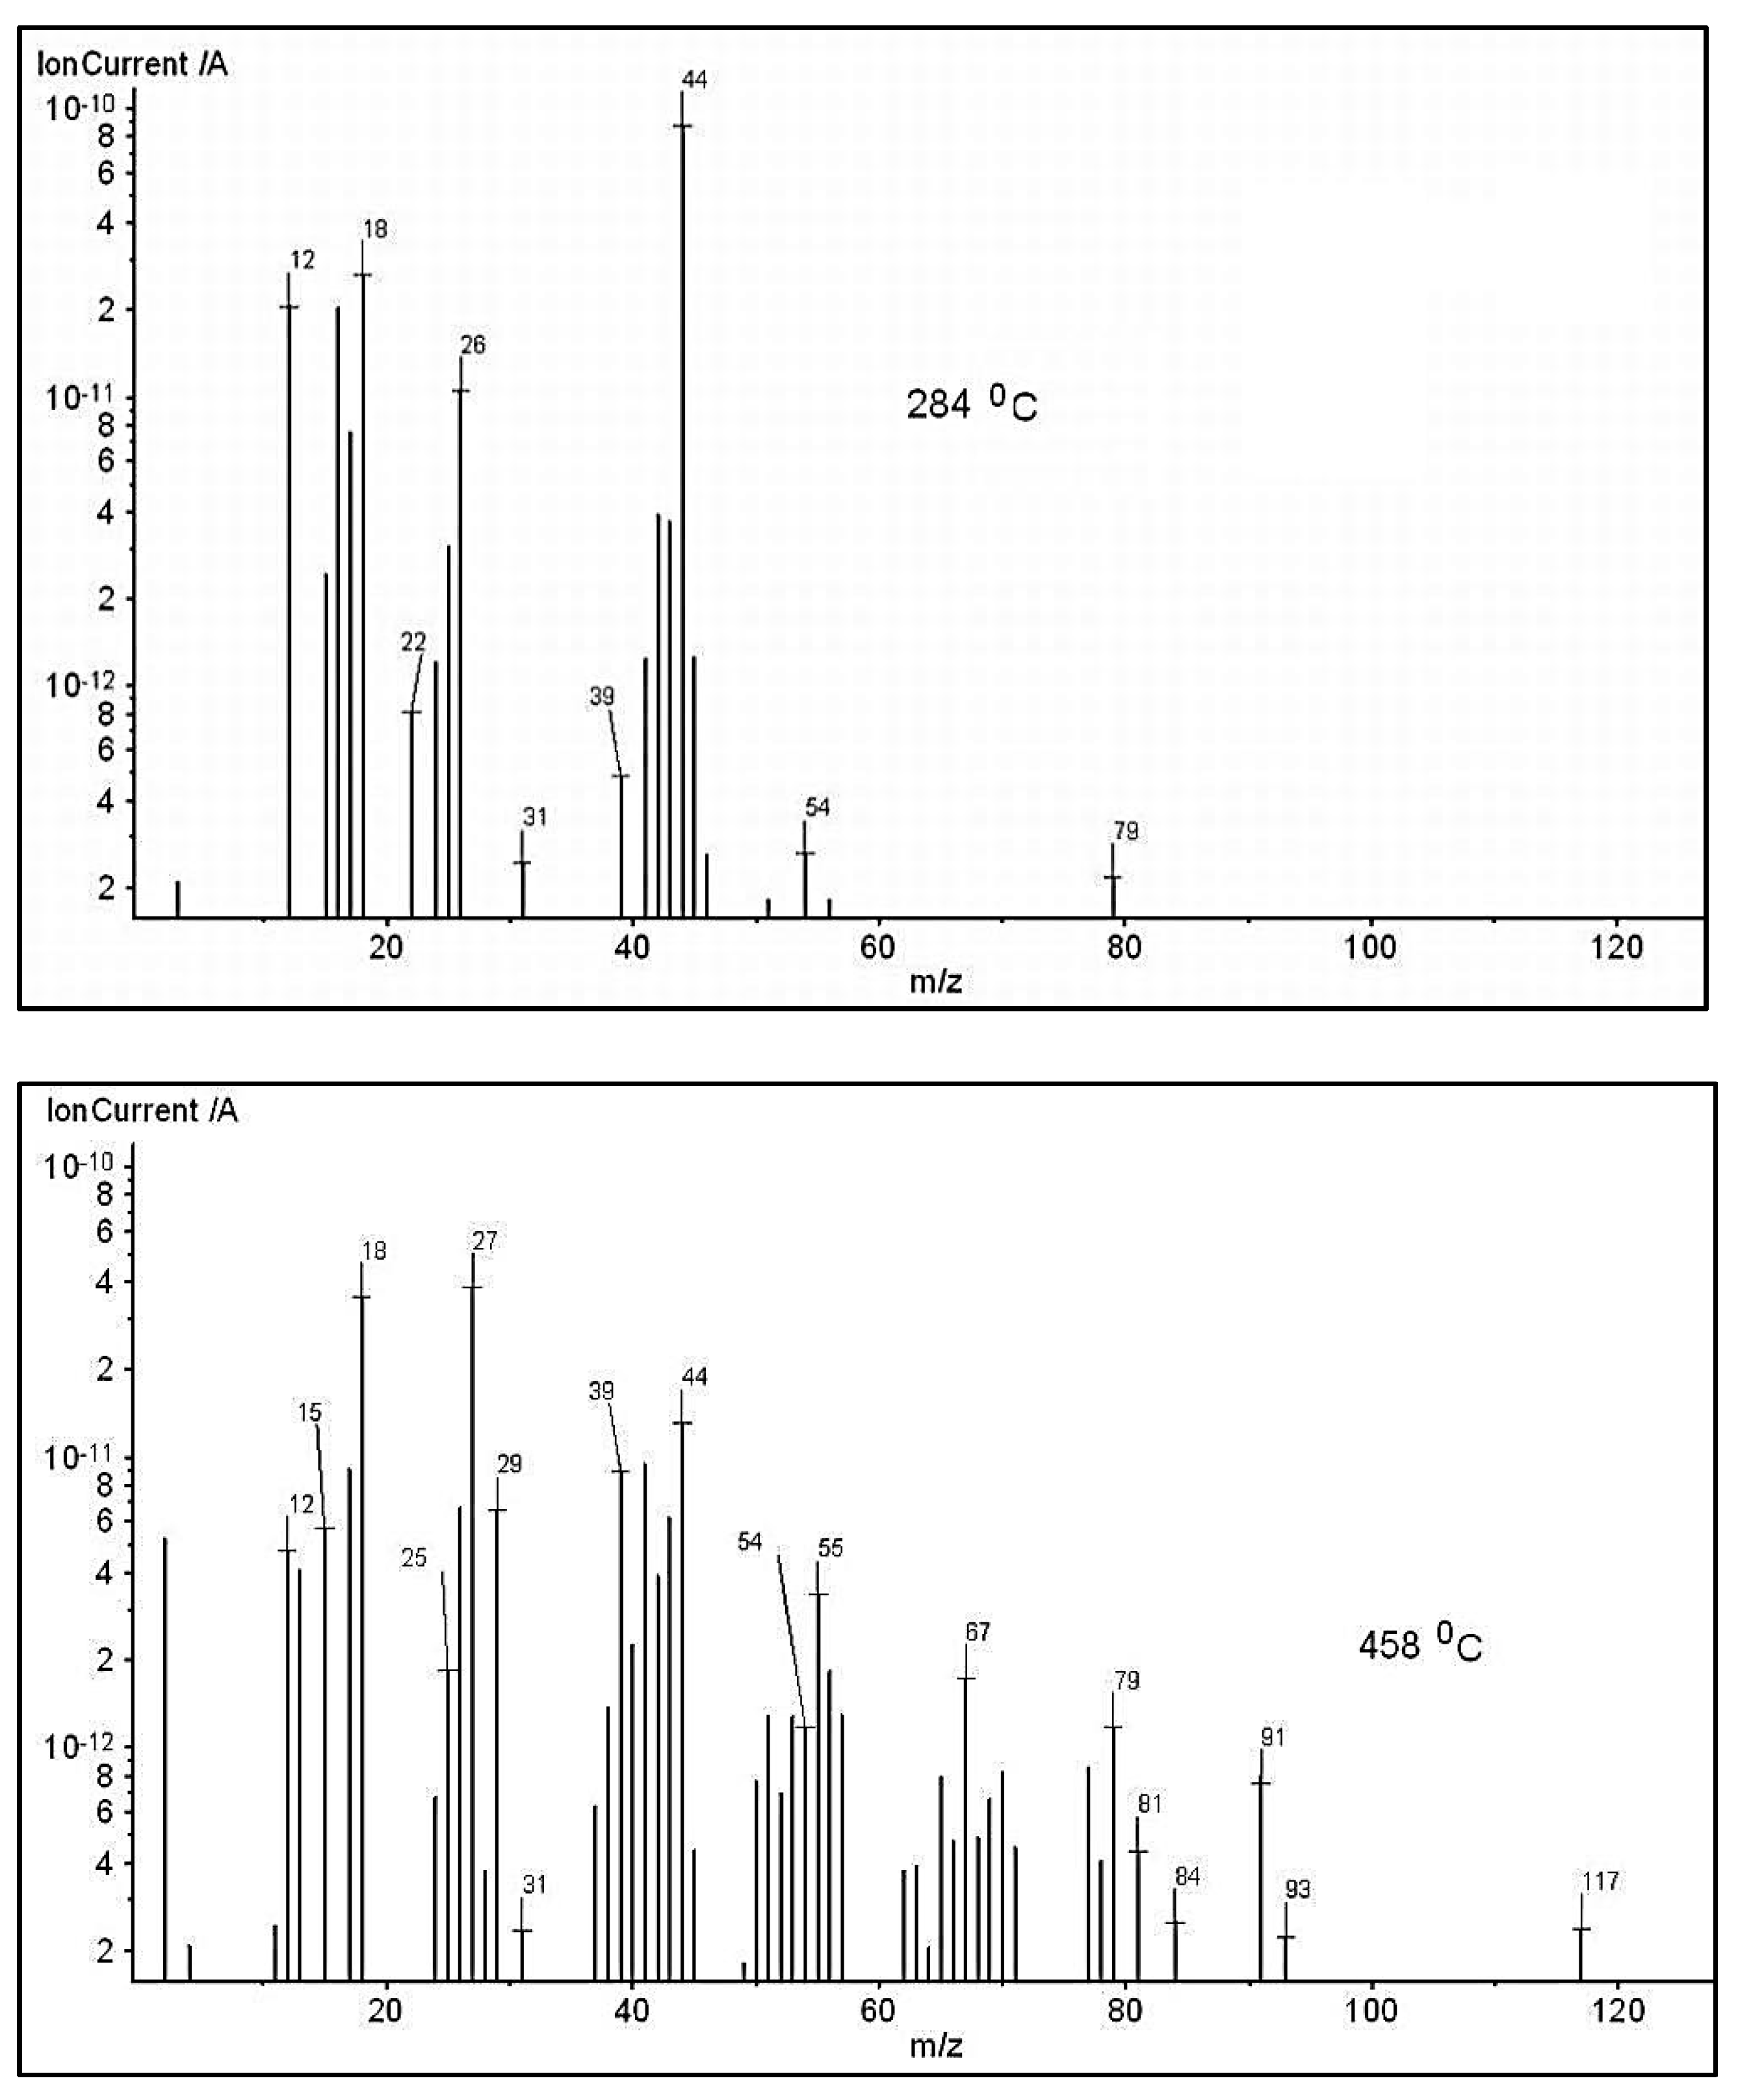
3.4. PEBSA Thermal Behavior
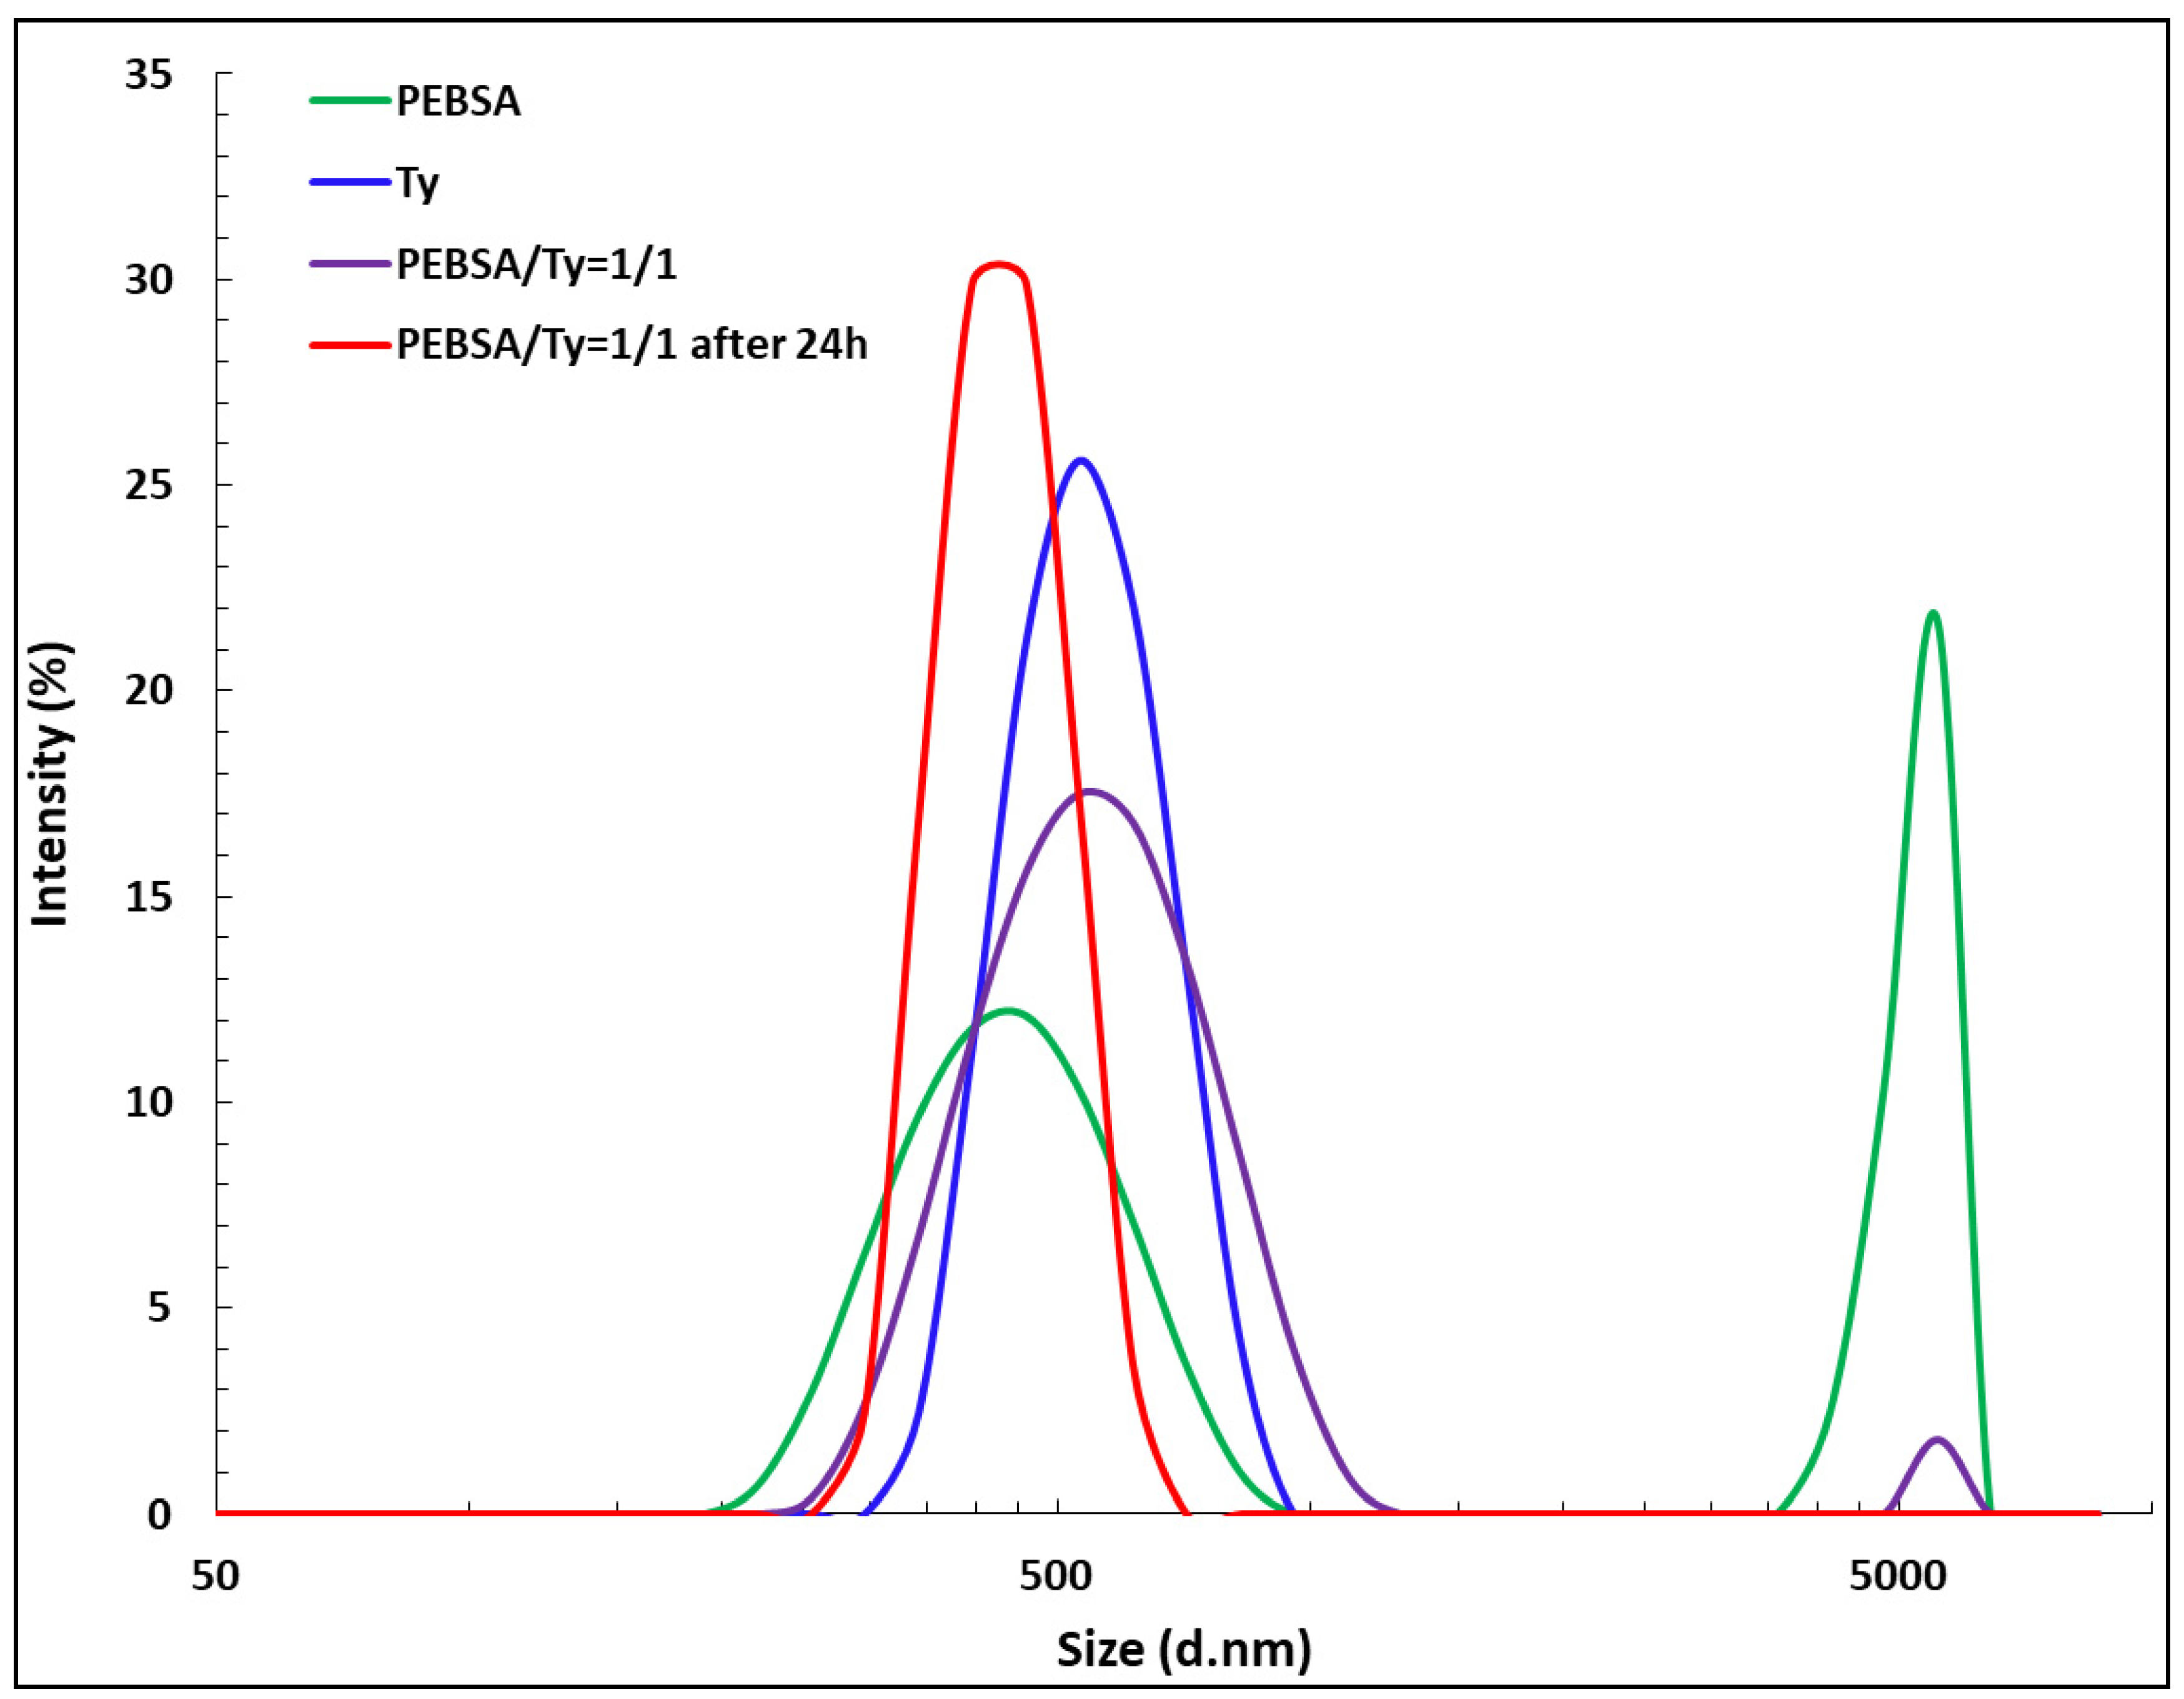
3.5. DLS Measurements
3.6. X Ray
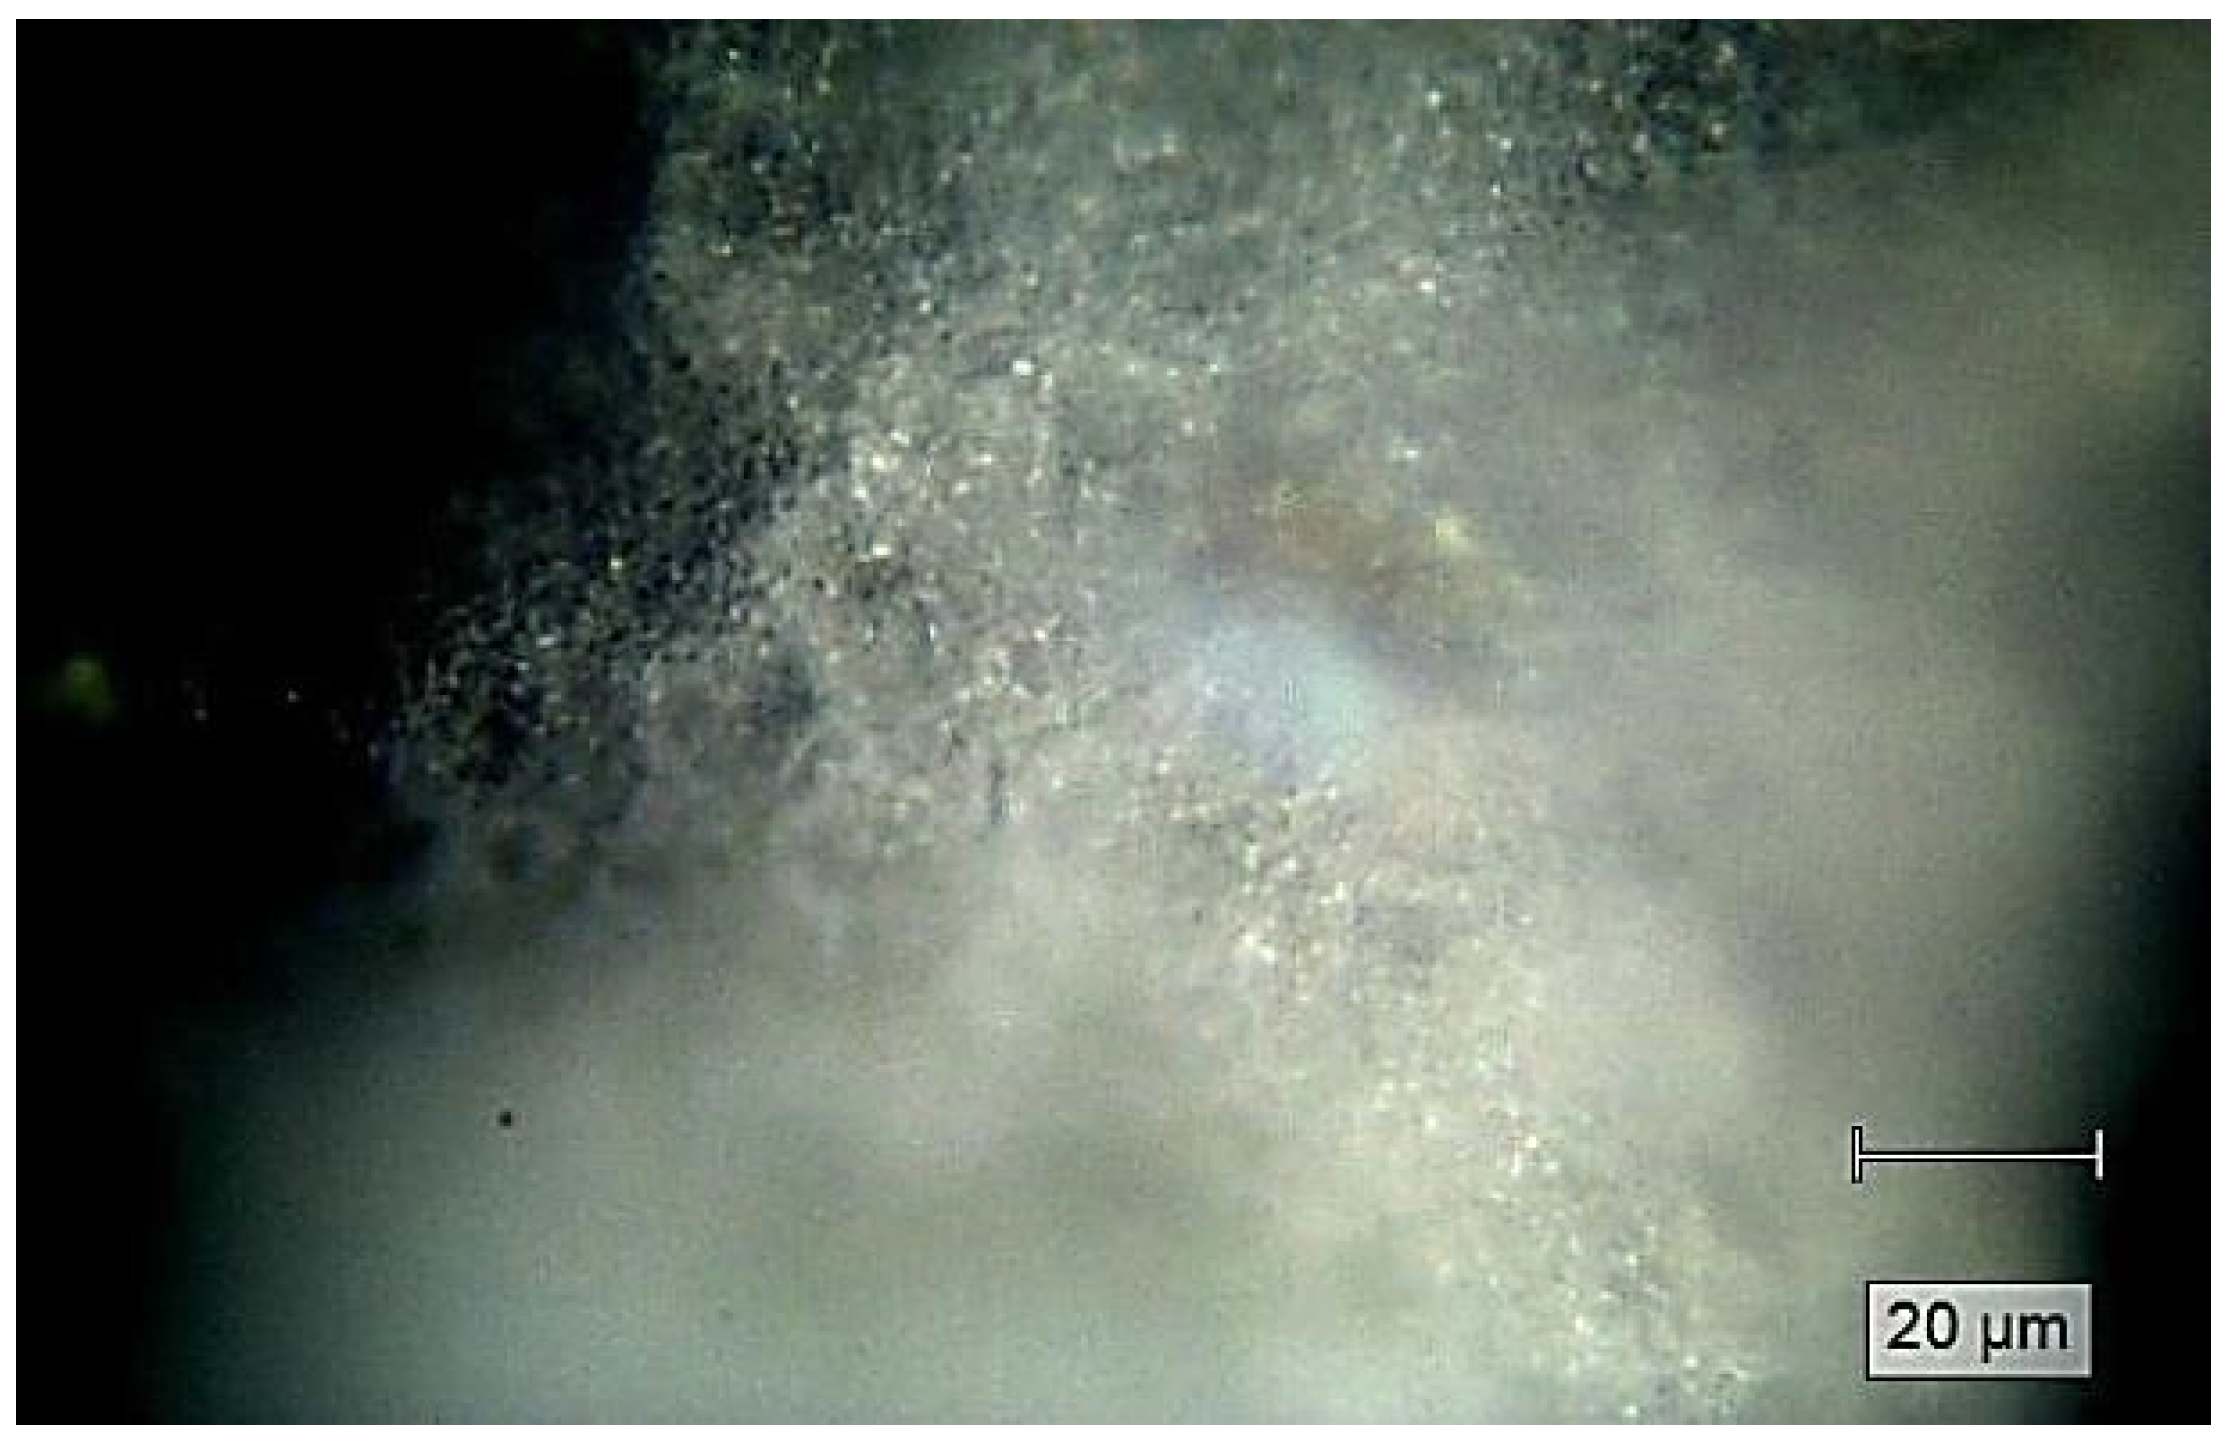
3.7. Microscopy Analyses
Scanning Electron Microscopy Studies
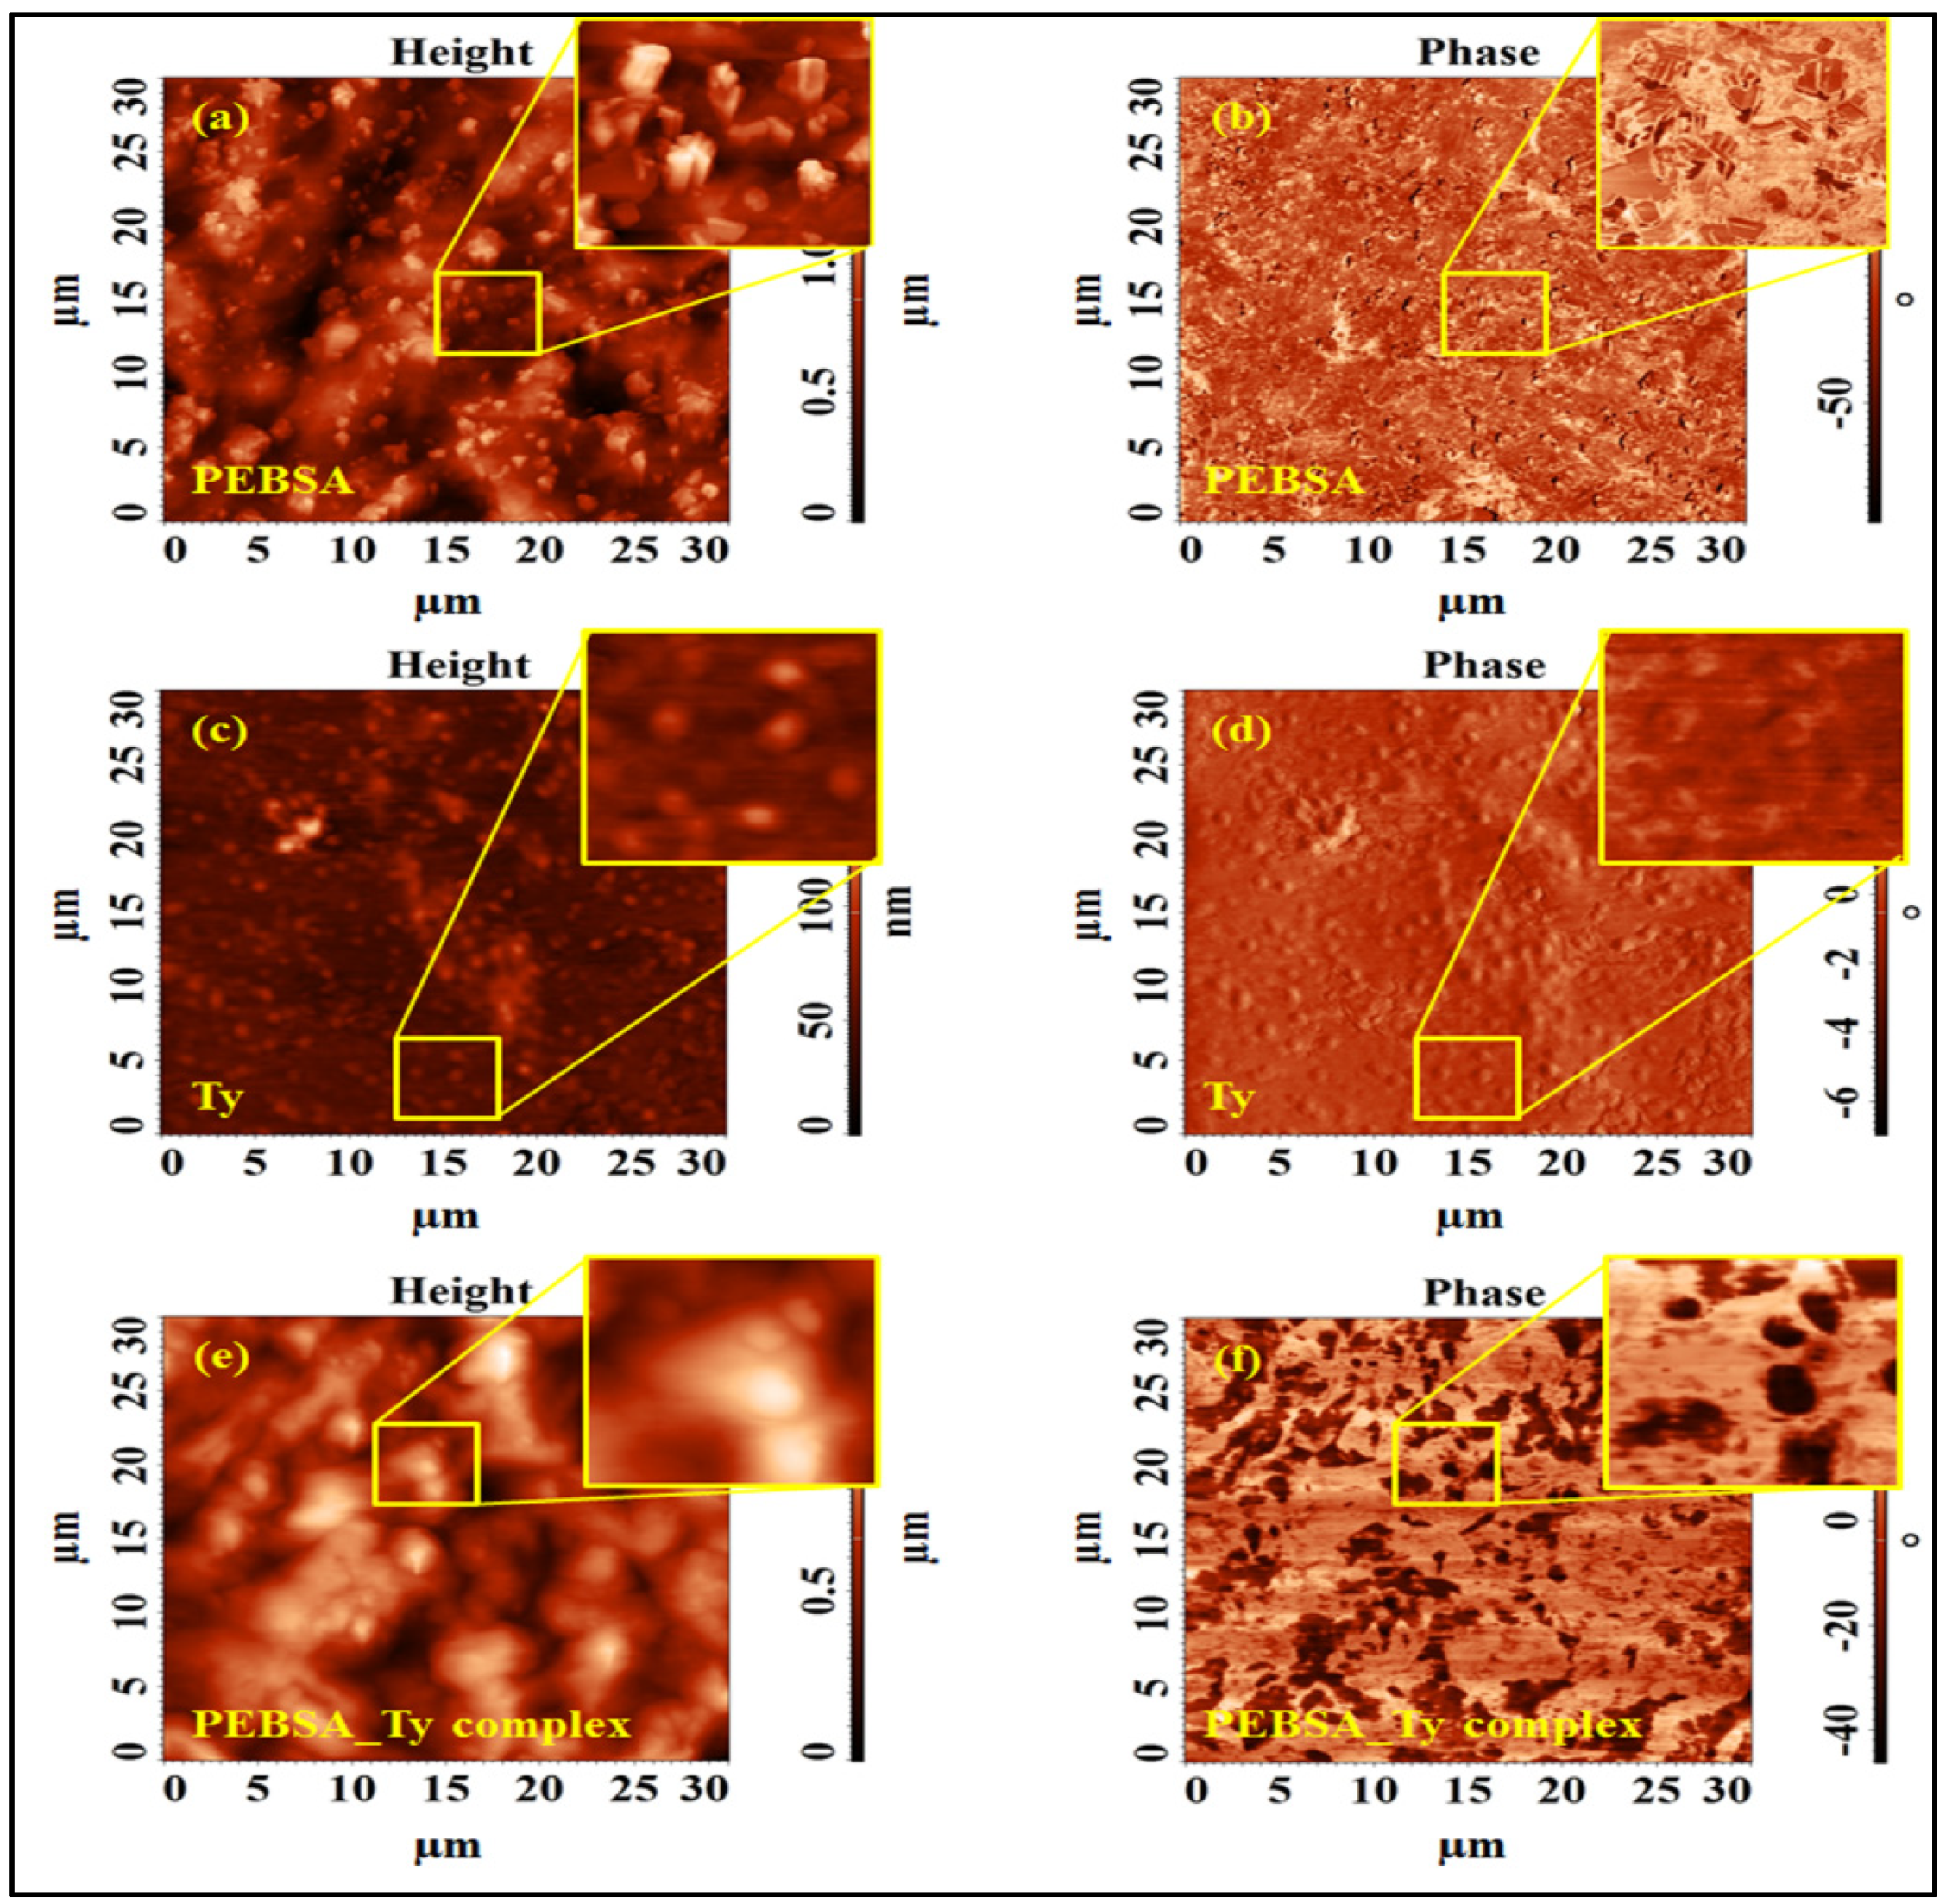
3.8. AFM Studies
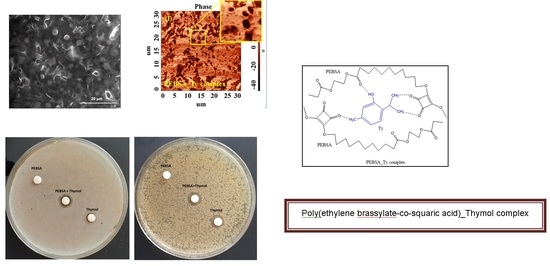
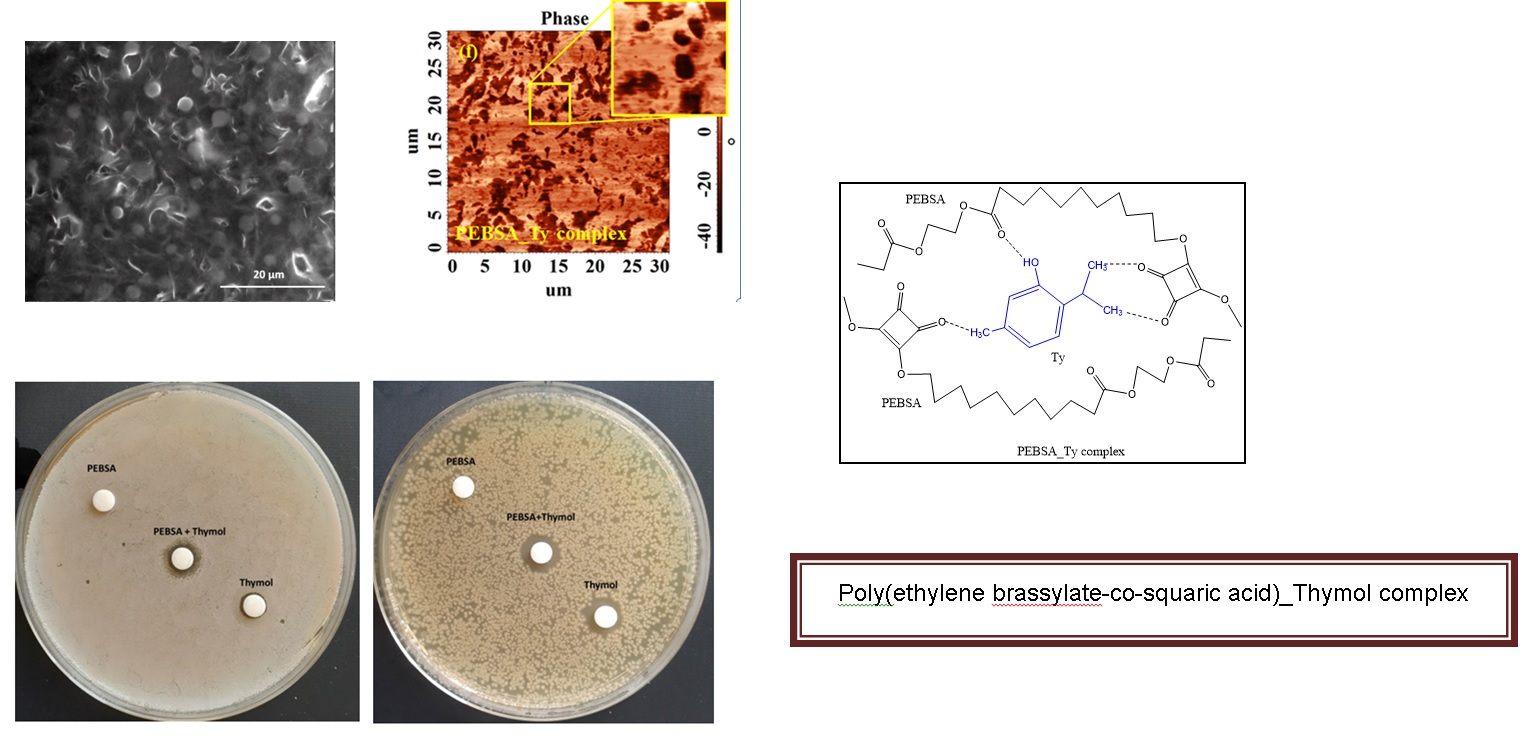
3.9. PEBSA_Thymol Bioactive Complex
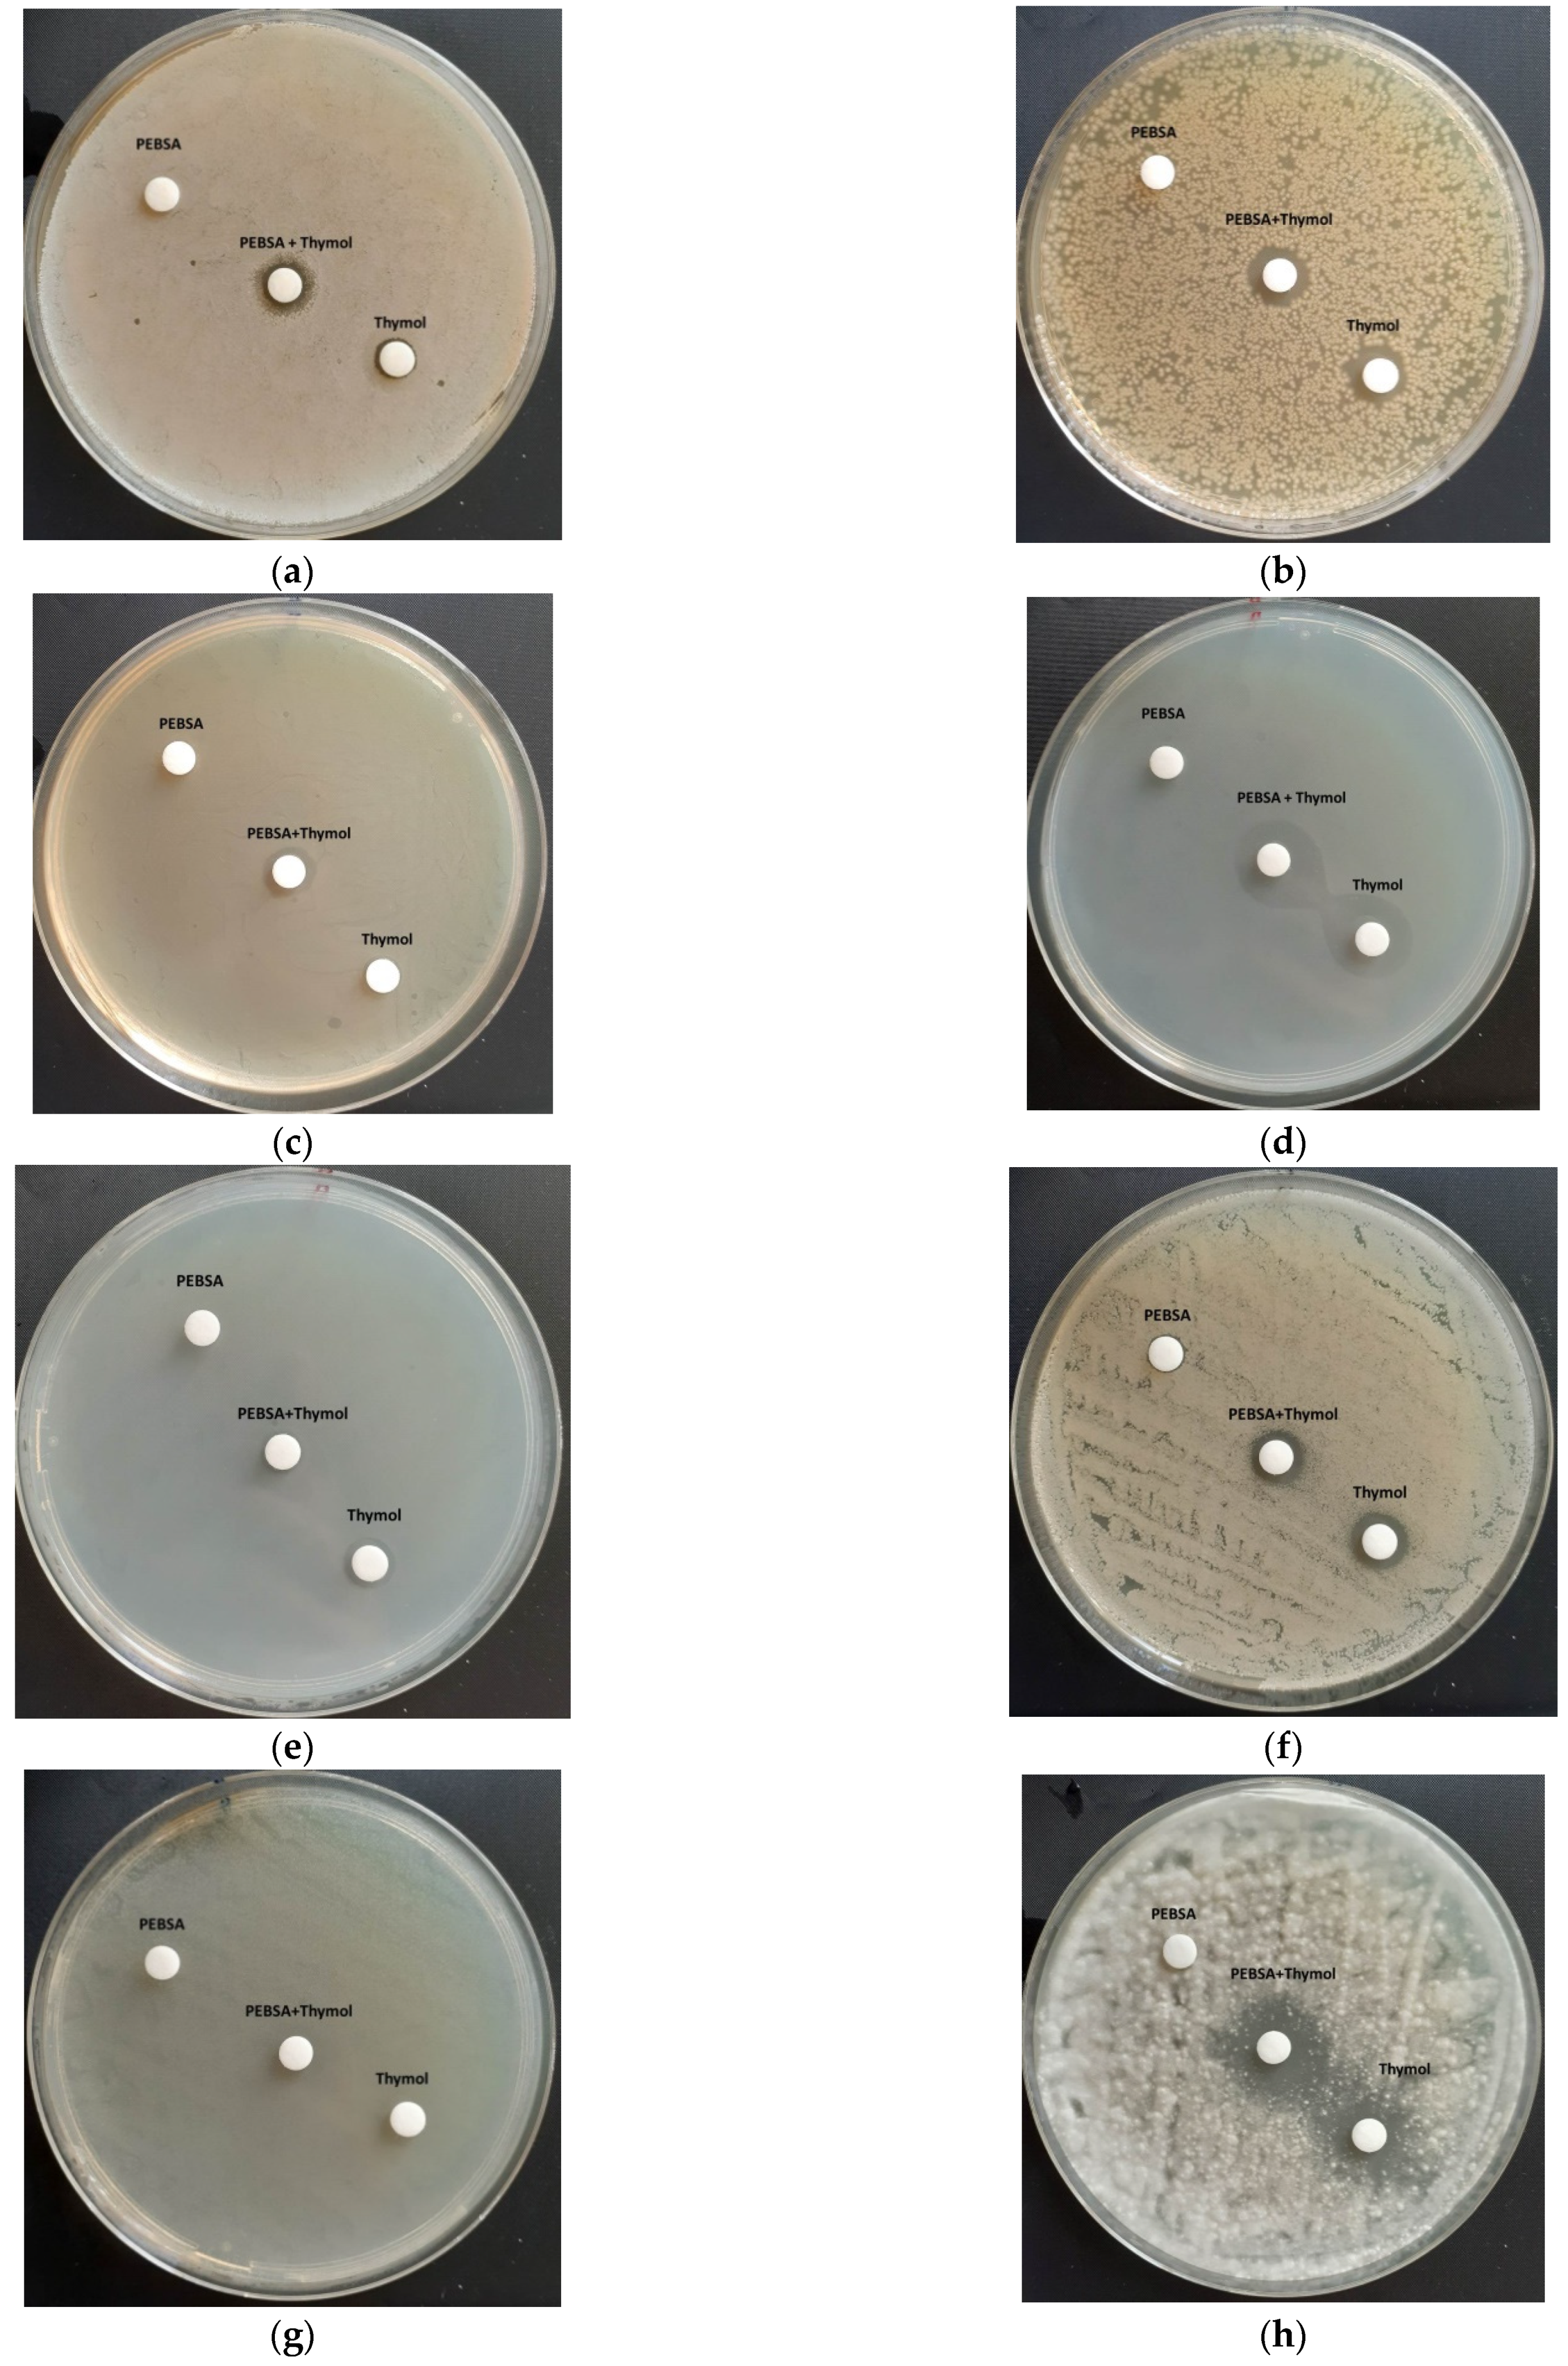
3.10. Antimicrobial Activity of PEBSA_Ty Complex
4. Conclusions
Author Contributions
Funding
Institutional Review Board Statement
Informed Consent Statement
Data Availability Statement
Conflicts of Interest
References
- Rodríguez, J.; Martín, M.J.; Ruiz, M.A.; Clares, B. Current encapsulation strategies for bioactive oils: From alimentary to pharmaceutical perspectives. Food Res. Int. 2016, 83, 41–59. [Google Scholar] [CrossRef]
- Bilia, A.R.; Guccione, C.; Isacchi, B.; Righeschi, C.; Firenzuoli, F.; Bergonzi, M.C. Essential Oils Loaded in Nanosystems: A Developing Strategy for a Successful Therapeutic Approach. Evid. Based Complement. Altern. Med. 2014, 2014, 651593. [Google Scholar] [CrossRef] [PubMed] [Green Version]
- Perinelli, D.R.; Palmieri, G.F.; Cespi, M.; Bonacucina, G. Encapsulation of Flavours and Fragrances into Polymeric Capsules and Cyclodextrins Inclusion Complexes: An Update. Molecules 2020, 25, 5878. [Google Scholar] [CrossRef] [PubMed]
- Lammari, N.; Louaer, O.; Meniai, A.H.; Elaissari, A. Encapsulation of Essential Oils via Nanoprecipitation Process: Overview, Progress, Challenges and Prospects. Pharmaceutics 2020, 12, 431. [Google Scholar] [CrossRef]
- Song, Q.; Pascouau, C.; Zhao, J.; Zhang, G.; Peruch, F.; Carlotti, S. Ring-opening polymerization of γ-lactones and copolymerization with other cyclic monomers. Prog. Polym. Sci. 2020, 110, 101309. [Google Scholar] [CrossRef]
- Gonçalves, F.A.M.M.; Fonseca, A.C.; Domingos, M.; Gloria, A.; Serra, A.C.; Coelho, J.F.J. The potential of unsaturated polyesters in biomedicine and tissue engineering: Synthesis, structure-properties relationships and additive manufacturing. Prog. Polym. Sci. 2017, 68, 1–34. [Google Scholar] [CrossRef] [Green Version]
- Wilson, J.A.; Ates, Z.; Pflughaupt, R.L.; Dove, A.P.; Heise, A. Polymers from Macrolactones: From Pheromones to Functional Materials. Prog. Polym. Sci. 2019, 91, 29–50. [Google Scholar] [CrossRef]
- Zheng, Y.; Pan, P. Crystallization of biodegradable and biobased polyesters: Polymorphic crystallization, cocrystallization, and structure-property relationship. Prog. Polym. Sci. 2020, 109, 101291. [Google Scholar] [CrossRef]
- Myers, D.; Witt, T.; Cyriac, A.; Bown, M.; Mecking, S.; Williams, C.K. Ring opening polymerization of macrolactones: High conversions and activities using an yttrium catalyst. Polym. Chem. 2017, 8, 5780–5785. [Google Scholar] [CrossRef] [Green Version]
- Tardy, A.; Nicolas, J.; Gigmes, D.; Lefay, C.; Guillaneuf, Y. Radical Ring-Opening Polymerization: Scope, Limitations, and Application to (Bio)Degradable Materials. Chem. Rev. 2017, 117, 1319–1406. [Google Scholar] [CrossRef]
- Song, Q.; Zhao, J.; Zhang, G. Ring-opening (co)polymerization of γ-butyrolactone: A review. Polym. J. 2020, 52, 3–11. [Google Scholar] [CrossRef]
- Becker, G.; Wurm, F.R. Functional biodegradable polymers via ring-opening polymerization of monomers without protective groups. Chem. Soc. Rev. 2018, 47, 7739–7782. [Google Scholar] [CrossRef] [Green Version]
- Nuyken, O.; Pask, S. Ring-Opening Polymerization—An Introductory Review. Polymers 2013, 5, 361–403. [Google Scholar] [CrossRef] [Green Version]
- Pirenne, V.; Muriel, B.; Waser, J. Catalytic Enantioselective Ring-Opening Reactions of Cyclopropanes. Chem. Rev. 2021, 121, 227–263. [Google Scholar] [CrossRef] [PubMed]
- Nifantev, I.; Ivchenko, P. Coordination Ring-Opening Polymerization of Cyclic Esters: A Critical Overview of DFT Modeling and Visualization of the Reaction Mechanisms. Molecules 2019, 24, 4117. [Google Scholar] [CrossRef] [PubMed] [Green Version]
- Pascual, A.; Sardon, H.; Veloso, A.; Ruipérez, F.; Mecerreyes, D. Organocatalyzed Synthesis of Aliphatic Polyesters from Ethylene Brassylate: A Cheap and Renewable Macrolactone. ACS Macro Lett. 2014, 3, 849–853. [Google Scholar] [CrossRef]
- Chen, J.-C.; Li, J.-Z.; Liu, J.-H.; Xu, L.-Q. Amphiphilic poly(ethylene glycol)-b-poly(ethylene brassylate) copolymers: One-pot synthesis, self-assembly, and controlled drug release. Chin. Chem. Lett. 2015, 26, 1319–1321. [Google Scholar] [CrossRef]
- Jin, C.; Wei, Z.; Yu, Y.; Sui, M.; Leng, X.; Li, Y. Copolymerization of ethylene brassylate with δ-valerolactone towards iso-dimorphic random copolyesters with continuously tunable mechanical properties. Eur. Polym. J. 2018, 102, 90–100. [Google Scholar] [CrossRef]
- Fernández, J.; Amestoy, H.; Sardon, H.; Aguirre, M.; Varga, A.L.; Sarasua, J.-R. Effect of molecular weight on the physical properties of poly(ethylene brassylate) homopolymers. J. Mech. Behav. Biomed. Mater. 2016, 64, 209–219. [Google Scholar] [CrossRef]
- Fernández, J.; Larrañaga, A.; Etxeberria, A.; Sarasua, J.-R. Ethylene brassylate-co-δ-hexalactone biobased polymers for application in the medical field: Synthesis, characterization and cell culture studies. RSC Adv. 2016, 6, 22121–22136. [Google Scholar] [CrossRef]
- Hua, G.; Odelius, K. Exploiting Ring-Opening Aminolysis–Condensation as a Polymerization Pathway to Structurally Diverse Biobased Polyamides. Biomacromolecules 2018, 19, 1573–1581. [Google Scholar] [CrossRef] [PubMed] [Green Version]
- Jin, C.; Leng, X.; Zhang, M.; Wang, Y.; Wei, Z.; Li, Y. Fully biobased biodegradable poly(l-lactide)-b-poly(ethylene brassylate)-b-poly(l-lactide) triblock copolymers: Synthesis and investigation of relationship between crystallization morphology and thermal properties. Polym. Int. 2020, 69, 363–372. [Google Scholar] [CrossRef]
- Lee, Y.-H.; Ko, W.-C.; Zhuang, Y.-N.; Wang, L.-Y.; Yu, T.-W.; Lee, S.-Y.; Rwei, S.-P. Development of Self-Healable Organic/Inorganic Hybrid Materials Containing a Biobased Copolymer via Diels–Alder Chemistry and Their Application in Electromagnetic Interference Shielding. Polymers 2019, 11, 1755. [Google Scholar] [CrossRef] [Green Version]
- Butron, A.; Llorente, O.; Fernandez, J.; Meaurio, E.; Sarasua, J.-R. Morphology and Mechanical Properties of Poly(ethylene brassylate)/Cellulose Nanocrystal composites. Carbohydr. Polym. 2019, 221, 137–145. [Google Scholar] [CrossRef]
- Wei, Z.; Jin, C.; Xu, Q.; Leng, X.; Wang, Y.; Li, Y. Synthesis, microstructure and mechanical properties of partially biobased biodegradable poly(ethylene brassylate-co-ε-caprolactone) copolyesters. J. Mech. Behav. Biomed. Mater. 2019, 91, 255–265. [Google Scholar] [CrossRef]
- Chen, J.; Li, J.; Liu, J.; Weng, B.; Xu, L. Synthesis and self-assembly of four-armed star copolymer based on poly(ethylene brassylate) hydrophobic block as potential drug carries. J. Nanoparticle Res. 2016, 18, 134. [Google Scholar] [CrossRef]
- Wurm, F.R.; Klok, H.-A. Be squared: Expanding the horizon of squaric acid-mediated conjugations. Chem. Soc. Rev. 2013, 42, 8220. [Google Scholar] [CrossRef] [PubMed]
- Chen, Y.-Y.; Hall, H.K., Jr. Polycondensation of squaric acid with N-alkylcarbazoles. Polym. Bull. 1986, 16, 419–425. [Google Scholar] [CrossRef]
- Lynch, D.E.; Geissler, U.; Kwiatkowski, J.; Whittaker, A.K. An investigation into the synthesis of polycarbazole squaraine derivatives. Polym. Bull. 1997, 38, 493–499. [Google Scholar] [CrossRef]
- Eberhard, W.; Neuse, B.; Green, R. Poly(squaryl amides). Polymer 1974, 15, 339. [Google Scholar]
- Imai, Y.; Shiratori, M.; Inoue, T.; Kakimoto, M.-A. Synthesis and Properties of New Aromatic Polysquaramide by Solid-State Thermal Polycondensation of Salt Monomer Composed of Squaric Acid and Bis(4-aminophenyl) Ether. J. Pol. Sci. Part A Pol. Chem. 2002, 40, 2648–2655. [Google Scholar] [CrossRef]
- Tang, P.; Dong, W.-W.; Xia, W.; Zhao, J. Two New Zn(II)/Cd(II) Coordination Polymers Based on Rigid Squaric Acid: Crystal Structure, Topology and Fluorescent Properties. J. Inorg. Organomet. Polym. 2015, 25, 569–575. [Google Scholar] [CrossRef]
- Steinbach, T.; Wurm, F.; Klok, H.-A. Squaric acid mediated bioconjugation expanded to polymers prepared by ATRP. Polym. Chem. 2014, 5, 4039. [Google Scholar] [CrossRef]
- Zhan, C.; Zhen, J.; Su, H.; Yang, X.; Qi, J. The Synthesis and Characterisation of Polyaniline Catalysed and Doped by Squaric acid. Wuhan Univ. J. Nat. Sci. 1999, 4, 103–105. [Google Scholar] [CrossRef]
- Karami, Z.; Rezaeian, I.; Zahedi, P.; Abdollahi, M. Preparation and performance evaluations of electrospun poly(ε-caprolactone), poly(lactic acid), and their hybrid (50/50) nanofibrous mats containing thymol as an herbal drug for effective wound healing. J. Appl. Pol. Sci. 2012, 129, 756–766. [Google Scholar] [CrossRef]
- Davoodi, M.; Kavoosi, G.; Shakeri, R. Preparation and characterization of potato starch-thymol dispersion and film as potential antioxidant and antibacterial materials. Int. J. Biol. Macromol. 2017, 104, 173–179. [Google Scholar] [CrossRef]
- Alvarez Echazú, M.I.; Olivetti, C.E.; Anesini, C.; Perez, C.J.; Alvarez, G.S.; Desimone, M.F. Development and evaluation of thymol-chitosan hydrogels with antimicrobial-antioxidant activity for oral local delivery. Mater. Sci. Eng. C 2017, 81, 588–596. [Google Scholar] [CrossRef]
- Jiang, Z.; Yuan, J.; Wang, P.; Fan, X.; Xu, J.; Wang, Q.; Zhang, L. Dissolution and regeneration of wool keratin in the deep eutectic solvent of choline chloride-urea. Int. J. Biol. Macromol. 2018, 119, 423–430. [Google Scholar] [CrossRef]
- Bauer, A.W.; Perry, D.M.; Kirby, W.M.M. Single disc antibiotic sensitivity testing of Staphylococci. AMA Arch. Intern. Med. 1959, 104, 208–216. [Google Scholar] [CrossRef]
- Rasband, W.S.; Image, J. U.S. National Institutes of Health, Bethesda, Maryland, USA, 1997–2018. Available online: https://imagej.nih.gov/ij/ (accessed on 17 February 2021).
- Addinsoft XLSTAT Statistical and Data Analysis Solution. New York, USA. 2020. Available online: https://www.xlstat.com (accessed on 17 February 2021).
- Bougeard, D.; Novak, A. Vibrational study of squaric acid. Solid State Commun. 1978, 27, 453–457. [Google Scholar] [CrossRef]
- Georgopoulos, S.L.; Edwards, H.G.M.; de Oliveira, L.F.C. Raman spectroscopic analysis of the interaction between squaric acid and dimethylsulfoxide. Spectrochim. Acta Part A Mol. Biomol. Spectrosc. 2013, 111, 54–61. [Google Scholar] [CrossRef] [PubMed]
- Available online: https://webbook.nist.gov/chemistry/form-ser/ (accessed on 17 February 2021).
- TGA-IR User Manual, Bruker. Available online: https://www.bruker.com/en/products-and-solutions/infrared-and-raman/ft-ir-research-spectrometers/tg-ftir-thermogravimetric-analysis.html (accessed on 26 March 2020).
- Tudorachi, N.; Mustata, F. Curing and thermal degradation of diglycidyl ether of bisphenol A epoxy resin crosslinked with natural hydroxy acids as environmentally friendly hardeners. Arab. J. Chem. 2020, 13, 671–682. [Google Scholar] [CrossRef]
- Nowicka-Scheibe, J.; Grech, E.; Sawka-Dobrowolska, W.; Bator, G.; Pawlukojć, A.; Sobczyk, L. Structure and vibrational spectra of squaric acid complexes with 4,4′- and 5,5′-dimethyl-2,2′-bipyridine. J. Mol. Struct. 2010, 976, 30–35. [Google Scholar] [CrossRef]
- Baglin, F.G.; Rose, C.B. The infrared and Raman spectra of crystalline squaric acid. Spectrochim. Acta Part A Mol. Spectrosc. 1970, 26, 2293–2304. [Google Scholar] [CrossRef]
- Jordan, T.; Shalom, M.; Antonietti, M.; Fechler, N. Carbon nanoarchitectures by design: Pre-organizing squaric acid with urea. Asia Pac. J. Chem. Eng. 2016, 11, 866–873. [Google Scholar] [CrossRef] [Green Version]
- Gilli, G.; Bertolasi, V.; Gilli, P.; Ferretti, V. Associations of squaric acid and its anions as multiform building blocks of hydrogen-bonded molecular crystals. Acta Crystallogr. Sect. B Struct. Sci. 2001, 57, 859–865. [Google Scholar] [CrossRef] [Green Version]
- Salehi, B.; Mishra, A.P.; Shukla, I.; Sharifi-Rad, M.; del Contreras, M.M.; Segura-Carretero, A.; Sharifi-Rad, J. Thymol, thyme, and other plant sources: Health and potential uses. Phytother. Res. 2018, 32, 1688–1706. [Google Scholar] [CrossRef]
- Marchese, A.; Orhan, I.E.; Daglia, M.; Barbieri, R.; Di Lorenzo, A.; Nabavi, S.F.; Nabavi, S.M. Antibacterial and antifungal activities of thymol: A brief review of the literature. Food Chem. 2016, 210, 402–414. [Google Scholar] [CrossRef]
- García-Salinas, S.; Elizondo-Castillo, H.; Arruebo, M.; Mendoza, G.; Irusta, S. Evaluation of the Antimicrobial Activity and Cytotoxicity of Different Components of Natural Origin Present in Essential Oils. Molecules 2018, 23, 1399. [Google Scholar] [CrossRef] [Green Version]
- Falcone, P.; Speranza, B.; Del Nobile, M.A.; Corbo, M.R.; Sinigaglia, M. A Study on the Antimicrobial Activity of Thymol Intended as a Natural Preservative. J. Food Prot. 2005, 68, 1664–1670. [Google Scholar] [CrossRef]


| FTIR Spectra | |||||
|---|---|---|---|---|---|
| PEBSA | PEBSA_Ty | Thymol | |||
| Registered Frequency, cm−1 | Absorption Assignment | Registered Frequency, cm−1 | Absorption Assignment | Registered Frequency, cm−1 | Absorption Assignment |
| 2926.33 | C-H stretching | 3397.74 | O-H stretching intermolecular bonded | 3397.74 | O-H stretching |
| 2855.14 | C-H stretching | 2926.33 | C-H stretching | 2926.33 | C-H stretching |
| 2652.01 | C-H stretching | 2855.14 | C-H stretching | 1623.73 | C=C stretching |
| 1698.44 | C=O stretching | 1698.44 1623.73 | C=O stretching C=C stretching | 1520.41 | C=C stretching |
| 1465.50 | C-H bending | 1520.41 | C=C stretching | 1450 | O-H bending |
| 1240.99 | C-O stretching | 1465.50 | C-H bending | 1240.99 | C-O stretching |
| 1231.46 | C-O stretching | 1240.99 | C-O stretching | 1231.46 | C-O stretching |
| 1183.31 | C-O stretching | 1231.46 | C-O stretching | 1183.31 | C-O stretching |
| 919.18 | C=C bending | 1183.31 | C-O stretching | 1087 | C-O stretching |
| 681.97 | C=C bending | 1087.00 | C-O stretching | 919.18 | C=C bending |
| 531.26 | C=C bending | 919.18 | C=C bending | 807.14 | C=C bending |
| 681.97 | C=C bending | 584.82 | C=C bending | ||
| 531.26 | C=C bending | ||||
| Strains | Inhibition Zone (mm) | ||
|---|---|---|---|
| PEBSA | THYMOL | PEBSA_Ty | |
| Staphylococcus aureus ATCC25923 | - | 7.793 ± 0.214 | 8.405 ± 0.282 |
| Escherichia coli ATCC25922 | - | 10.527 ± 0.088 | 11.048 ± 0.546 |
| Enterococcus faecalis ATCC 29212 | - | 7.550 ± 0.209 | 10.119 ± 0.151 |
| Klebsiella pneumonie ATCC 10031 | - | 18.562 ± 0.085 | 19.837 ± 0.271 |
| Salmonella typhimurium ATCC 14028 | - | 8.232 ± 0.008 | 7.135 ± 0.371 |
| Candida albicans ATCC10231 | - | 10.091 ± 0.228 | 9.397 ± 0.267 |
| Candida glabrata ATCC 2001 | - | - | - |
| Aspergillus brasiliensis ATCC9642 | - | 18.288 ± 0.253 | 20.322 ± 0.501 |
| Strains | PEBSA | THYMOL | PEBSA_Ty | |||
|---|---|---|---|---|---|---|
| MIC (g/mL) | MBC (g/mL) | MIC (g/mL) | MBC (g/mL) | MIC (g/mL) | MBC (g/mL) | |
| S. aureus | -a | -a | 0.008 | -b | 0.008 | -b |
| E. coli | -a | -a | 0.008 | -b | 0.008 | -b |
| E. faecalis | -a | -a | 0.008 | -b | 0.008 | -b |
| K. pneumonie | -a | -a | 0.008 | -b | 0.008 | -b |
| S. Typhimurium | -a | -a | 0.008 | -b | 0.008 | -b |
| C. albicans | -a | -a | 0.008 | -b | 0.008 | -b |
| C. glabrata | -a | -a | -b | -b | -b | -b |
| A. brasiliensis | -a | -a | 0.008 | -b | 0.008 | -b |
Publisher’s Note: MDPI stays neutral with regard to jurisdictional claims in published maps and institutional affiliations. |
© 2021 by the authors. Licensee MDPI, Basel, Switzerland. This article is an open access article distributed under the terms and conditions of the Creative Commons Attribution (CC BY) license (https://creativecommons.org/licenses/by/4.0/).
Share and Cite
Chiriac, A.P.; Rusu, A.G.; Nita, L.E.; Macsim, A.-M.; Tudorachi, N.; Rosca, I.; Stoica, I.; Tampu, D.; Aflori, M.; Doroftei, F. Synthesis of Poly(Ethylene Brassylate-Co-squaric Acid) as Potential Essential Oil Carrier. Pharmaceutics 2021, 13, 477. https://doi.org/10.3390/pharmaceutics13040477
Chiriac AP, Rusu AG, Nita LE, Macsim A-M, Tudorachi N, Rosca I, Stoica I, Tampu D, Aflori M, Doroftei F. Synthesis of Poly(Ethylene Brassylate-Co-squaric Acid) as Potential Essential Oil Carrier. Pharmaceutics. 2021; 13(4):477. https://doi.org/10.3390/pharmaceutics13040477
Chicago/Turabian StyleChiriac, Aurica P., Alina Gabriela Rusu, Loredana Elena Nita, Ana-Maria Macsim, Nita Tudorachi, Irina Rosca, Iuliana Stoica, Daniel Tampu, Magdalena Aflori, and Florica Doroftei. 2021. "Synthesis of Poly(Ethylene Brassylate-Co-squaric Acid) as Potential Essential Oil Carrier" Pharmaceutics 13, no. 4: 477. https://doi.org/10.3390/pharmaceutics13040477