Optimization of Mesoporous Silica Nanoparticles through Statistical Design of Experiment and the Application for the Anticancer Drug

 , ,
, , 
Abstract
:1. Introduction
2. Materials and Methods
2.1. Materials
2.2. Synthesis of MSNs
2.3. Determination of Synthetic Reagent Amount
2.4. Optimization of MSNs
2.4.1. Surface Area
2.4.2. Particle Size and Zeta Potential
2.5. Physicochemical Properties of MSNs
2.5.1. Morphology
2.5.2. SAXRD and Fourier Transform Infrared Spectroscopy
2.5.3. Nitrogen Adsorption–Desorption Isotherm
2.5.4. In Vitro Degradation
2.6. Characterization of MSN@DOX
2.6.1. HPLC Method
2.6.2. Drug Loading
2.6.3. In Vitro Drug Release
2.7. Cell Study
2.7.1. Cell Culture
2.7.2. Cytotoxicity
2.7.3. Cellular Uptake
3. Results and Discussion
3.1. Synthesis of Optimized MSN
3.1.1. Selection of Synthetic Reagent Range
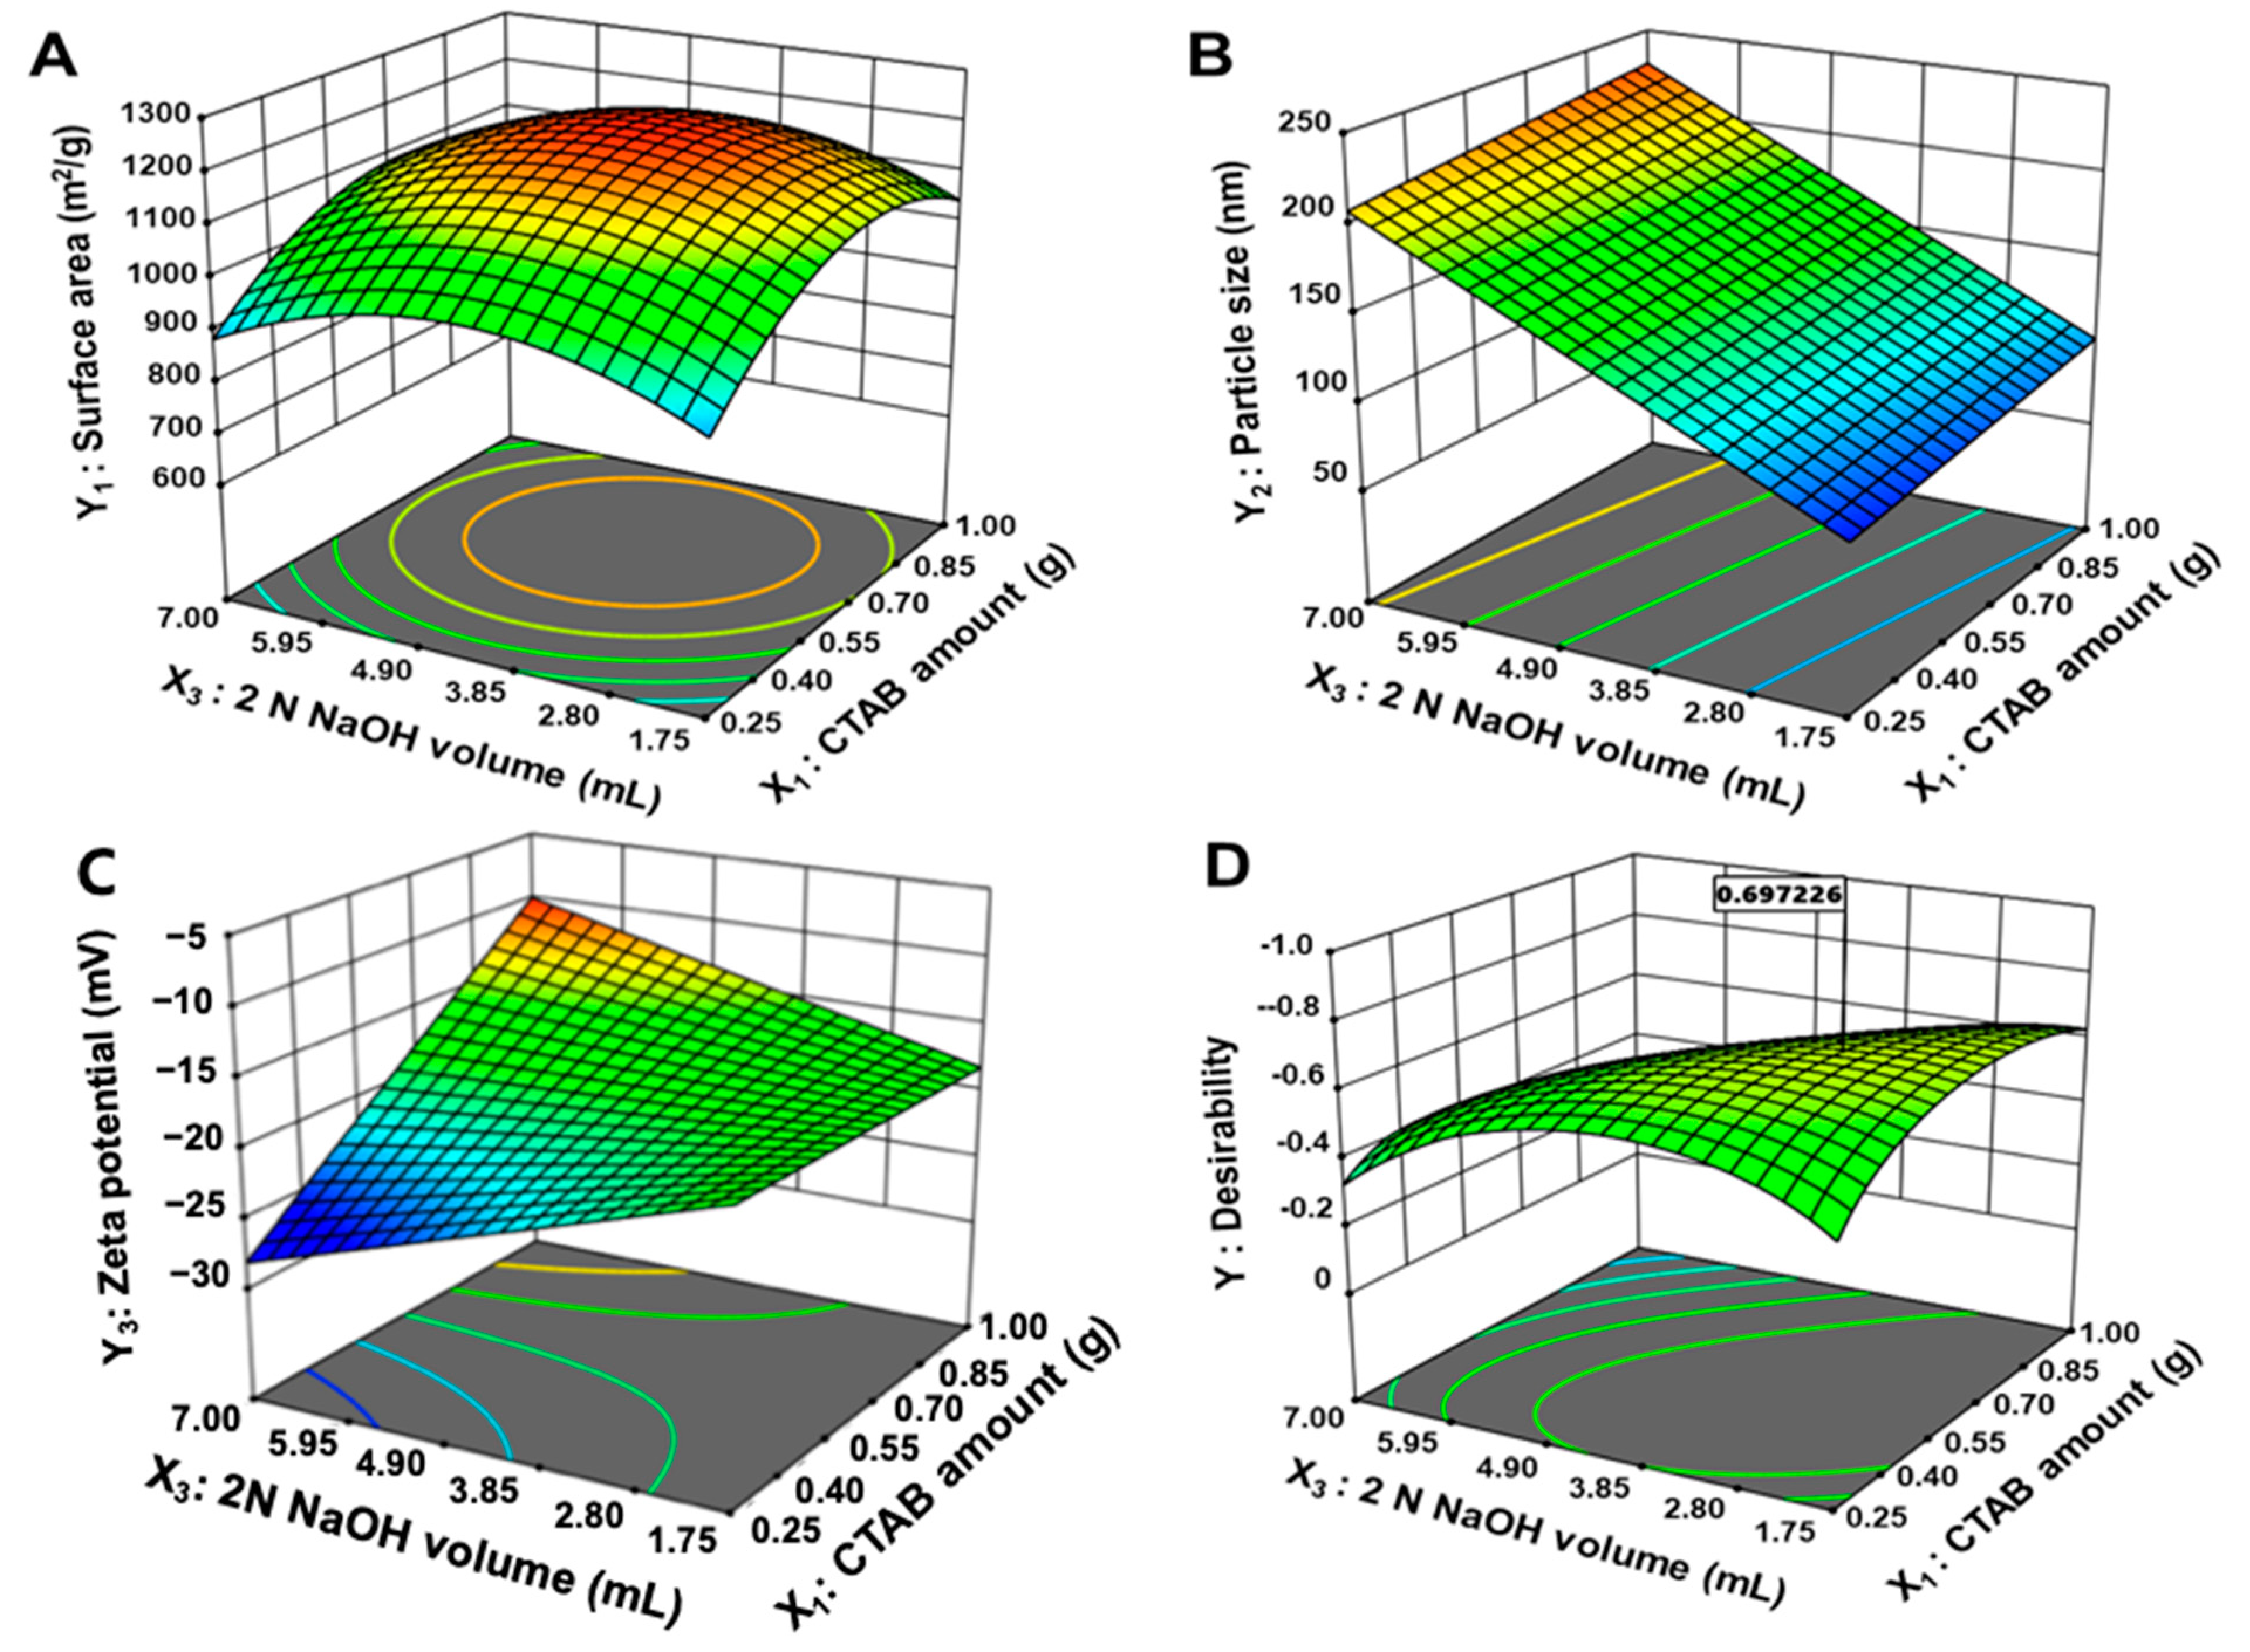
3.1.2. Optimization of MSNs
3.2. Physicochemical Properties of MSNs
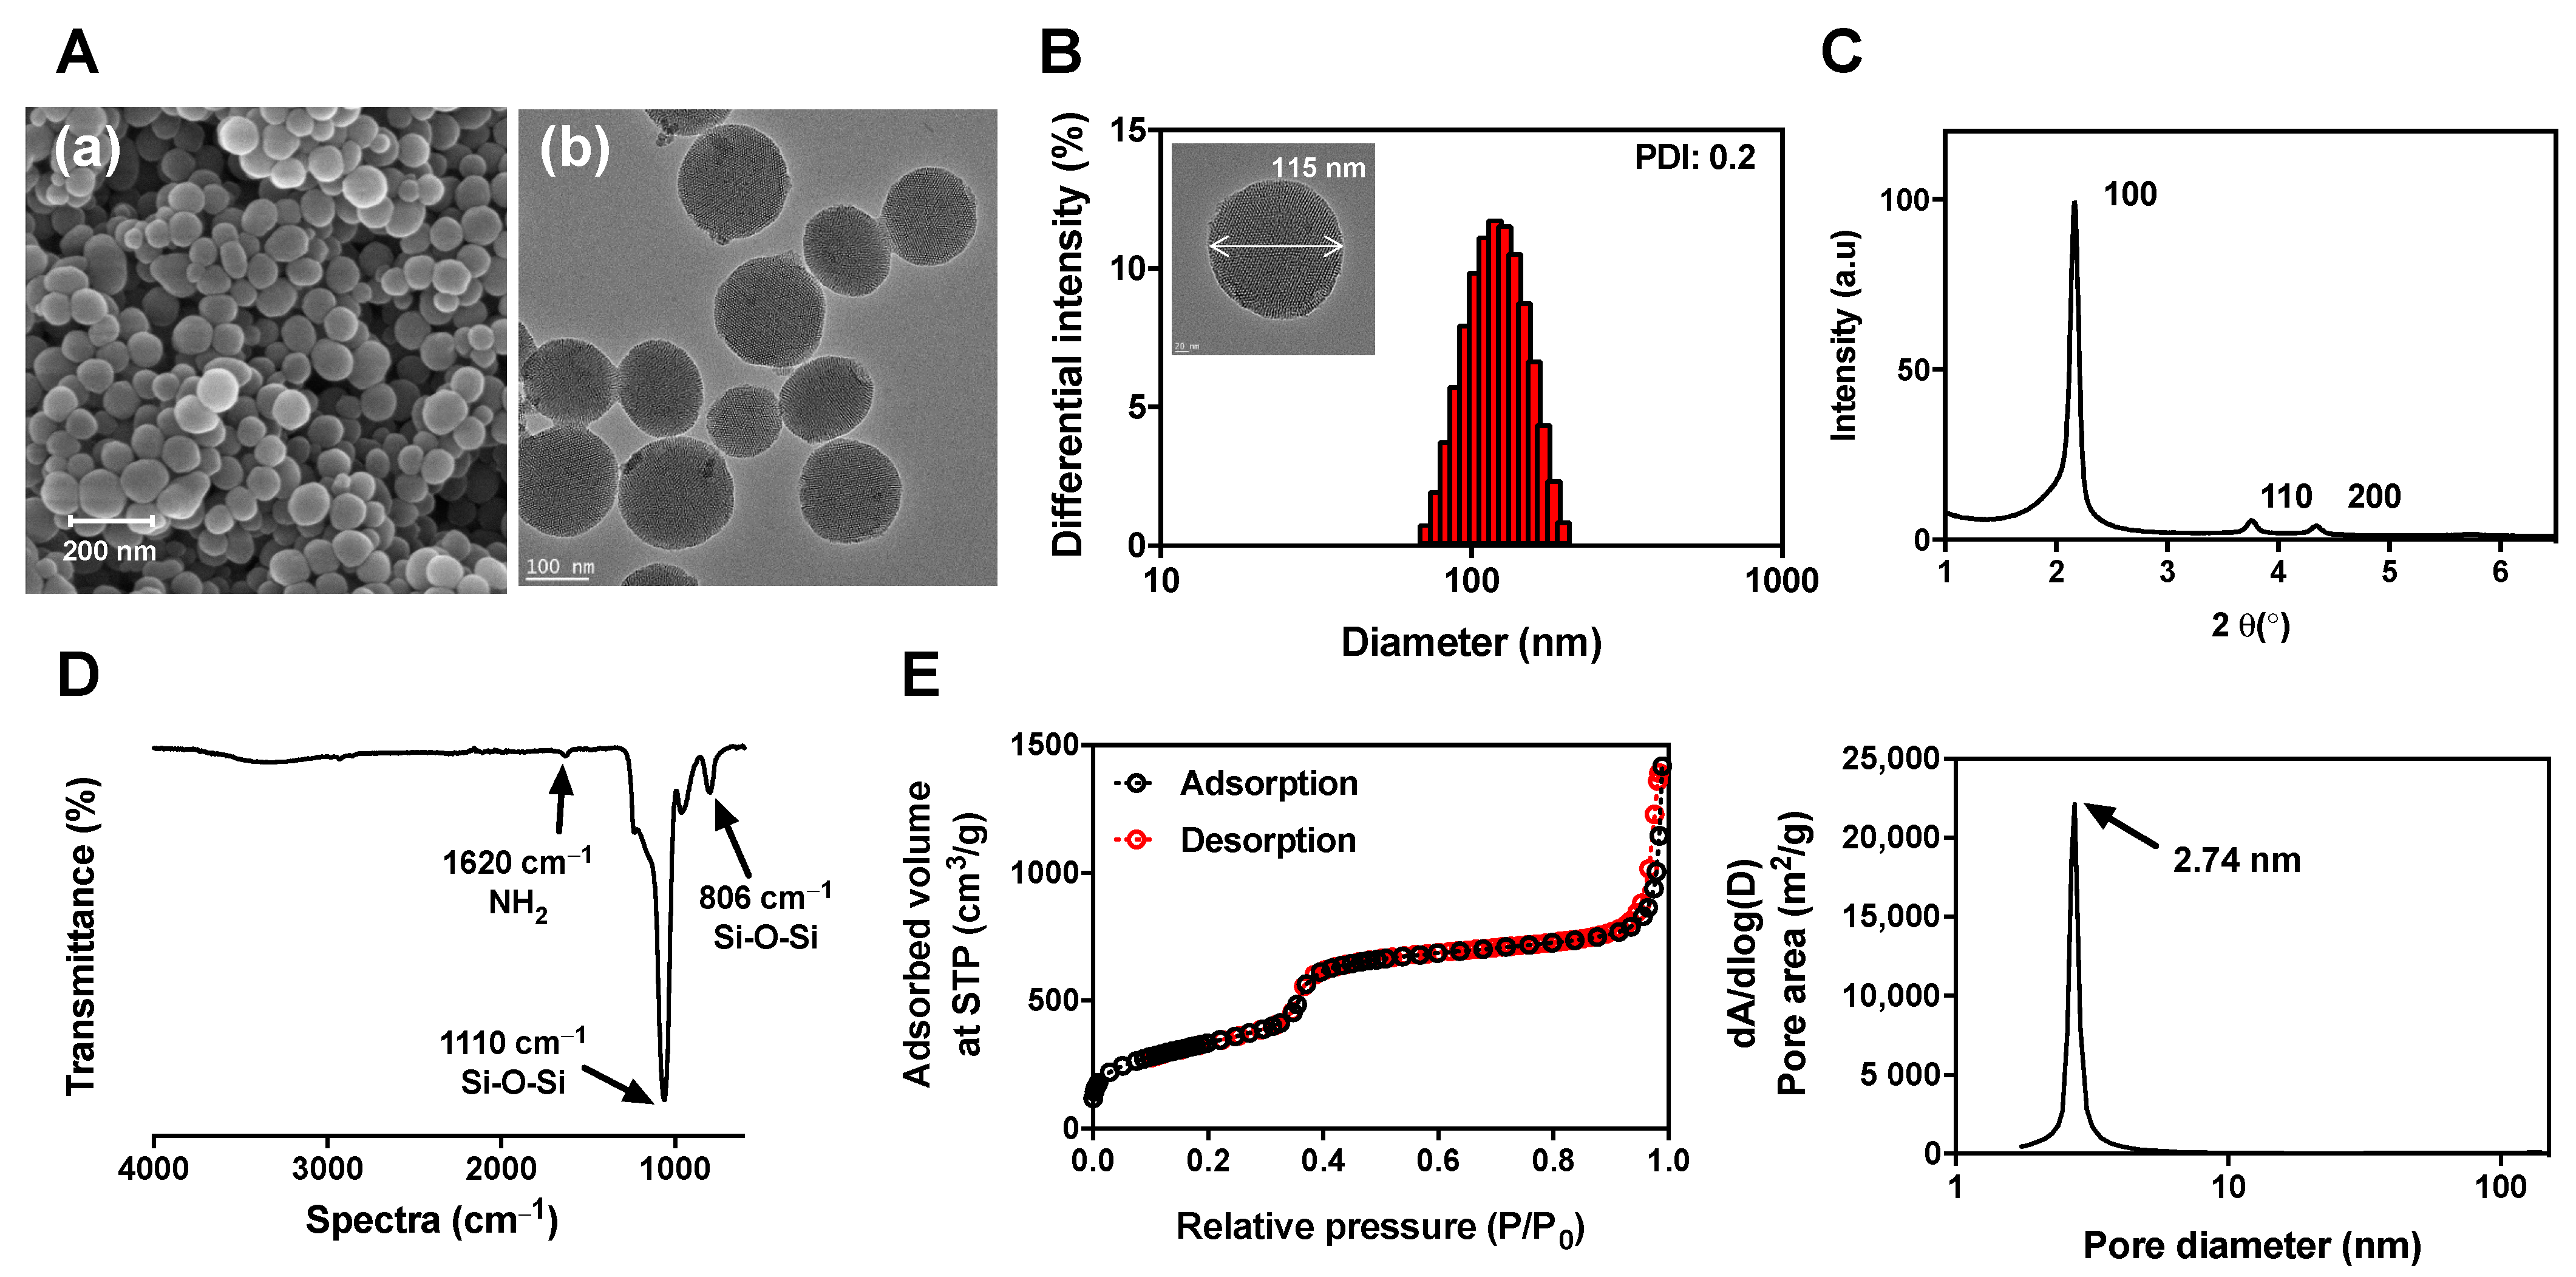
3.2.1. Morphology
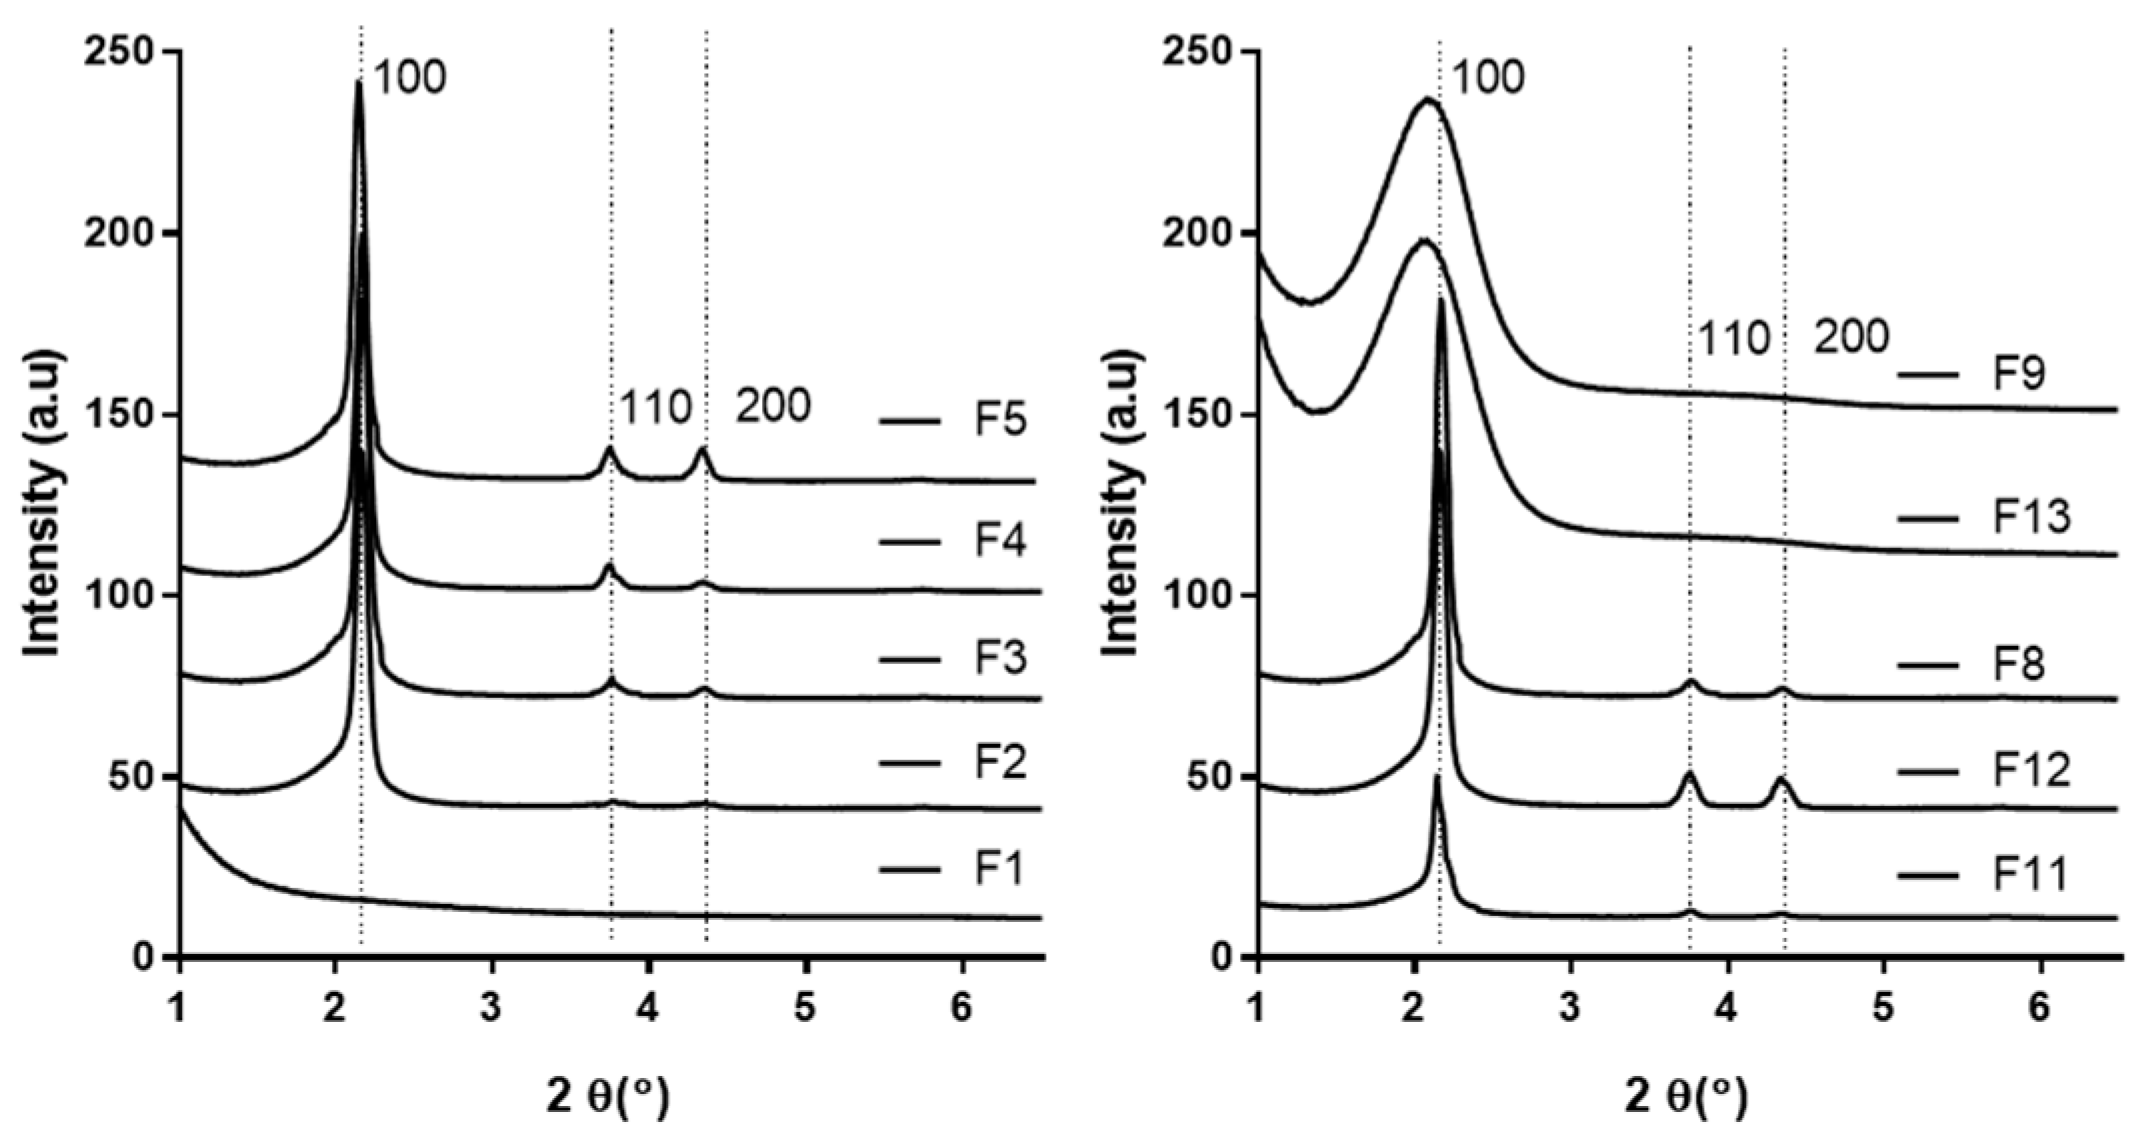
3.2.2. SAXRD
3.2.3. FT-IR Spectroscopy
3.2.4. Nitrogen Adsorption–Desorption Isotherm
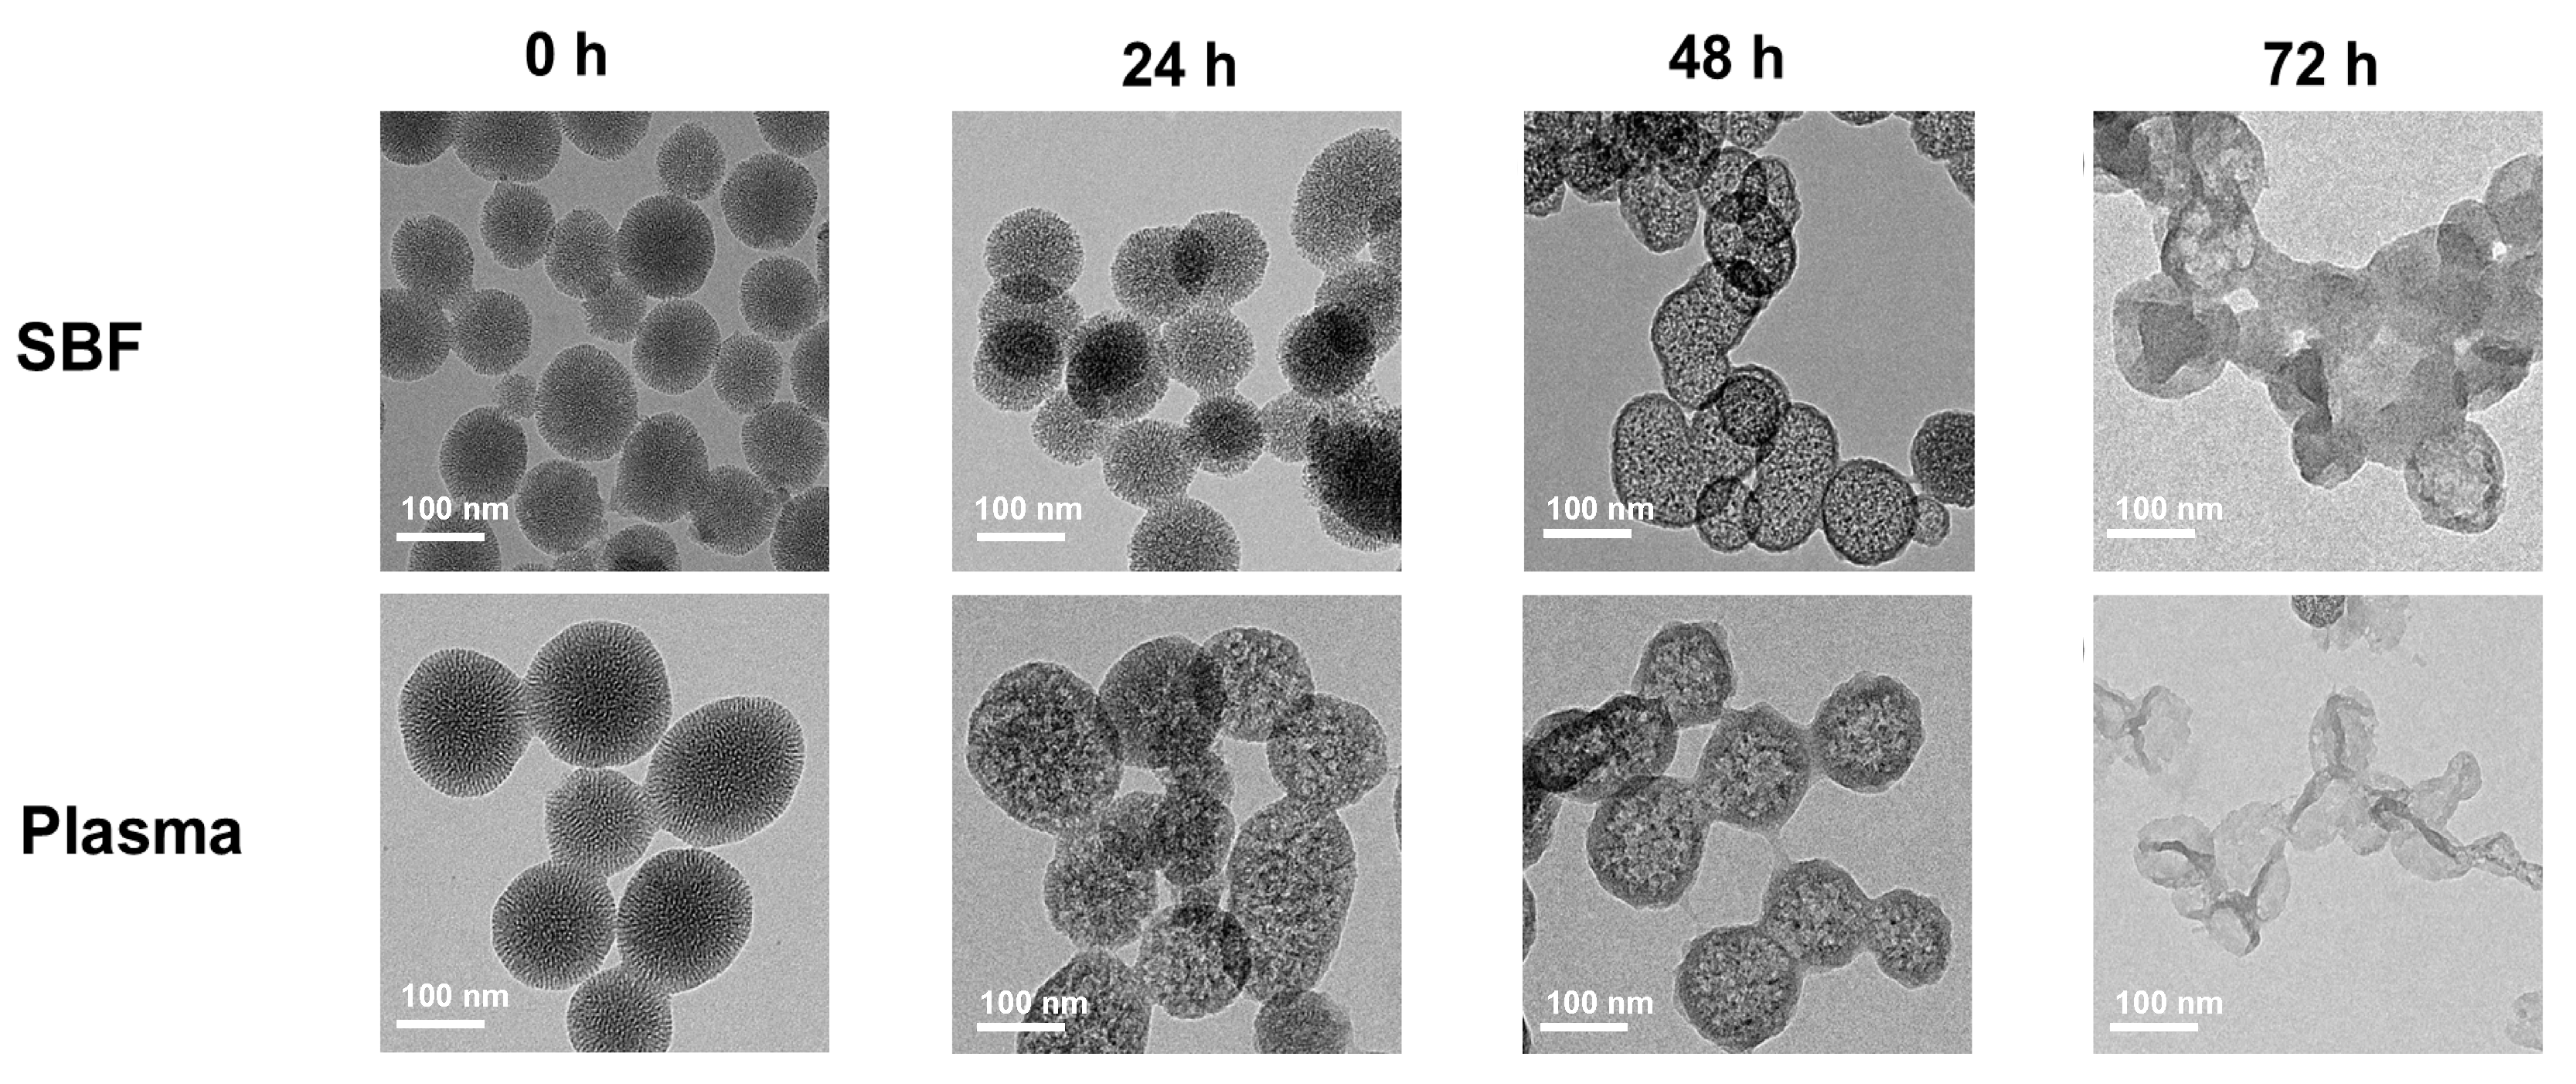
3.2.5. In Vitro Degradation
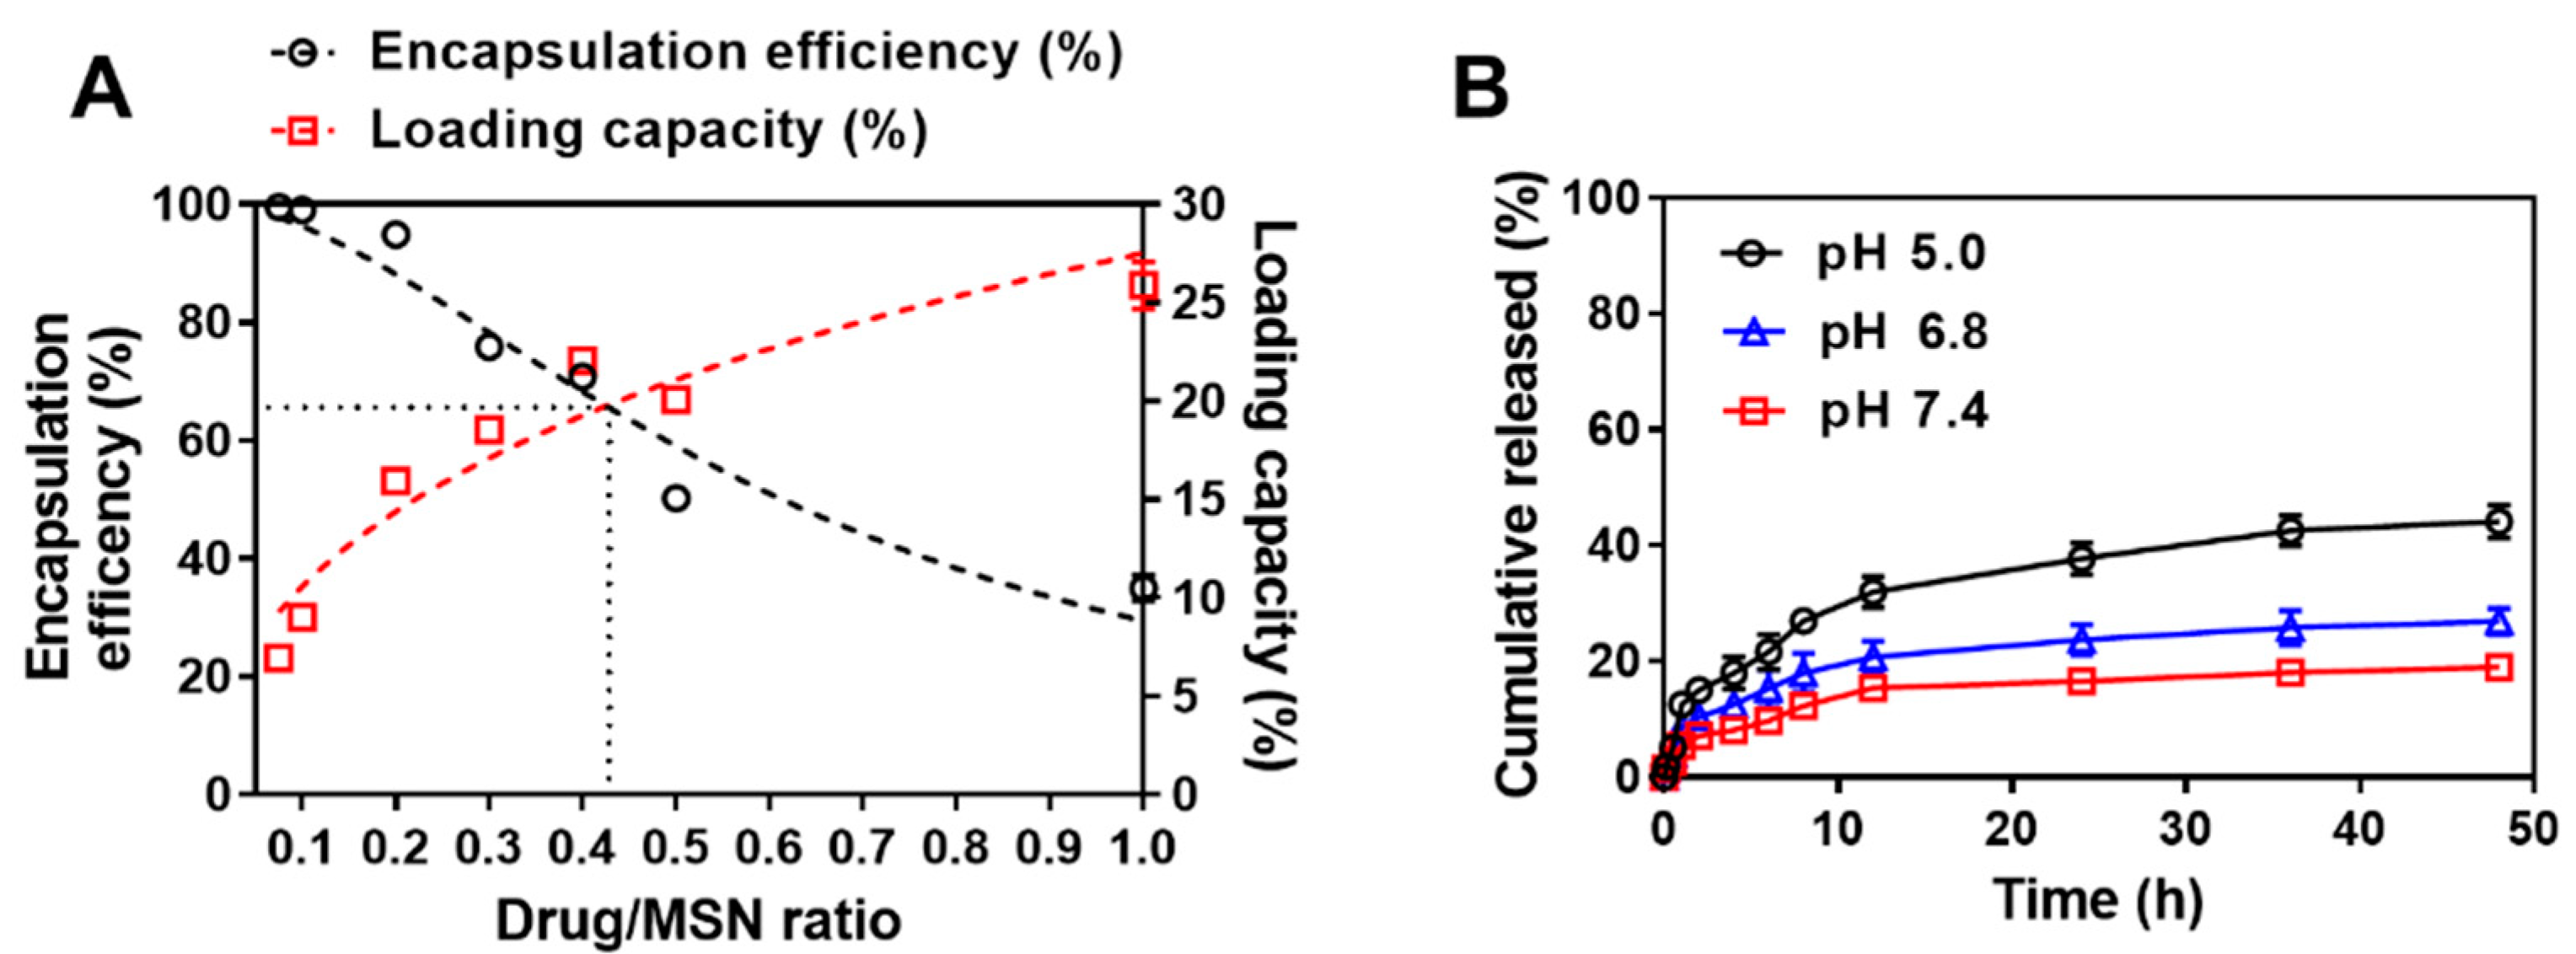
3.3. Drug Loading
3.4. In Vitro Release
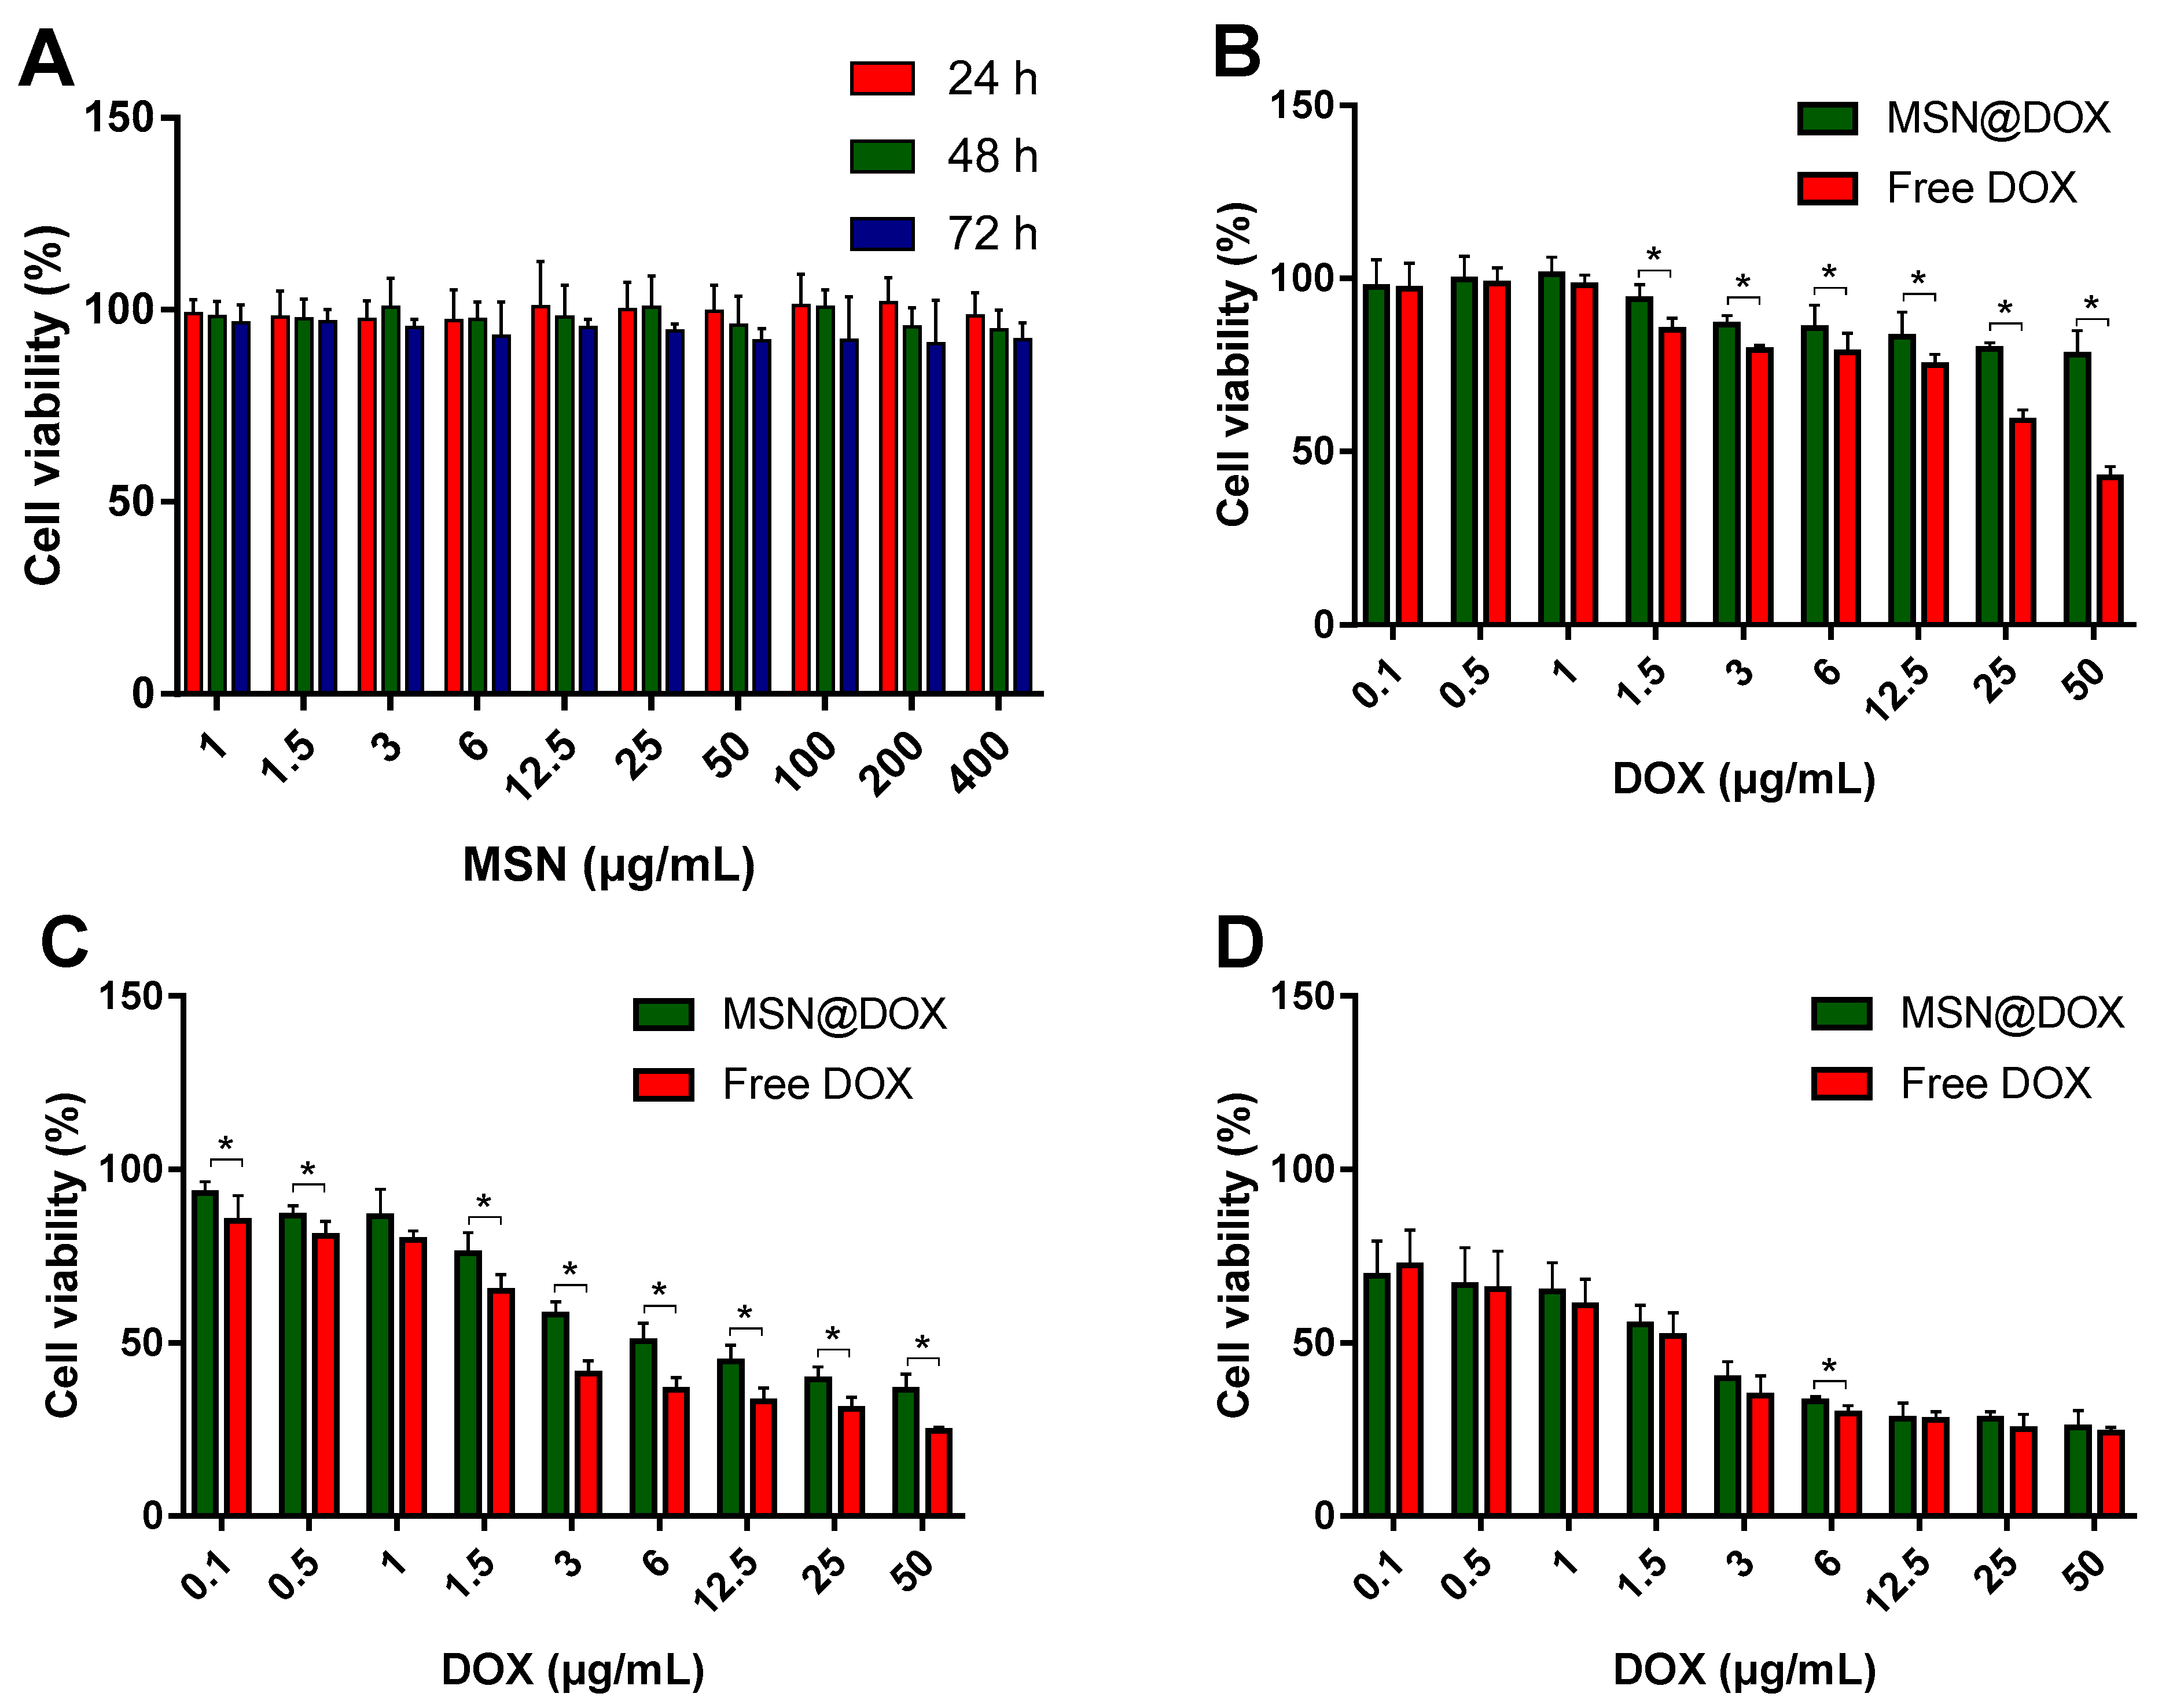
3.5. Cytotoxicity Study
3.6. Cellular Uptake
4. Conclusions
Author Contributions
Funding
Institutional Review Board Statement
Informed Consent Statement
Data Availability Statement
Conflicts of Interest
References
- Yang, P.; Gai, S.; Lin, J. Functionalized mesoporous silica materials for controlled drug delivery. Chem. Soc. Rev. 2012, 41, 3679–3698. [Google Scholar] [CrossRef] [PubMed]
- He, Q.; Shi, J. Mesoporous silica nanoparticle based nano drug delivery systems: Synthesis, controlled drug release and delivery, pharmacokinetics and biocompatibility. J. Mater. Chem. 2011, 21, 5845–5855. [Google Scholar] [CrossRef]
- Tang, F.; Li, L.; Chen, D. Mesoporous silica nanoparticles: Synthesis, biocompatibility and drug delivery. Adv. Mater. 2012, 24, 1504–1534. [Google Scholar] [CrossRef] [PubMed]
- Zhou, Y.; Quan, G.; Wu, Q.; Zhang, X.; Niu, B.; Wu, B.; Huang, Y.; Pan, X.; Wu, C. Mesoporous silica nanoparticles for drug and gene delivery. Acta Pharm. Sin. B 2018, 8, 165–177. [Google Scholar] [CrossRef]
- Slowing, I.I.; Trewyn, B.G.; Giri, S.; Lin, V.S.Y. Mesoporous silica nanoparticles for drug delivery and biosensing applications. Adv. Funct. Mater. 2007, 17, 1225–1236. [Google Scholar] [CrossRef]
- Hong, S.; Choi, Y. Mesoporous silica-based nanoplatforms for the delivery of photodynamic therapy agents. Int. J. Pharm. Investig. 2018, 48, 3–17. [Google Scholar] [CrossRef] [Green Version]
- Narayan, R.; Nayak, U.Y.; Raichur, A.M.; Garg, S. Mesoporous Silica Nanoparticles: A Comprehensive Review on Synthesis and Recent Advances. Pharmaceutics 2018, 10, 118. [Google Scholar] [CrossRef] [Green Version]
- Wu, S.-H.; Mou, C.-Y.; Lin, H.-P. Synthesis of mesoporous silica nanoparticles. Chem. Soc. Rev. 2013, 42, 3862–3875. [Google Scholar] [CrossRef]
- Wu, K.C.W.; Yamauchi, Y. Controlling physical features of mesoporous silica nanoparticles (MSNs) for emerging applications. J. Mater. Chem. 2012, 22, 1251–1256. [Google Scholar] [CrossRef]
- Hoshyar, N.; Gray, S.; Han, H.; Bao, G. The effect of nanoparticle size on in vivo pharmacokinetics and cellular interaction. Nanomedicine (London) 2016, 11, 673–692. [Google Scholar] [CrossRef] [Green Version]
- Albanese, A.; Tang, P.S.; Chan, W.C. The effect of nanoparticle size, shape, and surface chemistry on biological systems. Annu. Rev. Biomed. Eng. 2012, 14, 1–16. [Google Scholar] [CrossRef] [PubMed] [Green Version]
- Argyo, C.; Weiss, V.; Brauchle, C.; Bein, T. Multifunctional Mesoporous Silica Nanoparticles as a Universal Platform for Drug Delivery. Chem. Mater. 2014, 26, 435–451. [Google Scholar] [CrossRef]
- Chiang, Y.D.; Lian, H.Y.; Leo, S.Y.; Wang, S.G.; Yamauchi, Y.; Wu, K.C.W. Controlling Particle Size and Structural Properties of Mesoporous Silica Nanoparticles Using the Taguchi Method. J. Phys. Chem. C 2011, 115, 13158–13165. [Google Scholar] [CrossRef]
- Trewyn, B.G.; Slowing, I.I.; Giri, S.; Chen, H.T.; Lin, V.S. Synthesis and functionalization of a mesoporous silica nanoparticle based on the sol-gel process and applications in controlled release. Acc. Chem. Res. 2007, 40, 846–853. [Google Scholar] [CrossRef] [PubMed] [Green Version]
- Ferreira, S.L.; Bruns, R.E.; Ferreira, H.S.; Matos, G.D.; David, J.M.; Brandao, G.C.; da Silva, E.G.; Portugal, L.A.; dos Reis, P.S.; Souza, A.S.; et al. Box-Behnken design: An alternative for the optimization of analytical methods. Anal. Chim. Acta 2007, 597, 179–186. [Google Scholar] [CrossRef] [PubMed]
- Hanrahan, G.; Lu, K. Application of factorial and response surface methodology in modern experimental design and optimization. Crit. Rev. Anal. Chem. 2006, 36, 141–151. [Google Scholar] [CrossRef]
- Gottesman, M.M.; Fojo, T.; Bates, S.E. Multidrug resistance in cancer: Role of ATP–dependent transporters. Nat. Rev. Cancer 2002, 2, 48–58. [Google Scholar] [CrossRef] [Green Version]
- Carvalho, C.; Santos, R.X.; Cardoso, S.; Correia, S.; Oliveira, P.J.; Santos, M.S.; Moreira, P.I. Doxorubicin: The good, the bad and the ugly effect. Curr. Med. Chem. 2009, 16, 3267–3285. [Google Scholar] [CrossRef]
- Frozza, R.L.; Bernardi, A.; Hoppe, J.B.; Meneghetti, A.B.; Battastini, A.M.; Pohlmann, A.R.; Guterres, S.S.; Salbego, C. Lipid-core nanocapsules improve the effects of resveratrol against Aβ-induced neuroinflammation. J. Biomed. Nanotech. 2013, 9, 2086–2104. [Google Scholar] [CrossRef]
- Stöber, W.; Fink, A.; Bohn, E. Controlled growth of monodisperse silica spheres in the micron size range. J. Colloid Interface Sci. 1968, 26, 62–69. [Google Scholar] [CrossRef]
- Mortera, R.; Vivero-Escoto, J.; Slowing, I.I.; Garrone, E.; Onida, B.; Lin, V.S.-Y. Cell-induced intracellular controlled release of membrane impermeable cysteine from a mesoporous silica nanoparticle-based drug delivery system. Chem. Commun. (Camb.) 2009, 14, 3219–3221. [Google Scholar] [CrossRef] [PubMed]
- Box, G.E.; Behnken, D.W.J.T. Some new three level designs for the study of quantitative variables. Technometrics 1960, 2, 455–475. [Google Scholar] [CrossRef]
- Brunauer, S.; Emmett, P.H.; Teller, E. Adsorption of gases in multimolecular layers. J. Am. Chem. Soc. 1938, 60, 309–319. [Google Scholar] [CrossRef]
- Barrett, E.P.; Joyner, L.G.; Halenda, P.P. The determination of pore volume and area distributions in porous substances. I. Computations from nitrogen isotherms. J. Am. Chem. Soc. 1951, 73, 373–380. [Google Scholar] [CrossRef]
- He, Q.J.; Shi, J.L.; Zhu, M.; Chen, Y.; Chen, F. The three-stage in vitro degradation behavior of mesoporous silica in simulated body fluid. Micropor. Mesopor. Mat. 2010, 131, 314–320. [Google Scholar] [CrossRef]
- Wu, D.; Shi, X.; Zhao, F.; Chilengue, S.T.F.; Deng, L.; Dong, A.; Kong, D.; Wang, W.; Zhang, J. An injectable and tumor-specific responsive hydrogel with tissue-adhesive and nanomedicine-releasing abilities for precise locoregional chemotherapy. Acta Biomater. 2019, 96, 123–136. [Google Scholar] [CrossRef]
- Vautier-Giongo, C.; Pastore, H.O. Micellization of CTAB in the presence of silicate anions and the exchange between bromide and silicate at the micelle surface: A step to understand the formation of mesoporous molecular sieves at extremely low surfactant and silicate concentrations. J. Colloid Interface Sci. 2006, 299, 874–882. [Google Scholar] [CrossRef]
- Chen, C.-Y.; Li, H.-X.; Davis, M.E. Studies on mesoporous materials: I. Synthesis and characterization of MCM-41. Micropor. Mesopor. Mat. 1993, 2, 17–26. [Google Scholar] [CrossRef]
- Chen, B.; Wang, Z.H.; Quan, G.L.; Peng, X.S.; Pan, X.; Wang, R.C.; Xu, Y.H.; Li, G.; Wu, C.B. In vitro and in vivo evaluation of ordered mesoporous silica as a novel adsorbent in liquisolid formulation. Int. J. Nanomed. 2012, 7, 199–209. [Google Scholar] [CrossRef] [Green Version]
- Zhou, Y.Y.; Li, X.X.; Chen, Z.X. Rapid synthesis of well-ordered mesoporous silica from sodium silicate. Powder Technol. 2012, 226, 239–245. [Google Scholar] [CrossRef]
- Bhakta, S.; Dixit, C.K.; Bist, I.; Jalil, K.A.; Suib, S.L.; Rusling, J.F. Sodium hydroxide catalyzed monodispersed high surface area silica nanoparticles. Mater. Res. Express 2016, 3, 075025. [Google Scholar] [CrossRef] [PubMed] [Green Version]
- Brinker, C.J. Hydrolysis and Condensation of Silicates—Effects on Structure. J. Non-Cryst. Solids 1988, 100, 31–50. [Google Scholar] [CrossRef] [Green Version]
- Firouzi, A.; Atef, F.; Oertli, A.; Stucky, G.; Chmelka, B. Alkaline lyotropic silicate-surfactant liquid crystals. J. Am. Chem. Soc. 1997, 119, 3596–3610. [Google Scholar] [CrossRef]
- Schneider, A.; Hommel, G.; Blettner, M. Linear regression analysis: Part 14 of a series on evaluation of scientific publications. Dtsch. Arztebl. Int. 2010, 107, 776–782. [Google Scholar] [CrossRef] [PubMed]
- Festing, M.F.; Altman, D.G. Guidelines for the design and statistical analysis of experiments using laboratory animals. ILAR J. 2002, 43, 244–258. [Google Scholar] [CrossRef] [PubMed]
- Mourabet, M.; El Rhilassi, A.; El Boujaady, H.; Bennani-Ziatni, M.; Taitai, A. Use of response surface methodology for optimization of fluoride adsorption in an aqueous solution by Brushite. Arab J. Chem. 2017, 10, S3292–S3302. [Google Scholar] [CrossRef] [Green Version]
- Bewick, V.; Cheek, L.; Ball, J. Statistics review 7: Correlation and regression. Crit. Care 2003, 7, 451–459. [Google Scholar] [CrossRef] [Green Version]
- Filho, D.B.F.; Júnior, J.A.S.; Rocha, E.C. What is R2 all about? J. Leviathan 2011, 3, 60–68. [Google Scholar] [CrossRef] [Green Version]
- Vazquez, N.I.; Gonzalez, Z.; Ferrari, B.; Castro, Y. Synthesis of mesoporous silica nanoparticles by sol-gel as nanocontainer for future drug delivery applications. Bol. Soc. Esp. Ceram. V 2017, 56, 139–145. [Google Scholar] [CrossRef]
- Yamada, H.; Urata, C.; Ujiie, H.; Yamauchi, Y.; Kuroda, K. Preparation of aqueous colloidal mesostructured and mesoporous silica nanoparticles with controlled particle size in a very wide range from 20 nm to 700 nm. Nanoscale 2013, 5, 6145–6153. [Google Scholar] [CrossRef]
- Purwaningsih, H.; Ervianto, Y.; Pratiwi, V.M.; Susanti, D.; Purniawan, A. Effect of Cetyl Trimethyl Ammonium Bromide as Template of Mesoporous Silica MCM-41 from Rice Husk by Sol-Gel Method. IOP Conf. Ser. Mater. Sci. Eng. 2019, 515, 012051. [Google Scholar] [CrossRef]
- Cai, Q.; Lin, W.-Y.; Xiao, F.-S.; Pang, W.-Q.; Chen, X.-H.; Zou, B.-S. The preparation of highly ordered MCM-41 with extremely low surfactant concentration. Microporous Mesoporous Mater. 1999, 32, 1–15. [Google Scholar] [CrossRef]
- Naowanon, W.; Chueachot, R.; Klinsrisuk, S.; Amnuaypanich, S. Biphasic synthesis of amine-functionalized mesoporous silica nanospheres (MSN-NH2) and its application for removal of ferrous (Fe2+) and copper (Cu2+) ions. Powder Technol. 2018, 323, 548–557. [Google Scholar] [CrossRef]
- Schneider, P. Adsorption isotherms of microporous-mesoporous solids revisited. Appl. Catal. A 1995, 129, 157–165. [Google Scholar] [CrossRef]
- Chen, G.T.; Teng, Z.G.; Su, X.D.; Liu, Y.; Lu, G.M. Unique Biological Degradation Behavior of Stober Mesoporous Silica Nanoparticles from Their Interiors to Their Exteriors. J. Biomed. Nanotechnol. 2015, 11, 722–729. [Google Scholar] [CrossRef]
- Carvalho, G.C.; Sábio, R.M.; de Cássia Ribeiro, T.; Monteiro, A.S.; Pereira, D.V.; Ribeiro, S.J.L.; Chorilli, M. Highlights in Mesoporous Silica Nanoparticles as a Multifunctional Controlled Drug Delivery Nanoplatform for Infectious Diseases Treatment. Pharm. Res. 2020, 37, 1–30. [Google Scholar] [CrossRef]
- Sarparanta, M.; Mäkilä, E.; Heikkilä, T.; Salonen, J.; Kukk, E.; Lehto, V.-P.; Santos, H.A.; Hirvonen, J.; Airaksinen, A.J. ¹⁸F-labeled modified porous silicon particles for investigation of drug delivery carrier distribution in vivo with positron emission tomography. Mol. Pharm. 2011, 8, 1799–1806. [Google Scholar] [CrossRef]
- Sarparanta, M.; Bimbo, L.M.; Rytkönen, J.; Mäkilä, E.; Laaksonen, T.J.; Laaksonen, P.; Nyman, M.; Salonen, J.; Linder, M.B.; Hirvonen, J.; et al. Intravenous delivery of hydrophobin-functionalized porous silicon nanoparticles: Stability, plasma protein adsorption and biodistribution. Mol. Pharm. 2012, 9, 654–663. [Google Scholar] [CrossRef]
- El Mourabit, S.; Guillot, M.; Toquer, G.; Cambedouzou, J.; Goettmann, F.; Grandjean, A. Stability of mesoporous silica under acidic conditions. RSC Adv. 2012, 2, 10916–10924. [Google Scholar] [CrossRef]
- He, Q.; Shi, J.; Chen, F.; Zhu, M.; Zhang, L. An anticancer drug delivery system based on surfactant-templated mesoporous silica nanoparticles. J. Biomater. 2010, 31, 3335–3346. [Google Scholar] [CrossRef]
- Chen, J.; Qiu, X.; Ouyang, J.; Kong, J.; Zhong, W.; Xing, M.M. pH and reduction dual-sensitive copolymeric micelles for intracellular doxorubicin delivery. Biomacromolecules 2011, 12, 3601–3611. [Google Scholar] [CrossRef] [PubMed]
- He, Q.; Shi, J. MSN anti-cancer nanomedicines: Chemotherapy enhancement, overcoming of drug resistance, and metastasis inhibition. J. Mater. Chem. 2014, 26, 391–411. [Google Scholar] [CrossRef] [PubMed]


| Response Surface Design | ||
|---|---|---|
| Factors | Low Limit | High Limit |
| X1: CTAB amount (g) | 0.25 | 1.00 |
| X2: TEOS amount (mL) | 5.00 | 10.00 |
| X3: 2 N NaOH volume (mL) | 1.75 | 7.00 |
| Responses | Goal | |
| Y1: Surface area (m2/g) | Maximize | |
| Y2: Particle size (nm) | Minimize | |
| Y3: Zeta potential (mV) | Most negative | |
| Sample | CTAB (g) | TEOS (mL) | 2 N NaOH (mL) | Particle Size (nm) | Structure Ordering |
|---|---|---|---|---|---|
| F1 | 0.125 | 5.00 | 3.50 | - | △ |
| F2 | 0.250 | 5.00 | 3.50 | 95.7 ± 1.0 | ○ |
| F3 | 0.500 | 5.00 | 3.50 | 96.1 ± 4.4 | ○ |
| F4 | 1.000 | 5.00 | 3.50 | 114.5 ± 8.6 | ○ |
| F5 | 1.500 | 5.00 | 3.50 | 335 ± 128.8 | ○ |
| F6 | 0.500 | 1.25 | 3.50 | - | X |
| F7 | 0.500 | 2.50 | 3.50 | - | X |
| F8 | 0.500 | 10.00 | 3.50 | 124.6 ± 13.5 | ○ |
| F9 | 0.500 | 15.00 | 3.50 | - | △ |
| F10 | 0.500 | 5.00 | 0.88 | - | X |
| F11 | 0.500 | 5.00 | 1.75 | 49.7 ± 2.7 | ○ |
| F12 | 0.500 | 5.00 | 7.00 | 128.5 ± 10.1 | ○ |
| F13 | 0.500 | 5.00 | 10.50 | - | △ |
| Run | Factors | Response | ||||
|---|---|---|---|---|---|---|
| X1 | X2 | X3 | Y1 | Y2 | Y3 | |
| CTAB (g) | TEOS (mL) | 2 N NaOH (mL) | Surface Area (m2/g) | Particle Size (nm) | Zeta Potential (mV) | |
| 1 | 0.625 | 5.0 | 1.750 | 848.4 ± 217.6 | 75.5 ± 1.6 | −15.5 ± 1.2 |
| 2 | 0.625 | 10.0 | 1.750 | 1091.0 ± 68.5 | 95.1 ± 6.9 | −17.2 ± 3.6 |
| 3 | 0.250 | 10.0 | 4.375 | 956.4 ± 110.7 | 164.5 ± 2.8 | −25.2 ± 3.2 |
| 4 | 1.000 | 7.5 | 7.000 | 1100.8 ± 110.9 | 223.2 ± 65.0 | −9.3 ± 0.8 |
| 5 | 0.625 | 7.5 | 4.375 | 1204.3 ± 211.1 | 135.7 ± 6.5 | −18.9 ± 2.7 |
| 6 | 0.625 | 7.5. | 4.375 | 1202.2 ± 100.9 | 139.6 ± 10.9 | −17.8 ± 0.5 |
| 7 | 0.250 | 7.5 | 7.000 | 919.1 ± 122.7 | 195.4 ±2.6 | −25.7 ± 1.7 |
| 8 | 1.000 | 5.0 | 4.375 | 1112.7 ± 46.0 | 144.1 ± 13.2 | −14.7 ± 1.9 |
| 9 | 0.625 | 7.5 | 4.375 | 1212.1 ± 97.4 | 140.5 ± 28.0 | −19.4 ± 1.0 |
| 10 | 1.000 | 7.5 | 1.750 | 1029.4 ± 138.9 | 97.6 ± 14.3 | −18.8 ± 0.1 |
| 11 | 0.250 | 7.5 | 1.750 | 818.5 ± 117.5 | 77.9 ± 1.2 | −16.3 ± 4.4 |
| 12 | 0.625 | 7.5 | 4.375 | 1215.3 ± 89.0 | 140.7 ± 6.24 | −18.2 ± 0.7 |
| 13 | 0.625 | 10.0 | 7.000 | 920.4 ± 267.1 | 243.4 ± 68.3 | −20.1 ± 1.0 |
| 14 | 0.625 | 5.0 | 7.000 | 1107.9 ± 374.1 | 195.7 ± 5.1 | −16.8 ± 3.4 |
| 15 | 0.250 | 5.0 | 4.375 | 828.6 ± 81.6 | 114.6 ± 2.3 | −18.1 ± 5.8 |
| 16 | 1.000 | 10.0 | 4.375 | 1018.6 ± 128.7 | 175.4 ± 4.8 | −13.7 ± 2.4 |
| 17 | 0.625 | 7.5 | 4.375 | 1229.4 ± 109.1 | 155.3 ± 1.8 | −18.9 ± 2.8 |
| Response | Suggested Model | Sequential p-Value | Lack of Fit p-Value | R2 | Adjusted R2 | Predicted R2 | Adequate Precision |
|---|---|---|---|---|---|---|---|
| Y1 | Quadratic | <0.0001 | 0.1340 | 0.9950 | 0.9886 | 0.9405 | 33.3058 |
| Y2 | Linear | <0.0001 | 0.4298 | 0.9762 | 0.9707 | 0.9600 | 41.1591 |
| Y3 | 2FI | <0.0001 | 0.1503 | 0.9630 | 0.9408 | 0.8823 | 27.7873 |
| Optimized Factors | Responses | 95% CI Low Predicted Value | Predicted Value | 95% CI High Predicted Value | Actual Value | Error Percentage (%) |
|---|---|---|---|---|---|---|
| X1: 0.617 g | Y1 | 1118.2 | 1158.4 | 1198.6 | 1165.2 ± 172.9 | 0.6 |
| X2: 8.417 mL | Y2 | 91.3 | 110.3 | 129.3 | 116.1 ± 9.8 | 5.3 |
| X3: 2.726 mL | Y3 | −20 | −17.8 | −15.5 | −16.2 ± 4.4 | 8.6 |
| Responses | Coefficient Equations |
|---|---|
| Y1 | 1212.66 + 92.34X1 + 11.11X2 + 32.61X3 − 55.47X1X2 − 7.30 X1X3 − 107.53X2X3 − 129.29X12 − 104.28 X22 − 116.43X32 |
| Y2 | 147.89 + 11.00X1 + 18.56X2 + 63.94X3 |
| Y3 | −17.91+ 3.60X1 − 1.38X2 − 0.5062X3 + 2.03X1X2 + 4.75X1X3 − 0.3875X2X3 |
Publisher’s Note: MDPI stays neutral with regard to jurisdictional claims in published maps and institutional affiliations. |
© 2021 by the authors. Licensee MDPI, Basel, Switzerland. This article is an open access article distributed under the terms and conditions of the Creative Commons Attribution (CC BY) license (http://creativecommons.org/licenses/by/4.0/).
Share and Cite
Kim, M.-K.; Ki, D.-H.; Na, Y.-G.; Lee, H.-S.; Baek, J.-S.; Lee, J.-Y.; Lee, H.-K.; Cho, C.-W. Optimization of Mesoporous Silica Nanoparticles through Statistical Design of Experiment and the Application for the Anticancer Drug. Pharmaceutics 2021, 13, 184. https://doi.org/10.3390/pharmaceutics13020184
Kim M-K, Ki D-H, Na Y-G, Lee H-S, Baek J-S, Lee J-Y, Lee H-K, Cho C-W. Optimization of Mesoporous Silica Nanoparticles through Statistical Design of Experiment and the Application for the Anticancer Drug. Pharmaceutics. 2021; 13(2):184. https://doi.org/10.3390/pharmaceutics13020184
Chicago/Turabian StyleKim, Min-Ki, Do-Hyung Ki, Young-Guk Na, Hae-Soo Lee, Jong-Suep Baek, Jae-Young Lee, Hong-Ki Lee, and Cheong-Weon Cho. 2021. "Optimization of Mesoporous Silica Nanoparticles through Statistical Design of Experiment and the Application for the Anticancer Drug" Pharmaceutics 13, no. 2: 184. https://doi.org/10.3390/pharmaceutics13020184