Article

Molecular Properties of Drugs Handled by Kidney OATs and Liver OATPs Revealed by Chemoinformatics and Machine Learning: Implications for Kidney and Liver Disease

1
Skaggs School of Pharmacy, University of California San Diego, La Jolla, CA 92093, USA
2
Department of Chemistry and Biochemistry, University of California San Diego, La Jolla, CA 92093, USA
3
Department of Biology, University of California San Diego, La Jolla, CA 92093, USA
4
Department of Family and Preventative Medicine, University of California San Diego, La Jolla, CA 92093, USA
5
School of Medicine, Virginia Commonwealth University, Richmond, VA 23298, USA
6
Departments of Pediatrics and Medicine (Nephrology), University of California San Diego, La Jolla, CA 92093, USA
*
Authors to whom correspondence should be addressed.
These authors contributed equally to this work.
Pharmaceutics 2021, 13(10), 1720; https://doi.org/10.3390/pharmaceutics13101720
Submission received: 29 September 2021 / Revised: 12 October 2021 / Accepted: 14 October 2021 / Published: 18 October 2021
(This article belongs to the Special Issue Transport and Metabolism of Small-Molecule Drugs)

Abstract

:
In patients with liver or kidney disease, it is especially important to consider the routes of metabolism and elimination of small-molecule pharmaceuticals. Once in the blood, numerous drugs are taken up by the liver for metabolism and/or biliary elimination, or by the kidney for renal elimination. Many common drugs are organic anions. The major liver uptake transporters for organic anion drugs are organic anion transporter polypeptides (OATP1B1 or SLCO1B1; OATP1B3 or SLCO1B3), whereas in the kidney they are organic anion transporters (OAT1 or SLC22A6; OAT3 or SLC22A8). Since these particular OATPs are overwhelmingly found in the liver but not the kidney, and these OATs are overwhelmingly found in the kidney but not liver, it is possible to use chemoinformatics, machine learning (ML) and deep learning to analyze liver OATP-transported drugs versus kidney OAT-transported drugs. Our analysis of >30 quantitative physicochemical properties of OATP- and OAT-interacting drugs revealed eight properties that in combination, indicate a high propensity for interaction with “liver” transporters versus “kidney” ones based on machine learning (e.g., random forest, k-nearest neighbors) and deep-learning classification algorithms. Liver OATPs preferred drugs with greater hydrophobicity, higher complexity, and more ringed structures whereas kidney OATs preferred more polar drugs with more carboxyl groups. The results provide a strong molecular basis for tissue-specific targeting strategies, understanding drug–drug interactions as well as drug–metabolite interactions, and suggest a strategy for how drugs with comparable efficacy might be chosen in chronic liver or kidney disease (CKD) to minimize toxicity.

1. Introduction

A major issue in patients with impaired liver or kidney function is the route of elimination of prescribed drugs. Many common drugs such as beta-lactam antibiotics (e.g., penicillin), antivirals (e.g., tenofovir), analgesics (e.g., ibuprofen), statins used for hypercholesterolemia (e.g., pravastatin), antihypertensives (e.g., hydrochlorothiazide), and chemotherapeutics (e.g., methotrexate) are small organic anions [1,2,3,4,5,6]. Upon entering the blood through oral or parenteral routes, they are frequently taken up by the liver, where they may be modified by drug metabolizing enzymes (DMEs). The unmodified and modified drugs are generally eliminated into urine after kidney uptake or into the bile via the hepatobiliary system [7,8,9,10,11,12,13,14,15].
Although several hepatic and renal transporters can interact with organic anion drugs, four primary organic anion transporters involved in drug handling that have been initially highlighted by regulatory agencies are predominantly hepatic members of the OATP (SLCO) family and the predominantly renal members of the OAT (SLC22) family of solute carriers [16]. Specifically, these transporters are OATP1B1 (SLCO1B1) and OATP1B3 (SLCO1B3), both highly expressed on the basolateral (blood) surface of liver hepatocytes, and OAT1 (SLC22A6) and OAT3 (SLC22A8), both primarily expressed on the basolateral surface of kidney proximal tubule cells [7,13,17,18,19,20]. Apart from organic anion drugs, these transporters are also involved in the transport of metabolites, signaling molecules, nutrients, gut microbe products, and uremic toxins [21,22,23,24,25,26,27,28,29,30,31,32,33].
Transport assays indicate some drug ligand overlap between the liver OATPs and kidney OATs. Although certain organic anion drugs (e.g., methotrexate, pravastatin) can interact with at least one of the OATPs and one of the OATs at relatively high affinity (Ki ≈ 50 μ M) [34,35], there are many drugs that have a high affinity for at least one of the OATPs but not one of the OATs, and vice versa. Here, we focus on this latter group of drugs that have a strong preference for at least one of the liver OATPs versus at least one of the kidney OATs. This is clinically important for understanding which of several existing drugs that can be used for a medical problem might be best suited to a patient with liver disease or kidney disease. From a drug design perspective, the type of analysis we are undertaking may be helpful for designing drugs that selectively target the liver or the kidney [27,36,37]. Furthermore, since OATPs and OATs have well-established roles in the transport of metabolites and signaling molecules (e.g., prostaglandins, bile acids, uric acid), understanding the physiochemical properties of drugs handled by the aforementioned OATPs and OATs and comparing them to the physiochemical properties of other drugs and endogenous metabolites handled by these transporters should aid in in silico drug–drug interaction (DDI) prediction and drug–metabolite interaction (DMI) prediction [7,16,38,39,40,41,42,43,44,45,46].
Here, we have curated a list of drugs reported to interact with at least OATP1B1 or OATP1B3 with high affinity (based on Ki values) while not having a reported high affinity for either OAT1 or OAT3. Similarly, we have curated another list for drugs reported to interact with high affinity with at least OAT1 or OAT3 but not OATP1B1 or OATP1B3. We then obtained or calculated over 30 chemoinformatic metrics (molecular properties) for these drugs. Using a variety of data visualization, statistical and informational methods, we narrowed down the key properties distinguishing “liver OATPs” versus “kidney OATs”. Eventually, we settled on eight molecular properties. Using a broad range of machine learning (e.g., k-nearest neighbors, random forest, decision tree, logistic regression) and deep-learning (neural network) approaches, we were able to use these molecular properties to classify OATPs versus OATs with high accuracy. Indeed, as high as >95% classification was obtained with certain methods. This very high classification accuracy based on only a relatively small set of molecular properties paves the way for new approaches to tissue targeting of small-molecule drugs, prediction of metabolic side effects, and tailoring drug therapy in the setting of organ injury or impairment (e.g., chronic kidney disease, acute renal injury, liver disease).

2. Materials and Methods

2.1. Curation of Drug Lists

A list was curated of drugs that interacted selectively with at least one OATP (OATP1B1 and/or OATP1B3), but not OAT1 or OAT3; a similar list was curated for drugs that interact with at least one OAT (OAT1 and/or OAT3), but not an OATP. The cut-off used was a measured or calculated Ki < 250 μ M (Supplementary Materials Table S1). If a drug (e.g., pravastatin, methotrexate) had a Ki < 250 μ M for an OATP and an OAT, it was not included to focus on features important to hepatic uptake by OATPs or renal uptake by OATs. Articles used for list curation are indicated in Supplementary Materials Table S2. Very often in the same article, there were data for both OATP1B1 and OATP1B3, or for OAT1 and OAT3. Rarely there were data for all four transporters in the same article. If high affinity of a drug for an OATP was reported in one article, but we could not find the affinity for an OAT in the literature, that drug was not included. It is also possible that we missed some relevant reports. However, we believe such situations are likely to be few, and given the robust results, unlikely to appreciably affect the classification metrics shown in the Results. In addition, we also note that the data are largely based on Ki values from cell-based in vitro systems, and whether these preferences hold in vivo remains to be verified in most cases.

2.2. Cheminformatics

2D chemical structures of drugs were imported and standardized (removing salts, explicit hydrogens and standardizing chemical groups) using various tools found in the computational environment of commercially available cheminformatics software package ICM Chemist (Molsoft). Once standardized, a set of 77 physicochemical properties for the chemicals were calculated. Complexity values for the chemicals were obtained from PubChem.

2.3. Defining Key Molecular Properties Distinguishing Kidney OATs vs. Liver OATPs

From a broader set of over 70 molecular properties, a smaller subset of properties was selected for classification using machine learning and deep learning. These structural and physicochemical properties were chosen in such a manner to identify critical features distinguishing drugs interacting uniquely with at least one OATP (OATP1B1 and/or OATP1B3) or at least one OAT (OAT1 and/or OAT3). An initial step was the elimination of highly correlated features by plotting the pairwise-correlation coefficients. For example, molecular volume was highly correlated with several other measures of molecular size or mass.
Furthermore, from a reduced set of more than 30 molecular properties (as described in Results), data visualizations (e.g., distributions, boxplots), measures of information gain, predictor screening (using Bootstrap/Random Forests in JMP Pro 15), principal components analysis, and FreeViz (Orange) were used to reduce the set of features to eight.

2.4. Machine Learning and Data Visualization with Orange

For interactive data analysis, data visualization, and machine learning, we used the Orange version 3.16 machine learning tools, which are largely based on the python library scikit-learn [47,48]. Data analysis methods included principal component analysis (PCA), FreeViz diagram, and application of several machine learning classification methodologies such as random forest, naïve bayes, decision trees, simple neural networks, k-nearest neighbors and logistic regression. The “leave-one-out” method was generally used for cross-validation. Other details are indicated in Results or in Figures. Orange default parameters were generally used for the purpose of analysis. However, we note that some of these parameters were varied when individual classification algorithms were performed using python.

2.5. Machine Learning and Data Visualization with Python Libraries

Although most of the data shown in the text comes from the Orange software package, data wrangling, data analysis, machine learning, and deep-learning codes were also written in Python 3.8 [49]. Python libraries for data analysis included pandas, NumPy, and SciPy. For data visualization, we used seaborn, matplotlib, pydotplus, and plotly. Machine learning and deep-learning codes were written using Keras, scikit-learn and TensorFlow. In general, similar analysis and results were obtained from independently written python scripts in a jupyter notebook as compared from those obtained with Orange.

2.6. Deep-Learning Classification

Analysis of critical features to classify drugs selectively interacting with liver OATPs (OATP1B1 and/or OATP1B3) versus kidney OATs (OAT1 and/or OAT3) has been achieved independently via built-in functions in Orange and with python scripts using scikit-learn, Keras and Tensorflow in jupyter notebooks. Multiple independent runs could classify these drugs with a very high accuracy exceeding 95%.

3. Results

3.1. Overview

Many commonly prescribed drugs are small organic anions. After entry into the circulation, they are often taken up into the liver (for metabolism by Phase 1 and Phase 2 drug metabolizing enzymes and/or biliary elimination) or the kidney (for elimination into the urine). In the case of liver, entry often occurs via the major multi-specific drug transporters: the organic anion transporting polypeptides, OATP1B1 (SLCO1B1) or OATP1B3 (SLCO1B3), grouped below as the main “liver” organic anion uptake (basolateral) transporters (“liver OATPs”). In the case of kidney, major multi-specific basolateral drug transporters are the organic anion transporters: OAT1 (SLC22A6) or OAT3 (SLC22A8), grouped below as the kidney transporters of drugs that are organic anions (“kidney OATs”). Because these particular OATPs have little if any expression in the mature kidney, and because these particular OATs have little if any expression in the mature liver, the “operational” groupings into liver and kidney transporters of (organic anion) drugs is appropriate for the aim at hand. Although low expression of OAT3 has been reported in fetal liver, in the adult liver there is minimal if any expression [18,23]. Although there are other transporters of organic anions expressed in both organs, their quantitative importance in in vivo handling of small organic anion drugs in humans is not well established. Furthermore, while OAT1 and OAT3 are part of the same subgroup of OATs, other SLC22 organic anion transporters in the kidney fall into a different subgroups based on phylogenetic and functional analysis [19].
With an appreciation of these “operational” considerations, our aim was to combine chemoinformatic analysis of wet lab data with machine learning and deep learning to define sets of molecular properties of relatively small negatively charged drugs that target them for liver (OATP-mediated) versus kidney (OAT-mediated) uptake. This approach was hypothesized to capture the molecular basis of organic anionic small-molecule drugs handled by the liver or the kidney as well as provide a rational basis for understanding the physiochemical properties of drugs that could lead, at the transporter level, to DDI and drug–metabolite interactions. This type of distinction could also be very useful in designing drugs targeting the liver or the kidney or the elimination pathways in which these organs play essential roles.
Although the purpose of these analyses was to define the molecular properties of organic anion drugs taken up by liver OATPs versus the kidney OATs, we note here a general problem in the field is the fact that there is much more quantitative data on drug inhibition of transporter-mediated uptake (i.e., Ki data, IC50 data) than there is of actual transport of the drug itself (i.e., Km data). Thus, we rely here on measured Ki data or calculated Ki data (based on IC50) with the understanding that it does not necessarily actual reflect transport. On the other hand, it is likely to be a reasonable reflection of the initial interaction with the transporter binding pocket that ultimately can lead to transport, and this interaction may be highly relevant for understanding DDI and drug–metabolite interactions (DMI).
The following sections describe how, beginning with chemoinformatic analyses of over 30 molecular properties of organic anion drugs, we were able to identify eight molecular properties that, together, gave excellent classification of drugs interacting with the liver uptake transporters (liver OATPs) compared to the kidney uptake transporters (kidney OATs). Relative feature importance depended upon the method chosen (e.g., information gain, random forest, FreeViz), and only some of the analysis is presented. Further analysis was done using machine learning and statistical software (Orange, JMP) as well as scripting in the python packages for machine learning (scikit-learn) and neural network building (Keras). Although multiple rounds of (re)analysis were performed, we began with data visualization and statistical analysis, followed by machine learning. Thus, the results are presented in that order.

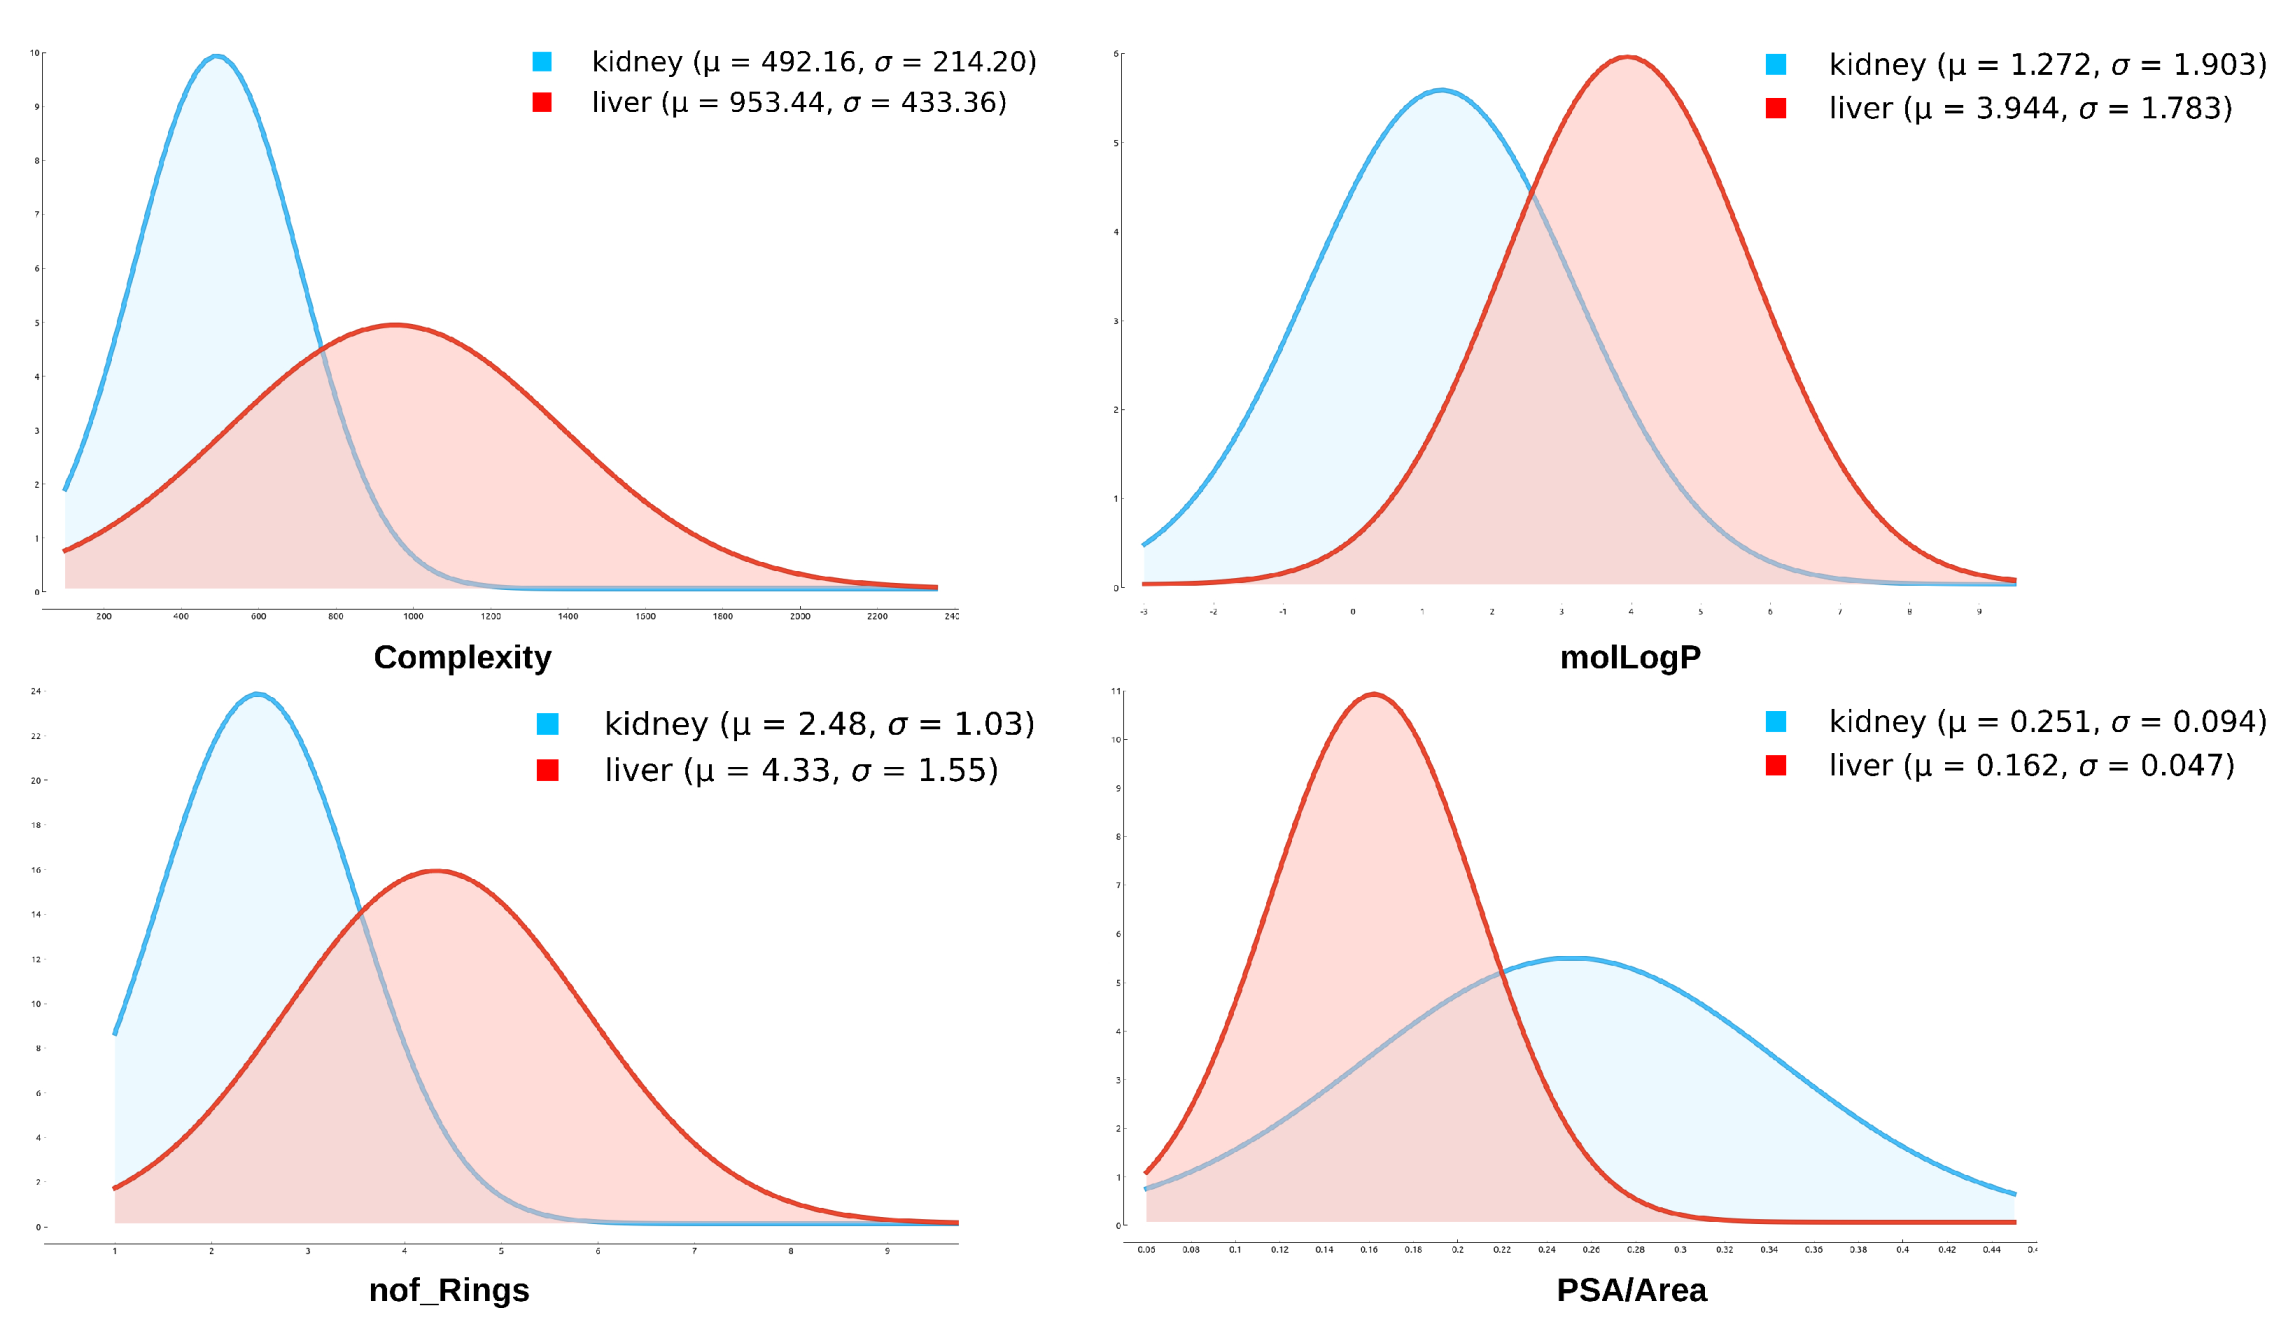
3.2. Chemoinformatic Analysis of Molecular Properties

From the list of over 80 drugs reported to interact selectively with OATP1B1 and/or OATP1B3 or OAT1 and/or OAT3 (Supplementary Materials Table S1), we focused upon a list of over 30 molecular and physiochemical properties of these drugs (Supplementary Materials Table S3). This list of molecular properties, in turn, was derived from larger set of over 70 molecular properties obtained from evaluation of drug structures using the chemoinformatic tools in ICM Chemist Pro. (Complexity values were obtained from PubChem).
From the raw dataset, a standard procedure for data processing was implemented to prepare the input dataset for implementation in JMP statistical software, Orange machine learning software, and various python packages implemented in a jupyter notebook (e.g., pandas, matplotlib, seaborn, scikit-learn). This allowed us to analyze the molecular properties (features) of the drugs (instances) from multiple perspectives. Prior to implementing machine learning and neural network/deep-learning approaches described below, we followed a variety of data visualization, statistical and informational methods to narrow down the key properties distinguishing liver OATPs and kidney OATs.
Many visualizations and spreadsheet analyses were performed, and only a few of the more relevant for understanding the machine learning and neural network analysis are described here. From the plots of drugs interacting with liver OATPs versus kidney OATs (Figure 1), it is apparent that PSA/Area for drugs interacting with liver OATPs differ from kidney OATs. PSA/Area is a surface-normalized feature that is reflective of the density of surface groups capable of hydrogen bonding. Consistent with this, in the drug dataset, it positively correlates with molLogS (r ≈ 0.4), a measure of aqueous solubility, and negatively correlates with molLogP (r ≈−0.7), a measure of lipid solubility. PSA/Area of drugs interacting with liver OATPs is lower than for drugs interacting with kidney OATs. Such differences between drugs interacting with liver OATPs versus kidney OATs can also be seen with Complexity and nof_Rings, with drugs favoring liver OATPs having both a higher Complexity and greater number of ringed structures. Thus, the exploratory data analysis suggested PSA/Area, Complexity, nof_Rings, and molLogP may be key properties distinguishing drugs interacting with liver OATPs and kidney OATs. Nevertheless, in the univariate analyses, one finds some overlap between OATs and OATPs. However, when multiple molecular properties are considered, as in the FreeViz diagrams and decision tree classification, there is much better separation between kidney OAT-interacting drugs and liver OATP-interacting drugs. (This is discussed below in the context of Figure 2, Figure 3 and Figure 4).

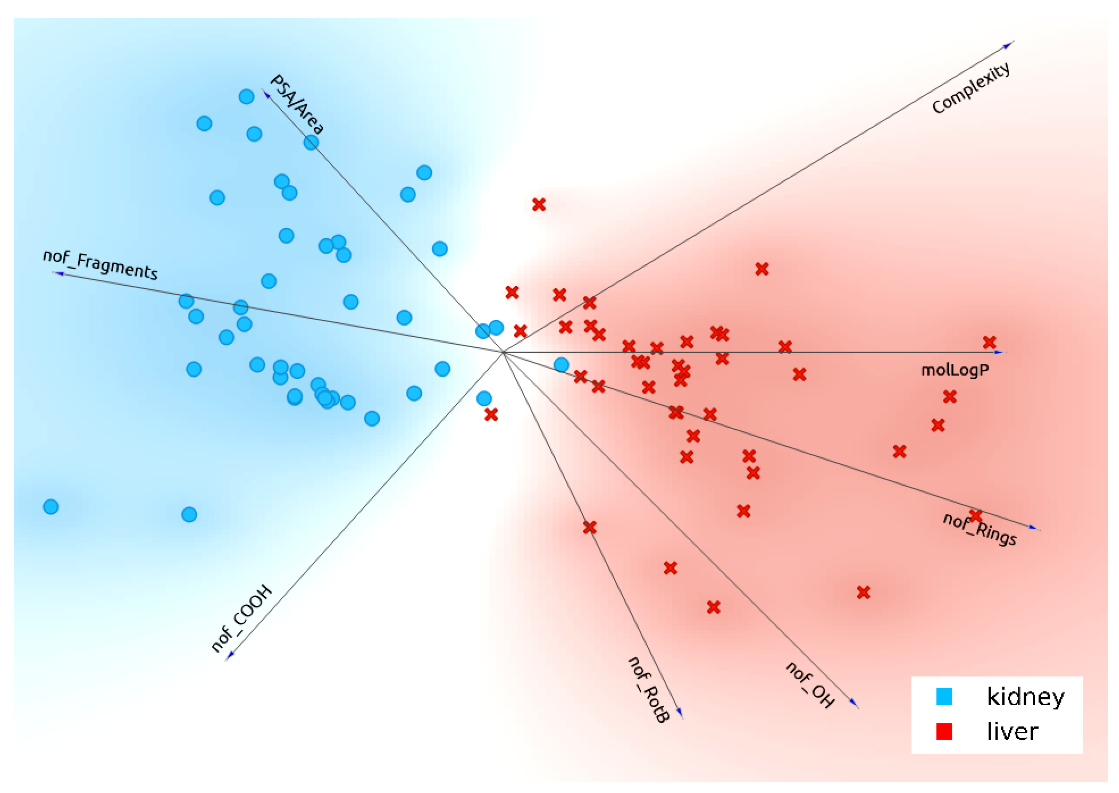
3.3. Selection of Molecular Properties (Feature Selection) for Machine Learning Classification of Liver OATP Drugs and Kidney OAT Drugs

In an integrative approach towards feature selection, we also employed JMP’s feature predictor screening tool which uses a bootstrap forest approach (data not shown). Orange allowed evaluation of information gain for each feature. Since the aforementioned feature screening methodologies use different algorithms, they may favor different feature sets. To help resolve this issue, certain highly correlated features (e.g., molArea, molVolume, molWeight) were eliminated in favor of a single one that captured multiple aspects of the removed features and possibly some other key aspect of the structure (Supplementary Materials Figure S1). For example, Complexity correlated very highly with molWeight (r > 0.9). Since we needed a limited set of features (ideally less than one-tenth of the total number of instances), we chose eight features (Table 1) based on distribution plots and visualizations, aforementioned feature selection algorithms, and interpretability. These were: PSA/Area, molLogP, Complexity, nof_Rings, nof_OH, nof_COOH, nof_Fragments, and nof_RotB. By principal components analysis, this feature set accounted for around 75–80% of variance in the data (three components).
Figure 1. Distribution plots of molecular properties of small organic anion drugs interacting with liver OATPs (SLCO1B1, SLCO1B3, or both) versus kidney OATs (SLC22A6, SLC22A8, or both). Distributions of several molecular properties were analyzed for liver OATPs and kidney OATs. Ultimately, the following molecular properties were chosen: molLogP, PSA/Area, Complexity, nof_Rings, nof_OH, nof_COOH, nof_RotB, and nof_Fragments.
Pharmaceutics 13 01720 g001
The FreeViz diagram (Figure 2 and Figure 3) is another way of evaluating the potential importance of the selected features for classifying drugs preferring liver OATPs versus kidney OATs. FreeViz is an optimization method in Orange that analyzes the importance and relationship of features resulting in a circular diagram that in this case, shows what features (molecular properties) in drugs predispose to interaction with the liver OATPs as compared to the kidney OATs. In these figures, the angle between the arrows is related to the correlations between various features, and the magnitude is related to the potential contribution of each feature. Through FreeViz, these eight features appear to separate the liver OATPs from the kidney OATs and thus support the feature selection strategy described above. Although a few of the molecular properties are correlated, we considered it important to retain them in light of the other analyses already described and their interpretability in the binary classification using machine learning and neural networks described below.
Figure 2. FreeViz diagram segregating kidney and liver drugs based on selected molecular features. FreeViz diagram is one method to analyze the likely importance of the chosen features for determining the interaction of drugs with liver OATPs (Complexity, molLogP, nof_Rings, nof_OH, nof_RotB) versus kidney OATs (nof_COOH, nof_Fragments, PSA/Area). In the figure, length of the arrow reflects the magnitude of the feature according to FreeViz optimization method, and angle between the arrows reflects the correlation between features.
Pharmaceutics 13 01720 g002
Figure 3. 12 drugs with a propensity for interaction with either kidney OATs or liver OATPs highlighted in FreeViz diagram. Quantitative information for the eight molecular properties pertaining to each drug are shown in Table 2.
Pharmaceutics 13 01720 g003
Table 2. Eight molecular properties for 12 drugs highlighted in the FreeViz diagram (Figure 3).
DrugPubChemIDOrgannof_OHnof_FragmentsmolLogPnof_RotBnof_Ringsnof_COOHComplexityPSA/Area
Tenofovir25448811Kidney019−2.96915203540.383860
Furosemide10991988Kidney0321.56885214810.328760
Salicylate17553798Kidney0151.25621111330.318860
Cefoperazone15618660Kidney045−0.3194125112500.299100
Cyclothiazide25448811Kidney0401.35832407580.309350
Lamivudine18174163Kidney115−1.04962203310.317660
Pitavastatin16595711Liver3314.66378416310.162070
Lopinavir20102298Liver1465.245317409400.133870
Indinavir20102298Liver2452.841214509520.139510
Paclitaxel18321482Liver3643.3763157017900.201475
Mifepristone18321482Liver1345.24203509210.065822
Troglitazone18321482Liver1314.66995406810.145090

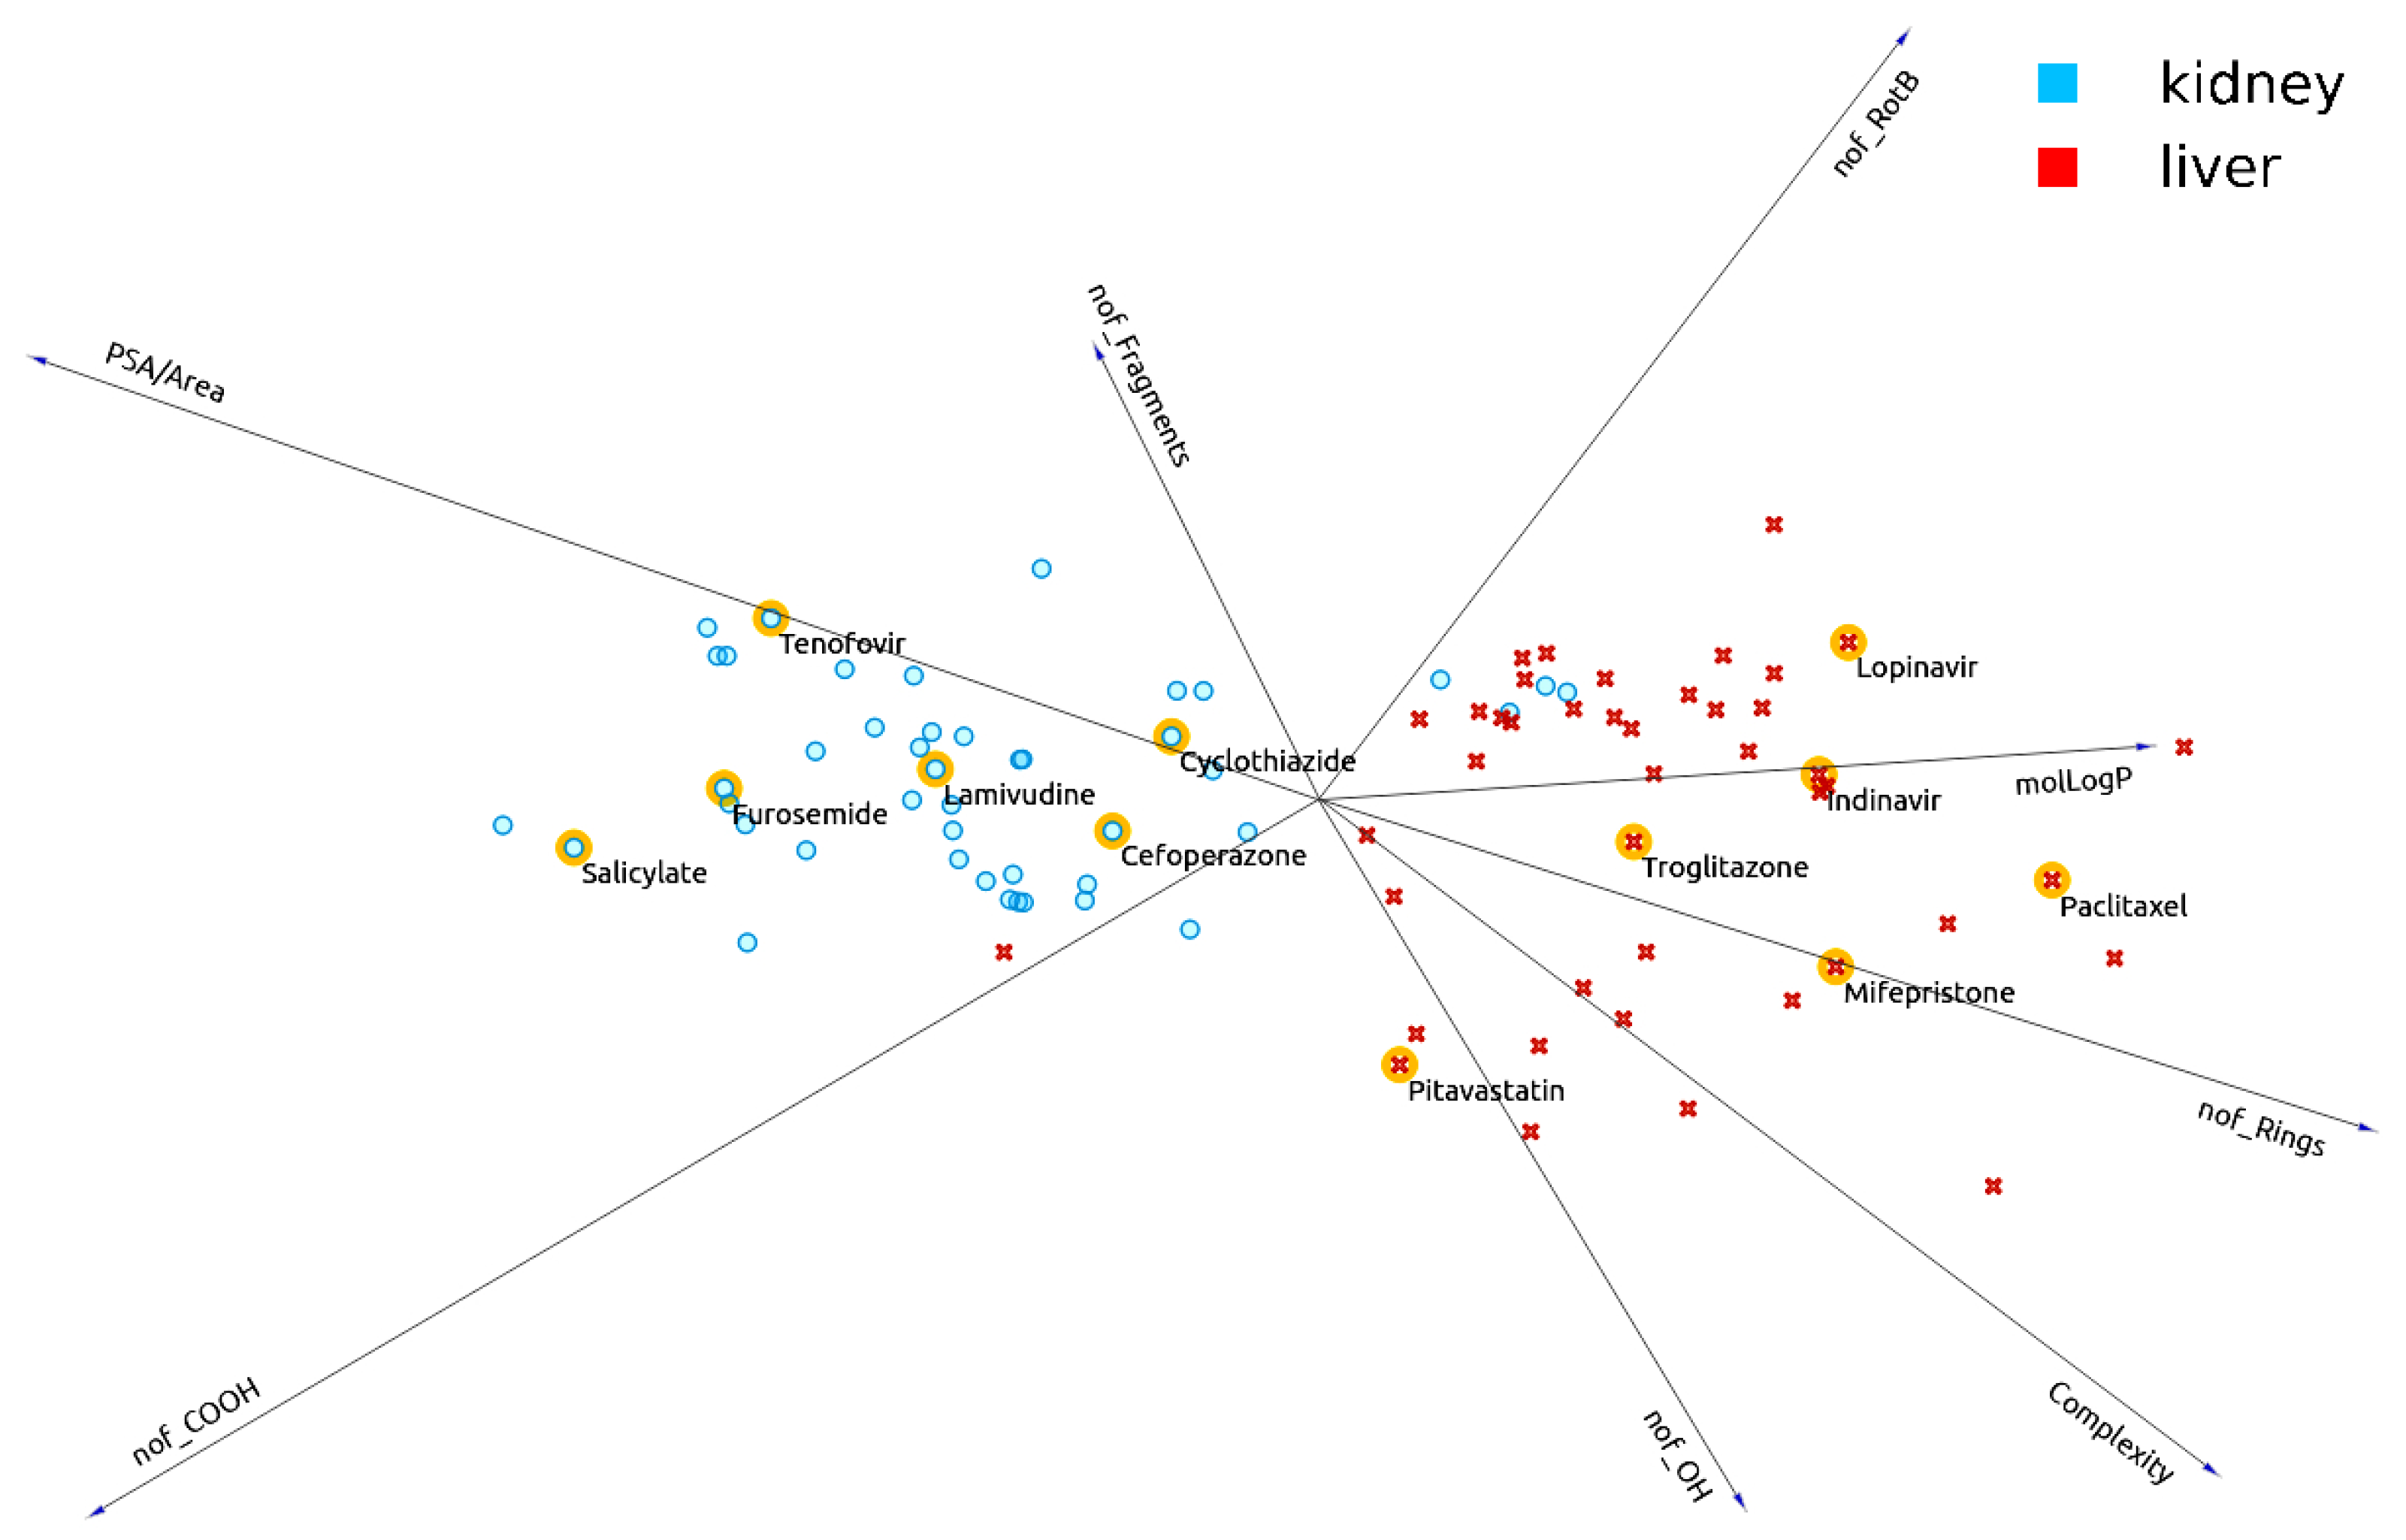
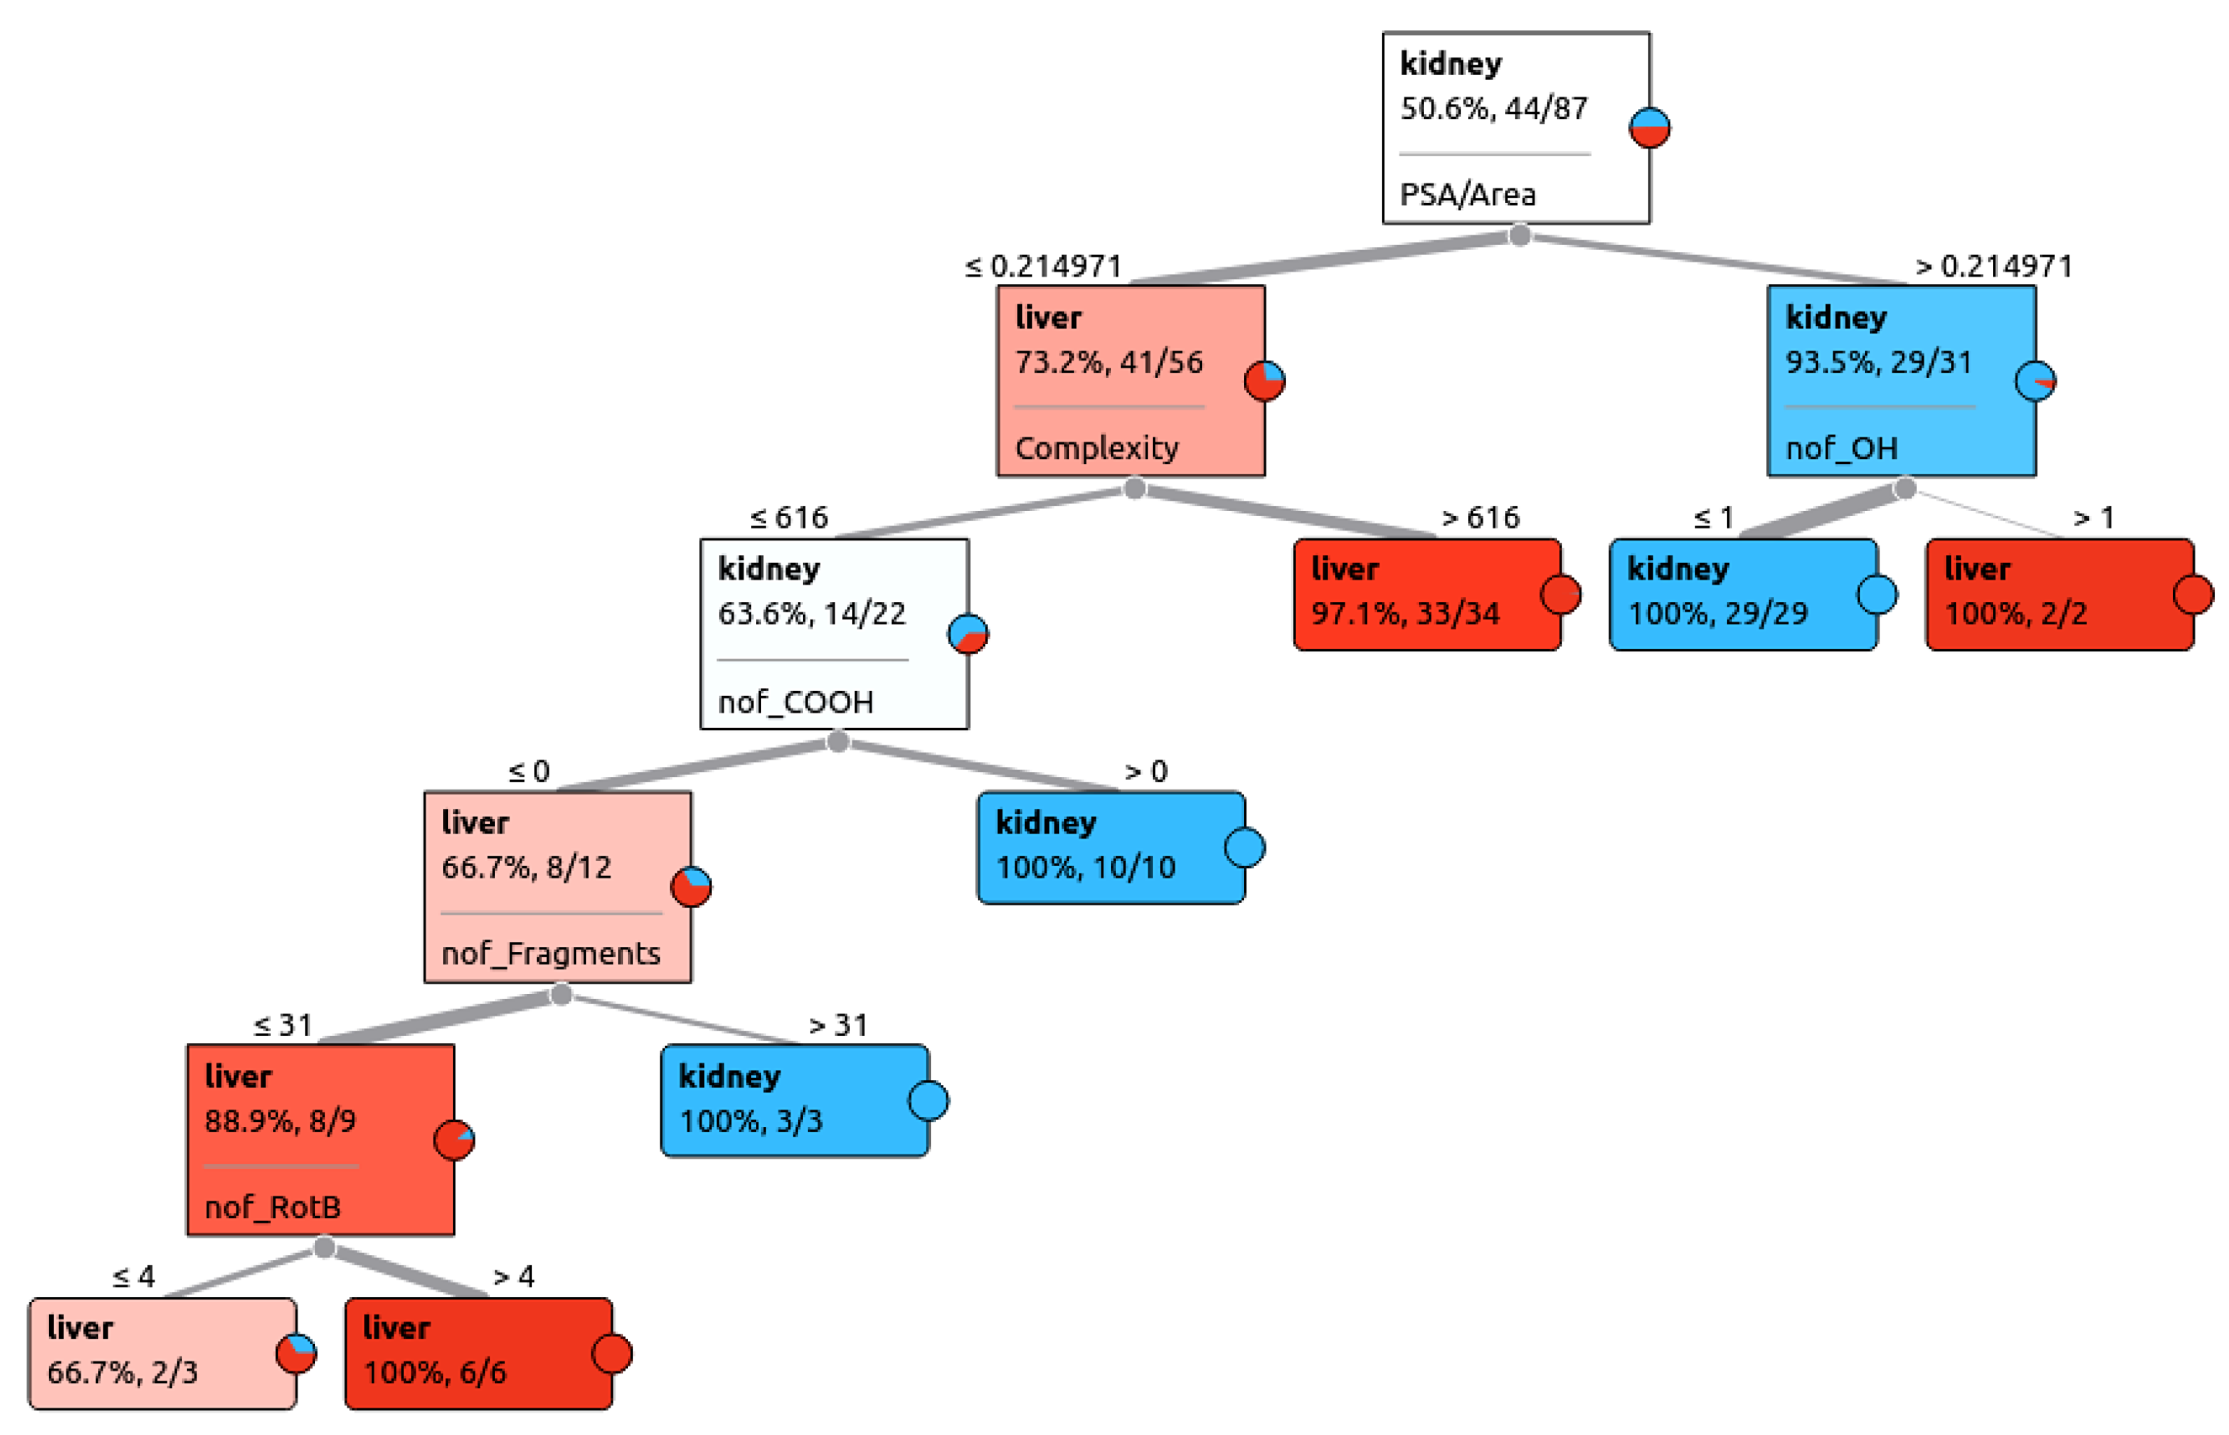
3.4. Effectiveness of Set of 8 Molecular Properties in Machine Learning Analysis of Drugs Preferring Liver OATPs versus Kidney OATs

Machine learning and neural network analysis was done using Orange, JMP, and python packages. Orange is an open-source machine learning and data visualization software; JMP is a statistical and data analytics package that interfaces with SAS. Much of the initial analysis was done with Orange and JMP. Machine learning scripts were also written in python using the jupyter notebook. Libraries such as pandas, numpy, matplotlib, and seaborn were imported for data preparation, analysis, and visualization. Generally, scikit-learn and Keras were used, respectively, to perform machine learning (e.g., random forest classification, logistic regression, decision tree classification, k-nearest neighbors classification) or to build neural networks (e.g., sequential model). In general, these python-based codes were used to confirm the results obtained in Orange and to assess the impact of choosing different parameters (as opposed to default choices) for individual classification algorithms.
As can be seen in Table 3, with the chosen set of eight features (molecular properties), binary classification accuracies in range of ≈75–99% (over many runs using the “leave-one-out” method in Orange test and score) were obtained depending on the ML approach employed. This method included k-nearest neighbors, decision tree, random forests, logistic regression, and naïve bayes approaches. Area under ROC curves (AUC) were also high, in the range of 0.9 or above (Table 3). Given the high classification accuracies, it is not surprising that the number of misclassified instances were low.
With a decision tree (Figure 4), it is often easy to appreciate the role different features (in this case, molecular properties of drugs) in the classification of drugs interacting with liver OATPs versus kidney OATs; in other words, how an algorithm “thinks” as it reduces entropy (disorder in data) at each decision node by evaluating information gain.
Decision tree classification accuracies were generally less than for random forests but still in the 80–95% range, depending on the run. In the decision tree shown, most important features for classification were PSA/Area, Complexity, nof_OH, nof_COOH, nof_fragments, and nof_RotB. In other decision trees, it was interesting to note that even though the homogenous terminal node in the tree arrived through a series of binary decisions involving several molecular properties, within those nodes, the chemical similarity of drugs, as measured by the Tanimoto similarity score, was modest (Supplementary Materials Figure S2). Thus, it appears, at least in this analysis of liver OATPs versus kidney OAT-interacting drugs, sets of molecular properties which eventually result in a pure terminal node on the decision tree do not necessarily correspond to drugs with high chemical similarity as measured by Tanimoto similarity score.

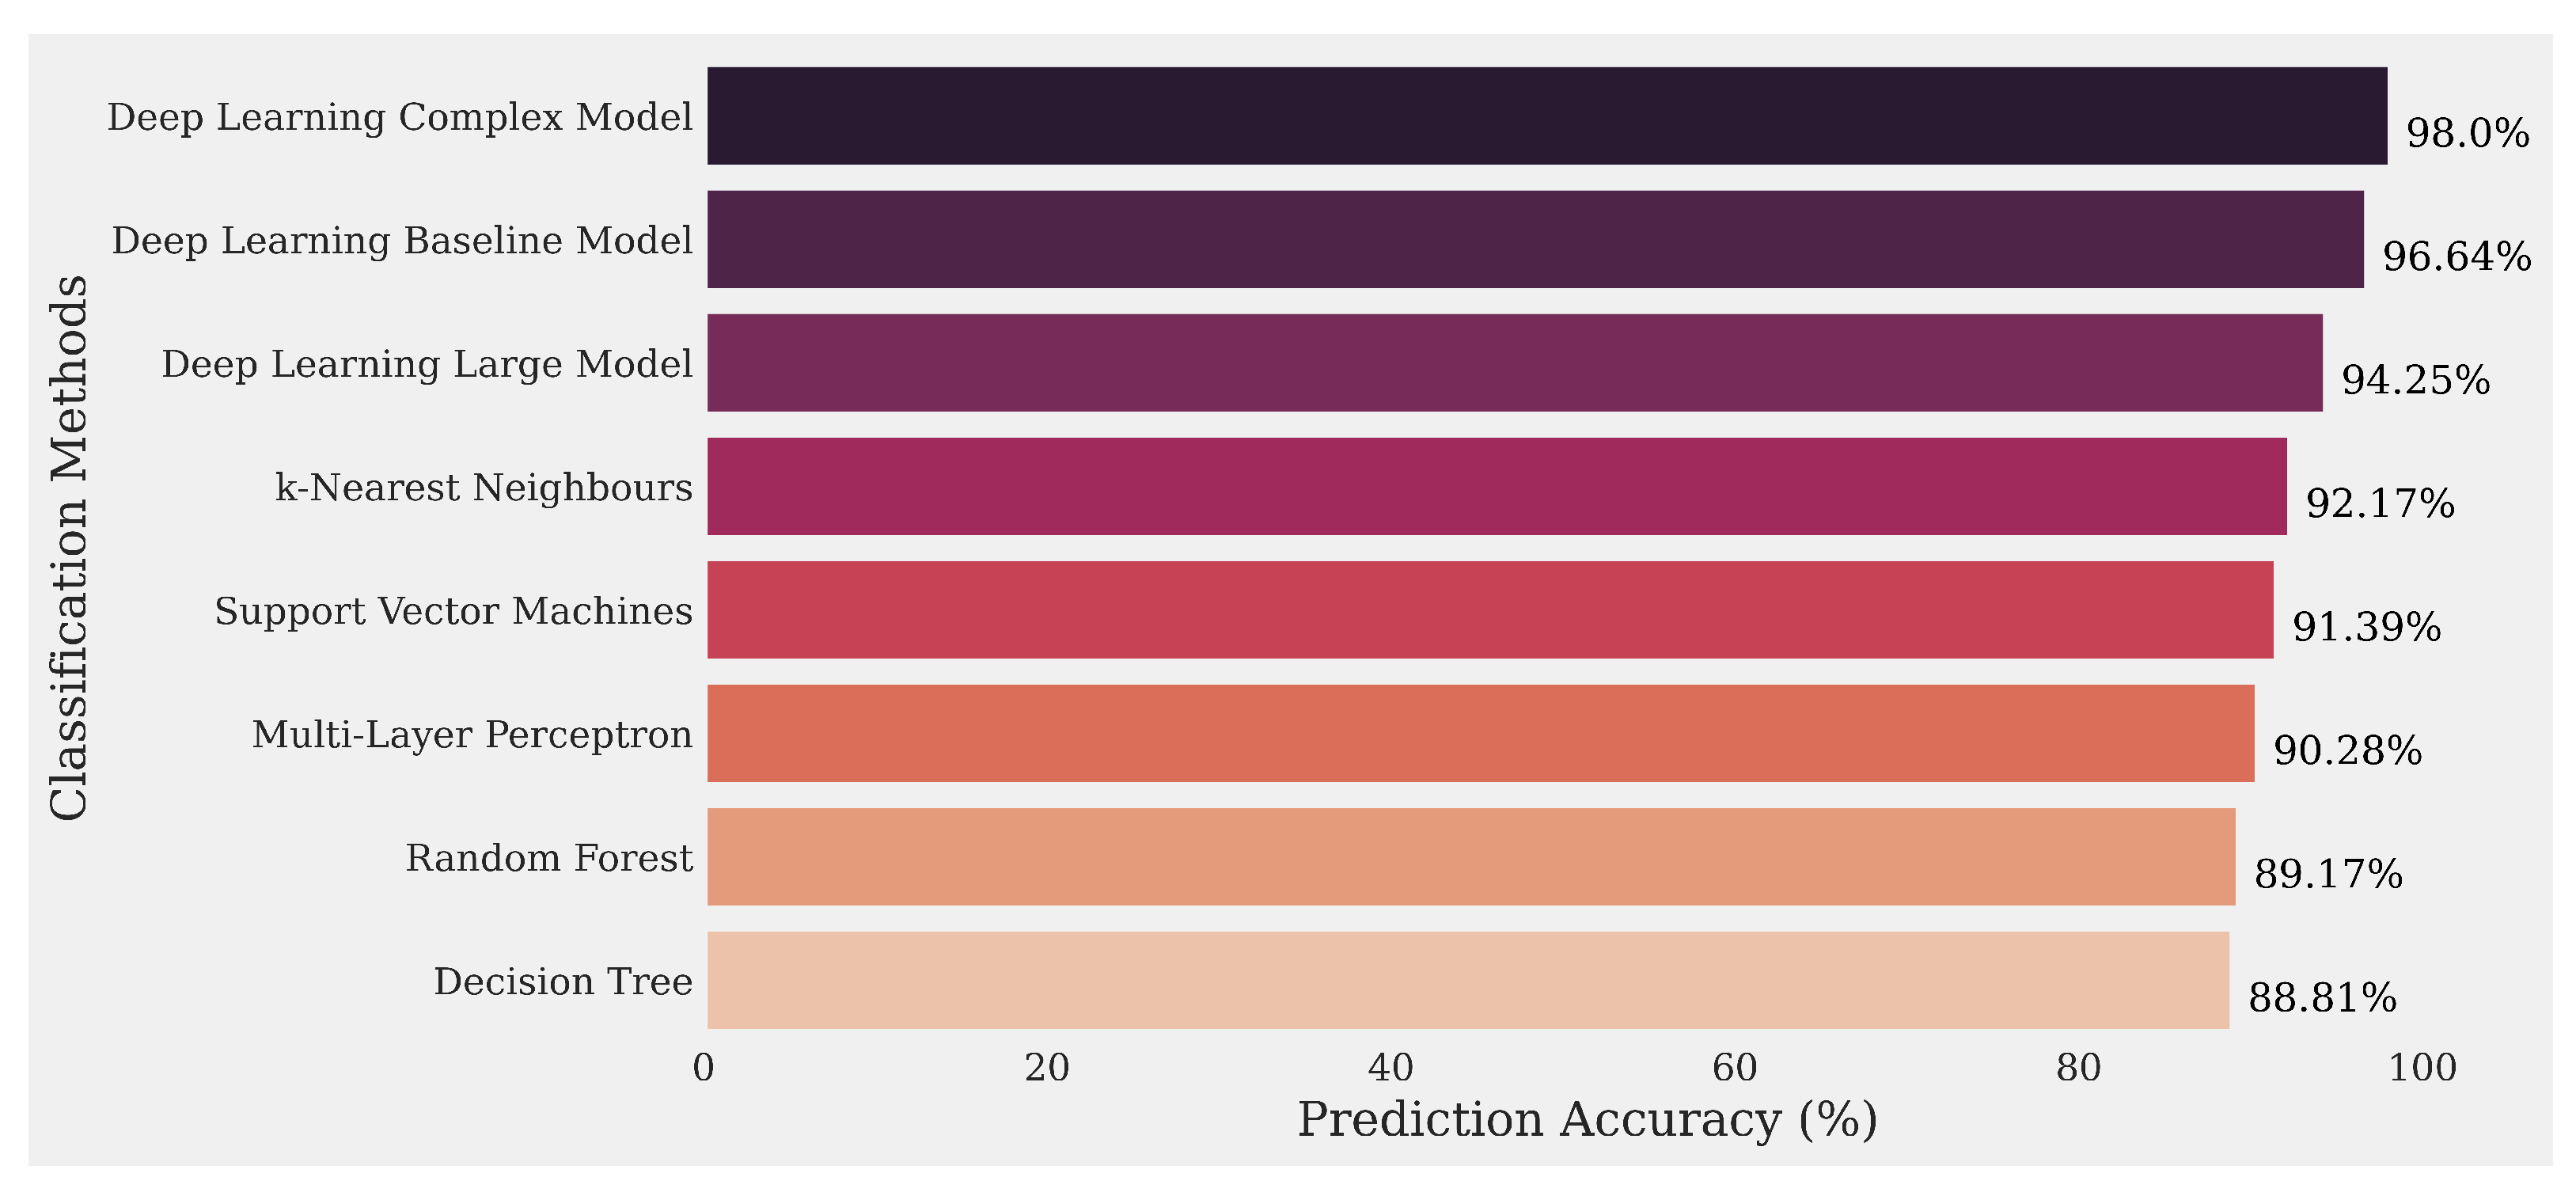
3.5. Comparison of Deep-Learning Models with Other Machine Learning Models

Three deep-learning models were prepared to test the accuracy of the selected features for classifying the OAT-interacting drugs and the OATP-interacting drugs correctly. Keras, a deep-learning Artificial Programming Interface (API) built on top of Tensorflow, an open-source machine learning library, was used to prepare these models. These models are designated as the “baseline”, “large”, or “complex” model depending on the number of nodes and number of the hidden layers as well the neural network’s activation functions. For example, the complex model has three hidden layers and employs the rectified linear unit (ReLU) and the sigmoid activation functions. In contrast, the baseline model has just one hidden layer with the ReLU activation function. From the accuracy plot (Figure 5), it is evident that deep-learning models performed better than any other machine learning model coded using the scikit-learn library using the same feature set. These models included the multilayer perceptron (MLP), a feedforward artificial neural network model that was used to determine the classification accuracy. Other ML models such as random forest, k-nearest neighbors, decision tree, and support vector machines were also implemented. Although deep-learning models and MLP performed exceptionally well, other machine learning models also had very high accuracies (Classification accuracies of scikit-learn ML models are slightly different from Table 3 because those results were obtained using the Orange data mining software, generally with default settings and using the “leave-one-out” method).

4. Discussion

At the range of pH values in patients who are administered pharmaceutical drugs, many drugs are small negatively charged organic molecules with molecular masses roughly in the range of 150 kDa to 1200 kDa [13,46]. Such molecules, which include not only drugs, but endogenous metabolites, nutrients, toxins, gut microbe products, and signaling molecules fall into a general category referred to as organic anions. In the case of drugs, after entering the bloodstream, the organic anions, which are often protein (albumin)-bound, are eventually taken up through “uptake SLC transporters” into various organs [7].
From the perspective of “drug ADME” (absorption, distribution, metabolism, and excretion), the most important organs for metabolism and excretion are the liver and kidney [13,14,50]. In hepatocytes, the key drug uptake transporters are generally held to be the multi-specific transporters known as organic anion transporter polypeptides, or OATPs (OATP1B1 or SLCO1B1; OATP1B3 or SLCO1B3), while in the kidney, the relevant multi-specific transporters are the organic anion transporters, or OATs (OAT1 or SLC22A6; OAT3 or SLC22A8). These are four of the original “FDA seven transporters”; because of their pharmacokinetic importance, new drug entities must be evaluated for transport by these transporters [16]. Apart from the large amount of in vitro transport and binding data for these transporters, there is a considerable amount of data from knockout mice supporting in vivo roles in drug, toxin, and metabolite handling [51,52,53,54,55,56,57,58,59,60,61,62,63,64].
Because OATP1B1 and OATP1B3 are highly expressed in the liver but not the kidney, and OAT1 and OAT3 are found to be highly expressed in the kidney but minimally if at all in the liver and because OATPs are thought to account for most liver uptake of organic anion drugs and likewise with OATs in the kidney, it is reasonable to roughly approximate hepatic organic anion drug uptake by considering liver OATPs together and likewise by considering the main renal OATs together. As described elsewhere in this article, we recognize that there are other transporters of organic anions in the liver and kidney, but the evidence in the literature strongly supports the “operational view” that the SLC transporters we have considered to be liver OATPs and kidney OATs make a very substantial contribution to hepatic and renal uptake of small-molecule drugs that are organic anions.
Chemoinformatic analysis of molecular properties of small organic molecules, together with ML/deep-learning methods, have been shown to be effective in distinguishing preferences for one or another multi-specific drug transporter [43,46]. Applying a similar approach to liver/OATP-transported drugs versus kidney/OAT-transported drugs can yield a deeper understanding of molecular properties important for hepatic versus renal uptake. More importantly, these molecular properties can be useful for understanding pharmacokinetics of drugs and drug combinations and for physiologically based pharmacokinetic (PBPK) modeling [14]. Engineering or optimizing molecular properties of drugs that prefer hepatic OATP uptake over renal OAT uptake also provides a basis for tissue targeting to the liver versus the kidney. In the setting of moderate or severe liver or kidney disease, such an understanding could be critical for optimizing drug treatment, especially when multiple options are available. For example, antivirals that are used for HIV treatment, or have been considered to be treatment for COVID-19, include both those with primary (or initial) OAT-mediated renal uptake or OATP-mediated hepatic uptake [65]. In both viral diseases, setting of organ failure is not uncommon. For instance, patients with HIV or COVID-19 frequently have some degree of kidney disease. Assuming a choice of equally effective antivirals transported by liver OATPs vs kidney OATs, a clinician may consider the use of the liver OATP-transported drug in the setting of chronic kidney disease.
By analyzing individual molecular properties using data visualization techniques (e.g., distributions, boxplots), as well as statistical and information-based approaches to evaluate feature importance (e.g., bootstrap forest predictor screening, information gain), we narrowed down >30 molecular properties of drugs to eight properties. These eight molecular properties (features): PSA/Area, molLogP, Complexity, nof_Rings, nof_OH, nof_COOH, nof_Fragments, and nof_RotB were sufficient to achieve 75% to 99% accuracy for classifying drugs preferring “liver OATPs” versus “kidney OATs” using machine learning (e.g., random forest, logistic regression, decision tree) and deep-learning algorithms. Although it is often difficult to evaluate which features are most important in a classification method (e.g., k-nearest neighbors) and while the relative importance of individual features varies from method to method, and while it is particularly difficult to assess the importance of feature combinations in classification, we can make some general points after considering the features from the several viewpoints described in the Results.
In general, liver OATPs prefer compounds with higher molLogP (more hydrophobicity), a larger number of ringed structures, and greater Complexity. In contrast, OATs prefer to interact with more polar drugs (higher PSA/Area) and drugs with more carboxyl groups. These points are illustrated in the FreeViz optimization (Figure 2) and decision tree (Figure 4). The relative importance of other features (i.e., number of OH groups, number of fragments, number of rotatable bonds) can also be appreciated (Figure 1, Figure 2 and Figure 3, Table 2). It is worth emphasizing that while OAT1-interacting drugs were reasonably well separated from OATP-interacting drugs by many univariate analyses of individual molecular properties, OAT3-interacting drugs sometimes overlapped slightly with OATP-interacting drugs owing to their higher hydrophobicity, greater number of ringed structures, and higher Complexity. This may explain why, in our initial attempts at classification, OAT3-interacting drugs were sometimes misclassified as OATPs in confusion matrices. As classification accuracies improved with feature set refinement and, to some extent, algorithm parameters, such that accuracies of 85% to >95% were obtained, the number of misclassified drugs became so small that it was difficult to assess whether OAT3 drugs were more commonly misclassified as OATP drugs.
Because many frequently prescribed drugs such as antibiotics, NSAIDs, antivirals, statins used for hypercholesterolemia, a variety of antihypertensive drugs, and chemotherapeutic agents are taken up through either the liver OATPs or the kidney OATs, the results of our studies are useful for understanding and predicting potential DDI. It is important to consider such DDI at the level of individual transporters i.e., OATP1B1 (SLCO1B1), OATP1B3 (SLCO1B3), OAT1 (SLC22A6), and OAT3 (SLC22A8) and at the level of sets of transporters. Especially when potentially highly toxic chemotherapeutic agents are involved, it is worth considering what other drugs the patient has been prescribed that use the same transporter or set of transporters. For example, for mild to moderate hypertension there are many therapeutic options. The patient can also be advised about over-the-counter medications, such as analgesics that may compete for binding to the transporter. Using chemoinformatic analyses together with ML/deep learning, we present a formal basis, grounded in a set of molecular and physiochemical properties of the drugs themselves, for approaching these issues.
Drug–metabolite interactions are an area of considerable clinical concern. OATs and OATPs are now known to play pivotal roles in regulating in vivo metabolism and other aspects of systemic physiology through their transport of metabolites (e.g., TCA cycle intermediates), signaling molecules (e.g., cyclic nucleotides, prostaglandins, short-chain fatty acids), hormones (e.g., thyroxine), vitamins (e.g., pantothenic acid), and gut microbiome products (e.g., tryptophan metabolites, secondary bile acids) [29,33,43,61,62,64,66,67]. Drugs can compete for transport of these metabolites, raising the possibility of metabolic derangements due to drug–metabolite interactions [14]. This is an area of concern in, for example, drug treatment during pregnancy [68,69].
It is also a major concern in disease states where metabolism is already perturbed, and elimination of drugs and metabolites compromised. For example, the uremic solutes and uremic toxins in chronic kidney disease, where many gut microbe-derived products act as uremic toxins or precursors to uremic toxins that are associated with cell and tissue dysfunction and damage [30,36,70]. Many of these appear to be primarily OAT substrates in vivo and depend on proper renal tubular function for elimination [64]. In this regard, it is worth noting that a chemoinformatics-machine learning approach has been used to classify OAT1 versus OAT3 metabolites that are uniquely elevated in OAT1 and OAT3 knockout mice [43].
Our study is limited by the fact that we used FDA-approved drugs. These drugs have, of course, made it through animal and human testing and are often administered in pill form. Thus, there is a bias both toward drugs that passed safety criteria and made it to market and those which are reasonably well absorbed through the gastrointestinal tract. However, these are also largely the drugs that have been carefully analyzed in in vitro transport assays. In the future, it would be important to use a larger, unbiased (or less biased) set of organic anion molecules that includes not only drugs but also metabolites, natural products, and toxins—assuming there are sufficient numbers that have been carefully studied for transport by OATs and OATPs. Furthermore, while these drugs appear to act as organic anions under conditions of in vitro assays, in some cases their charge could be different in vivo—especially when pH varies. However, we note that the eight molecular properties we used are, for the most part, independent of charge.
Although a sufficient number of OATP1B1 and OATP1B3 endogenous metabolites have not been established in vivo (e.g., through more comprehensive metabolomics analysis of OATP1B1 and OATP1B3 knockout mice), it should eventually be possible to use the strategy we have employed here, based on molecular properties of the small molecules themselves, to formally predict likely drug–metabolite interactions (DMI). Such predictions can then be used to plan studies to assess DMI in normal humans and patients with diseases such as CKD, liver disease, metabolic syndrome, and diabetes. Combined chemoinformatics-machine learning approaches should also prove useful for repositioning drugs with existing indications for new indications [71,72]. The types of methods employed here will be an essential step toward more rational treatment with drugs or drug combinations and for decreasing the chance of metabolic imbalances or worsening of metabolic diseases.

Supplementary Materials

The following are available online at https://www.mdpi.com/article/10.3390/pharmaceutics13101720/s1, Table S1: List of drugs and their transporters, Table S2: Articles from which Ki data is obtained, Table S3: List of > 30 molecular features used and their description, Figure S1: Correlation Heatmap: Graphical representation of correlation matrix representing correlation between different features, Figure S2: Heat map of selected nodes corresponding to the decision tree (Figure 4), Figure S3: Diagram of a neural network corresponding to Figure 5.

Author Contributions

Investigation, A.K.N. and A.A.O., Formal Analysis, A.K.N., A.A.O., J.G.L., K.B.N., D.S. and S.K.N., Writing—Original Draft, S.K.N., R.A., A.K.N. and V.B., Writing—Review and Editing, S.K.N., R.A., V.B., A.K.N., D.S., A.A.O., J.G.L. and K.B.N. Conceptualization, S.K.N., Resources, S.K.N., Funding Acquisition, S.K.N. All authors have read and agreed to the published version of the manuscript.

Funding

This work is supported by a National Institutes of Health (NIH) Grant from National Institute of General Medical Sciences (NIGMS) R01GM132938 (to S.K.N.) and R35GM131881 (to R.A.).

Institutional Review Board Statement

Not applicable.

Informed Consent Statement

Not applicable.

Data Availability Statement

Acknowledgments

This article is dedicated to the memory of Vibha Bhatnagar, M.D.

Conflicts of Interest

R.A. is a founder of Molsoft LLC. The terms of this arrangement have been reviewed and approved by the University of California, San Diego, in accordance with its conflict of interest policies.

References

  1. Riedmaier, A.E.; Nies, A.T.; Schaeffeler, E.; Schwab, M. Organic anion transporters and their implications in pharmacotherapy. Pharmacol. Rev. 2012, 64, 421–449. [Google Scholar] [CrossRef] [PubMed] [Green Version]
  2. Nigam, S.K. The SLC22 transporter family: A paradigm for the impact of drug transporters on metabolic pathways, signaling, and disease. Annu. Rev. Pharmacol. Toxicol. 2018, 58, 663–687. [Google Scholar] [CrossRef]
  3. Hagenbuch, B.; Stieger, B. The SLCO (former SLC21) superfamily of transporters. Mol. Asp. Med. 2013, 34, 396–412. [Google Scholar] [CrossRef] [Green Version]
  4. Ahn, S.Y.; Bhatnagar, V. Update on the molecular physiology of organic anion transporters. Curr. Opin. Nephrol. Hypertens. 2008, 17, 499–505. [Google Scholar] [CrossRef]
  5. Zhang, J.; Wang, H.; Fan, Y.; Yu, Z.; You, G. Regulation of organic anion transporters: Role in physiology, pathophysiology, and drug elimination. Pharmacol. Ther. 2021, 217, 107647. [Google Scholar] [CrossRef]
  6. Li, T.T.; An, J.X.; Xu, J.Y.; Tuo, B.G. Overview of organic anion transporters and organic anion transporter polypeptides and their roles in the liver. World J. Clin. Cases 2019, 7, 3915. [Google Scholar] [CrossRef]
  7. Nigam, S.K. What do drug transporters really do? Nat. Rev. Drug Discov. 2015, 14, 29–44. [Google Scholar] [CrossRef] [Green Version]
  8. Wolkoff, A.W. Organic anion uptake by hepatocytes. Compr. Physiol. 2014, 4, 1715. [Google Scholar] [PubMed] [Green Version]
  9. Mao, Q.; Lai, Y.; Wang, J. Drug transporters in xenobiotic disposition and pharmacokinetic prediction. Drug Metab. Dispos. 2018, 46, 561–566. [Google Scholar] [CrossRef] [Green Version]
  10. Almazroo, O.A.; Miah, M.K.; Venkataramanan, R. Drug metabolism in the liver. Clin. Liver Dis. 2017, 21, 1–20. [Google Scholar] [CrossRef] [PubMed]
  11. Nigam, S.K.; Wu, W.; Bush, K.T.; Hoenig, M.P.; Blantz, R.C.; Bhatnagar, V. Handling of drugs, metabolites, and uremic toxins by kidney proximal tubule drug transporters. Clin. J. Am. Soc. Nephrol. 2015, 10, 2039–2049. [Google Scholar] [CrossRef] [Green Version]
  12. Patel, M.; Taskar, K.S.; Zamek-Gliszczynski, M.J. Importance of hepatic transporters in clinical disposition of drugs and their metabolites. J. Clin. Pharmacol. 2016, 56, S23–S39. [Google Scholar] [CrossRef] [PubMed] [Green Version]
  13. Wink, M. Drug Transporters: Molecular Characterization and Role in Drug Disposition. By Guofeng You, Marilyn E. Morris (Eds.). Biotechnol. J. 2008, 3, 1097. [Google Scholar] [CrossRef]
  14. Nigam, S.K.; Bush, K.T.; Bhatnagar, V.; Poloyac, S.M.; Momper, J.D. The systems biology of drug metabolizing enzymes and transporters: Relevance to quantitative systems pharmacology. Clin. Pharmacol. Ther. 2020, 108, 40–53. [Google Scholar] [CrossRef] [PubMed]
  15. Ivanyuk, A.; Livio, F.; Biollaz, J.; Buclin, T. Renal drug transporters and drug interactions. Clin. Pharmacokinet. 2017, 56, 825–892. [Google Scholar] [CrossRef]
  16. Zhang, L.; Huang, S.M.; Lesko, L.J. Transporter-mediated drug–drug interactions. Clin. Pharmacol. Ther. 2011, 89, 481–484. [Google Scholar] [CrossRef]
  17. Alam, K.; Crowe, A.; Wang, X.; Zhang, P.; Ding, K.; Li, L.; Yue, W. Regulation of organic anion transporting polypeptides (OATP) 1B1-and OATP1B3-mediated transport: An updated review in the context of OATP-mediated drug-drug interactions. Int. J. Mol. Sci. 2018, 19, 855. [Google Scholar] [CrossRef] [Green Version]
  18. Nishimura, M.; Naito, S. Tissue-specific mRNA expression profiles of human ATP-binding cassette and solute carrier transporter superfamilies. Drug Metab. Pharmacokinet. 2005, 20, 452–477. [Google Scholar] [CrossRef]
  19. Engelhart, D.C.; Granados, J.C.; Shi, D.; Saier, M.H., Jr.; Baker, M.E.; Abagyan, R.; Nigam, S.K. Systems biology analysis reveals eight SLC22 transporter subgroups, including OATs, OCTs, and OCTNs. Int. J. Mol. Sci. 2020, 21, 1791. [Google Scholar] [CrossRef] [Green Version]
  20. Ahn, S.Y.; Nigam, S.K. Toward a systems level understanding of organic anion and other multispecific drug transporters: A remote sensing and signaling hypothesis. Mol. Pharmacol. 2009, 76, 481–490. [Google Scholar] [CrossRef] [Green Version]
  21. Martinez, D.; Muhrez, K.; Woillard, J.B.; Berthelot, A.; Gyan, E.; Choquet, S.; Andrès, C.R.; Marquet, P.; Barin-Le Guellec, C. Endogenous metabolites-mediated communication between OAT1/OAT3 and OATP1B1 may explain the association between SLCO1B1 SNPs and methotrexate toxicity. Clin. Pharmacol. Ther. 2018, 104, 687–698. [Google Scholar] [CrossRef]
  22. Eraly, S.A.; Vallon, V.; Vaughn, D.A.; Gangoiti, J.A.; Richter, K.; Nagle, M.; Monte, J.C.; Rieg, T.; Truong, D.M.; Long, J.M.; et al. Decreased renal organic anion secretion and plasma accumulation of endogenous organic anions in OAT1 knock-out mice. J. Biol. Chem. 2006, 281, 5072–5083. [Google Scholar] [CrossRef] [Green Version]
  23. Pavlova, A.; Sakurai, H.; Leclercq, B.; Beier, D.R.; Yu, A.S.; Nigam, S.K. Developmentally regulated expression of organic ion transporters NKT (OAT1), OCT1, NLT (OAT2), and Roct. Am. J. Physiol. Ren. Physiol. 2000, 278, F635–F643. [Google Scholar] [CrossRef]
  24. Keppler, D. The roles of MRP2, MRP3, OATP1B1, and OATP1B3 in conjugated hyperbilirubinemia. Drug Metab. Dispos. 2014, 42, 561–565. [Google Scholar] [CrossRef] [PubMed] [Green Version]
  25. Eraly, S.A.; Vallon, V.; Rieg, T.; Gangoiti, J.A.; Wikoff, W.R.; Siuzdak, G.; Barshop, B.A.; Nigam, S.K. Multiple organic anion transporters contribute to net renal excretion of uric acid. Physiol. Genom. 2008, 33, 180–192. [Google Scholar] [CrossRef] [PubMed] [Green Version]
  26. Vallon, V.; Eraly, S.A.; Rao, S.R.; Gerasimova, M.; Rose, M.; Nagle, M.; Anzai, N.; Smith, T.; Sharma, K.; Nigam, S.K.; et al. A role for the organic anion transporter OAT3 in renal creatinine secretion in mice. Am. J. Physiol. Ren. Physiol. 2012, 302, F1293–F1299. [Google Scholar] [CrossRef] [PubMed]
  27. Saito, H. Pathophysiological regulation of renal SLC22A organic ion transporters in acute kidney injury: Pharmacological and toxicological implications. Pharmacol. Ther. 2010, 125, 79–91. [Google Scholar] [CrossRef] [Green Version]
  28. Vallon, V.; Eraly, S.A.; Wikoff, W.R.; Rieg, T.; Kaler, G.; Truong, D.M.; Ahn, S.Y.; Mahapatra, N.R.; Mahata, S.K.; Gangoiti, J.A.; et al. Organic anion transporter 3 contributes to the regulation of blood pressure. J. Am. Soc. Nephrol. 2008, 19, 1732–1740. [Google Scholar] [CrossRef] [Green Version]
  29. Lepist, E.I.; Ray, A.S. Beyond drug-drug interactions: Effects of transporter inhibition on endobiotics, nutrients and toxins. Expert Opin. Drug Metab. Toxicol. 2017, 13, 1075–1087. [Google Scholar] [CrossRef]
  30. Wu, W.; Bush, K.T.; Nigam, S.K. Key role for the organic anion transporters, OAT1 and OAT3, in the in vivo handling of uremic toxins and solutes. Sci. Rep. 2017, 7, 4939. [Google Scholar] [CrossRef] [Green Version]
  31. Bhatnagar, V.; Richard, E.L.; Wu, W.; Nievergelt, C.M.; Lipkowitz, M.S.; Jeff, J.; Maihofer, A.X.; Nigam, S.K. Analysis of ABCG2 and other urate transporters in uric acid homeostasis in chronic kidney disease: Potential role of remote sensing and signaling. Clin. Kidney J. 2016, 9, 444–453. [Google Scholar] [CrossRef] [Green Version]
  32. Henjakovic, M.; Hagos, Y.; Krick, W.; Burckhardt, G.; Burckhardt, B.C. Human organic anion transporter 2 is distinct from organic anion transporters 1 and 3 with respect to transport function. Am. J. Physiol. Ren. Physiol. 2015, 309, F843–F851. [Google Scholar] [CrossRef] [PubMed] [Green Version]
  33. Bush, K.T.; Wu, W.; Lun, C.; Nigam, S.K. The drug transporter OAT3 (SLC22A8) and endogenous metabolite communication via the gut–liver–kidney axis. J. Biol. Chem. 2017, 292, 15789–15803. [Google Scholar] [CrossRef] [PubMed] [Green Version]
  34. Yin, J.; Sun, W.; Li, F.; Hong, J.; Li, X.; Zhou, Y.; Lu, Y.; Liu, M.; Zhang, X.; Chen, N.; et al. VARIDT 1.0: Variability of drug transporter database. Nucleic Acids Res. 2020, 48, D1042–D1050. [Google Scholar] [CrossRef] [PubMed]
  35. Morrissey, K.M.; Wen, C.C.; Johns, S.J.; Zhang, L.; Huang, S.M.; Giacomini, K.M. The UCSF-FDA TransPortal: A public drug transporter database. Clin. Pharmacol. Ther. 2012, 92, 545–546. [Google Scholar] [CrossRef] [PubMed] [Green Version]
  36. Nigam, S.K.; Bush, K.T. Uraemic syndrome of chronic kidney disease: Altered remote sensing and signalling. Nat. Rev. Nephrol. 2019, 15, 301–316. [Google Scholar] [CrossRef]
  37. Brandoni, A.; Hazelhoff, M.H.; Bulacio, R.P.; Torres, A.M. Expression and function of renal and hepatic organic anion transporters in extrahepatic cholestasis. World J. Gastroenterol. WJG 2012, 18, 6387. [Google Scholar] [CrossRef]
  38. Türková, A.; Zdrazil, B. Current advances in studying clinically relevant transporters of the solute carrier (SLC) family by connecting computational modeling and data science. Comput. Struct. Biotechnol. J. 2019, 17, 390–405. [Google Scholar] [CrossRef]
  39. Kaler, G.; Truong, D.M.; Khandelwal, A.; Nagle, M.; Eraly, S.A.; Swaan, P.W.; Nigam, S.K. Structural variation governs substrate specificity for organic anion transporter (OAT) homologs: Potential remote sensing by OAT family members. J. Biol. Chem. 2007, 282, 23841–23853. [Google Scholar] [CrossRef] [Green Version]
  40. Schlessinger, A.; Welch, M.A.; van Vlijmen, H.; Korzekwa, K.; Swaan, P.W.; Matsson, P. Molecular modeling of drug–Transporter interactions—An International Transporter Consortium perspective. Clin. Pharmacol. Ther. 2018, 104, 818–835. [Google Scholar] [CrossRef]
  41. Kouznetsova, V.L.; Tsigelny, I.F.; Nagle, M.A.; Nigam, S.K. Elucidation of common pharmacophores from analysis of targeted metabolites transported by the multispecific drug transporter—Organic anion transporter1 (Oat1). Bioorg. Med. Chem. 2011, 19, 3320–3340. [Google Scholar] [CrossRef] [Green Version]
  42. Matsson, P.; Bergström, C.A. Computational modeling to predict the functions and impact of drug transporters. In Silico Pharmacol. 2015, 3, 1–8. [Google Scholar] [CrossRef] [PubMed] [Green Version]
  43. Nigam, A.K.; Li, J.G.; Lall, K.; Shi, D.; Bush, K.T.; Bhatnagar, V.; Abagyan, R.; Nigam, S.K. Unique metabolite preferences of the drug transporters OAT1 and OAT3 analyzed by machine learning. J. Biol. Chem. 2020, 295, 1829–1842. [Google Scholar] [CrossRef]
  44. Truong, D.M.; Kaler, G.; Khandelwal, A.; Swaan, P.W.; Nigam, S.K. Multi-level analysis of organic anion transporters 1, 3, and 6 reveals major differences in structural determinants of antiviral discrimination. J. Biol. Chem. 2008, 283, 8654–8663. [Google Scholar] [CrossRef] [Green Version]
  45. Karlgren, M.; Ahlin, G.; Bergström, C.A.; Svensson, R.; Palm, J.; Artursson, P. In vitro and in silico strategies to identify OATP1B1 inhibitors and predict clinical drug–drug interactions. Pharm. Res. 2012, 29, 411–426. [Google Scholar] [CrossRef] [Green Version]
  46. Liu, H.C.; Goldenberg, A.; Chen, Y.; Lun, C.; Wu, W.; Bush, K.T.; Balac, N.; Rodriguez, P.; Abagyan, R.; Nigam, S.K. Molecular properties of drugs interacting with SLC22 transporters OAT1, OAT3, OCT1, and OCT2: A machine-learning approach. J. Pharmacol. Exp. Ther. 2016, 359, 215–229. [Google Scholar] [CrossRef] [Green Version]
  47. Demšar, J.; Curk, T.; Erjavec, A.; Gorup, Č.; Hočevar, T.; Milutinovič, M.; Možina, M.; Polajnar, M.; Toplak, M.; Starič, A.; et al. Orange: Data mining toolbox in Python. J. Mach. Learn. Res. 2013, 14, 2349–2353. [Google Scholar]
  48. Demšar, J.; Leban, G.; Zupan, B. FreeViz—An intelligent multivariate visualization approach to explorative analysis of biomedical data. J. Biomed. Inform. 2007, 40, 661–671. [Google Scholar] [CrossRef] [PubMed] [Green Version]
  49. Pedregosa, F.; Varoquaux, G.; Gramfort, A.; Michel, V.; Thirion, B.; Grisel, O.; Blondel, M.; Prettenhofer, P.; Weiss, R.; Dubourg, V.; et al. Scikit-learn: Machine learning in Python. J. Mach. Learn. Res. 2011, 12, 2825–2830. [Google Scholar]
  50. Rosenthal, S.B.; Bush, K.T.; Nigam, S.K. A network of SLC and ABC transporter and DME genes involved in remote sensing and signaling in the gut-liver-kidney axis. Sci. Rep. 2019, 9, 11879. [Google Scholar] [CrossRef] [PubMed] [Green Version]
  51. Zimmerman, E.I.; Hu, S.; Roberts, J.L.; Gibson, A.A.; Orwick, S.J.; Li, L.; Sparreboom, A.; Baker, S.D. Contribution of OATP1B1 and OATP1B3 to the disposition of sorafenib and sorafenib-glucuronide. Clin. Cancer Res. 2013, 19, 1458–1466. [Google Scholar] [CrossRef] [Green Version]
  52. Lee, H.H.; Leake, B.F.; Kim, R.B.; Ho, R.H. Contribution of organic anion-transporting polypeptides 1A/1B to doxorubicin uptake and clearance. Mol. Pharmacol. 2017, 91, 14–24. [Google Scholar] [CrossRef] [Green Version]
  53. Ma, X.; Shang, X.; Qin, X.; Lu, J.; Liu, M.; Wang, X. Characterization of organic anion transporting polypeptide 1b2 knockout rats generated by CRISPR/Cas9: A novel model for drug transport and hyperbilirubinemia disease. Acta Pharm. Sin. B 2020, 10, 850–860. [Google Scholar] [CrossRef]
  54. Wu, W.; Jamshidi, N.; Eraly, S.A.; Liu, H.C.; Bush, K.T.; Palsson, B.O.; Nigam, S.K. Multispecific drug transporter Slc22a8 (Oat3) regulates multiple metabolic and signaling pathways. Drug Metab. Dispos. 2013, 41, 1825–1834. [Google Scholar] [CrossRef] [Green Version]
  55. Durmus, S.; van Hoppe, S.; Schinkel, A.H. The impact of organic anion-transporting polypeptides (OATPs) on disposition and toxicity of antitumor drugs: Insights from knockout and humanized mice. Drug Resist. Updat. 2016, 27, 72–88. [Google Scholar] [CrossRef]
  56. Nigam, S.K.; Bush, K.T.; Martovetsky, G.; Ahn, S.Y.; Liu, H.C.; Richard, E.; Bhatnagar, V.; Wu, W. The organic anion transporter (OAT) family: A systems biology perspective. Physiol. Rev. 2015, 95, 83–123. [Google Scholar] [CrossRef]
  57. Torres, A.M.; Dnyanmote, A.V.; Bush, K.T.; Wu, W.; Nigam, S.K. Deletion of multispecific organic anion transporter Oat1/Slc22a6 protects against mercury-induced kidney injury. J. Biol. Chem. 2011, 286, 26391–26395. [Google Scholar] [CrossRef] [Green Version]
  58. Vallon, V.; Rieg, T.; Ahn, S.Y.; Wu, W.; Eraly, S.A.; Nigam, S.K. Overlapping in vitro and in vivo specificities of the organic anion transporters OAT1 and OAT3 for loop and thiazide diuretics. Am. J. Physiol. Ren. Physiol. 2008, 294, F867–F873. [Google Scholar] [CrossRef] [PubMed] [Green Version]
  59. VanWert, A.L.; Bailey, R.M.; Sweet, D.H. Organic anion transporter 3 (Oat3/Slc22a8) knockout mice exhibit altered clearance and distribution of penicillin G. Am. J. Physiol. Ren. Physiol. 2007, 293, F1332–F1341. [Google Scholar] [CrossRef] [PubMed] [Green Version]
  60. VanWert, A.L.; Srimaroeng, C.; Sweet, D.H. Organic anion transporter 3 (oat3/slc22a8) interacts with carboxyfluoroquinolones, and deletion increases systemic exposure to ciprofloxacin. Mol. Pharmacol. 2008, 74, 122–131. [Google Scholar] [CrossRef] [PubMed] [Green Version]
  61. Ahn, S.Y.; Jamshidi, N.; Mo, M.L.; Wu, W.; Eraly, S.A.; Dnyanmote, A.; Bush, K.T.; Gallegos, T.F.; Sweet, D.H.; Palsson, B.Ø.; et al. Linkage of organic anion transporter-1 to metabolic pathways through integrated “omics”-driven network and functional analysis. J. Biol. Chem. 2011, 286, 31522–31531. [Google Scholar] [CrossRef] [Green Version]
  62. Liu, H.C.; Jamshidi, N.; Chen, Y.; Eraly, S.A.; Cho, S.Y.; Bhatnagar, V.; Wu, W.; Bush, K.T.; Abagyan, R.; Palsson, B.O.; et al. An organic anion transporter 1 (OAT1)-centered metabolic network. J. Biol. Chem. 2016, 291, 19474–19486. [Google Scholar] [CrossRef] [Green Version]
  63. Sweet, D.H.; Miller, D.S.; Pritchard, J.B.; Fujiwara, Y.; Beier, D.R.; Nigam, S.K. Impaired organic anion transport in kidney and choroid plexus of organic anion transporter 3 (Oat3 (Slc22a8)) knockout mice. J. Biol. Chem. 2002, 277, 26934–26943. [Google Scholar] [CrossRef] [Green Version]
  64. Wikoff, W.R.; Nagle, M.A.; Kouznetsova, V.L.; Tsigelny, I.F.; Nigam, S.K. Untargeted metabolomics identifies enterobiome metabolites and putative uremic toxins as substrates of organic anion transporter 1 (Oat1). J. Proteome Res. 2011, 10, 2842–2851. [Google Scholar] [CrossRef] [Green Version]
  65. Rocha, Y.M.; de Moura, G.A.; de Oliveira, J.R.; Nicolete, L.D.; Nicolete, R. Potential repurposing of drugs with anti-SARS-CoV-2 activity in preclinical trials: A systematic review. Curr. Med. Chem. 2021, 28, 4577–4585. [Google Scholar] [CrossRef]
  66. Granados, J.C.; Richelle, A.; Gutierrez, J.M.; Zhang, P.; Zhang, X.; Bhatnagar, V.; Lewis, N.E.; Nigam, S.K. Coordinate regulation of systemic and kidney tryptophan metabolism by the drug transporters OAT1 and OAT3. J. Biol. Chem. 2021, 296, 10575. [Google Scholar] [CrossRef]
  67. Granados, J.C.; Nigam, A.K.; Bush, K.T.; Jamshidi, N.; Nigam, S.K. A key role for the transporter OAT1 in systemic lipid metabolism. J. Biol. Chem. 2021, 296, 100603. [Google Scholar] [CrossRef] [PubMed]
  68. Pariente, G.; Leibson, T.; Carls, A.; Adams-Webber, T.; Ito, S.; Koren, G. Pregnancy-associated changes in pharmacokinetics: A systematic review. PLoS Med. 2016, 13, e1002160. [Google Scholar] [CrossRef]
  69. Boussios, S.; Pavlidis, N. Renal cell carcinoma in pregnancy: A rare coexistence. Clin. Transl. Oncol. 2014, 16, 122–127. [Google Scholar] [CrossRef]
  70. Bush, K.T.; Singh, P.; Nigam, S.K. Gut-derived uremic toxin handling in vivo requires OAT-mediated tubular secretion in chronic kidney disease. JCI Insight 2020, 5, e133817. [Google Scholar] [CrossRef] [PubMed] [Green Version]
  71. Jarada, T.N.; Jon, G.R.; Reda, A. A review of computational drug repositioning: Strategies, approaches, opportunities, challenges, and directions. J. Cheminform. 2020, 12, 1–23. [Google Scholar] [CrossRef] [PubMed]
  72. Urpilainen, E.; Puistola, U.; Boussios, S.; Karihtala, P. Metformin and ovarian cancer: The evidence. Ann. Transl. Med. 2020, 8, 1711. [Google Scholar] [CrossRef] [PubMed]
Figure 4. Decision tree used to classify drug interaction with liver OATPs vs kidney OATs based on chosen features. An example of one of the several decision trees generated is shown above. A few of the terminal nodes were examined to determine whether these pure or almost pure nodes contained chemically similar pharmaceuticals as measured by Tanimoto similarity (Supplementary Materials Figure S2).
Pharmaceutics 13 01720 g004
Figure 5. Bar plot representing the cross-validation classification accuracies for different deep learning and machine learning models. Description of each model and its associated property are mentioned in Table 4.
Pharmaceutics 13 01720 g005
Table 1. Final set of eight features chosen for machine learning analysis.
FeatureDescription
nof_OHNumber of hydroxyl (OH) groups in the molecule
nof_FragmentsPossible number of molecular fragments in the molecule
molLogPLog of lipophilicity (P) of the molecule
nof_RotBNumber of rotatable bonds in the molecule
nof_RingsNumber of rings in the molecule
nof_COOHNumber of carboxyl (COOH) groups in the molecule
ComplexityMolecular complexity
PSA/AreaPolar Surface Area (PSA)/Molecular Area of the molecule
Table 3. Table showing the success of different algorithms based on classification accuracy and other metrics. Table above indicates several classification metrics relating to logistic regression, decision tree, random forest, naïve bayes, k-nearest neighbors, the “out of the box” neural network in Orange. These results are reflective of many runs, which generally give a classification accuracy of about 75–99%. Please note that both the classification accuracy and the area under the (ROC) curve are high for nearly all methods. Misclassifications in the confusion matrices were generally low.
ClassificationAccuracyAUCF1 ScorePrecisionRecall
Simple Neural Network0.9540.9960.9540.9550.954
Logistic Regression0.9880.9840.9880.9890.988
Random Forest0.8850.9640.8850.8850.885
Naïve Bayes0.9080.9490.9080.9090.908
K-Nearest Neighbors0.7590.8330.7580.7600.759
Decision Tree0.8510.8470.8510.8510.851
Table 4. Deep learning and machine learning models with their properties.
ModelProperties
Deep-Learning “Complex” Modelhidden layers: 3, activation functions: ReLU & sigmoid
Deep-Learning “Baseline” Modelhidden layers: 1, activation function: ReLU
Deep-Learning “Large” Modelhidden layers: 2, activation functions: ReLU & sigmoid
k-Nearest Neighborsnearest neighbors: 3
Support Vector Machinekernel: radial basis function
Multilayer Perceptronhidden layers: 1
Random Forestestimators: 20
Decision Treemaximum depth: 4
Publisher’s Note: MDPI stays neutral with regard to jurisdictional claims in published maps and institutional affiliations.

