Role of OATP1B1 and OATP1B3 in Drug-Drug Interactions Mediated by Tyrosine Kinase Inhibitors

 , ,
, ,
Abstract
:1. Introduction
2. Tyrosine Kinase Inhibitors (TKIs)
3. Organic Anion Transporting Polypeptides (OATPs)
4. Regulatory Guidance Documents
- -
- Both the FDA and EMA documents suggest that the sponsor should conduct in vitro studies to evaluate whether an investigational drug is an inhibitor of OATP1B1 and/or OATP1B3.
- -
- Both documents recommend using an appropriate, predictive in vitro models, such as human hepatocytes or mammalian cells engineered to overexpress transporters of interest (e.g., CHO, HEK293, MDCK) to explore potential transporter interactions.
- -
- Different concentrations of the investigational drug on the transport of a specific substrate should be investigated, such that at least 3 and 4 concentrations should be tested, according to EMA and FDA guidance documents, respectively, and values for the inhibition constant (Ki) should be obtained, with known inhibitors present as controls.
- -
- According to EMA, Ki values that are lower than a concentration representing 25-fold the unbound hepatic inlet concentration after oral administration warrant the conduct of an in vivo DDI study with the use of a prototypical probe substrate. The most recent FDA guidance, which aligns with the EMA, uses unbound concentrations of the investigational drug, not the total drug, for the calculation of R values with the formula R = 1 + ((fu,p × Iin,max)/ IC50) where fu,p is the unbound fraction in plasma, IC50 is the half-maximal inhibitory concentration and Iin, max is the estimated maximum plasma inhibitor concentration at the inlet to the liver. An R-value ≥ 1.1 suggests that the drug has the potential to inhibit OATP1B1 and/or OATP1B3 in vivo.
- -
- The 2017 version of the FDA guidance on in vitro assessment of DDIs requires a strategy employing a 30-min preincubation with the inhibitor before the addition of substrate. Although this design is recommended as it may lead to changes in the observed IC50 values, the latest version of the guidance does not specify an exact duration of the preincubation conditions.
- -
- The FDA guidance also mentions that the observed degree of inhibition by a particular agent can be dependent on the substrate used in the experiment, and therefore it has been suggested that substrates more likely to be used in clinical studies, or substrates that usually generate lower IC50 values for known inhibitors should be chosen in in vitro investigations to avoid underestimation of effects in vivo.
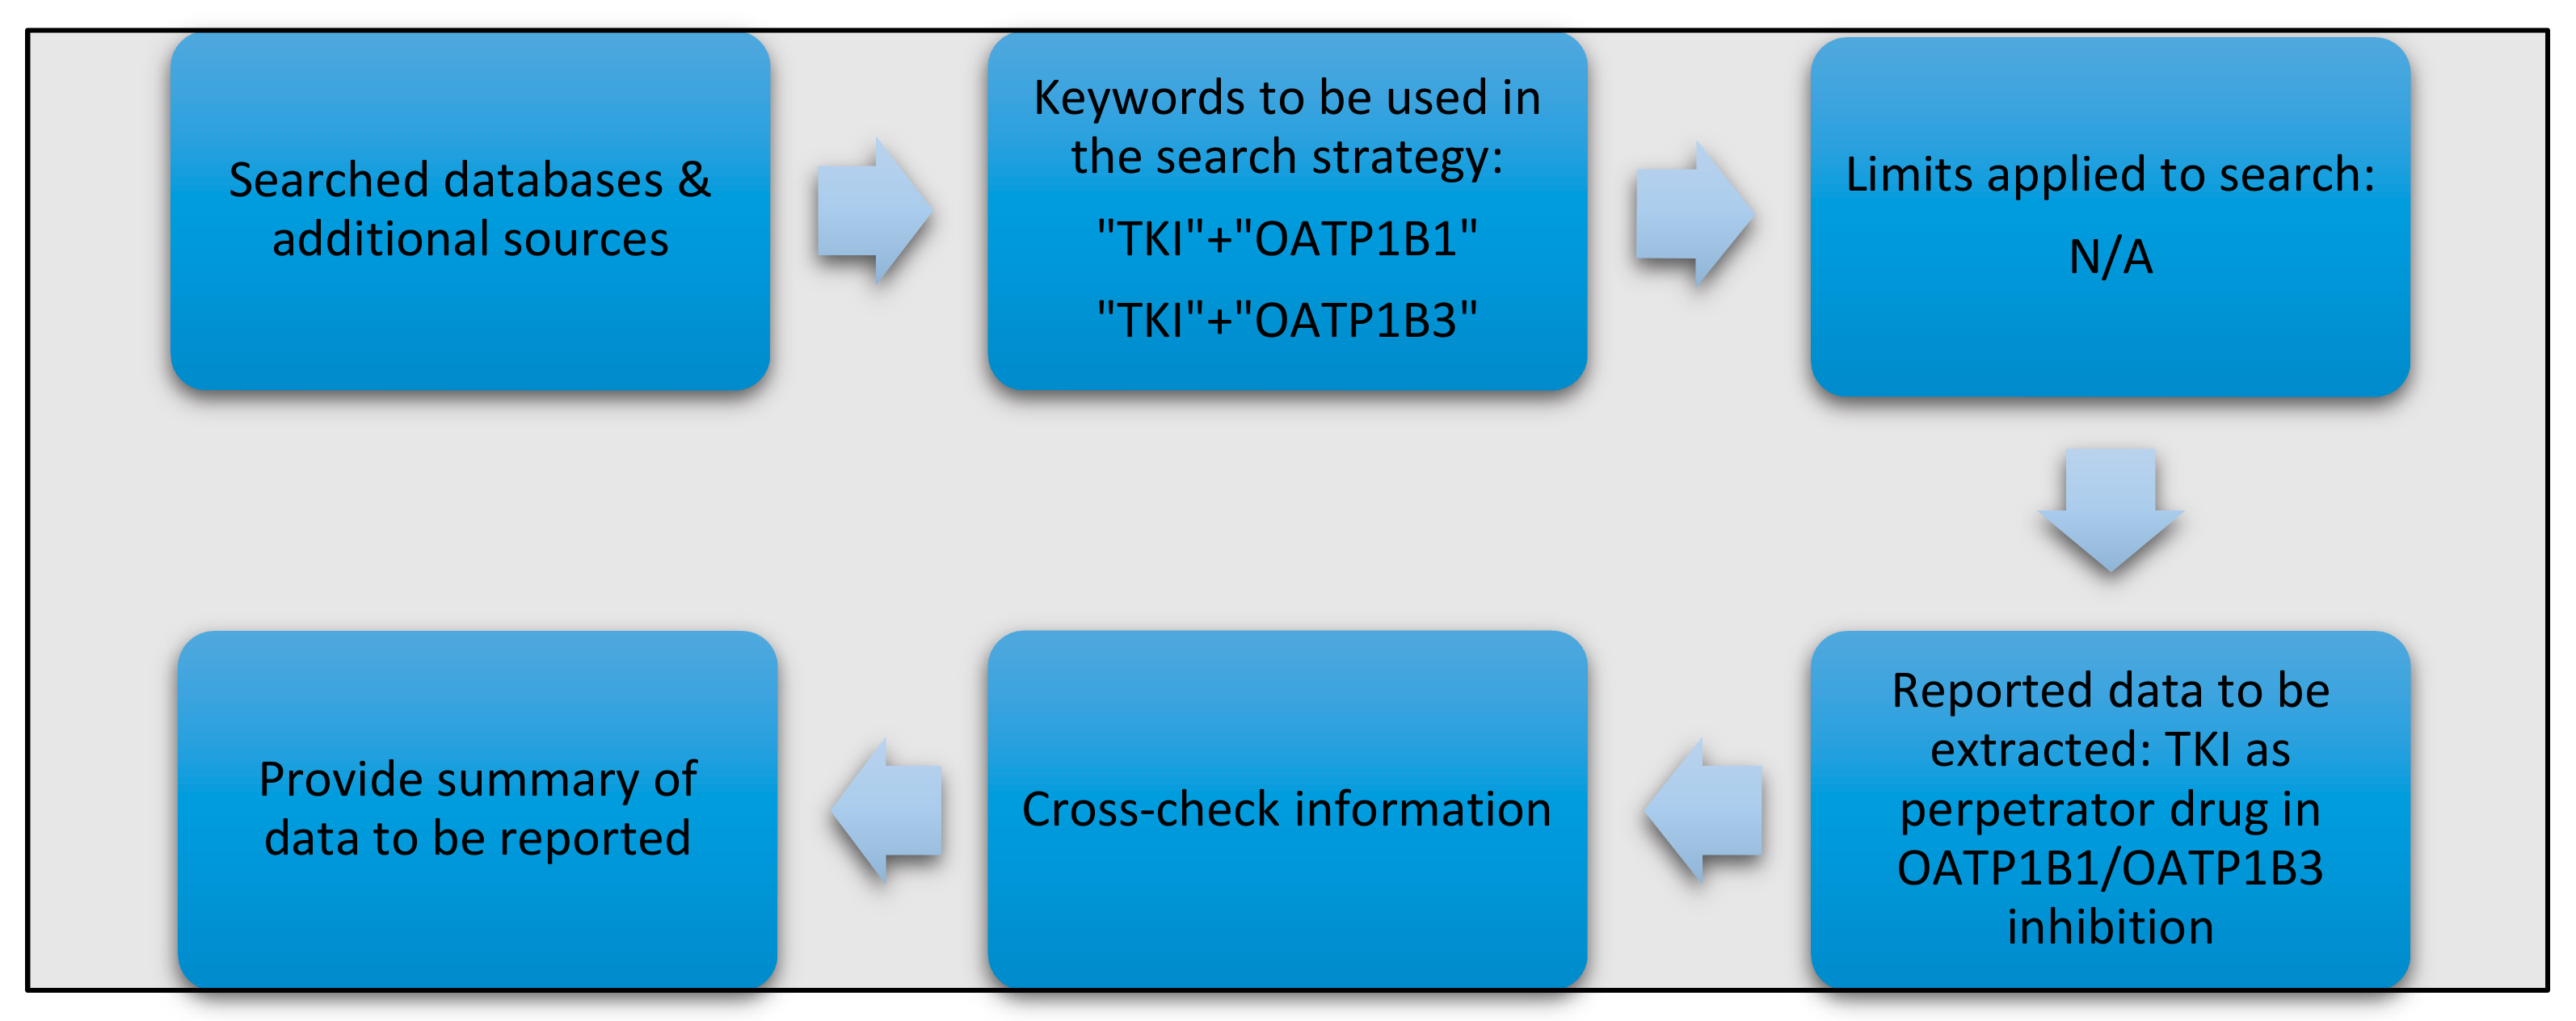
5. Identification and Retrieval of Relevant Data
6. Effects of TKIs on the Function of OATP1B1 and OATP1B3
6.1. Omissions
6.2. Discrepancies
- The PI and FDA guidance documents for baricitinib report the agent as an OATP1B3 inhibitor, whereas the EMA documents claim that it is not an inhibitor of this transporter. The existence of this discrepancy is not explained or discussed in any of the regulatory materials.
- For ceritinib, the PI and EMA state that based on in vitro data, the TKI is unlikely to inhibit OATP1B1 and OATP1B3 at clinically-relevant concentrations. However, the FDA guidance document for ceritinib reports that ceritinib inhibits OATP1B1 and OATP1B3 by 31.8% and 24.1%, respectively, and that because the R-value is <1.25, an in vivo study was considered unnecessary. However, the FDA guidance on DDI potential states that a drug has the potential to inhibit OATP1B1 or OATP1B3 in vivo if the R-value is >1.1
- The PI for crizotinib reports the TKI as not an inhibitor of OATP1B1 or OATP1B3, but the FDA guidance reports that crizotinib demonstrated a weak, concentration-dependent inhibitory effect on pravastatin, an OATP1B1 substrate, and rosuvastatin, an OATP1B3 substrate uptake, with IC50 values of 48 µM and 44 μM, respectively.
- The PI and FDA documents state that OATP1B1 and OATP1B3 are not inhibited by laroctrectinib, although the EMA materials state that there are inhibitory effects of laroctrectinib on OATP1B1 with an IC50 of 48 µM.
- For lenvatinib, the PI states that there is no potential to inhibit OATP1B1 in vivo, whereas in the FDA guidance it is concluded that lenvatinib inhibited OATP1B1 with an IC50 of 7.29 µM.
- The PI and FDA report that lorlatinib does not inhibit OATP1B1 and OATP1B3, while the EMA claims that this TKI has the potential to inhibit these transporters at clinically-relevant concentrations.
- For osimertinib, the PI and FDA information state that is no observed inhibition of OATP1B1 and OATP1B3, whereas the EMA claims that osimertinib inhibits transport by OATP1B1 and OATP1B3 albeit at concentrations that are unlikely to result in a clinically-significant DDI.
- -
- Inhibitor concentration: A large number of the published articles have relied on the use of a single concentration of TKI, although regulatory guidance documents specifically recommend the need to perform experiments with at least 3–4 different concentrations, in order to more rigorously evaluate potential inhibitory properties. This is exemplified by a recent study involving the TKIs afatinib, nintedanib, lenvatinib, and ceritinib in which diverse degrees of inhibition were observed depending on the concentration (up to 30 µM), and where some concentrations would even increase transport function [66]. As TKIs tend to get concentrated in the liver and can potentially increase intracellular levels that are much higher than concurrent levels in plasma [2], the selection of relevant concentration ranges to be used in in vitro uptake studies requires careful consideration.
- -
- Data reporting: Several studies have only reported results as percent inhibition relative to control, while more quantitative measures (IC50 or inhibition constant) might be more informative and offer increased predictive value. According to regulatory guidance documents, certain equations could be utilized to predict if the observed degree of inhibition has potential clinical relevance. However, such strategies are rarely implemented and reported studies often fail to include positive and negative control inhibitors into the experimental design, which is recommended in the regulatory guidance documents. These issues complicate the interpretation of data and can result in discrepant views on extrapolating from in vitro studies to the clinical situation, as reported for ruxolitinib or crizotinib, where experimental data would suggest statistically significant but not clinically relevant degrees of inhibition [67,68,69].
- -
- Substrate selection: Since substrate-dependent inhibition by xenobiotics, including TKIs, has been well documented and is acknowledged expressly in the FDA guidance document, the degree to which findings obtained with one particular substrate can be extrapolated to other conditions is uncertain, and potentially accounts for several reported inconsistencies. Substrate-dependent inhibition has been previously reported when comparing inhibitory properties in OATP1B1-overexpressed models comparing the substrates fluorescein (FL), 2′,7′-dichlorofluorescein (DCF), atorvastatin, SN-38, and valsartan, as well as in a recent study comparing E2G and 8Fc-A [66], where some TKIs such as lapatinib, pazopanib, and nintedanib show inhibitory effects with some but not all test substrates. The difference between the results for different substrates is occasionally quite substantial; for example, ceritinib can cause 50% inhibition of OATP1B1 function when using FL, DCF, atorvastatin, or SN-38 as test substrates, but causes an apparent increase (by 50%) in OATP1B1-mediated transport of valsartan. Similar results have been reported for nintedanib, which stimulated the OATP1B1-mediated uptake of FL and valsartan, while inhibiting that of DCF and SN-38 (by 70%). One strategy recommended by the FDA to prevent the creation of such apparent, internally conflicting results is to advocate the use of test substrates in the in vitro model system that is predicted to generate the lowest IC50 value, or alternatively, to use the most clinically-relevant substrate. While this is a generally useful approach, several published examples highlight the limitations associated with this strategy. For example, Koide et al., have demonstrated that the use of DCF as a model substrate generates the lowest IC50 values for most but not necessarily all substrate-inhibitor combinations [66,68] and that TKIs with known OATP1B1-inhibitory properties, such as pazopanib, fail to affect transport function when using the clinically relevant substrates atorvastatin and valsartan [70,71,72,73]. The reported differences in inhibitory properties of TKIs toward the function of transporters such as OATP1B1 as a function of the test substrate used in in vitro studies can directly impact calculated R-values, and influence the reliability of DDI predictions and the clinical decision-making process, especially for weak-to-moderate inhibitors [74].
- -
- Incubation conditions: Several studies have demonstrated that the mechanism by which TKIs inhibit the function of OATP1B1 and/or OATP1B1 can be time-dependent [75], for example in the case of pazopanib, where preincubation times are inversely correlated with the degree of transport inhibition such as that longer preincubation times result in lower IC50 estimates [72]. The FDA guidance recommends the inclusion of a preincubation condition, in addition to simultaneous incubation of inhibitor and substrate, to ensure that optimal prediction values can be derived from in vitro experiments. Despite this recommendation, most of the published literature fails to provide specific detail on the design of the reported experiments where the preincubation condition is either not considered or not defined. Although the original FDA guidance recommendation was to include preincubation times of up to 30 min in the experimental study design, recent studies have demonstrated that more prolonged times, for example, one hour in the case of dasatinib or even up to three hours for other compounds, may be required to obtained reliable results [45,76]. Proper consideration of this aspect is especially relevant for a class of agents such as TKIs as they are generally administrated daily for prolonged periods, and may cause transporter inhibition predominantly through an indirect, kinase-mediated mechanism involving post-translational events that affect tyrosine phosphorylation. This suggests that a comprehensive evaluation of TKI-transporter inhibition studies require careful consideration and optimization of preincubation times in order to derive translationally useful DDI predictions.
- -
- Cell line selection: Although regulatory guidance documents do not currently expressly specify any particular cell-based model system for standardized use in in vitro transporter studies, prior findings have supported the notion that the choice of cell lines used for transfection can influence conclusions about inhibitory properties of xenobiotics. Indeed, McFeely et al. have argued that the selection of cell lines as one of the most important factors contributing to variability in observed OATP-mediated transport inhibition when using in vitro models [75]. In addition to intrinsic differences between commonly used cell lines that may be linked with differential baseline expression of other transport mechanisms of putative relevance and artificial compensatory dysregulation of other transporters in overexpressed models, factors such cell origin (e.g., mammalian vs amphibian), cell passage number, cell culture conditions, and maintenance procedures, seeding density, media composition (e.g., presence of binding proteins), and duration of time that cells are in culture (e.g., expression drifting), which are often not clearly documented, could further affect the outcome of each study [77].
- -
- Other contributing variables: In addition to the considerations outlined above as well as in Table 2 and Supplementary Materials Tables S1–S9, several other factors can contribute to variation in the reported transport inhibition data. These include the use of non-standardized software when calculating kinetic parameters such as IC50 or Ki, and the implementation of varying methods in quantifying levels of substrate drugs used in the transport assays [77,78]. An example of the latter would the use of an LC-MS/MS-based method to measure the intracellular levels of unchanged substrate drugs, whereas more commonly studies would employ the use of fluorescent substrates of radiolabeled substrates that would be analyzed for total fluorescence or total radioactivity, respectively, and thus would simultaneously measure the total of the parent drug and metabolite(s) formed intracellularly. This is an important methodological difference as certain compounds can undergo rapid enzyme-mediated metabolism once inside cells to form metabolites that may easily escape detection and result in underestimating the actual extent of uptake. Furthermore, even the use of identical protocols in different locales can influence the outcome of particular experimental studies as a result of uncontrollable factors such as interlaboratory differences, as has been documented extensively before for P-glycoprotein IC50 determinations [77]. It should also be pointed out that inconsistencies, as reported here for inhibition of OATP1B1- and OATP1B3-mediated transport, are relatively common and have previously been documented for models involving several other drug-metabolizing enzymes and transporters with a putative relevance in predicting clinically relevant DDIs [77,79,80].
7. Conclusions
Supplementary Materials
Author Contributions
Funding
Conflicts of Interest
References
- Watanabe, J.H.; McInnis, T.; Hirsch, J.D. Cost of Prescription Drug–Related Morbidity and Mortality. Ann. Pharmacother. 2018, 52, 829–837. [Google Scholar] [CrossRef] [PubMed]
- Fuhr, U.; Hsin, C.-H.; Li, X.; Jabrane, W.; Sörgel, F. Assessment of Pharmacokinetic Drug–Drug Interactions in Humans: In Vivo Probe Substrates for Drug Metabolism and Drug Transport Revisited. Annu. Rev. Pharmacol. Toxicol. 2019, 59, 507–536. [Google Scholar] [CrossRef]
- Magro, L.; Moretti, U.; Leone, R. Epidemiology and characteristics of adverse drug reactions caused by drug–drug interactions. Expert Opin. Drug Saf. 2011, 11, 83–94. [Google Scholar] [CrossRef]
- Subramanian, A.; Adhimoolam, M.; Kannan, S. Study of drug–Drug interactions among the hypertensive patients in a tertiary care teaching hospital. Perspect. Clin. Res. 2018, 9, 9–14. [Google Scholar] [CrossRef] [PubMed]
- Backman, J.T.; Kivistö, K.T.; Olkkola, K.T.; Neuvonen, P.J. The area under the plasma concentration-time curve for oral midazolam is 400-fold larger during treatment with itraconazole than with rifampicin. Eur. J. Clin. Pharmacol. 1998, 54, 53–58. [Google Scholar] [CrossRef] [PubMed]
- de Jong, J.; Skee, D.; Murphy, J.; Sukbuntherng, J.; Hellemans, P.; Smit, J.; de Vries, R.; Jiao, J.J.; Snoeys, J.; Mannaert, E. Effect of CYP3A perpetrators on ibrutinib exposure in healthy participants. Pharmacol. Res. Perspect. 2015, 3, e00156. [Google Scholar] [CrossRef] [Green Version]
- Gessner, A.; König, J.; Fromm, M.F. Clinical Aspects of Transporter-Mediated Drug–Drug Interactions. Clin. Pharmacol. Ther. 2019, 105, 1386–1394. [Google Scholar] [CrossRef]
- Riechelmann, R.P.; del Giglio, A. Drug interactions in oncology: How common are they? Ann. Oncol. 2009, 20, 1907–1912. [Google Scholar] [CrossRef]
- Riechelmann, R.; Girardi, D. Drug interactions in cancer patients: A hidden risk? J. Res. Pharm. Pr. 2016, 5, 77–78. [Google Scholar] [CrossRef]
- Solomon, J.M.; Ajewole, V.B.; Schneider, A.M.; Sharma, M.; Bernicker, E.H. Evaluation of the prescribing patterns, adverse effects, and drug interactions of oral chemotherapy agents in an outpatient cancer center. J. Oncol. Pharm. Pract. 2019, 25, 1564–1569. [Google Scholar] [CrossRef]
- Howlader, N.; Mariotto, A.B.; Besson, C.; Suneja, G.; Robien, K.; Younes, N.; Engels, E.A. Cancer-specific mortality, cure fraction, and noncancer causes of death among diffuse large B-cell lymphoma patients in the immunochemotherapy era. Cancer 2017, 123, 3326–3334. [Google Scholar] [CrossRef] [PubMed] [Green Version]
- Riechelmann, R.P.; Zimmermann, C.; Chin, S.N.; Wang, L.; O’Carroll, A.; Zarinehbaf, S.; Krzyzanowska, M.K. Potential Drug Interactions in Cancer Patients Receiving Supportive Care Exclusively. J. Pain Symptom Manag. 2008, 35, 535–543. [Google Scholar] [CrossRef] [PubMed]
- van Leeuwen, R.; Brundel, D.H.S.; Neef, C.; van Gelder, T.; Mathijssen, R.H.J.; Burger, D.M.; Jansman, F.G.A. Prevalence of potential drug–drug interactions in cancer patients treated with oral anticancer drugs. Br. J. Cancer 2013, 108, 1071–1078. [Google Scholar] [CrossRef] [PubMed] [Green Version]
- Bartel, S. Safe practices and financial considerations in using oral chemotherapeutic agents. Am. J. Health Pharm. 2007, 64, S8–S14. [Google Scholar] [CrossRef]
- Dagher, R.; Cohen, M.; Williams, G.; Rothmann, M.; Gobburu, J.; Robbie, G.; Rahman, A.; Chen, G.; Staten, A.; Griebel, D.; et al. Approval summary: Imatinib mesylate in the treatment of metastatic and/or unresectable malignant gastrointestinal stromal tumors. Clin. Cancer Res. 2002, 8, 3034–3038. [Google Scholar] [PubMed]
- Roskoski, R. Properties of FDA-approved small molecule protein kinase inhibitors. Pharmacol. Res. 2019, 144, 19–50. [Google Scholar] [CrossRef]
- Lemmon, M.A.; Schlessinger, J. Cell Signaling by Receptor Tyrosine Kinases. Cell 2010, 141, 1117–1134. [Google Scholar] [CrossRef] [Green Version]
- Hubbard, S.R.; Till, J.H. Protein Tyrosine Kinase Structure and Function. Annu. Rev. Biochem. 2000, 69, 373–398. [Google Scholar] [CrossRef] [Green Version]
- Robinson, D.R.; Wu, Y.-M.; Lin, S.-F. The protein tyrosine kinase family of the human genome. Oncogene 2000, 19, 5548–5557. [Google Scholar] [CrossRef] [Green Version]
- Arora, A.; Scholar, E.M. Role of Tyrosine Kinase Inhibitors in Cancer Therapy. J. Pharmacol. Exp. Ther. 2005, 315, 971–979. [Google Scholar] [CrossRef] [Green Version]
- Shawver, L.K.; Slamon, D.; Ullrich, A. Smart drugs: Tyrosine kinase inhibitors in cancer therapy. Cancer Cell 2002, 1, 117–123. [Google Scholar] [CrossRef] [Green Version]
- Jeong, W.; Doroshow, J.H.; Kummar, S. United States Food and Drug Administration approved oral kinase inhibitors for the treatment of malignancies. Curr. Probl. Cancer 2013, 37, 110–144. [Google Scholar] [CrossRef] [PubMed] [Green Version]
- Herviou, P.; Thivat, E.; Richard, D.; Roche, L.; Dohou, J.; Pouget, M.; Eschalier, A.; Durando, X.; Authier, N. Therapeutic drug monitoring and tyrosine kinase inhibitors. Oncol. Lett. 2016, 12, 1223–1232. [Google Scholar] [CrossRef] [PubMed]
- Haouala, A.; Widmer, N.; Duchosal, M.A.; Montemurro, M.; Buclin, T.; Decosterd, L.A. Drug interactions with the tyrosine kinase inhibitors imatinib, dasatinib, and nilotinib. Blood 2011, 117, e75–e87. [Google Scholar] [CrossRef] [PubMed] [Green Version]
- Iurlo, A.; Nobili, A.; Latagliata, R.; Bucelli, C.; Castagnetti, F.; Breccia, M.; Abruzzese, E.; Cattaneo, D.; Fava, C.; Ferrero, D.; et al. Imatinib and polypharmacy in very old patients with chronic myeloid leukemia: Effects on response rate, toxicity and outcome. Oncotarget 2016, 7, 80083–80090. [Google Scholar] [CrossRef]
- Hussaarts, K.; Veerman, G.D.M.; Jansman, F.G.A.; van Gelder, T.; Mathijssen, R.H.J.; van Leeuwen, R.W.F. Clinically relevant drug interactions with multikinase inhibitors: A review. Ther. Adv. Med Oncol. 2019, 11, 1758835918818347. [Google Scholar] [CrossRef]
- Fowler, H.; Belot, A.; Ellis, L.; Maringe, C.; Luque-Fernandez, M.A.; Njagi, E.N.; Navani, N.; Sarfati, D.; Rachet, B. Comorbidity prevalence among cancer patients: A population-based cohort study of four cancers. BMC Cancer 2020, 20, 2–15. [Google Scholar] [CrossRef]
- Ergun, Y.; Ozdemir, N.Y.; Toptas, S.; Kurtipek, A.; Eren, T.; Yazici, O.; Sendur, M.A.N.; Akinci, B.; Ucar, G.; Oksuzoglu, B.; et al. Drug-drug interactions in patients using tyrosine kinase inhibitors: A multicenter retrospective study. J. Buon 2019, 24, 1719–1726. [Google Scholar]
- Keller, K.L.; Franquiz, M.J.; Duffy, A.P.; Trovato, J.A. Drug–drug interactions in patients receiving tyrosine kinase inhibitors. J. Oncol. Pharm. Pract. 2016, 24, 110–115. [Google Scholar] [CrossRef]
- da Silva, C.; Honeywell, R.J.; Dekker, H.; Peters, G.J. Physicochemical properties of novel protein kinase inhibitors in relation to their substrate specificity for drug transporters. Expert Opin. Drug Metab. Toxicol. 2015, 11, 703–717. [Google Scholar] [CrossRef]
- Herbrink, M.; Nuijen, B.; Schellens, J.H.; Beijnen, J.H. Variability in bioavailability of small molecular tyrosine kinase inhibitors. Cancer Treat. Rev. 2015, 41, 412–422. [Google Scholar] [CrossRef] [PubMed]
- van Leeuwen, R.; van Gelder, T.; Mathijssen, R.; Jansman, F.G.A. Drug–drug interactions with tyrosine-kinase inhibitors: A clinical perspective. Lancet Oncol. 2014, 15, e315–e326. [Google Scholar] [CrossRef]
- Schulte, R.R.; Ho, R.H. Organic Anion Transporting Polypeptides: Emerging Roles in Cancer Pharmacology. Mol. Pharmacol. 2019, 95, 490–506. [Google Scholar] [CrossRef] [Green Version]
- Ho, R.H.; Kim, R.B. Transporters and drug therapy: Implications for drug disposition and disease. Clin. Pharmacol. Ther. 2005, 78, 260–277. [Google Scholar] [CrossRef] [PubMed]
- Kalliokoski, A.; Niemi, M. Impact of OATP transporters on pharmacokinetics. Br. J. Pharmacol. 2009, 158, 693–705. [Google Scholar] [CrossRef] [Green Version]
- Shitara, Y. Clinical Importance of OATP1B1 and OATP1B3 in DrugDrug Interactions. Drug Metab. Pharmacokinet. 2011, 26, 220–227. [Google Scholar] [CrossRef]
- Zimmerman, E.I.; Hu, S.; Roberts, J.L.; Gibson, A.A.; Orwick, S.J.; Li, L.; Sparreboom, A.; Baker, S. Contribution of OATP1B1 and OATP1B3 to the disposition of sorafenib and sorafenib-glucuronide. Clin. Cancer Res. 2013, 19, 1458–1466. [Google Scholar] [CrossRef] [Green Version]
- Teo, Y.L.; Ho, H.K.; Chan, A. Risk of tyrosine kinase inhibitors-induced hepatotoxicity in cancer patients: A meta-analysis. Cancer Treat. Rev. 2013, 39, 199–206. [Google Scholar] [CrossRef]
- Kellick, K. Organic Ion Transporters and Statin Drug Interactions. Curr. Atheroscler. Rep. 2017, 19, 65. [Google Scholar] [CrossRef]
- Alam, K.; Crowe, A.; Wang, X.; Zhang, P.; Ding, K.; Li, L.; Yue, W. Regulation of Organic Anion Transporting Polypeptides (OATP) 1B1- and OATP1B3-Mediated Transport: An Updated Review in the Context of OATP-Mediated Drug-Drug Interactions. Int. J. Mol. Sci. 2018, 19, 855. [Google Scholar] [CrossRef] [Green Version]
- Lancaster, C.S.; Sprowl, J.A.; Walker, A.L.; Hu, S.; Gibson, A.A.; Sparreboom, A. Modulation of OATP1B-type transporter function alters cellular uptake and disposition of platinum chemotherapeutics. Mol. Cancer Ther. 2013, 12, 1537–1544. [Google Scholar] [CrossRef] [PubMed] [Green Version]
- Chen, M.; Hu, S.; Li, Y.; Gibson, A.A.; Fu, Q.; Baker, S.D.; Sparreboom, A. Role of Oatp2b1 in Drug Absorption and Drug-Drug Interactions. Drug Metab. Dispos. 2020, 48, 420–426. [Google Scholar] [CrossRef] [PubMed]
- Podoll, T.; Pearson, P.G.; Evarts, J.; Ingallinera, T.; Sun, H.; Byard, S.; Fretland, A.J.; Slatter, J.G. Abstract 13: Structure elucidation, metabolism, and drug interaction potential of ACP-5862, an active, major, circulating metabolite of acalabrutinib. Cancer Res. 2019, 79. [Google Scholar] [CrossRef]
- Ellens, H.; Johnson, M.; Lawrence, S.K.; Chen, L.; Richards-Peterson, L.E.; Watson, C. Prediction of the Transporter-Mediated Drug-Drug Interaction Potential of Dabrafenib and Its Major Circulating Metabolites. Drug Metab. Dispos. 2017, 45, 646–656. [Google Scholar] [CrossRef] [PubMed]
- Pahwa, S.; Alam, K.; Crowe, A.; Farasyn, T.; Neuhoff, S.; Hatley, O.; Ding, K.; Yue, W. Pretreatment With Rifampicin and Tyrosine Kinase Inhibitor Dasatinib Potentiates the Inhibitory Effects Toward OATP1B1- and OATP1B3-Mediated Transport. J. Pharm. Sci. 2017, 106, 2123–2135. [Google Scholar] [CrossRef] [PubMed]
- Elsby, R.; Martin, P.; Surry, D.; Sharma, P.; Fenner, K. Solitary Inhibition of the Breast Cancer Resistance Protein Efflux Transporter Results in a Clinically Significant Drug-Drug Interaction with Rosuvastatin by Causing up to a 2-Fold Increase in Statin Exposure. Drug Metab. Dispos. 2015, 44, 398–408. [Google Scholar] [CrossRef] [Green Version]
- Patik, I.; Kovacsics, D.; Német, O.; Gera, M.; Várady, G.; Stieger, B.; Hagenbuch, B.; Szakács, G.; Özvegy-Laczka, C. Functional expression of the 11 human Organic Anion Transporting Polypeptides in insect cells reveals that sodium fluorescein is a general OATP substrate. Biochem. Pharmacol. 2015, 98, 649–658. [Google Scholar] [CrossRef] [Green Version]
- Bergman, E.; Hedeland, M.; Bondesson, U.; Lennernäs, H. The effect of acute administration of rifampicin and imatinib on the enterohepatic transport of rosuvastatinin vivo. Xenobiotica 2010, 40, 558–568. [Google Scholar] [CrossRef]
- Nakamura, Y.; Hirokawa, Y.; Kitamura, S.; Yamasaki, W.; Arihiro, K.; Tatsugami, F.; Iida, M.; Kakizawa, H.; Date, S.; Awai, K. Effect of lapatinib on hepatic parenchymal enhancement on gadoxetate disodium (EOB)-enhanced MRI scans of the rat liver. Jpn. J. Radiol. 2013, 31, 386–392. [Google Scholar] [CrossRef]
- Martin, P.D.; Gillen, M.; Ritter, J.; Mathews, D.; Brealey, C.; Surry, D.; Oliver, S.; Holmes, V.; Severin, P.; Elsby, R. Effects of Fostamatinib on the Pharmacokinetics of Oral Contraceptive, Warfarin, and the Statins Rosuvastatin and Simvastatin: Results From Phase I Clinical Studies. Drugs R&D 2016, 16, 93–107. [Google Scholar] [CrossRef] [Green Version]
- Harvey, R.D.; Aransay, N.R.; Isambert, N.; Lee, J.-S.; Arkenau, T.; Vansteenkiste, J.; Dickinson, P.A.; Bui, K.; Weilert, D.; So, K.; et al. Effect of multiple-dose osimertinib on the pharmacokinetics of simvastatin and rosuvastatin. Br. J. Clin. Pharmacol. 2018, 84, 2877–2888. [Google Scholar] [CrossRef] [Green Version]
- Vishwanathan, K.; Cantarini, M.; So, K.; Masson, E.; Fetterolf, J.; Ramalingam, S.S.; Harvey, R.D. Impact of Disease and Treatment Response in Drug–Drug Interaction Studies: Osimertinib and Simvastatin in Advanced Non-Small Cell Lung Cancer. Clin. Transl. Sci. 2019, 13, 41–46. [Google Scholar] [CrossRef] [PubMed]
- Calvo, E.; Lee, J.-S.; Kim, S.-W.; Moreno, V.; Carpeno, J.D.; Weilert, D.; Laus, G.; Mann, H.; Vishwanathan, K. Modulation of Fexofenadine Pharmacokinetics by Osimertinib in Patients With Advanced EGFR-Mutated Non–Small Cell Lung Cancer. J. Clin. Pharmacol. 2019, 59, 1099–1109. [Google Scholar] [CrossRef] [PubMed]
- Reddy, V.P.; Walker, M.; Sharma, P.; Ballard, P.; Vishwanathan, K. Development, Verification, and Prediction of Osimertinib Drug-Drug Interactions Using PBPK Modeling Approach to Inform Drug Label. CPT Pharmacomet. Syst. Pharmacol. 2018, 7, 321–330. [Google Scholar] [CrossRef] [PubMed]
- Komatsu, H.; Enomoto, M.; Shiraishi, H.; Morita, Y.; Hashimoto, D.; Nakayama, S.; Funakoshi, S.; Hirano, S.; Terada, Y.; Miyamura, M.; et al. Severe hypoglycemia caused by a small dose of repaglinide and concurrent use of nilotinib and febuxostat in a patient with type 2 diabetes. Diabetol. Int. 2020, 1–5. [Google Scholar] [CrossRef] [Green Version]
- Kendra, K.; Plummer, R.; Salgia, R.; O’Brien, M.E.R.; Paul, E.M.; Suttle, A.B.; Compton, N.; Xu, C.-F.; Ottesen, L.H.; Villalona-Calero, M.A. A Multicenter Phase I Study of Pazopanib in Combination with Paclitaxel in First-Line Treatment of Patients with Advanced Solid Tumors. Mol. Cancer Ther. 2014, 14, 461–469. [Google Scholar] [CrossRef] [Green Version]
- Poje, D.K.; Božina, N.; Šimičević, L.; Žabić, I. Severe hyperglycaemia following pazopanib treatment: The role of drug-drug-gene interactions in a patient with metastatic renal cell carcinoma—A case report. J. Clin. Pharm. Ther. 2020, 45, 628–631. [Google Scholar] [CrossRef]
- Hamberg, P.; Mathijssen, R.H.J.; de Bruijn, P.; Leonowens, C.; van der Biessen, D.; Eskens, F.A.L.M.; Sleijfer, S.; Verweij, J.; de Jonge, M.J.A. Impact of pazopanib on docetaxel exposure: Results of a phase I combination study with two different docetaxel schedules. Cancer Chemother. Pharmacol. 2014, 75, 365–371. [Google Scholar] [CrossRef]
- Xu, C.-F.; Xue, Z.; Bing, N.; King, K.S.; McCann, L.A.; de Souza, P.L.; Goodman, V.L.; Spraggs, C.F.; Mooser, V.E.; Pandite, L.N. Concomitant use of pazopanib and simvastatin increases the risk of transaminase elevations in patients with cancer. Ann. Oncol. 2012, 23, 2470–2471. [Google Scholar] [CrossRef]
- Mandery, K.; Glaeser, H.; Fromm, M.F. Interaction of innovative small molecule drugs used for cancer therapy with drug transporters. Br. J. Pharmacol. 2011, 165, 345–362. [Google Scholar] [CrossRef] [Green Version]
- Lawrence, S.K.; Nguyen, D.; Bowen, C.; Richards-Peterson, L.; Skordos, K.W. The Metabolic Drug-Drug Interaction Profile of Dabrafenib: In Vitro Investigations and Quantitative Extrapolation of the P450-Mediated DDI Risk. Drug Metab. Dispos. 2014, 42, 1180–1190. [Google Scholar] [CrossRef] [PubMed] [Green Version]
- Filppula, A.; Neuvonen, P.J.; Backman, J.T. In Vitro Assessment of Time-Dependent Inhibitory Effects on CYP2C8 and CYP3A Activity by Fourteen Protein Kinase Inhibitors. Drug Metab. Dispos. 2014, 42, 1202–1209. [Google Scholar] [CrossRef] [Green Version]
- Grenader, T.; Gipps, M.; Shavit, L.; Gabizon, A. Significant drug interaction: Phenytoin toxicity due to erlotinib. Lung Cancer 2007, 57, 404–406. [Google Scholar] [CrossRef] [PubMed]
- Kuhn, E.L.; Lévêque, D.; Lioure, B.; Gourieux, B.; Bilbault, P. Adverse event potentially due to an interaction between ibrutinib and verapamil: A case report. J. Clin. Pharm. Ther. 2016, 41, 104–105. [Google Scholar] [CrossRef]
- Vaidyanathan, J.; Yoshida, K.; Arya, V.; Zhang, L. Comparing Various In Vitro Prediction Criteria to Assess the Potential of a New Molecular Entity to Inhibit Organic Anion Transporting Polypeptide 1B1. J. Clin. Pharmacol. 2016, 56, S59–S72. [Google Scholar] [CrossRef] [PubMed]
- Koide, H.; Tsujimoto, M.; Takeuchi, A.; Tanaka, M.; Ikegami, Y.; Tagami, M.; Abe, S.; Hashimoto, M.; Minegaki, T.; Nishiguchi, K. Substrate-dependent effects of molecular-targeted anticancer agents on activity of organic anion transporting polypeptide 1B1. Xenobiotica 2017, 48, 1059–1071. [Google Scholar] [CrossRef]
- Sato, T.; Ito, H.; Hirata, A.; Abe, T.; Mano, N.; Yamaguchi, H. Interactions of crizotinib and gefitinib with organic anion-transporting polypeptides (OATP)1B1, OATP1B3 and OATP2B1: Gefitinib shows contradictory interaction with OATP1B3. Xenobiotica 2017, 48, 73–78. [Google Scholar] [CrossRef]
- Leblanc, A.F.; Sprowl, J.A.; Alberti, P.; Chiorazzi, A.; Arnold, W.D.; Gibson, A.A.; Hong, K.W.; Pioso, M.S.; Chen, M.; Huang, K.M.; et al. OATP1B2 deficiency protects against paclitaxel-induced neurotoxicity. J. Clin. Investig. 2018, 128, 816–825. [Google Scholar] [CrossRef]
- Febvre-James, M.; Bruyère, A.; Le Vée, M.; Fardel, O. The JAK1/2 Inhibitor Ruxolitinib Reverses Interleukin-6-Mediated Suppression of Drug-Detoxifying Proteins in Cultured Human Hepatocytes. Drug Metab. Dispos. 2018, 46, 131–140. [Google Scholar] [CrossRef]
- Hu, S.; Mathijssen, R.H.J.; de Bruijn, P.; Baker, S.; Sparreboom, A. Inhibition of OATP1B1 by tyrosine kinase inhibitors: In vitro–in vivo correlations. Br. J. Cancer 2014, 110, 894–898. [Google Scholar] [CrossRef]
- Iwase, M.; Fujita, K.-I.; Nishimura, Y.; Seba, N.; Masuo, Y.; Ishida, H.; Kato, Y.; Kiuchi, Y. Pazopanib interacts with irinotecan by inhibiting UGT1A1-mediated glucuronidation, but not OATP1B1-mediated hepatic uptake, of an active metabolite SN-38. Cancer Chemother. Pharmacol. 2019, 83, 993–998. [Google Scholar] [CrossRef] [PubMed]
- Taguchi, T.; Masuo, Y.; Sakai, Y.; Kato, Y. Short-lasting inhibition of hepatic uptake transporter OATP1B1 by tyrosine kinase inhibitor pazopanib. Drug Metab. Pharmacokinet. 2019, 34, 372–379. [Google Scholar] [CrossRef] [PubMed]
- Xu, C.F.; Reck, B.H.; Xue, Z.; Huang, L.; Baker, K.L.; Chen, M.; Chen, E.P.; Ellens, H.E.; Mooser, V.E.; Cardon, L.R.; et al. Pazopanib-induced hyperbilirubinemia is associated with Gilbert’s syndrome UGT1A1 polymorphism. Br. J. Cancer 2010, 102, 1371–1377. [Google Scholar] [CrossRef] [PubMed] [Green Version]
- Izumi, S.; Nozaki, Y.; Maeda, K.; Komori, T.; Takenaka, O.; Kusuhara, H.; Sugiyama, Y. Investigation of the Impact of Substrate Selection on In Vitro Organic Anion Transporting Polypeptide 1B1 Inhibition Profiles for the Prediction of Drug-Drug Interactions. Drug Metab. Dispos. 2014, 43, 235–247. [Google Scholar] [CrossRef] [Green Version]
- McFeely, S.J.; Ritchie, T.K.; Ragueneau-Majlessi, I. Variability in In Vitro OATP1B1/1B3 Inhibition Data: Impact of Incubation Conditions on Variability and Subsequent Drug Interaction Predictions. Clin. Transl. Sci. 2020, 13, 47–52. [Google Scholar] [CrossRef] [Green Version]
- Tátrai, P.; Schweigler, P.; Poller, B.; Domange, N.; de Wilde, R.; Hanna, I.; Gaborik, Z.; Huth, F. A Systematic In Vitro Investigation of the Inhibitor Preincubation Effect on Multiple Classes of Clinically Relevant Transporters. Drug Metab. Dispos. 2019, 47, 768–778. [Google Scholar] [CrossRef]
- Bentz, J.; O’Connor, M.P.; Bednarczyk, D.; Coleman, J.; Lee, C.; Palm, J.; Pak, Y.A.; Perloff, E.S.; Reyner, E.; Balimane, P.; et al. Variability in P-Glycoprotein Inhibitory Potency (IC50) Using Various in Vitro Experimental Systems: Implications for Universal Digoxin Drug-Drug Interaction Risk Assessment Decision Criteria. Drug Metab. Dispos. 2013, 41, 1347–1366. [Google Scholar] [CrossRef] [Green Version]
- Volpe, D.A.; Hamed, S.S.; Zhang, L.K. Use of Different Parameters and Equations for Calculation of IC50 Values in Efflux Assays: Potential Sources of Variability in IC50 Determination. AAPS J. 2013, 16, 172–180. [Google Scholar] [CrossRef] [Green Version]
- Greenblatt, D.J.; Venkatakrishnan, K.; Harmatz, J.S.; Parent, S.J.; von Moltke, L.L. Sources of variability in ketoconazole inhibition of human cytochrome P450 3Ain vitro. Xenobiotica 2010, 40, 713–720. [Google Scholar] [CrossRef]
- Huang, K.M.; Uddin, M.E.; Digiacomo, D.; Lustberg, M.B.; Hu, S.; Sparreboom, A. Role of SLC transporters in toxicity induced by anticancer drugs. Expert Opin. Drug Metab. Toxicol. 2020, 16, 493–506. [Google Scholar] [CrossRef]
- Johnston, R.A.; Rawling, T.; Chan, T.; Zhou, F.; Murray, M. Selective Inhibition of Human Solute Carrier Transporters by Multikinase Inhibitors. Drug Metab. Dispos. 2014, 42, 1851–1857. [Google Scholar] [CrossRef] [PubMed] [Green Version]
- Lacy, S.; Hsu, B.; Miles, D.; Aftab, D.; Wang, R.; Nguyen, L. Metabolism and Disposition of Cabozantinib in Healthy Male Volunteers and Pharmacologic Characterization of Its Major Metabolites. Drug Metab. Dispos. 2015, 43, 1190–1207. [Google Scholar] [CrossRef]
- Khurana, V.; Minocha, M.; Pal, D.; Mitra, A.K. Inhibition of OATP-1B1 and OATP-1B3 by tyrosine kinase inhibitors. Drug Metab. Drug Interact. 2014, 29, 249–259. [Google Scholar] [CrossRef] [PubMed] [Green Version]
- Kotsampasakou, E.; Brenner, S.; Jaeger, W.; Ecker, G.F. Identification of Novel Inhibitors of Organic Anion Transporting Polypeptides 1B1 and 1B3 (OATP1B1 and OATP1B3) Using a Consensus Vote of Six Classification Models. Mol. Pharm. 2015, 12, 4395–4404. [Google Scholar] [CrossRef] [PubMed] [Green Version]
- Polli, J.W.; Humphreys, J.E.; Harmon, K.A.; Castellino, S.; O’mara, M.J.; Olson, K.L.; John-Williams, L.S.; Koch, K.M.; Serabjit-Singh, C.J. The role of efflux and uptake transporters in [N-{3-chloro-4-[(3-fluorobenzyl)oxy]phenyl}-6-[5-({[2-(methylsulfonyl)ethyl]amino}methyl)-2-furyl]-4-quinazolinamine (GW572016, lapatinib) disposition and drug interactions. Drug Metab. Dispos. 2008, 36, 695–701. [Google Scholar] [CrossRef] [PubMed]
- Hayden, E.R. Phosphorylation and function of OATP1B1 with tyrosine kinase inhibitors. FASEB J. 2020, 34, 1. [Google Scholar] [CrossRef]
- Sprowl, J.A.; Chen, M.; Gibson, A.A.; Pasquariello, K.Z.; Sparreboom, A.; Hu, S. Characterization of OATP1B1 and OATP1B3 inhibition by Nilotinib. FASEB J. 2019, 33, 506–507. [Google Scholar]
- Ohya, H.; Shibayama, Y.; Ogura, J.; Narumi, K.; Kobayashi, M.; Iseki, K. Regorafenib Is Transported by the Organic Anion Transporter 1B1 and the Multidrug Resistance Protein 2. Biol. Pharm. Bull. 2015, 38, 582–586. [Google Scholar] [CrossRef] [Green Version]


| TKI | Disease Indication | Kinase Target | OATP1B1 | OATP1B3 | ||||
|---|---|---|---|---|---|---|---|---|
| PI | FDA | EMA | PI | FDA | EMA | |||
| Bacritinib | Rheumatoid Arthritis | JAK | No | No | No | Yes | Yes | No |
| Ceritinib | Metastatic Non-Small Cell Lung Cancer | ALK | No | Yes | No | No | Yes | No |
| Crizotinib | Metastatic Non-Small Cell Lung Cancer | ALK, ROS1 | No | Yes | - | No | Yes | - |
| Laroctrectinib | Solid Tumors | NTKR | No | No | Yes | No | No | No |
| Lenvatinib | Differentiated Thyroid Cancer, Renal Cell Carcinoma, Hepatocellular Carcinoma | VEGFR | No | Yes | Yes | No | No | No |
| Lorlatinib | Anaplastic Lymphoma Positive Metastatic Non-Small Cell Lung Cancer | ALK | No | No | Yes | No | No | Yes |
| Midostaurin | Acute Myeloid Leukemia, Aggressive Systemic Mastocytosis, Associated Hematological Neoplasm, Mast Cell Leukemia | FLT3 | Yes | Yes | Yes | - | Yes | No |
| Osimertinib | Metastatic Non-Small Cell Lung Cancer | EGFR | No | No | Yes | No | No | Yes |
| TKI | 1B1 Inhibitor | Reported Values | 1B3 Inhibitor | Reported Values | Model | Pre-Incubation (mins) | Substrate | References |
|---|---|---|---|---|---|---|---|---|
| Bosutinib | Yes | >60% inhibition at 10 µM | Flp-In T-Rex293/OATP1B1*1A | 15 | 0.1 mM (3H) (E2G) | FDA: No [68,70,81] | ||
| No | 121 ± 6% function remaining after incubation with 10 µM | No | 109 ± 5% function remaining after incubation with 10 µM | HEK293/OATP1B1 or 3 | UNK | 300 nM E3S (1B1) or 2 nM CCK-8 (1B3) | ||
| Yes | >25% 10 µM on E2G, >50% on 8Fc-A | HEK293/OATP1B1 | 15 | E2G 8Fc-A | ||||
| Cabozantinib | No | >15 µM | No | >10 µM | MDCK-II cell monolayers | UNK | OATP1B1: 2 µM; E2G OATP1B3: 2 µM CCK | EMA: No [66,82] |
| Yes | 59% inhibition at 30 µM | HEK/OATP1B1 | 3 µM FL | |||||
| Yes | 61% inhibition at 30 µM | HEK/OATP1B1 | 1 µM DCF | |||||
| Yes | 74% inhibition at 30 µM | HEK/OATP1B1 | 1 µM Valsartan | |||||
| Ceritinib | Yes | 50% inhibition at 30 µM | HEK/OATP1B1 | 10 | 3 µM FL | FDA: Yes, PI: No [66] | ||
| Yes | 50% inhibition at 30 µM | HEK/OATP1B1 | 10 | 1 µM DCF | ||||
| Yes | 50% inhibition at 30 µM | HEK/OATP1B1 | 10 | 0.5 µM atorvastatin | ||||
| Yes | 50% inhibition at 30 µM | HEK/OATP1B1 | 10 | 1 µM SN-38 | ||||
| No | 150% stimulation at 30 µM | HEK/OATP1B1 | 10 | 1 µM valsartan | ||||
| Crizotinib | No | No | HEK/OATP1B1 or 1B3 | 11nM (3H]E3S [1B1) 50nM (3H)TCA (1B3) 0.5 µM fluvastatin (1B1) 2 µM fluvastatin (; 1B1) | FDA: Yes, PI: No [67,68] | |||
| Yes | >25% inhibition at 10 µM | HEK293/OATP1B1 | 15 | E2G 8Fc-A | ||||
| Erlotinib | No | No | CHO/OATP-1B1 and -1B3 | UNK | 0.25 μCi/mL (3H)ES (for OATP-1B1) or (3H)CCK-8 (for OATP-1B3) | NI [68,70,81,83] | ||
| Yes | >60% decrease at 10 µM | Flp-In T-Rex293/OATP1B1*1A | 15 | 0.1 mM (3H) (E2G) | ||||
| No | 104 ± 5% function remaining after incubation with 10 µM | Yes | 50% inhibition at 1.19 µM | HEK293/OATP1B1 or 3 | UNK | 300 nM E3S (1B1) or 2 nM CCK-8 (1B3) | ||
| Yes | >25% inhibtion at 10 µM on E2G, >50% inhibition on 8Fc-A | HEK293/OATP1B1 | 15 | E2G 8Fc-A | ||||
| Gefitinib | Yes | >70% decrease with 10 µM | Flp-In T-Rex293/OATP1B1*1A | 15 | 0.1 mM (3H) E2G | NI [67,68,70,81] | ||
| Yes | 50% inhibition at 17.2 ± 1.47 µM, | Yes | 18.8 ± 2.74 mM | HEK293/OATP1B1, OATP1B3, | fluvastatin | |||
| Inducer | EC50 value of 14.1 ± 4.6 mM | HEK293/ OATP1B1, OATP1B3, | (3H)TCA | |||||
| No | 105 ± 3% function remaining after incubation with 10 µM | No | 78 ± 3% function remaining after incubation with 10 µM | HEK293/OATP1B1 or 3 | UNK | 300 nM E3S (1B1) or 2 nM CCK-8 (1B3) | ||
| Yes | >25% inhibition at 10 µM on E2G, >75% inhibition on 8Fc-A | HEK293/OATP1B1 | 15 | E2G 8Fc-A | ||||
| Imatinib | Yes | ~20% inhibition at 10 µM | Flp-In T-Rex29/OATP1B1 | 15 | 0.1 mM (3H) E2G | NI [47,68,70] | ||
| No | Sf9 /OATP1b1 | 5 | 1 µM Na-Fluo | |||||
| Yes | >25% inhibition at 10 µM on both | HEK293/OATP1B1 | 15 | E2G 8Fc-A | ||||
| Lapatinib | Yes | >70% inhibition at 10 µM | HEK293/OATP1B1 | 15 | E2G8Fc-A | YES [68,70,81,84,85] | ||
| Yes | >70% inhibition at 10 µM | Flp-In T-Rex29/ OATP1B1 | 15 | 0.1 mM (3H) E2G | ||||
| No | Yes, slight inhibition | CHO/ OATP-1B1 or -1B3 | UNK | fluro-methotrexate | ||||
| Yes | 50% inhibition at 4.0 µM (Sd:2.1) | CHO-OATP1B1 | 15–30 | (3H) E2G | ||||
| No | 123 ± 13% function remaining after incubation with 10 µM | No | 98 ± 16% function remaining after incubation with 10 µM | HEK293/OATP1B1 or 3 | UNK | 300 nM E3S (1B1) or 2 nM CCK-8 (1B3) | ||
| Neratinib | No | HEK/OATP1B1 | 10 | 3 µM FL | EMA:No [66,81] | |||
| No | HEK/OATP1B1 | 10 | 1 µM DCF | |||||
| No | HEK/OATP1B1 | 10 | 0.5 µM atorvastatin | |||||
| Yes | 30% inhibition at 30 µM | HEK/OATP1B1 | 10 | 1 µM SN-38 | ||||
| No | HEK/OATP1B1 | 10 | 1 µM valsartan | |||||
| No | 123 ± 13% function remaining after incubation with 10 µM | Yes | 50% inhibition at 18.13 ± 1.21 | HEK293/OATP1B1 or 3 | UNK | 300 nM E3S (1B1) or 2nM CCK-8 (1B3) | ||
| Nilotinib | No | HEK/OATP1B1 | 10 | 3 µM FL | NI [66,68,70,83,86,87] | |||
| Yes | ~50% inhibition at 30 µM | HEK/OATP1B1 | 10 | 1 µM DCF | ||||
| Yes | ~50% inhibition at 30 µM | HEK/OATP1B1 | 10 | 0.5 µM atorvastatin | ||||
| Yes | ~50% inhibition at 30 µM | HEK/OATP1B1 | 10 | 1 µM SN-38 | ||||
| Yes | ~50% inhibition at 30 µM | HEK/OATP1B1 | 10 | 1 µM valsartan | ||||
| Yes | >95% inhibition at 10 µM | Flp-In T-Rex29/ OATP1B1 | 10 | 0.1 mM (3H) E2G | ||||
| No | 110 ± 7% stimulation at 10 µM | No | 100 ± 3% function remaining after incubation with 10 µM | HEK293/OATP1B1 or 3 | UNK | 300 nM E3S (1B1) or 2nM CCK-8 (1B3) | ||
| Yes | >80% inhibition at 0–20 µM | HEK/OATP1B1 | 5–40 μM 8Fc-A or 2 μM E2G | |||||
| Yes | 50% inhibition at 1.3 μM | Yes | HEK293/OATP1B1 or 3 | E2G or 8FcA | ||||
| Yes | >50% at 10 µM, IC50: ~1 μM | HEK293/OATP1B1 | 15 | E2G or 8FcA | ||||
| Yes | 50% inhibition at 2.78 ± 1.13 μM | No | CHO/ OATP-1B1 or -1B3 | 0.25 μCi/mL (3H)ES (for OATP-1B1) or (3H)CCK-8 (for OATP-1B3) | ||||
| Nintedanib | No | 312% stimulation at 30 µM | HEK/OATP1B1 | 3 µM FL | No [66] | |||
| Yes | 74% inhibition at 30 µM | HEK/OATP1B1 | 1 µM DCF | |||||
| No | 133% stimulation at 30 µM | HEK/OATP1B1 | 1 µM Valsartan | |||||
| Yes | 78% inhibition at 30 µM | HEK/OATP1B1 | 1 μM SN-38 | |||||
| Pazopanib | No | 120% stimulation at 30 µM | HEK/OATP1B1 | 10 | 3 µM FL | Yes [66,68,70,71,72,73,83] | ||
| No | HEK/OATP1B1 | 10 | 1 µM DCF | |||||
| No | HEK/OATP1B1 | 10 | 0.5 µM atorvastatin | |||||
| No | HEK/OATP1B1 | 10 | 1 µM SN-38 | |||||
| No | HEK/OATP1B1 | 10 | 1 µM valsartan | |||||
| Yes | 50% inhibition 3.89 ± 1.21 μM | No | CHO/ OATP-1B1 or -1B3 | 0.25 μCi/mL of (3H)ES (for OATP-1B1) or (3H)CCK-8 (for OATP-1B3) | ||||
| Yes | >50% inhibition with 8Fc-A, >90% inhibition with E2G | HEK293/OATP1B1 | 15 | E2G or (1B1),8FcA (1B1, 1B3) | ||||
| Yes | 50% inhibition at 0.79 µM | CHO-OATP1B1 | 15–30 | (3H)-EG | ||||
| No | HEK293/OATP1B1 | SN-38 | ||||||
| Yes | >95% inhibition at 10 µM | Flp-In T-Rex29/OATP1B1 | 15 | 0.1 µM (3H) E2G | ||||
| Yes | IC50 E1S: 1.42 ± 0.23, IC50 E2G: 13.5 ± 6.0 | HEK293/OATP1B1 | 0 | (3H) E1S and (3H) E2G | ||||
| Yes | IC50 E1S:0.594 ± 0.030 IC50 E2G: 7.25 ± 0.53 | HEK293/OATP1B2 | 1 | (3H) (E1S) and (3H) E2G | ||||
| Yes | IC50 E1S: 0.374 ± 0.074, IC50 E2G: 2.58 ± 0.77 | HEK293/OATP1B4 | 30 | (3H) E1S and (3H) E2G | ||||
| Yes | IC50 E1S: 0.530 ± 0.022, IC50 E2G:2.03 ± 0.71 | HEK293/OATP1B5 | 60 | (3H) E1S and (3H) E2G | ||||
| Regorafenib | No | 30% stimulation | HEK293/OATP1B6 | 10 | 0.5 µM Atorvastatin | FDA: No [66,68,70,88] | ||
| Yes | 50% inhibition at ~10 µM | No | HEK293/OATP1B1/1B3 | 2 | estrone-3-sulfate (1B1)/taurocholic acid (1B3) | |||
| Yes | >50% inhibition at 10 µM | Flp-In T-Rex29/ OATP1B1 | 15 | 0.1mM (3H) E2G | ||||
| Yes | >50% inhibition | HEK293/OATP1B1 | 15 | E2G, 8FcA | ||||
| Ruxolitinib | Yes | >25% inhibition at 10 µM on 8Fc-A | HEK293/OATP1B1 | 15 | E2G, 8FcA | No [68,69,70] | ||
| No | HepaRG | 4 nM E3S | ||||||
| Yes | ~20% inhibition at 10 µM | Flp-In T-Rex29/ OATP1B1 | 15 | 0.1mM (3H) E2G | ||||
| Sorafenib | Yes | >75% at 10 µM on both | HEK293/OATP1B1 | 15 | E2G, 8FcA | NI [66,70,81] | ||
| Yes | >90% inhibition at 10 µM | Flp-In T-Rex293/OATP1B1*1A | 15 | (3H) E2G 0.1 mM | ||||
| Yes | 50% inhibition at 69.6 µM | Flp-In T-Rex293/ OATP1B1*1A | 15 | 0.1 mM (3H) docetaxel | ||||
| No | HEK/OATP1B1 | 10 | 3 µM FL | |||||
| No | HEK/OATP1B1 | 10 | 1 µM DCF | |||||
| No | HEK/OATP1B1 | 10 | 0.5 µM atorvastatin | |||||
| No | HEK/OATP1B1 | 10 | 1 µM SN-38 | |||||
| No | HEK/OATP1B1 | 10 | 1 µM valsartan | |||||
| No | 96 ± 7% function remaining after incubation with 10 µM | Yes | 68 ± 0.5% function remaining after incubation with 10 µM | HEK293/OATP1B1 or 3 | UNK | 300nM E3S (1B1) or 2nM CCK-8 (1B3) | ||
| Sunitinib | Yes | >25% decrease at 10 µM | Flp-In T-Rex293/OATP1B1*1A | 15 | 0.1 mM (3H) E2G | NI [68,70,84] | ||
| No | 109 ± 10% function remaining after incubation with 10 µM | No | 101 ± 10% function remaining after incubation with 10 µM | HEK293/OATP1B1 or 3 | UNK | 300nM E3S (1B1) or 2nM CCK-8 (1B3) | ||
| Yes | >25% inhibition | HEK293/OATP1B1 | 15 | E2G, 8FcA | ||||
| Vandetanib | Yes | >25% inhibition at 10 µM | Flp-In T-Rex293/ OATP1B1*1A | 15 | 0.1 mM (3H) E2G | NI [53,68,70,83,84] | ||
| No | Yes | 50% inhibition at 18.13 ± 1.21 | CHO/ OATP-1B1 or -1B3 | 0.25 μCi/mL of (3H)ES (for OATP-1B1) or (3H)CCK-8 (for OATP-1B3) | ||||
| No | 110 ± 6% function remaining after incubation with 10 µM | Yes | 71± 5% function remaining after incubation with 10 µM | HEK293/OATP1B1 or 3 | UNK | 300nM E3S (1B1) or 2nM CCK-8 (1B3) | ||
| Yes | >25% inhibition at 10 µM | HEK293/OATP1B1 | 15 | E2G, 8FcA |
© 2020 by the authors. Licensee MDPI, Basel, Switzerland. This article is an open access article distributed under the terms and conditions of the Creative Commons Attribution (CC BY) license (http://creativecommons.org/licenses/by/4.0/).
Share and Cite
Garrison, D.A.; Talebi, Z.; Eisenmann, E.D.; Sparreboom, A.; Baker, S.D. Role of OATP1B1 and OATP1B3 in Drug-Drug Interactions Mediated by Tyrosine Kinase Inhibitors. Pharmaceutics 2020, 12, 856. https://doi.org/10.3390/pharmaceutics12090856
Garrison DA, Talebi Z, Eisenmann ED, Sparreboom A, Baker SD. Role of OATP1B1 and OATP1B3 in Drug-Drug Interactions Mediated by Tyrosine Kinase Inhibitors. Pharmaceutics. 2020; 12(9):856. https://doi.org/10.3390/pharmaceutics12090856
Chicago/Turabian StyleGarrison, Dominique A., Zahra Talebi, Eric D. Eisenmann, Alex Sparreboom, and Sharyn D. Baker. 2020. "Role of OATP1B1 and OATP1B3 in Drug-Drug Interactions Mediated by Tyrosine Kinase Inhibitors" Pharmaceutics 12, no. 9: 856. https://doi.org/10.3390/pharmaceutics12090856