Molecular Crystal Forms of Antitubercular Ethionamide with Dicarboxylic Acids: Solid-State Properties and a Combined Structural and Spectroscopic Study

 ,
,  , ,
, ,
Abstract
:
1. Introduction
2. Materials and Methods
2.1. Synthesis
2.2. Screening Techniques
Raman Spectroscopy
2.3. Characterization Techniques
2.3.1. X-Ray Diffraction (SCXRD and PXRD)
2.3.2. Solid-State NMR Measurements
2.3.3. Thermal Analyses
2.3.4. Dissolution Kinetic Tests (DKTs)
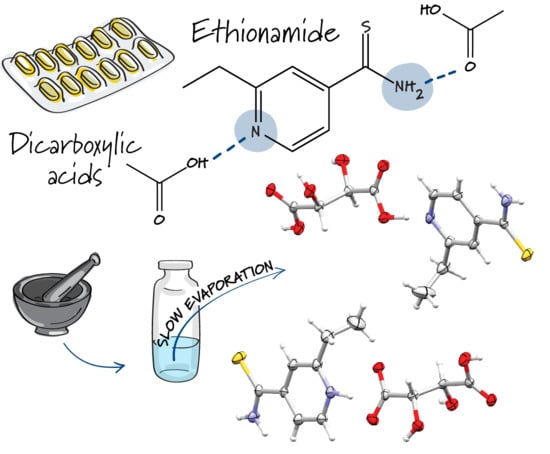
3. Results and Discussion
3.1. SCXRD
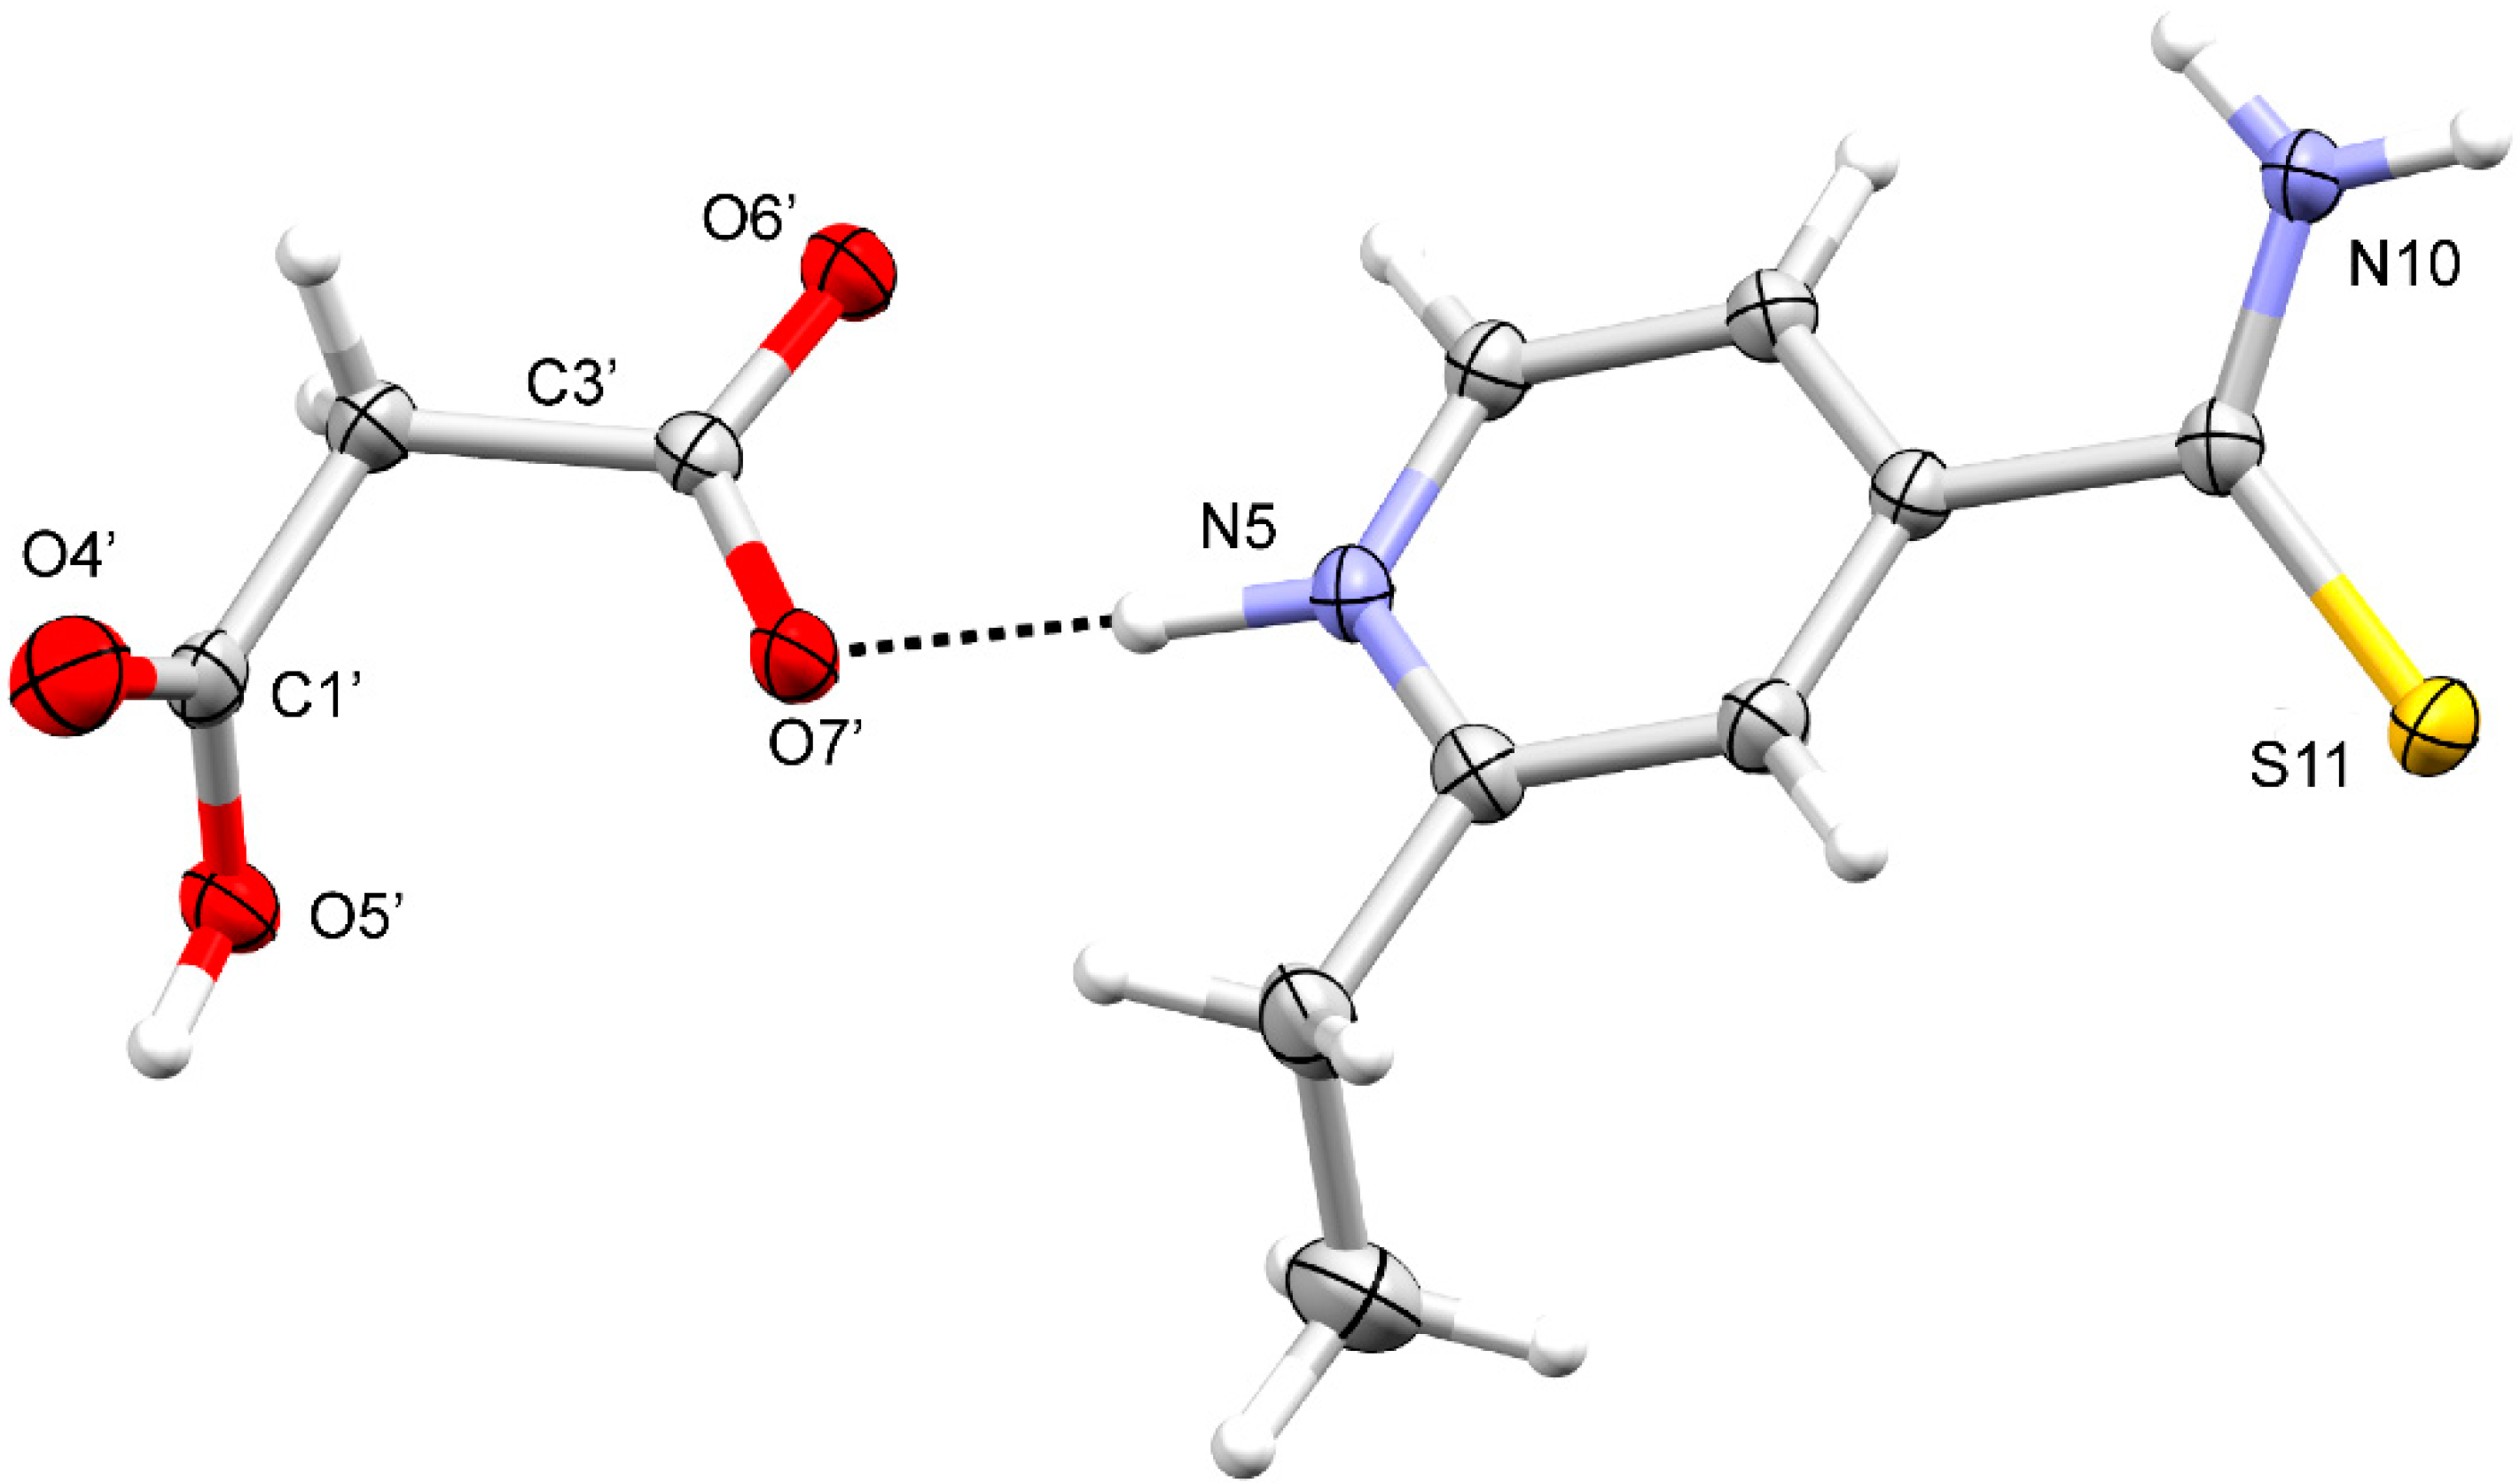
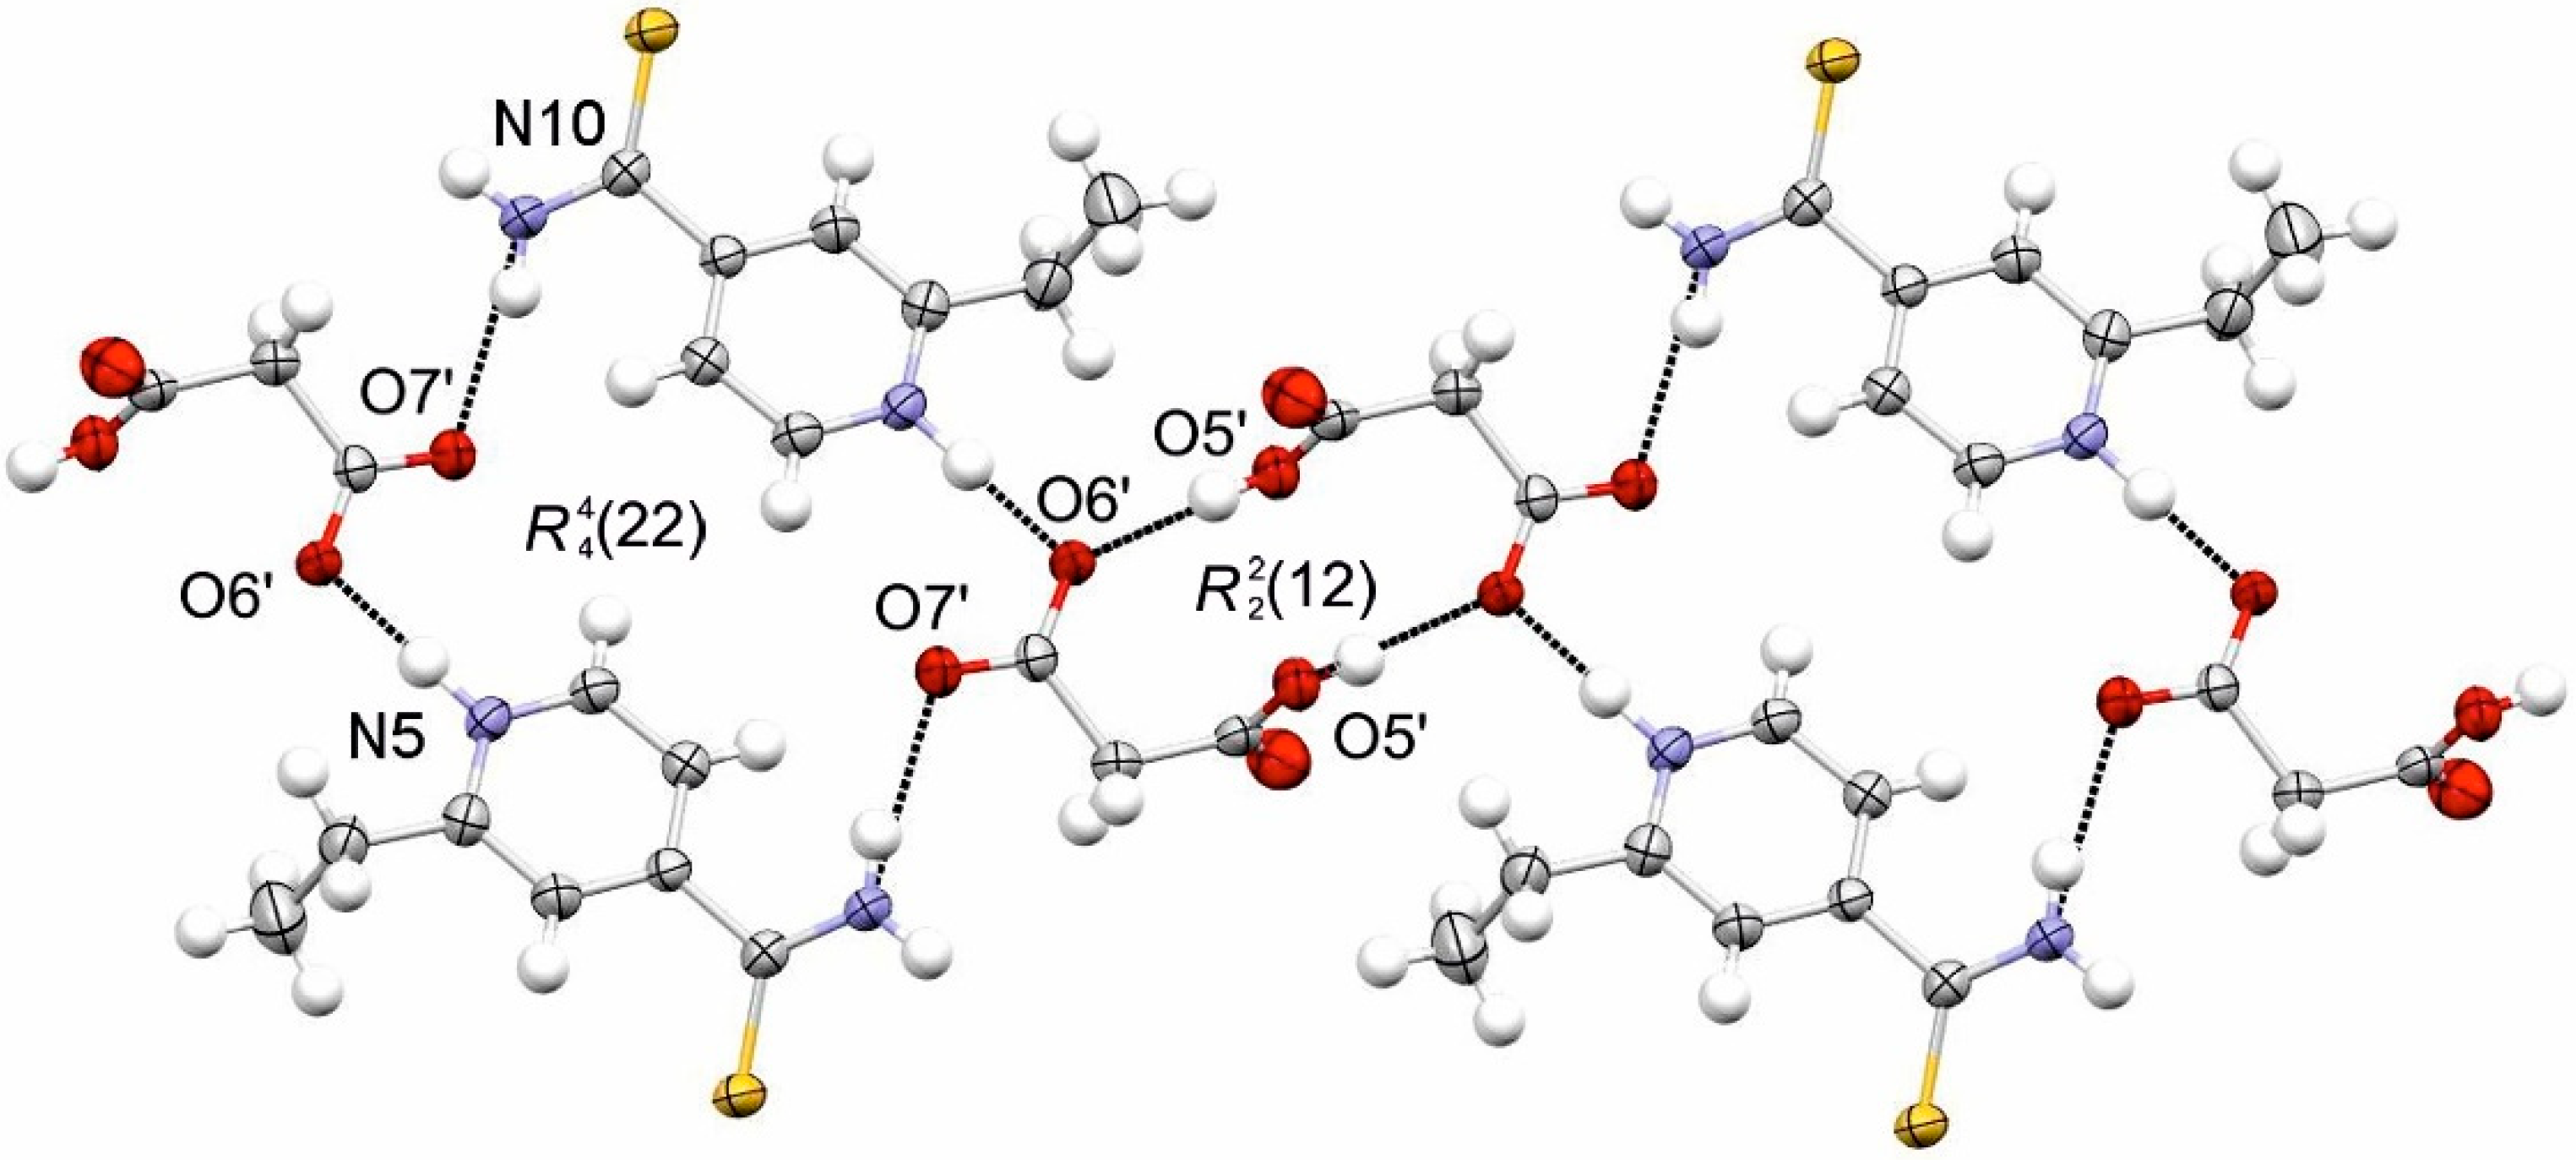
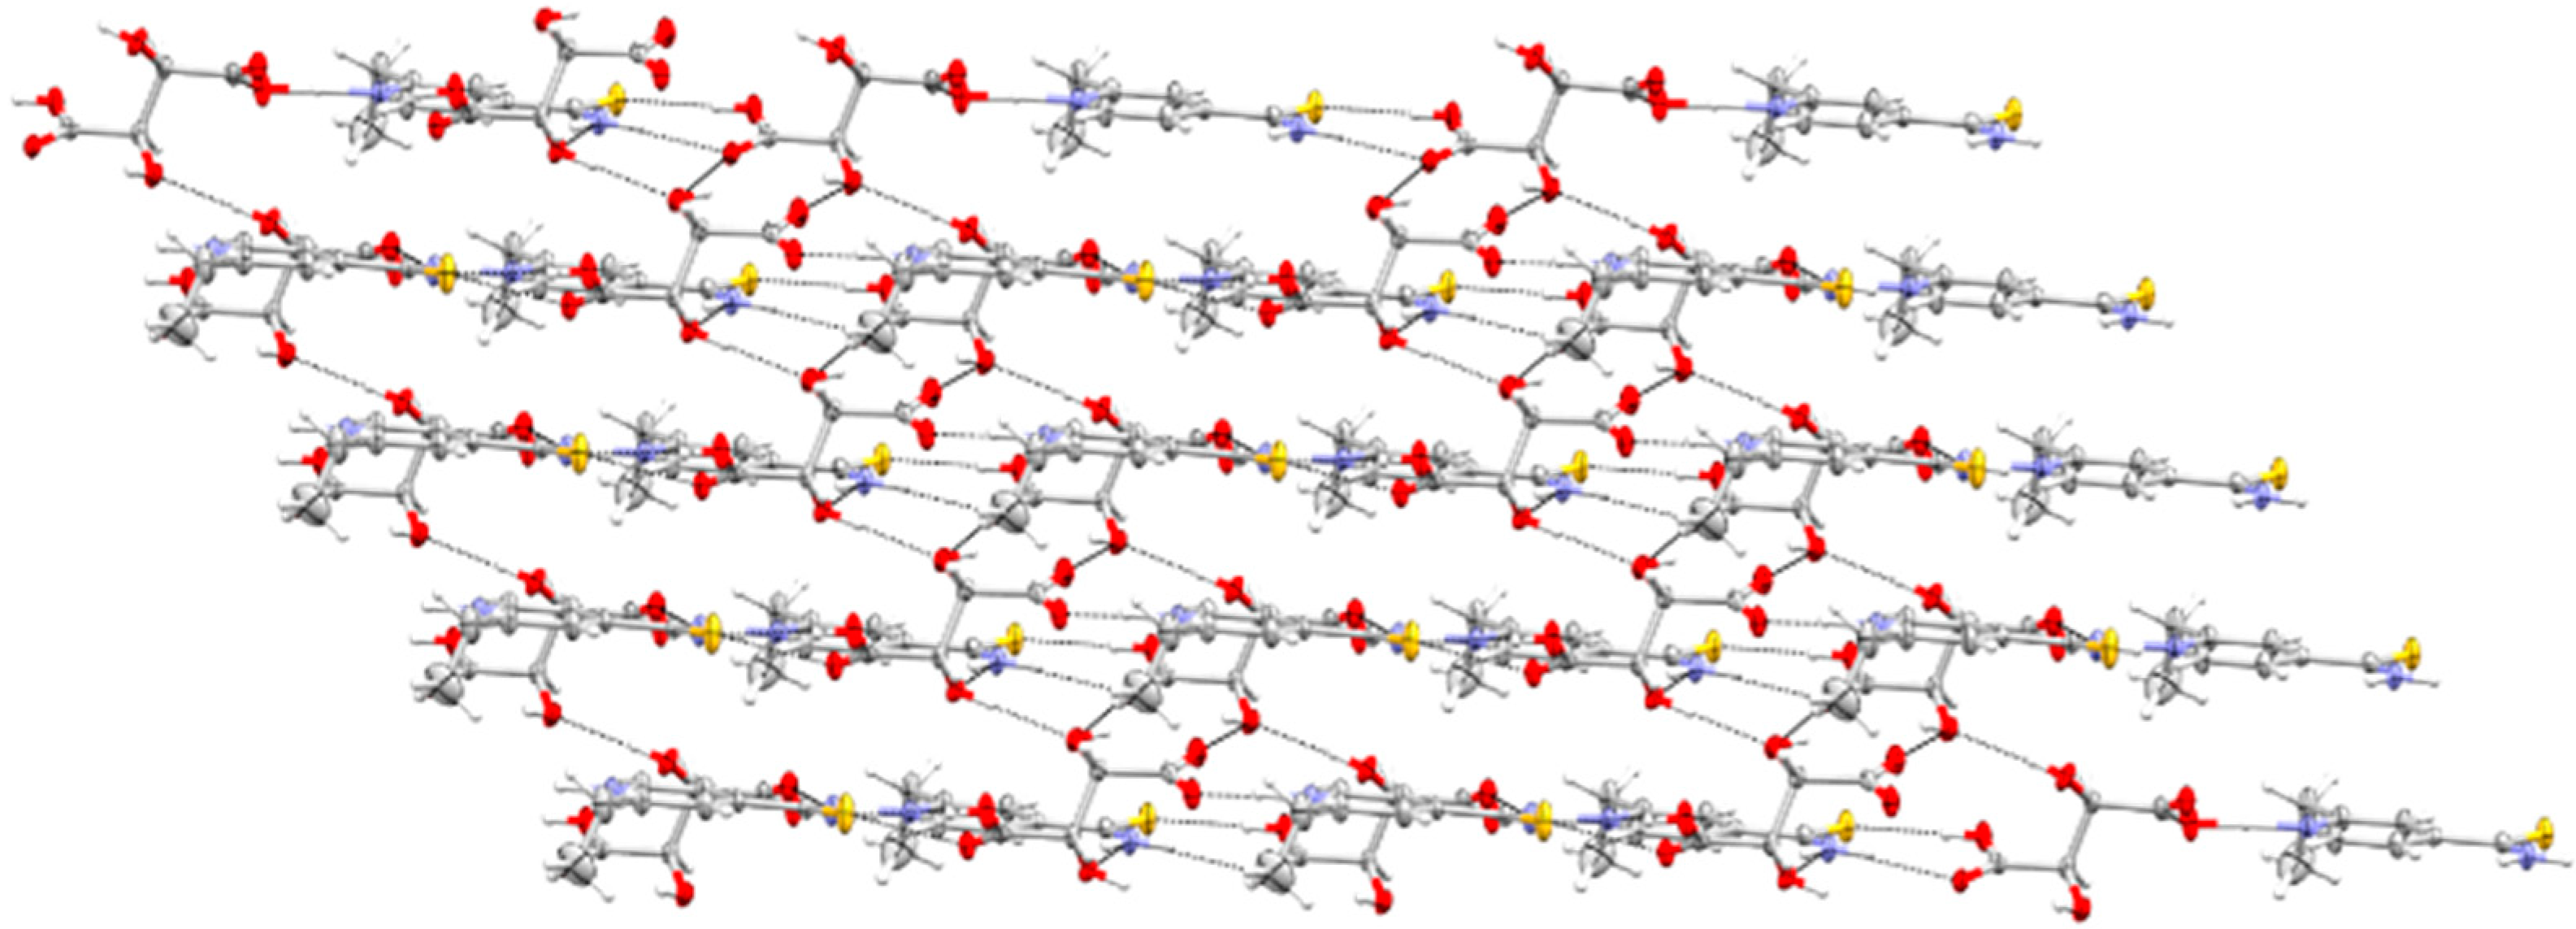
3.1.1. ETN·GLU
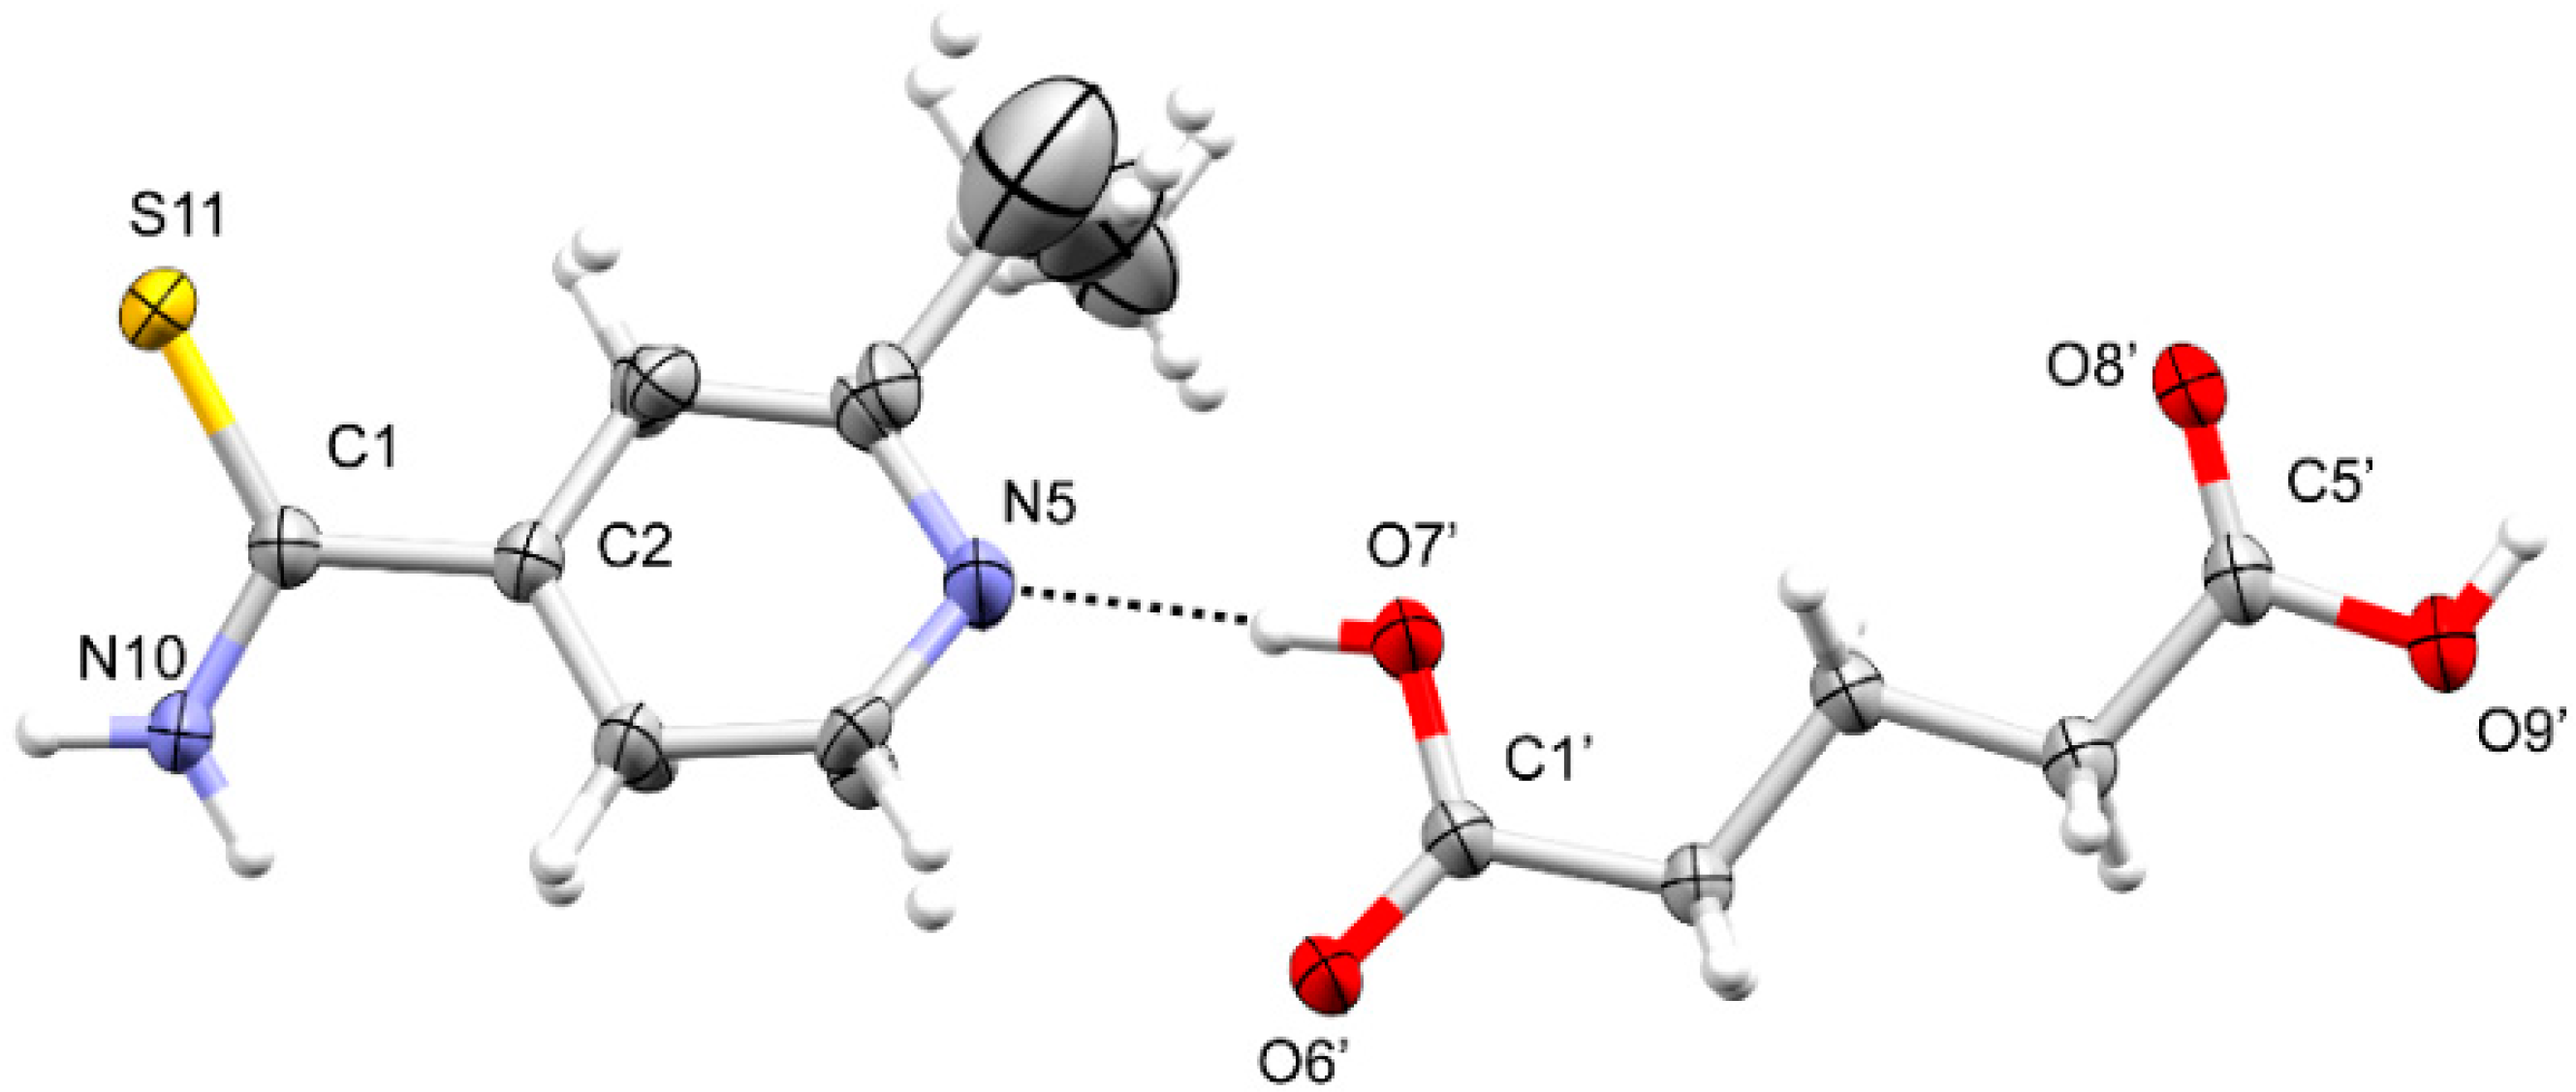
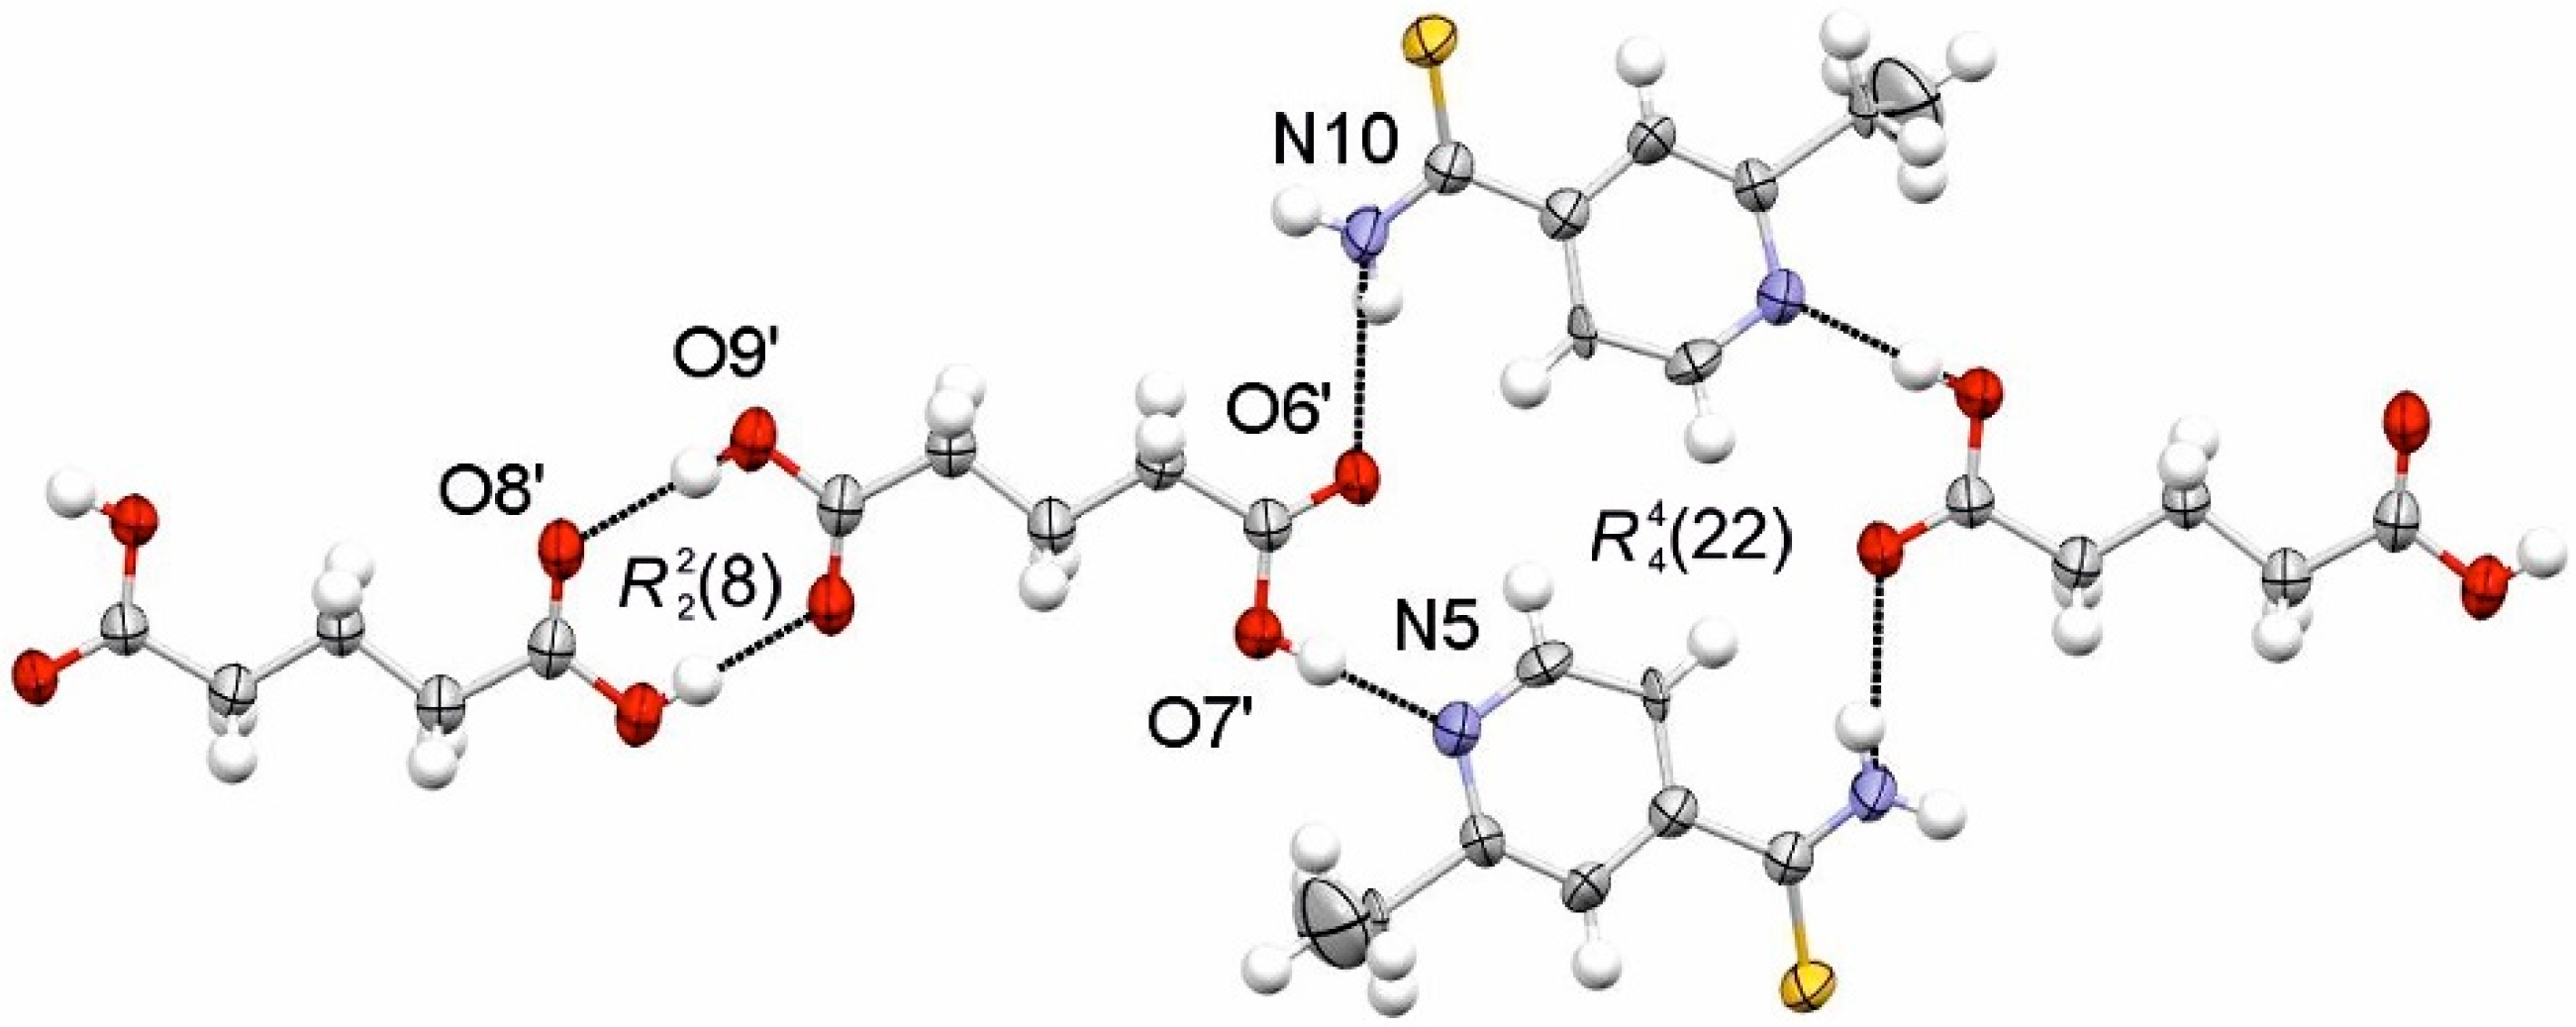
3.1.2. ETN·MAL
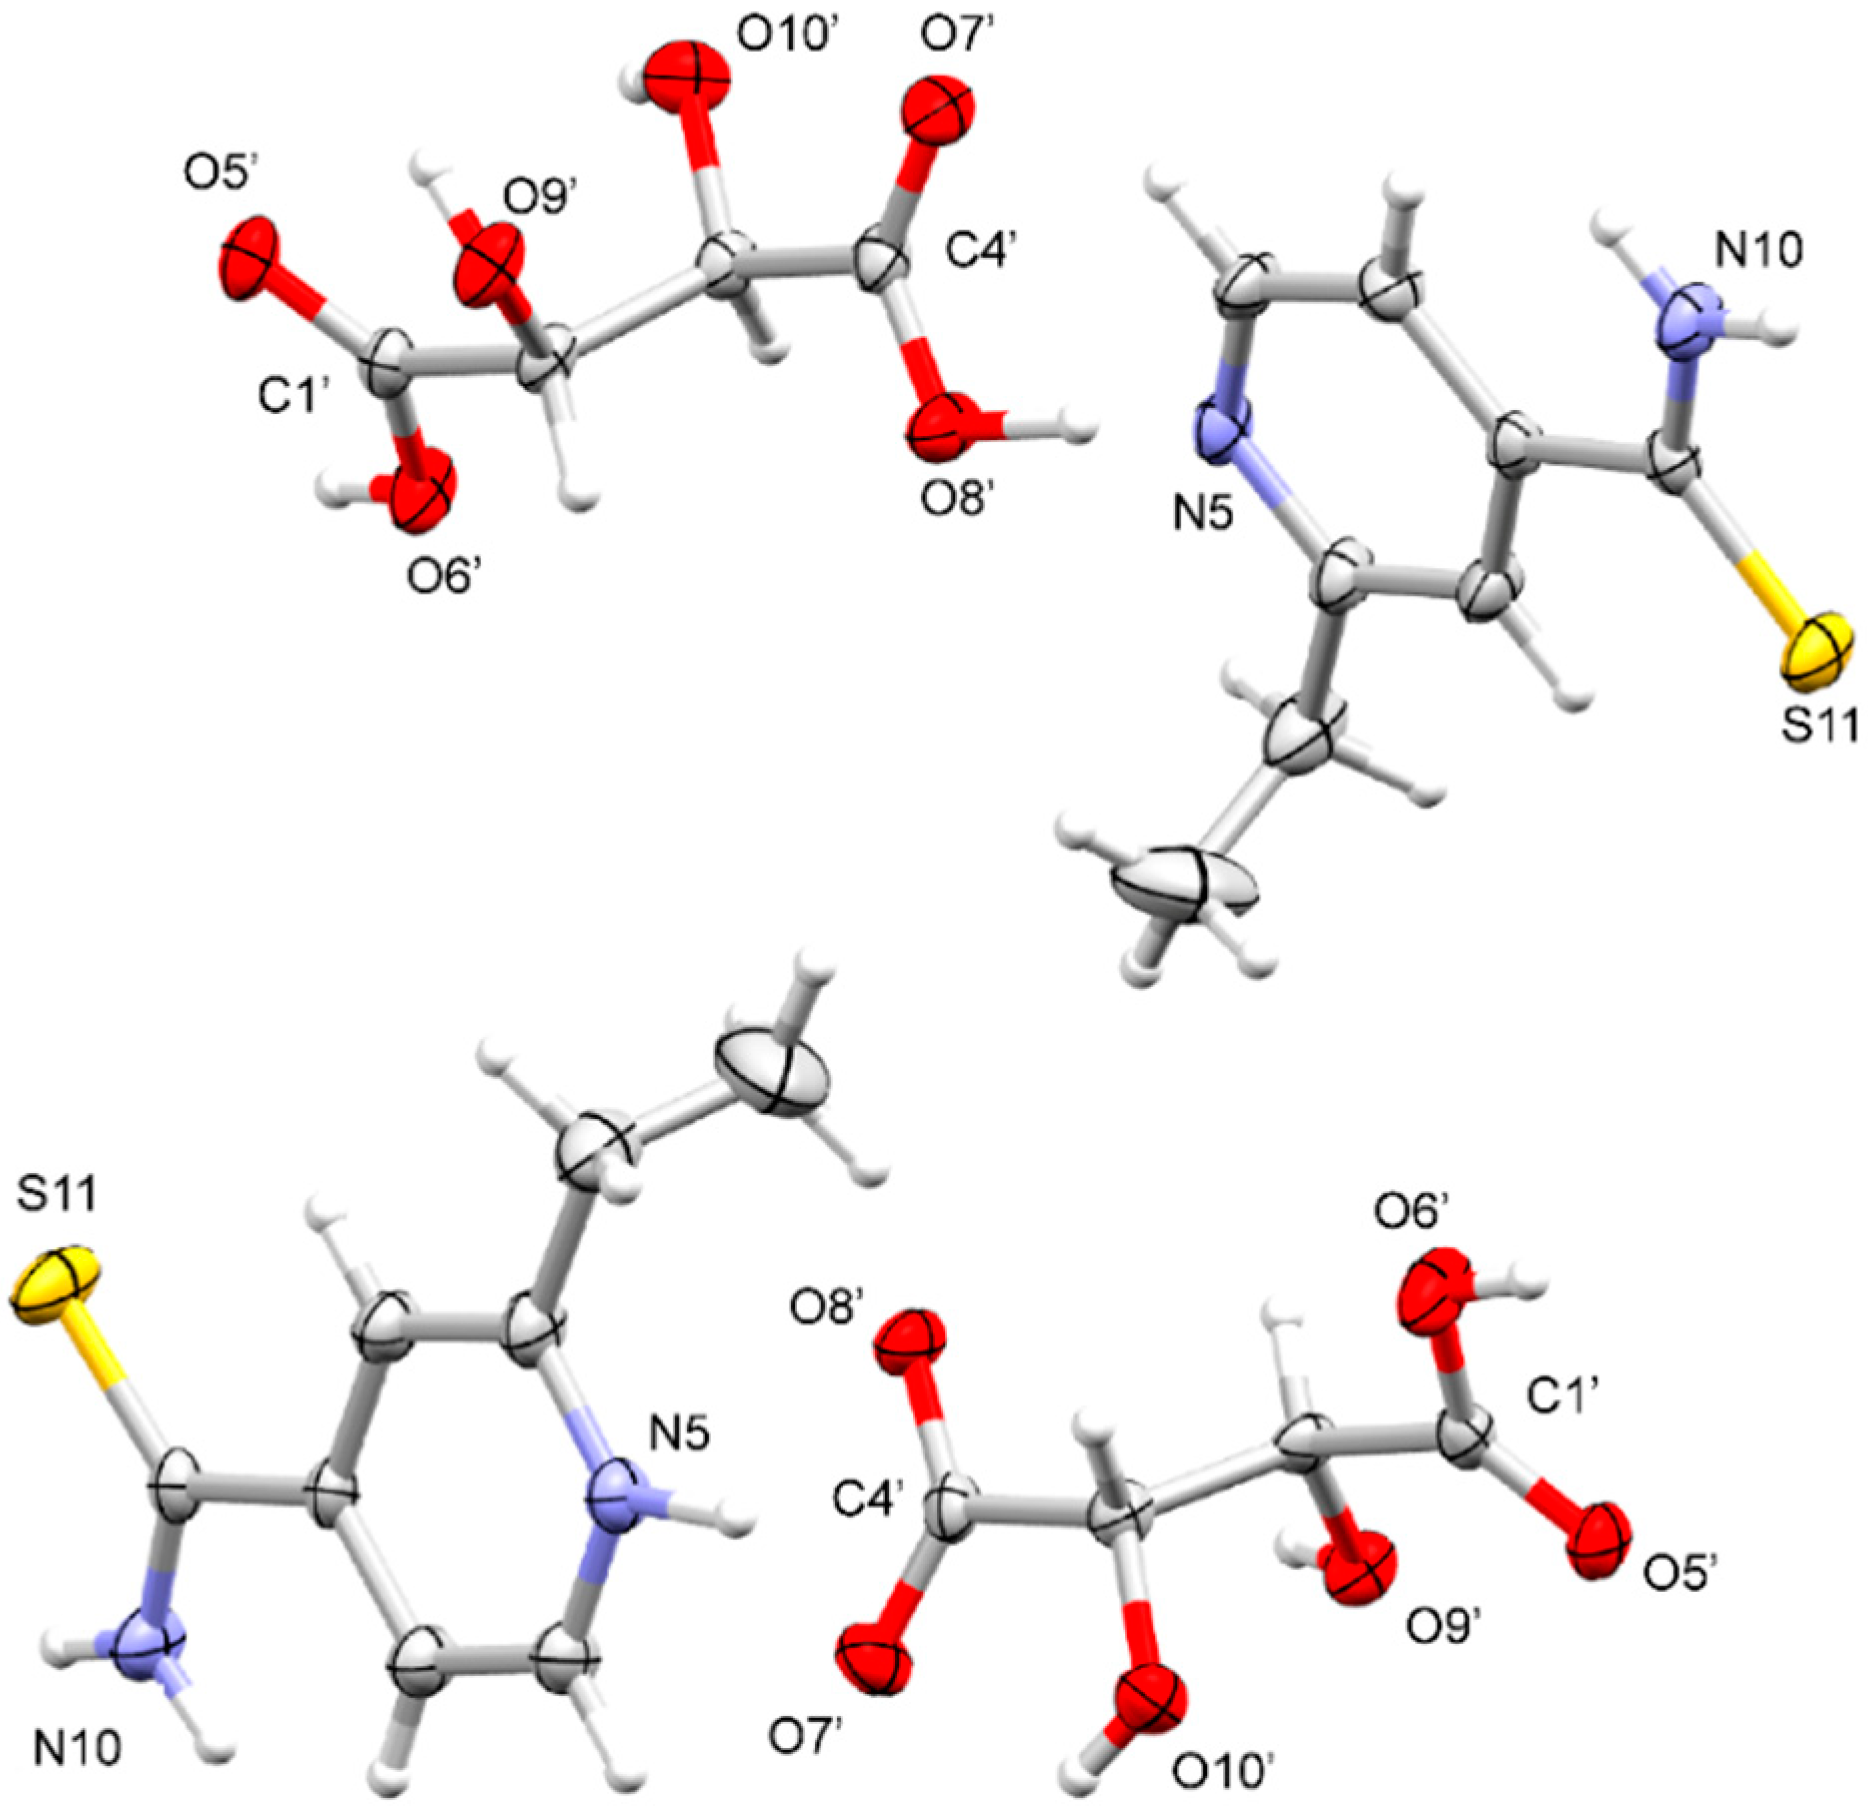
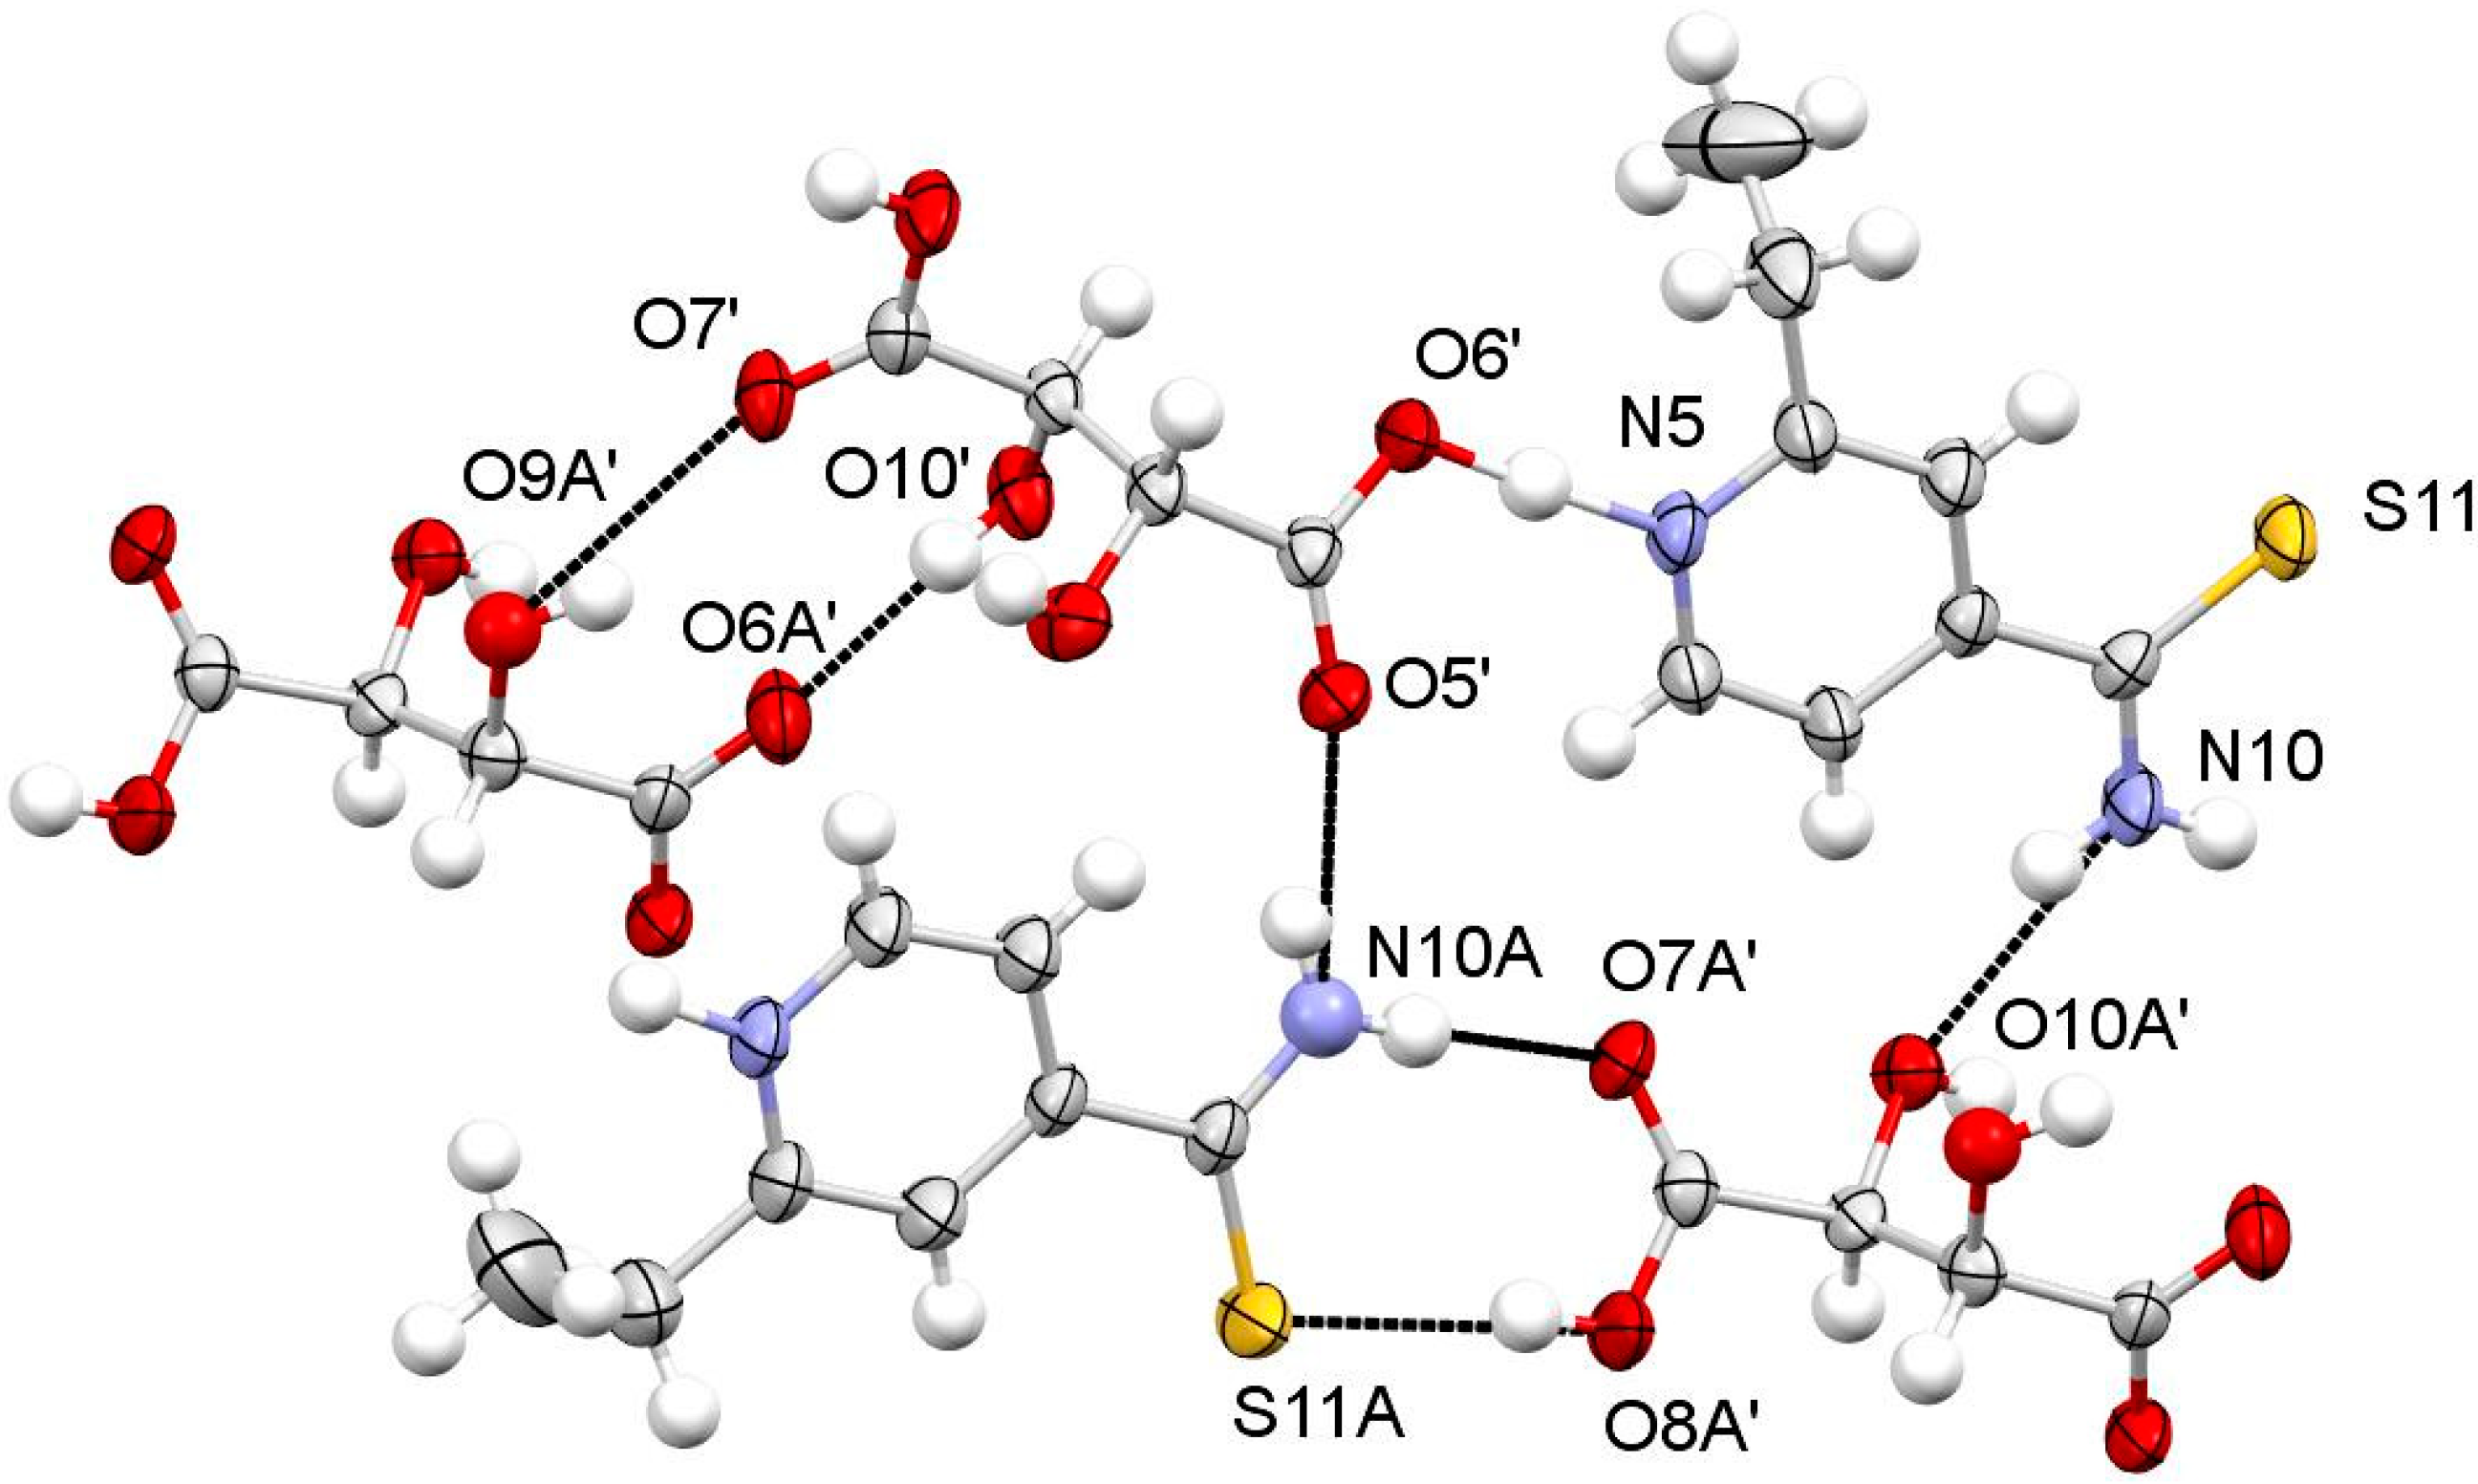
3.1.3. ETN·TAR
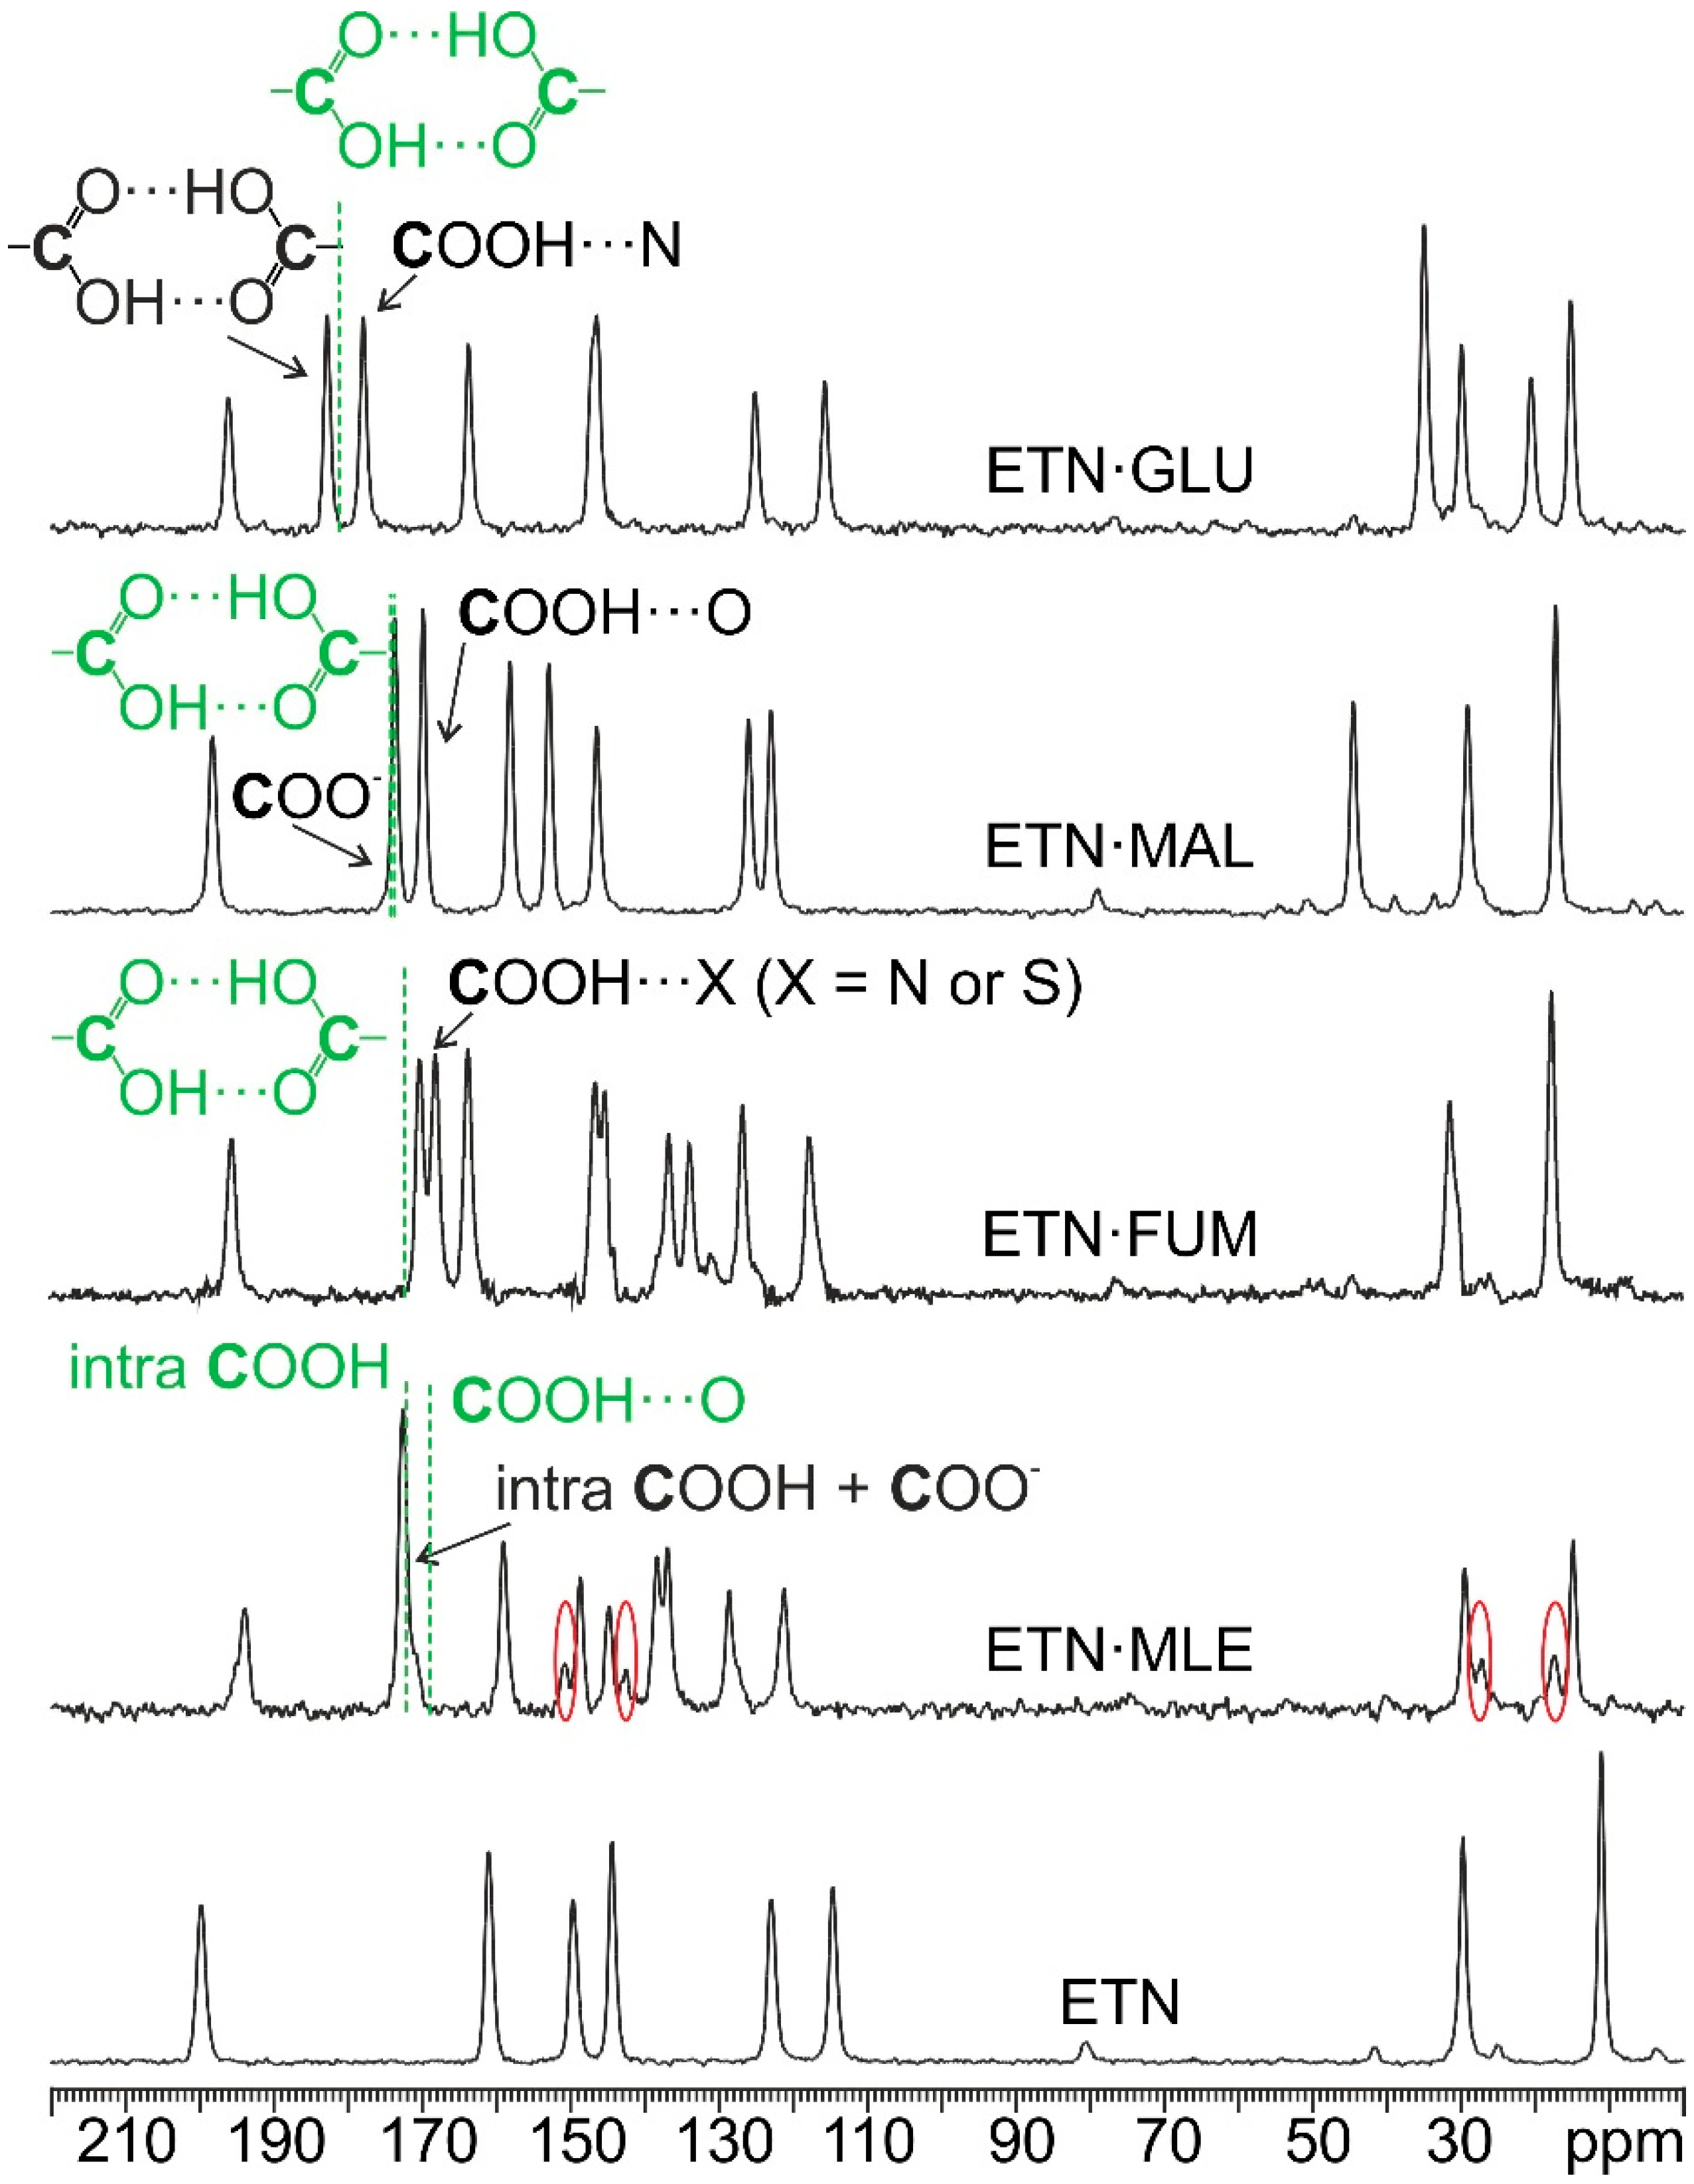
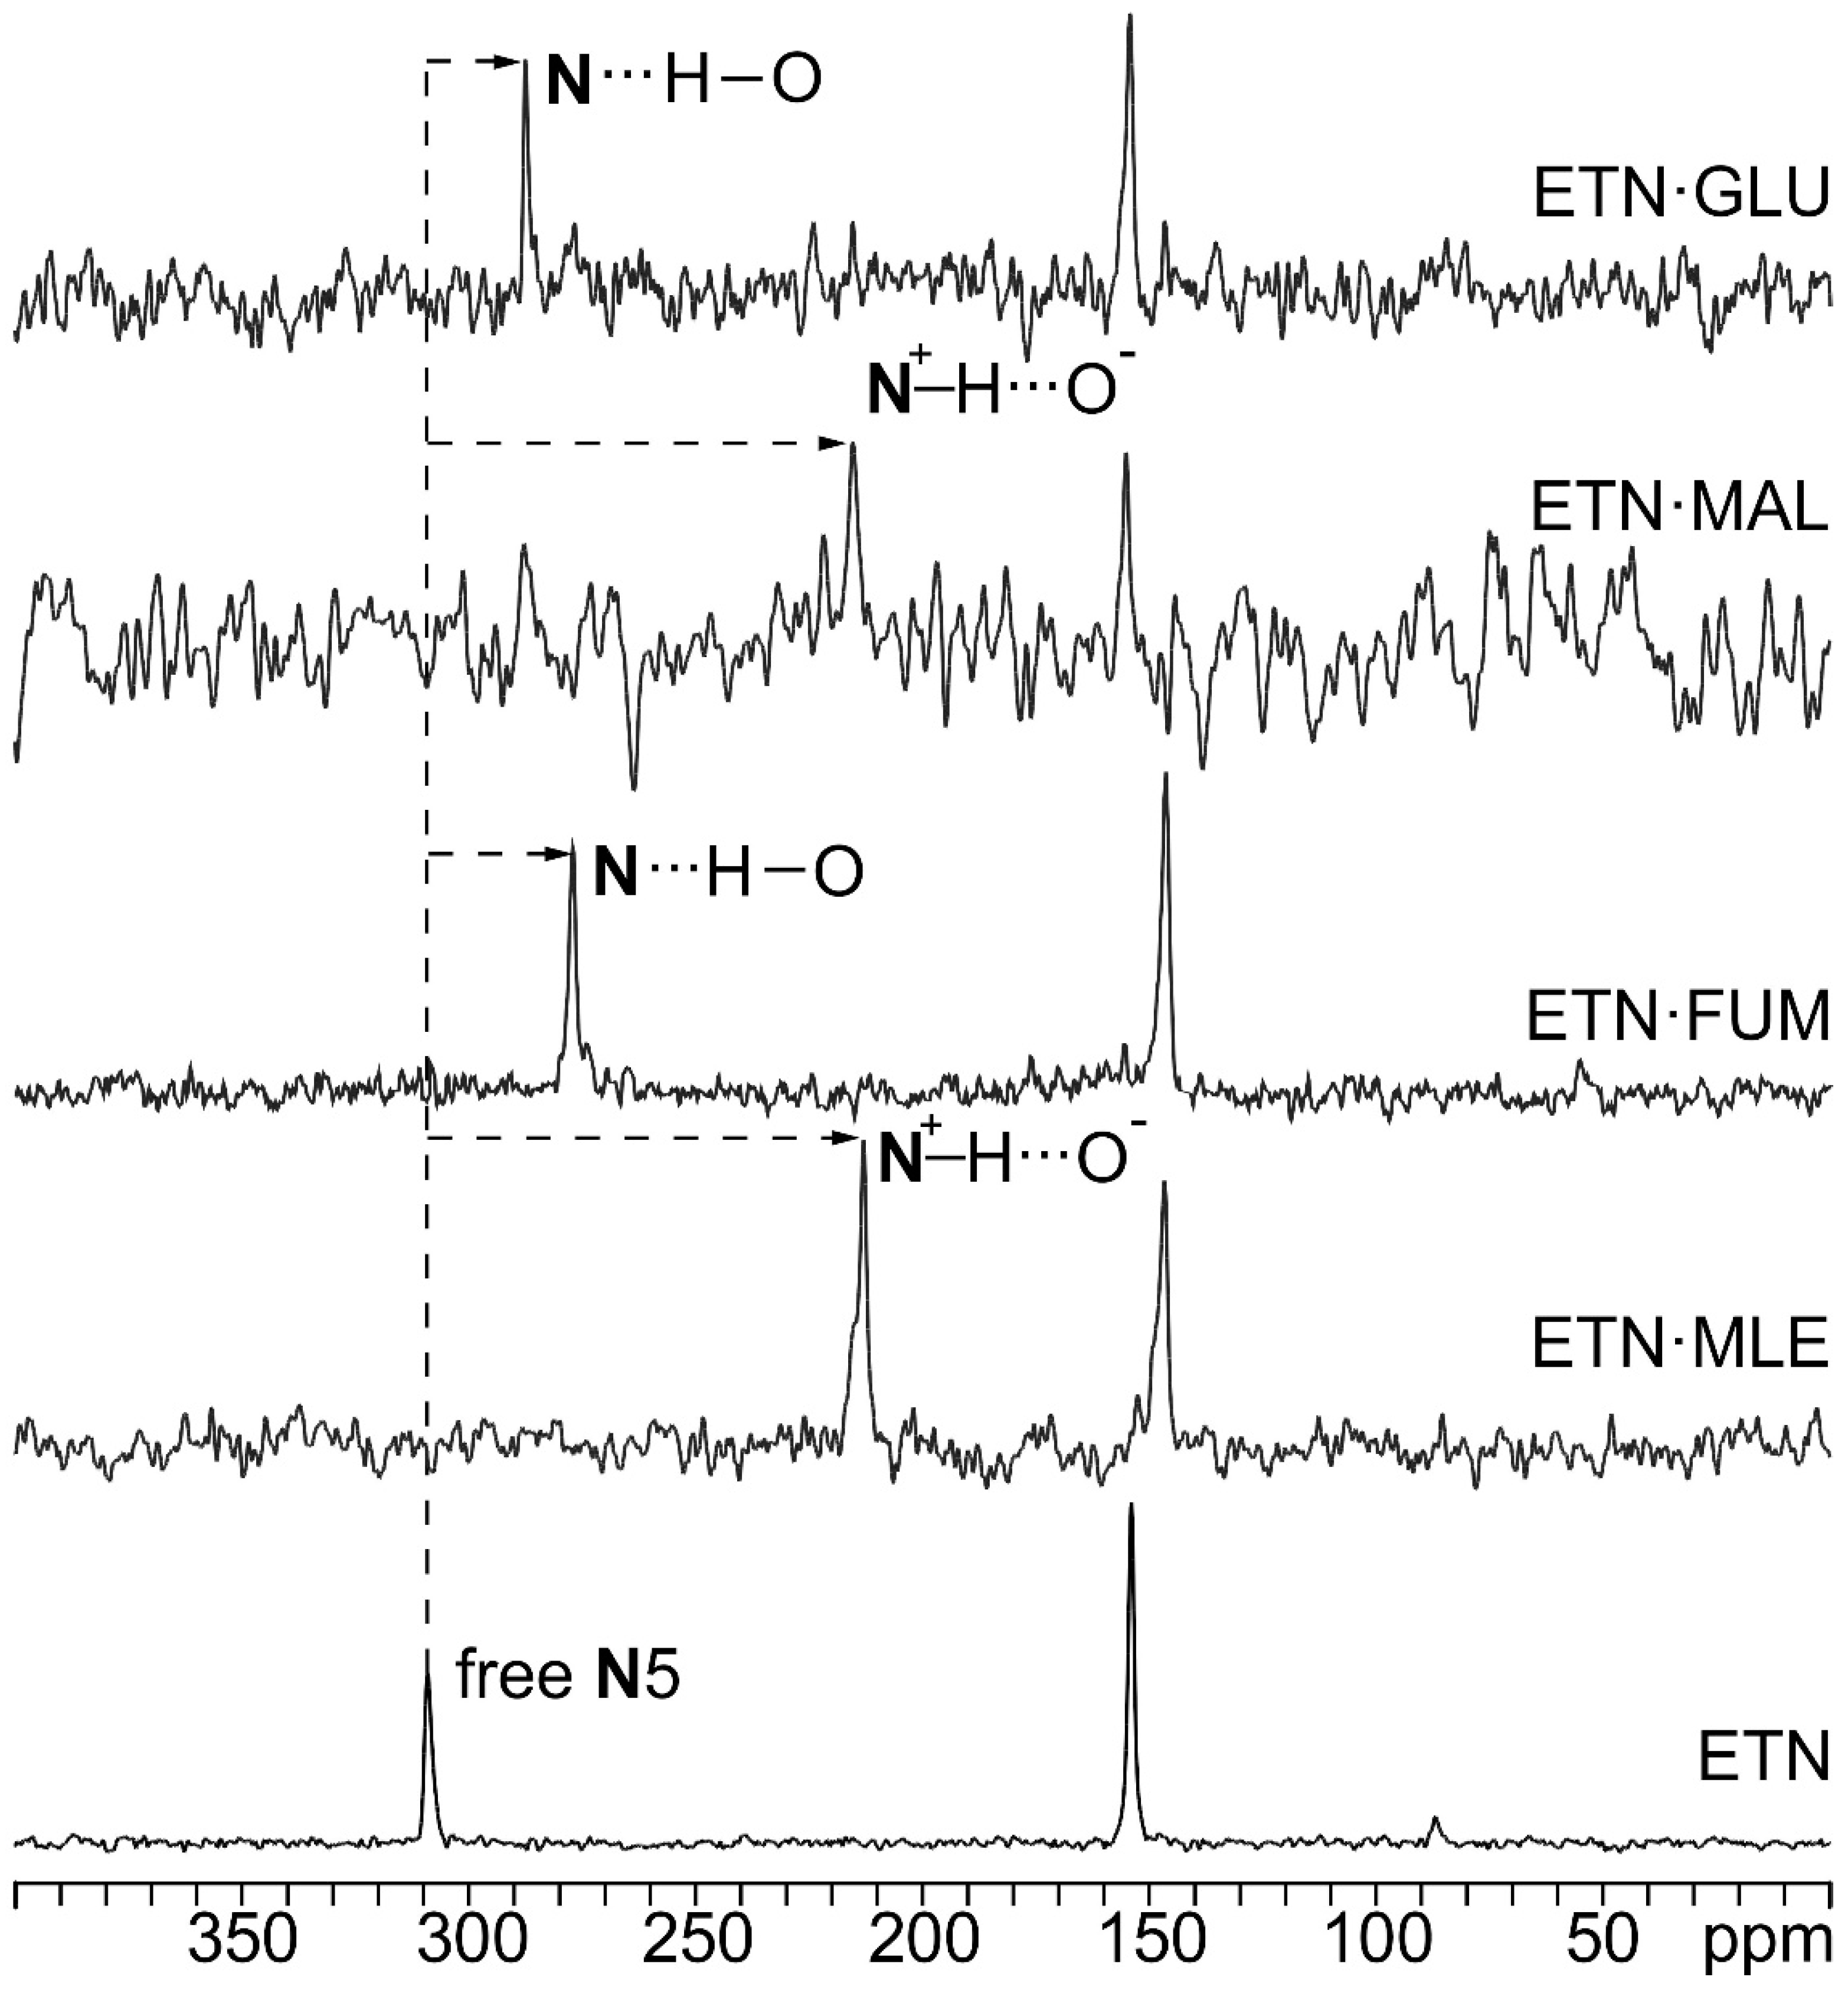
3.2. SSNMR
3.3. Thermal Analyses
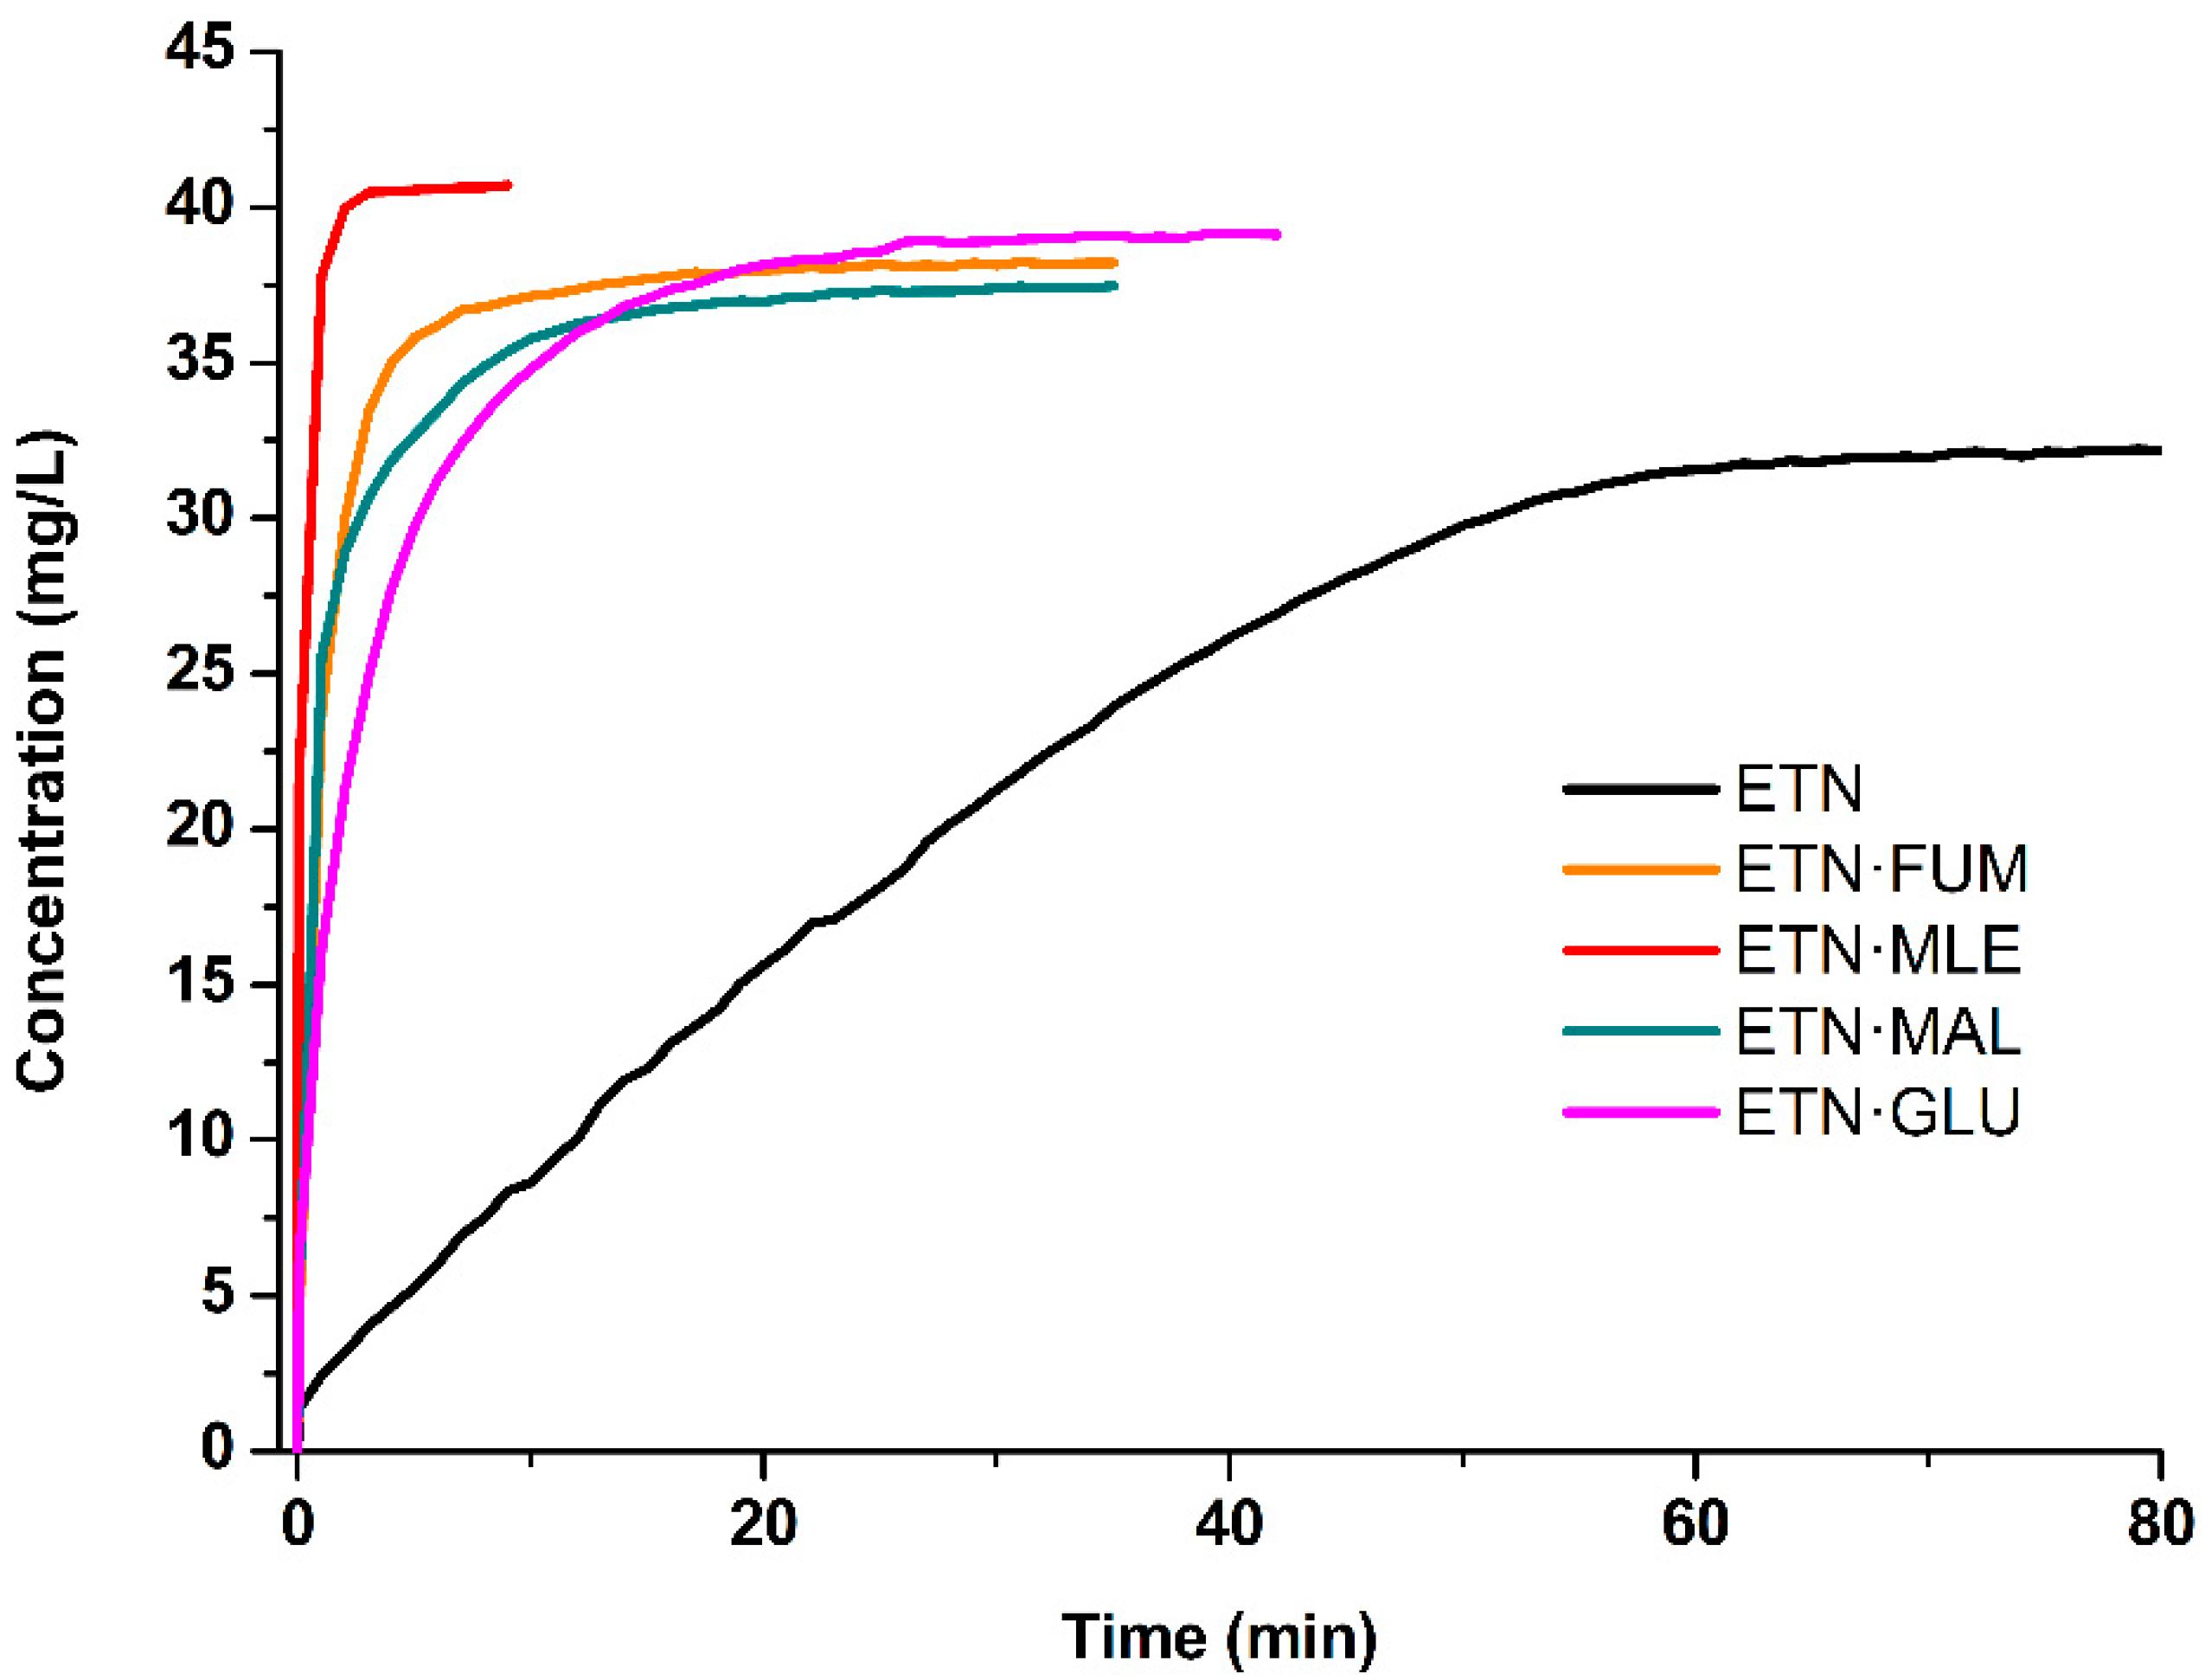
3.4. Dissolution Kinetic Tests
4. Conclusions
Supplementary Materials
Author Contributions
Funding
Acknowledgments
Conflicts of Interest
References
- Desiraju, G.R.; Vittal, J.J.; Ramanan, A. Crystal Engineering: A Textbook; World Scientific Publishing: Singapore, 2011. [Google Scholar] [CrossRef]
- Qiu, H.; Patel, R.B.; Damavarapu, R.S.; Stepanov, V. Nanoscale 2CL-20·HMX high explosive cocrystal synthesized by bead milling. CrystEngComm 2015, 17, 4080–4083. [Google Scholar] [CrossRef]
- Cherukuvada, S.; Kaur, R.; Guru Row, T.N. Co-crystallization and small molecule crystal form diversity: From pharmaceutical to materials applications. CrystEngComm 2016, 18, 8528–8555. [Google Scholar] [CrossRef]
- Grifasi, F.; Chierotti, M.R.; Gaglioti, K.; Gobetto, R.; Maini, L.; Braga, D.; Dichiarante, E.; Curzi, M. Using salt cocrystals to improve the solubility of niclosamide. Cryst. Growth Des. 2015, 15, 1939–1948. [Google Scholar] [CrossRef]
- Gaglioti, K.; Chierotti, M.R.; Grifasi, F.; Gobetto, R.; Griesser, U.J.; Hasa, D.; Voinovich, D. Improvement of the water solubility of tolfenamic acid by new multiple-component crystals produced by mechanochemical methods. CrystEngComm 2014, 16, 8252–8262. [Google Scholar] [CrossRef]
- Golob, S.; Perry, M.; Lusi, M.; Chierotti, M.R.; Grabnar, I.; Lassiani, L.; Voinovich, D.; Zaworotko, M.J. Improving biopharmaceutical properties of vinpocetine through cocrystallization. J. Pharm. Sci. 2016, 105, 1–8. [Google Scholar] [CrossRef]
- Bordignon, S.; Cerreia Vioglio, P.; Priola, E.; Voinovich, D.; Gobetto, R.; Nishiyama, Y.; Chierotti, M.R. Engineering Codrug Solid Forms: Mechanochemical synthesis of an indomethacin−caffeine system. Cryst. Growth Des. 2017, 17, 5744–5752. [Google Scholar] [CrossRef]
- Lu, J.; Rohani, S. Preparation and Characterization of Theophylline−Nicotinamide Cocrystal. Org. Process. Res. Dev. 2009, 13, 1269–1275. [Google Scholar] [CrossRef]
- Braga, D.; Dichiarante, E.; Palladino, G.; Grepioni, F.; Chierotti, M.R.; Gobetto, R.; Pellegrino, L. Remarkable reversal of melting point alternation by co-crystallization. CrystEngComm 2010, 12, 3534–3536. [Google Scholar] [CrossRef]
- Chen, C.; Ghosh, S.; Malla Reddy, C.; Buehler, M.J. Molecular mechanics of elastic and bendable caffeine co-crystals. Phys. Chem. Chem. Phys. 2014, 16, 13165–13171. [Google Scholar] [CrossRef]
- Onakpoya, I.J.; Heneghan, C.J.; Aronson, J.K. Post-marketing withdrawal of 462 medicinal products because of adverse drug reactions: A systematic review of the world literature. BMC Med. 2016, 14. [Google Scholar] [CrossRef] [Green Version]
- DiMasi, J.A.; Grabowski, H.G.; Hansen, R.W. Innovation in the pharmaceutical industry: New estimates of R&D costs. J. Health Econ. 2016, 47, 20–33. [Google Scholar] [CrossRef] [PubMed] [Green Version]
- Griffen, E.J.; Dossetter, A.G.; Leach, A.G.; Montague, S. Can we accelerate medicinal chemistry by augmenting the chemist with Big Data and artificial intelligence? Drug Discov. Today 2018, 23, 1373–1384. [Google Scholar] [CrossRef] [PubMed]
- McNamee, L.M.; Walsh, M.J.; Ledley, F.D. Timelines of translational science: From technology initiation to FDA approval. PLoS ONE 2017, 12, e0177371. [Google Scholar] [CrossRef] [PubMed] [Green Version]
- Domingos, S.; André, V.; Quaresma, S.; Martins, I.C.B.; Minas da Pietade, M.F.; Duarte, M.T. New forms of old drugs: Improving without changing. J. Pharm. Pharmacol. 2015, 67, 830–846. [Google Scholar] [CrossRef]
- Bernasconi, D.; Bordignon, S.; Rossi, F.; Priola, E.; Nervi, C.; Gobetto, R.; Voinovich, D.; Hasa, D.; Tuan Dong, N.; Nishiyama, Y.; et al. Selective synthesis of a salt and a cocrystal of the ethionamide–salicylic acid system. Cryst. Growth Des. 2020, 20, 906–915. [Google Scholar] [CrossRef]
- Surov, A.O.; Solanko, K.A.; Bond, A.D.; Bauer-Brandl, A.; Perlovich, G.L. Cocrystals of the antiandrogenic drug bicalutamide: Screening, crystal structures, formation thermodynamics and lattice energies. CrystEngComm 2016, 18, 4818–4829. [Google Scholar] [CrossRef]
- Diniz, L.F.; Souza, M.S.; Carvalho, P.S., Jr.; da Silva, C.C.P.; D’Vries, R.F.; Ellena, J. Novel isoniazid cocrystals with aromatic carboxylic acids: Crystal engineering, spectroscopy and thermochemical investigations. J. Mol. Struct. 2018, 1153, 58–68. [Google Scholar] [CrossRef]
- Takuria, R.; Sarma, B. Drug-drug and drug-nutraceutical cocrystal/salt as alternative medicine for combination therapy: A crystal engineering approach. Crystals 2018, 8, 101. [Google Scholar] [CrossRef] [Green Version]
- Grecu, T.; Adams, H.; Hunter, C.A.; McCabe, J.F.; Portell, A.; Prohens, R. Virtual screening identifies new cocrystals of nalidixic acid. Cryst. Growth Des. 2014, 14, 1749–1755. [Google Scholar] [CrossRef]
- Adebayo Adebisi, Y.; Agumage, I.; Sylvanus, T.D.; Nawaila, I.J.; Ekwere, W.A.; Nasiru, M.; Okon, E.E.; Ekpenyong, A.M.; Lucero-Prisno III, D.E. Burden of tuberculosis and challenges facing its eradication in West Africa. Int. J. Infect. 2019, 6, e92250–e92257. [Google Scholar] [CrossRef] [Green Version]
- Allèaume, M.; Leroy, F.; Gadret, M.; Goursolle, M. Structure cristalline de composés antituberculeux. IV. Structure cristalline de l’ethyl-2 thiocarbamoyl-4 pyridine. Acta Crystallogr. Sect. B 1973, 29, 1994–2000. [Google Scholar] [CrossRef]
- Colleter, J.C.; Gadret, M. Structure cristalline de composés antituberculeux. I. Structure cristalline du chlorhydrate d’éthionamide. Acta Crystallogr. Sect. B 1968, 24, 513–519. [Google Scholar] [CrossRef] [PubMed]
- Colleter, J.C.; Gadret, M. Structure cristalline de composés antituberculeux. II. Structure cristalline du bromhydrate d’éthionamide. Comparaison avec celle du chlorhydrate d’éthionamide. Acta Crystallogr. Sect. B 1968, 24, 519–525. [Google Scholar] [CrossRef] [PubMed]
- Diniz, L.F.; Carvalho, P.S., Jr.; de Melo, C.C.; Ellena, J. Development of a salt drug with improved solubility: Ethionamide nitrate. J. Mol. Struct. 2017, 1137, 119–125. [Google Scholar] [CrossRef]
- Chaitanya Mannava, M.K.; Suresh, K.; Nangia, A. Enhanced bioavailability in the oxalate salt of the anti-tuberculosis drug ethionamide. Cryst. Growth Des. 2016, 16, 1591–1598. [Google Scholar] [CrossRef]
- De Melo, C.C.; da Silva, C.C.P.; Pereira, C.C.S.S.; Rosa, P.C.P.; Ellena, J. Mechanochemistry applied to reformulation and scale-up production of ethionamide: Salt selection and solubility enhancement. Eur. J. Pharm. Sci. 2016, 81, 149–156. [Google Scholar] [CrossRef]
- Khandavilli, U.B.R.; Lusi, M.; Bhogala, B.R.; Maguire, A.R.; Stein, M. Diversity in a simple co-crystal: Racemic and kryptoracemic behaviour. Chem. Commun. 2016, 52, 8309–8312. [Google Scholar] [CrossRef] [Green Version]
- Flack, H.D.; Bernardinelli, G.; Clemente, D.A.; Linden, A.; Spek, A.L. Centrosymmetric and pseudo-centrosymmetric structures refined as non-centrosymmetric. Acta Crystallogr. Sect. B 2006, 62, 695–701. [Google Scholar] [CrossRef]
- Capillas, C.; Tasci, E.S.; de la Flor, G.; Orobengoa, D.; Perez-Mato, J.M.; Aroyo, M.I. A new computer tool at the Bilbao Crystallographic Server to detect and characterize pseudosymmetry. Z. Krist. 2011, 226, 186–196. [Google Scholar] [CrossRef]
- Fábián, L.; Brock, C.P. A list of organic kryptoracemates. Acta Crystallogr. Sect. B 2010, 66, 94–103. [Google Scholar] [CrossRef]
- Bernal, I.; Watkins, S. A list of organometallic kryptoracemates. Acta Crystallogr. Sect. C 2015, 71, 216–221. [Google Scholar] [CrossRef] [PubMed]
- Gautier, R.; Klingsporn, J.M.; Van Duyne, R.P.; Poeppelmeier, K.R. Optical activity from racemates. Nat. Mater. 2016, 15, 591–592. [Google Scholar] [CrossRef] [PubMed]
- Gautier, R.; Norquist, A.J.; Poeppelmeier, K.R. From racemic units to polar materials. Cryst. Growth Des. 2012, 12, 6267–6271. [Google Scholar] [CrossRef] [Green Version]
- Dalhus, B.; Görbitz, C.H. Non-centrosymmetric racemates: Space-group frequencies and conformational similarities between crystallographically independent molecules. Acta Crystallogr. Sect. B 2000, 56, 715–719. [Google Scholar] [CrossRef] [PubMed]
- Vogt, F.G.; Clawson, J.S.; Strohmeier, M.; Edwards, A.J.; Pham, T.N.; Watson, S.A. Solid-state NMR analysis of organic cocrystals and complexes. Cryst. Growth Des. 2009, 9, 921–937. [Google Scholar] [CrossRef]
- Cerreia Vioglio, P.; Chierotti, M.R.; Gobetto, R. Pharmaceutical aspects of salt and cocrystal forms of APIs and characterization challenges. Adv. Drug Deliv. Rev. 2017, 117, 86–110. [Google Scholar] [CrossRef]
- Xu, Y.; Southern, S.A.; Szell, P.M.J.; Bryce, D.L. The role of solid-state nuclear magnetic resonance in crystal engineering. CrystEngComm 2016, 18, 5236–5252. [Google Scholar] [CrossRef]
- Gumbert, S.D.; Körbitzer, M.; Alig, E.; Schmidt, M.U.; Chierotti, M.R.; Gobetto, R.; Li, X.; van de Streek, J. Crystal structure and tautomerism of Pigment Yellow 138 determined by X-ray powder diffraction and solid-state NMR. Dyes Pigment. 2016, 131, 364–372. [Google Scholar] [CrossRef]
- Espeau, P.; Négrier, P.; Corvis, Y. Crystallographic and pressure–temperature state diagram approach for the phase behavior and polymorphism study of glutaric acid. Cryst. Growth Des. 2013, 13, 723–730. [Google Scholar] [CrossRef] [Green Version]
- Goedkoop, J.A.; MacGillavry, C.H. The crystal structure of malonic acid. Acta Crystallogr. 1957, 10, 125–127. [Google Scholar] [CrossRef]
- Bednowitz, A.L.; Post, B. Direct determination of the crystal structure of β-fumaric acid. Acta Crystallogr. 1966, 21, 566–571. [Google Scholar] [CrossRef]
- Shahat, M. The crystal and molecular structure of maleic acid. Acta Crystallogr. 1952, 5, 763–768. [Google Scholar] [CrossRef]
- Fahmy, S.; Abu-Gharbieh, E. In vitro dissolution and in vivo bioavailability of six brands of ciprofloxacin tablets administered in rabbits and their pharmacokinetic modeling. BioMed Res. Int. 2014, 590848. [Google Scholar] [CrossRef] [Green Version]


| ETN·GLU | |
| Empirical formula | C13H18N2O4S |
| Formula weight | 298.35 |
| Temperature/K | 293(2) |
| Crystal system | triclinic |
| Space group | P-1 |
| a/Å | 5.3818(3) |
| b/Å | 11.4336(6) |
| c/Å | 13.2901(9) |
| α/° | 78.196(5) |
| β/° | 80.618(5) |
| γ/° | 77.435(5) |
| Volume/Å3 | 775.28(8) |
| Z | 2 |
| ρcalcg/cm3 | 1.278 |
| μ/mm−1 | 0.222 |
| F(000) | 316.0 |
| Crystal size/mm3 | 0.50 × 0.22 × 0.21 |
| Radiation | Mo Kα (λ = 0.71073) |
| 2Θ range for data collection/° | 6.74 to 50.06 |
| Index ranges | −6 ≤ h ≤ 6, −13 ≤ k ≤ 13, −14 ≤ l ≤ 15 |
| Reflections collected | 5457 |
| Independent reflections | 2739 (Rint = 0.0228, Rsigma = 0.0543) |
| Data/restraints/parameters | 2739/25/238 |
| Goodness-of-fit on F2 | 1.043 |
| Final R indexes [I >= 2σ (I)] | R1 = 0.0448, wR2 = 0.1131 |
| Final R indexes [all data] | R1 = 0.0593, wR2 = 0.1236 |
| Largest diff. peak/hole/e Å−3 | 0.18/−0.18 |
| ETN·MAL | |
| Empirical formula | C11H14N2O4S |
| Formula weight | 270.30 |
| Temperature/K | 293(2) |
| Crystal system | triclinic |
| Space group | P-1 |
| a/Å | 7.0008(12) |
| b/Å | 8.8110(13) |
| c/Å | 11.1507(13) |
| α/° | 88.116(11) |
| β/° | 77.358(12) |
| γ/° | 68.930(15) |
| Volume/Å3 | 625.48(16) |
| Z | 2 |
| ρcalcg/cm3 | 1.435 |
| μ/mm−1 | 0.267 |
| F(000) | 284.0 |
| Crystal size/mm3 | 0.256 × 0.210 × 0.203 |
| Radiation | Mo Kα (λ = 0.71073) |
| 2Θ range for data collection/° | 6.66 to 50.04 |
| Index ranges | −8 ≤ h ≤ 7, −10 ≤ k ≤ 10, −13 ≤ l ≤ 10 |
| Reflections collected | 4108 |
| Independent reflections | 2204 (Rint = 0.0343, Rsigma = 0.0743) |
| Data/restraints/parameters | 2204/0/170 |
| Goodness-of-fit on F2 | 1.038 |
| Final R indexes [I >= 2σ (I)] | R1 = 0.0422, wR2 = 0.0974 |
| Final R indexes [all data] | R1 = 0.0551, wR2 = 0.1065 |
| Largest diff. peak/hole/e Å−3 | 0.19/−0.23 |
| ETN·TAR | |
| Empirical formula | C24H32N4O12S2 |
| Formula weight | 632.66 |
| Temperature/K | 293(2) |
| Crystal system | monoclinic |
| Space group | P21 |
| a/Å | 4.8561(3) |
| b/Å | 24.2003(13) |
| c/Å | 12.1304(6) |
| α/° | 90.00 |
| β/° | 92.671(5) |
| γ/° | 90.00 |
| Volume/Å3 | 1424.00(14) |
| Z | 2 |
| ρcalcg/cm3 | 1.475 |
| μ/mm−1 | 0.257 |
| F(000) | 664.0 |
| Crystal size/mm3 | 0.42 × 0.41 × 0.21 |
| Radiation | Mo Kα (λ = 0.71073) |
| 2Θ range for data collection/° | 6.72 to 50.04 |
| Index ranges | −4 ≤ h ≤ 5, −28 ≤ k ≤ 26, −14 ≤ l ≤ 14 |
| Reflections collected | 11036 |
| Independent reflections | 4925 (Rint = 0.0420, Rsigma = 0.0) |
| Data/restraints/parameters | 4925/1/395 |
| Goodness-of-fit on F2 | 1.036 |
| Final R indexes [I >=2σ (I)] | R1 = 0.0475, wR2 = 0.0852 |
| Final R indexes [all data] | R1 = 0.0659, wR2 = 0.0918 |
| Largest diff. peak/hole/e Å−3 | 0.23/−0.22 |
| Flack parameter | 0.07(7) |
| Crystal Form | Preparation Technique | Final Stoichiometry | Outcome |
|---|---|---|---|
| ETN∙GLU | Dry grinding | 1:1 | Cocrystal |
| ETN∙MAL | Slurry in ethanol | 1:1 | Salt |
| ETN∙TAR | Slow evaporation from methanol | 1:1 | Salt cocrystal |
| Atom | ETN (ppm) | MAL (ppm) | GLU (ppm) | MLE (ppm) | FUM (ppm) | ETN·MAL (ppm) | ETN·GLU (ppm) | ETN·MLE (ppm) | ETN·FUM (ppm) |
|---|---|---|---|---|---|---|---|---|---|
| 13C | |||||||||
| 1 | 199.7 | 198.1 | 196.0 | 193.8 | 195.3 | ||||
| 2 | 149.6 | 152.8 | 147.0 | 148.6 | 146.4 | ||||
| 3 | 122.9 | 125.9 | 125.1 | 128.5 | 126.6 | ||||
| 4 | 161.0 | 158.0 | 163.6 | 159.0 | 163.5 | ||||
| 6 | 144.4 | 146.4 | 146.4 | 144.7 | 144.9 | ||||
| 7 | 114.6 | 122.9 | 115.7 | 121.1 | 117.6 | ||||
| 8 | 29.7 | 29.1 | 29.9 | 29.5 | 31.3 | ||||
| 9 | 11.1 | 17.2 | 15.2 | 14.9 | 17.6 | ||||
| 1’ | 174.3 | 181.4 | 169.2 | 172.3 | 169.8 | 177.8 | 172.5 | 167.9 | |
| 2’ | 40.6 | 33.8 | 133.1 | 136.2 | 44.5 | 34.9 | 136.8 | 133.7 | |
| 3’ | 174.8 | 18.7 | 140.0 | 136.2 | 173.6 | 20.6 | 138.2 | 136.4 | |
| 4’ | 33.8 | 172.7 | 172.3 | 34.9 | 172.5 | 170.0 | |||
| 5’ | 181.4 | 182.7 | |||||||
| 15N | |||||||||
| 5 | 308.9 | 215.4 | 287.4 | 212.7 | 276.9 | ||||
| 10 | 153.8 | 154.6 | 153.8 | 146.2 | 146.2 | ||||
| TGA Onset Points (°C) | DSC Signal Max (°C) | ||
|---|---|---|---|
| ETN | 195.1 | ETN | 165.6 |
| ETN·FUM | 183.6 | ETN·FUM | 148.9 |
| ETN·GLU | 191.0 | ETN·GLU | 105.6 |
| ETN·MLE | 162.8 | ETN·MLE | 142.3 |
| ETN·MAL | 165.2 | ETN·MAL | 95.2 |
| AUC/AUCETN | |
|---|---|
| ETN·FUM | 2.7 |
| ETN·GLU | 2.3 |
| ETN·MLE | 7.8 |
| ETN·MAL | 2.6 |
© 2020 by the authors. Licensee MDPI, Basel, Switzerland. This article is an open access article distributed under the terms and conditions of the Creative Commons Attribution (CC BY) license (http://creativecommons.org/licenses/by/4.0/).
Share and Cite
Bordignon, S.; Cerreia Vioglio, P.; Amadio, E.; Rossi, F.; Priola, E.; Voinovich, D.; Gobetto, R.; Chierotti, M.R. Molecular Crystal Forms of Antitubercular Ethionamide with Dicarboxylic Acids: Solid-State Properties and a Combined Structural and Spectroscopic Study. Pharmaceutics 2020, 12, 818. https://doi.org/10.3390/pharmaceutics12090818
Bordignon S, Cerreia Vioglio P, Amadio E, Rossi F, Priola E, Voinovich D, Gobetto R, Chierotti MR. Molecular Crystal Forms of Antitubercular Ethionamide with Dicarboxylic Acids: Solid-State Properties and a Combined Structural and Spectroscopic Study. Pharmaceutics. 2020; 12(9):818. https://doi.org/10.3390/pharmaceutics12090818
Chicago/Turabian StyleBordignon, Simone, Paolo Cerreia Vioglio, Elena Amadio, Federica Rossi, Emanuele Priola, Dario Voinovich, Roberto Gobetto, and Michele R. Chierotti. 2020. "Molecular Crystal Forms of Antitubercular Ethionamide with Dicarboxylic Acids: Solid-State Properties and a Combined Structural and Spectroscopic Study" Pharmaceutics 12, no. 9: 818. https://doi.org/10.3390/pharmaceutics12090818