Progressing Towards the Sustainable Development of Cream Formulations

Abstract
:
1. Introduction
2. Materials
3. Methods
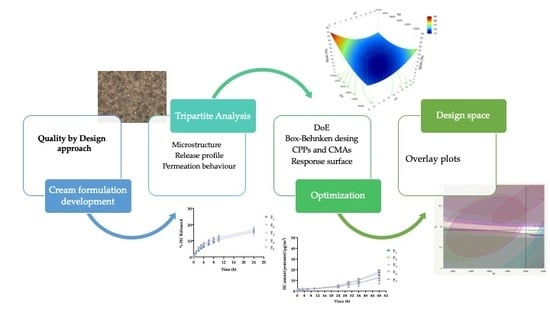
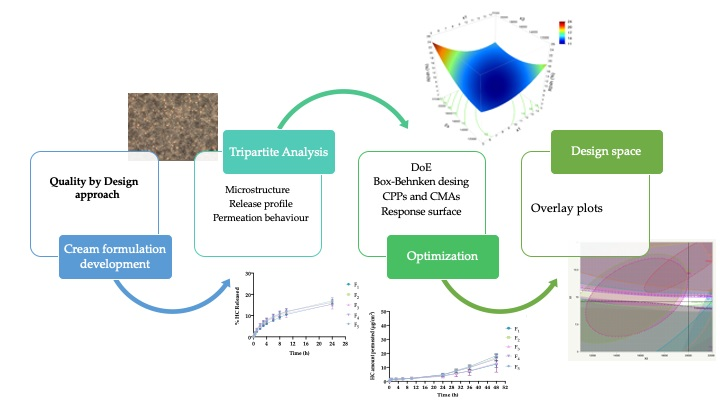
3.1. Quality by Design Approach
3.1.1. Definition of QTPP
3.1.2. Identification of CQAs
3.1.3. Initial Risk Assessment
3.1.4. DoE
3.1.5. Optimization Process
3.2. Preparation of Hydrocortisone Cream Formulations
3.3. Drug Content
3.4. pH
3.5. Droplet Size
3.6. Rheological Aspects
3.6.1. Rotational Measurements
3.6.2. Oscillatory Measurements
3.7. In Vitro Release Studies
3.8. In Vitro Permeation Studies
3.9. Stability Analysis
3.10. Statistical Analysis
4. Results and Discussion
4.1. Definition of QTPP and CQAs Identification
4.2. Initial Risk Assessment
4.3. Scrutinizing DoE
4.3.1. Statistical Analysis
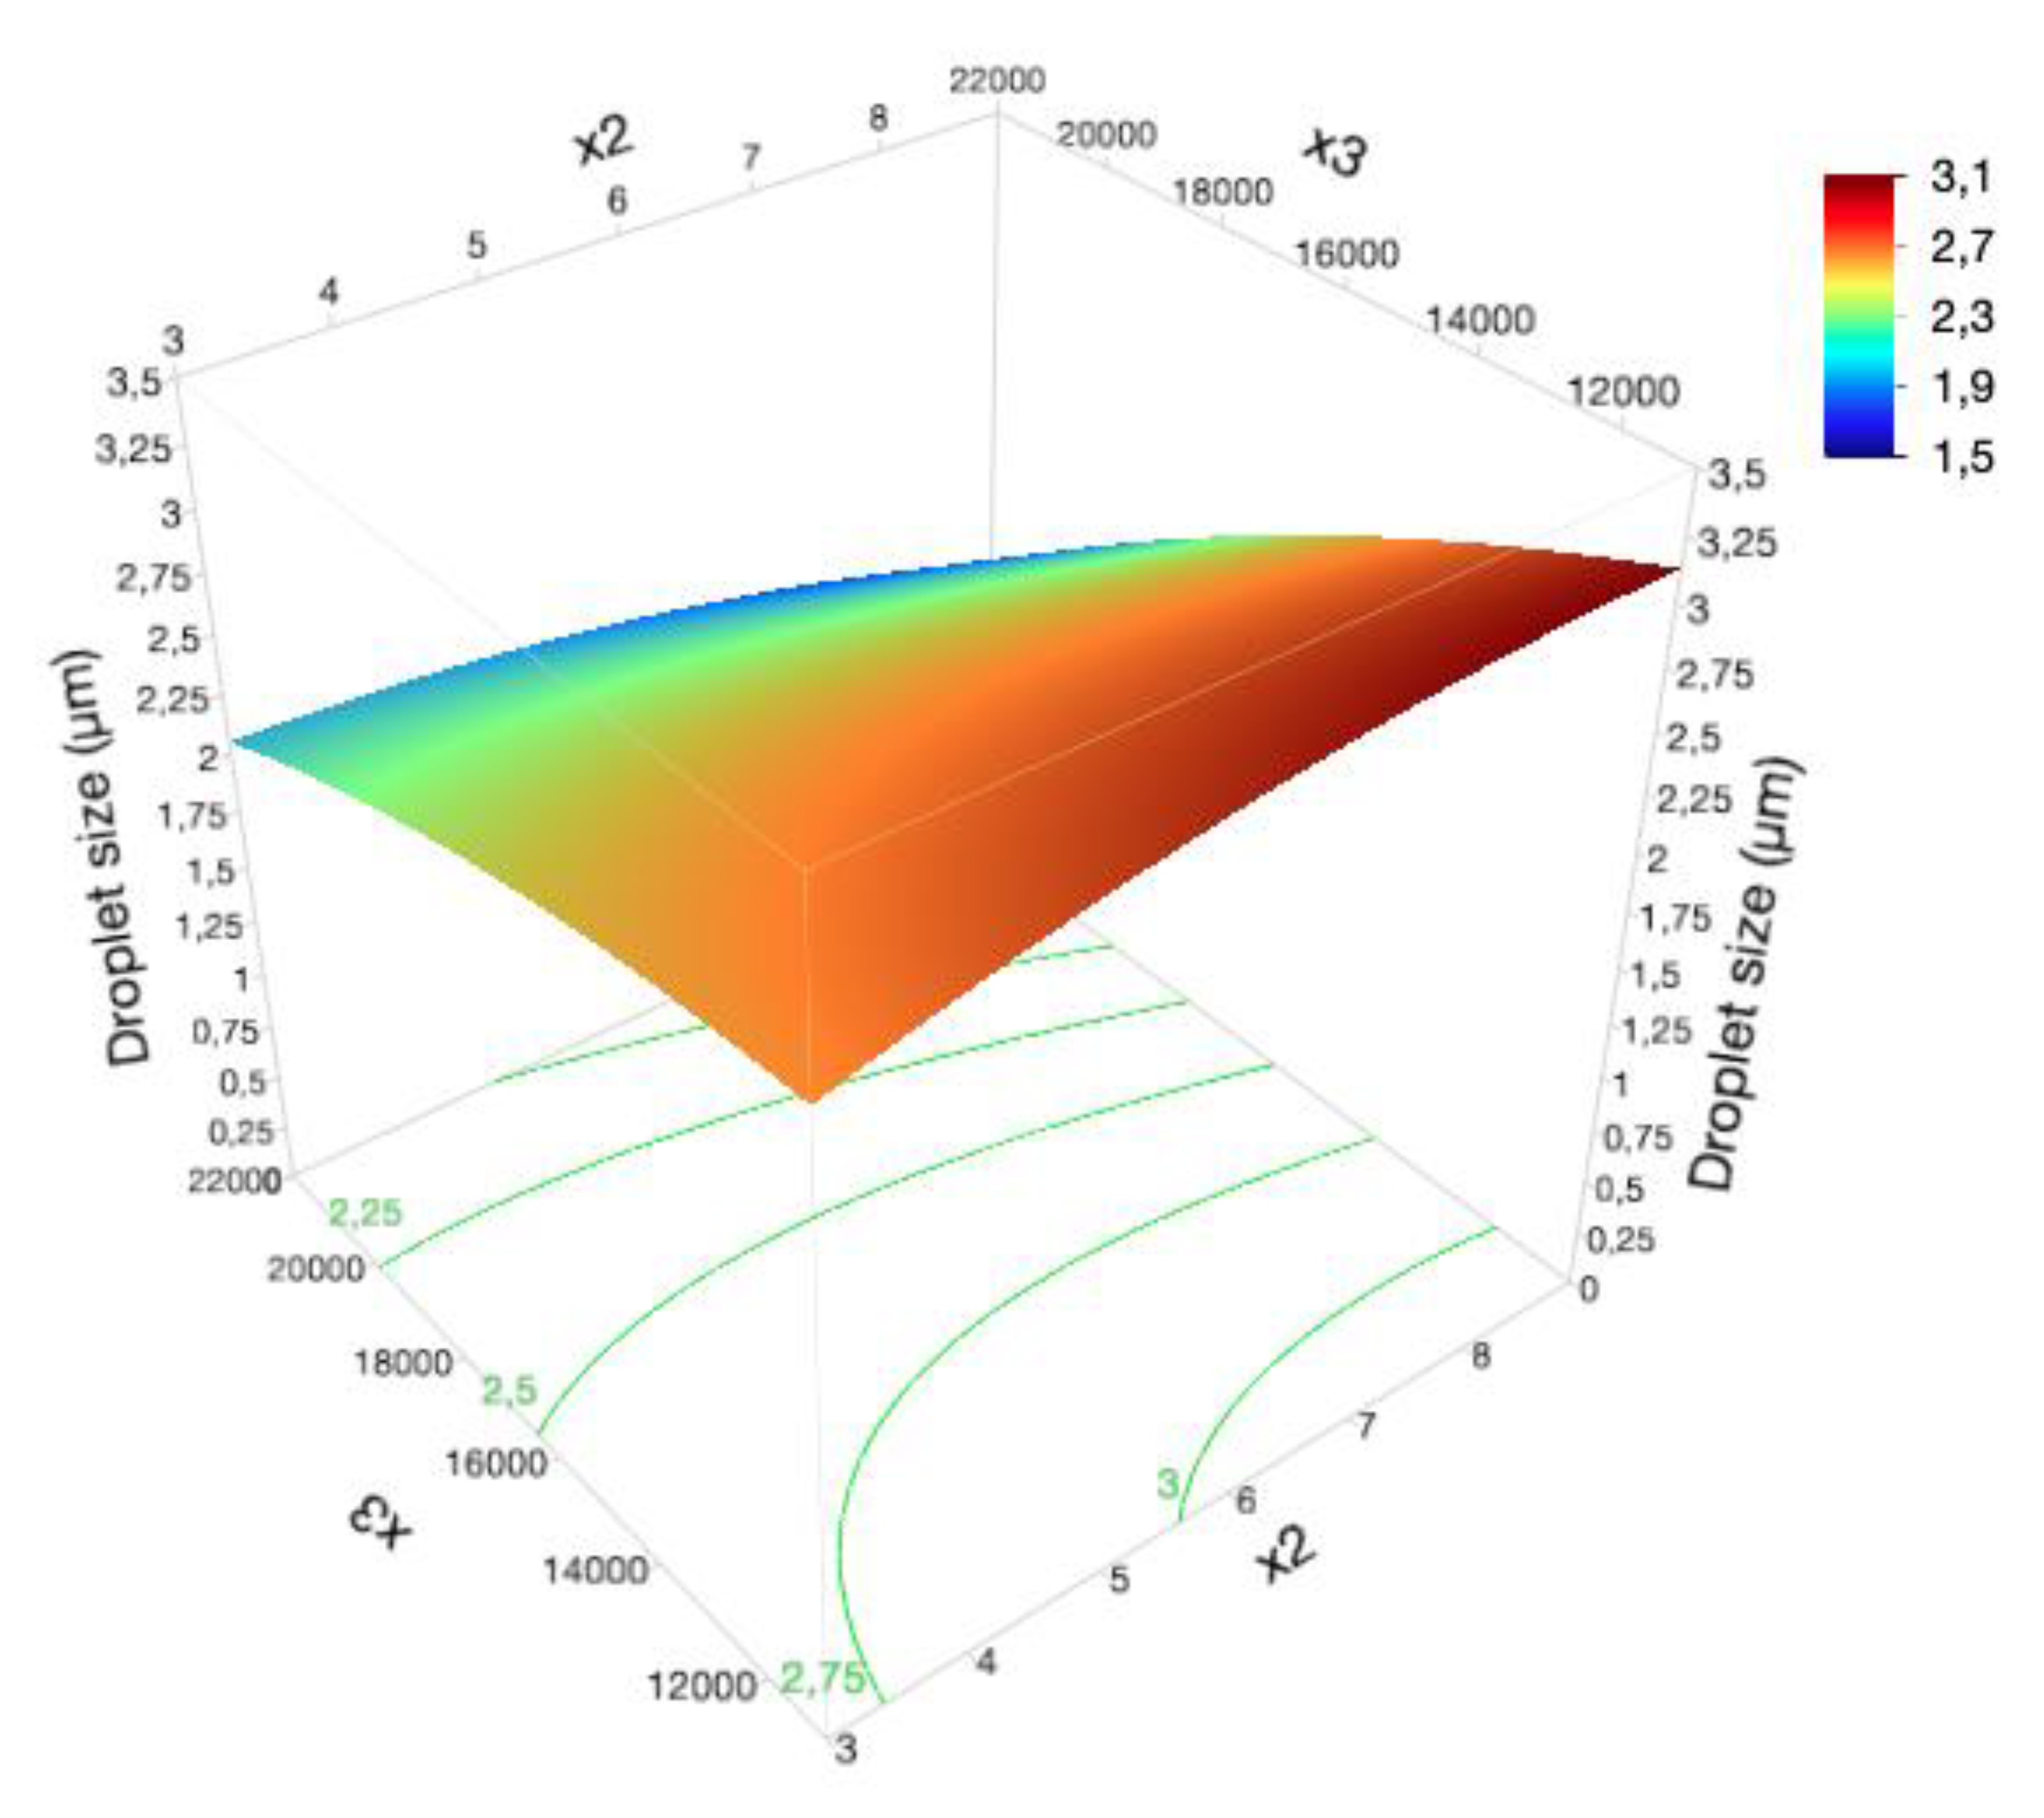
4.3.2. Microstructure
Droplet Size
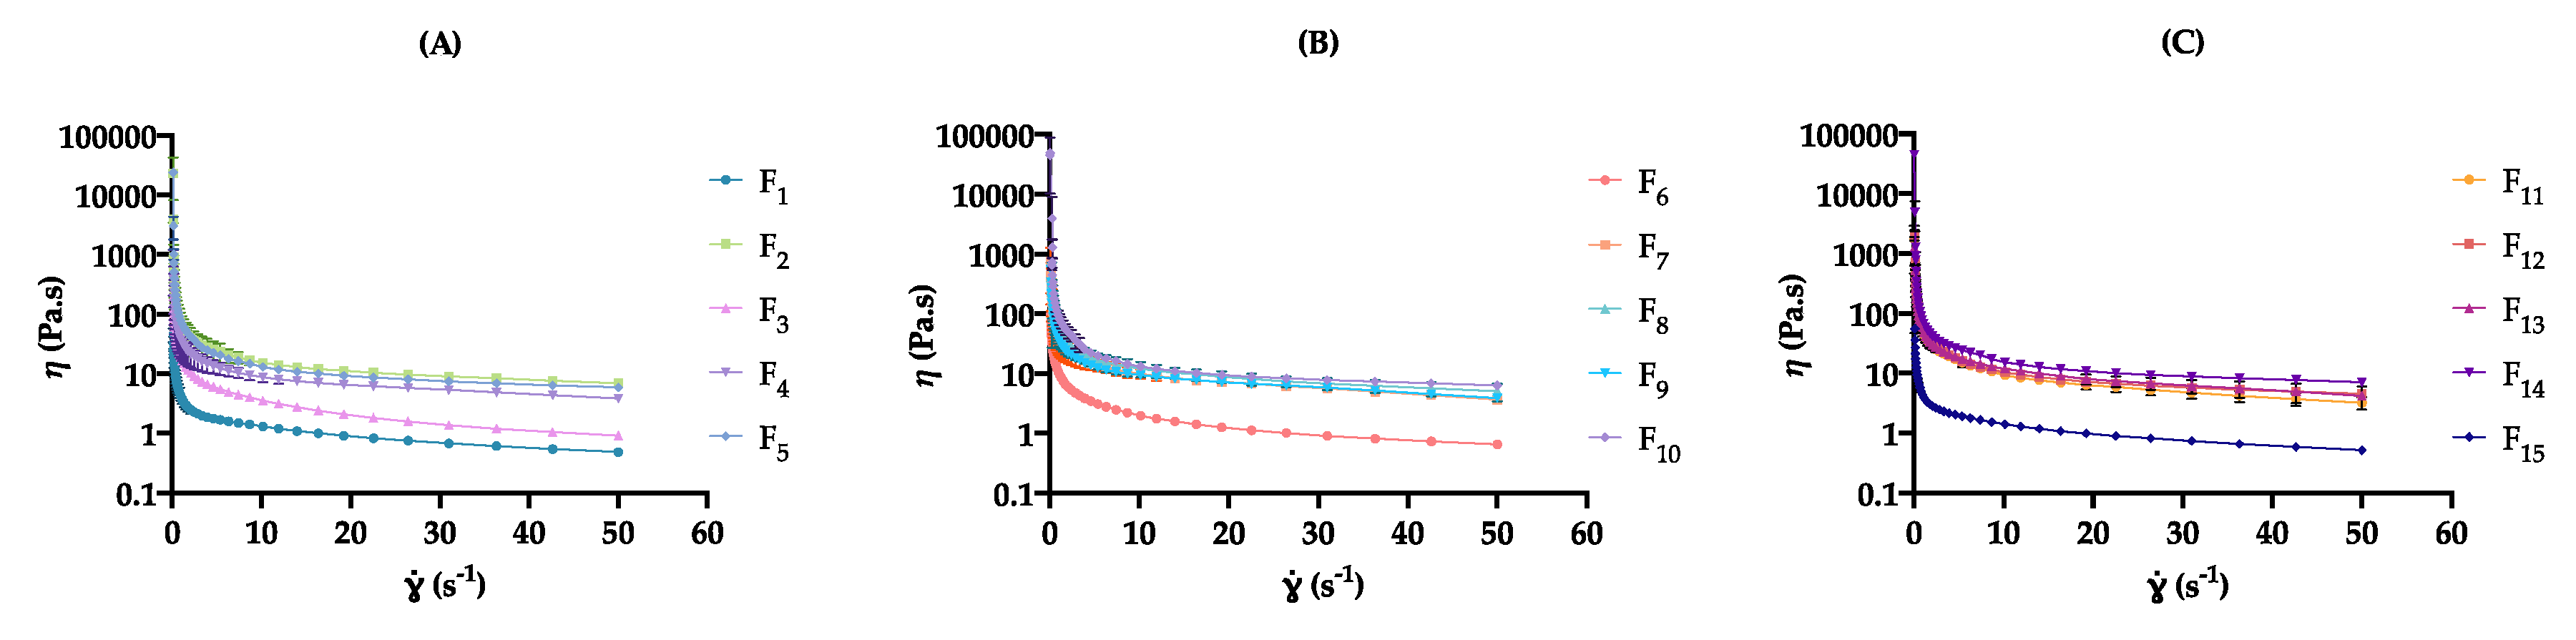
4.3.3. Rheological Characterization
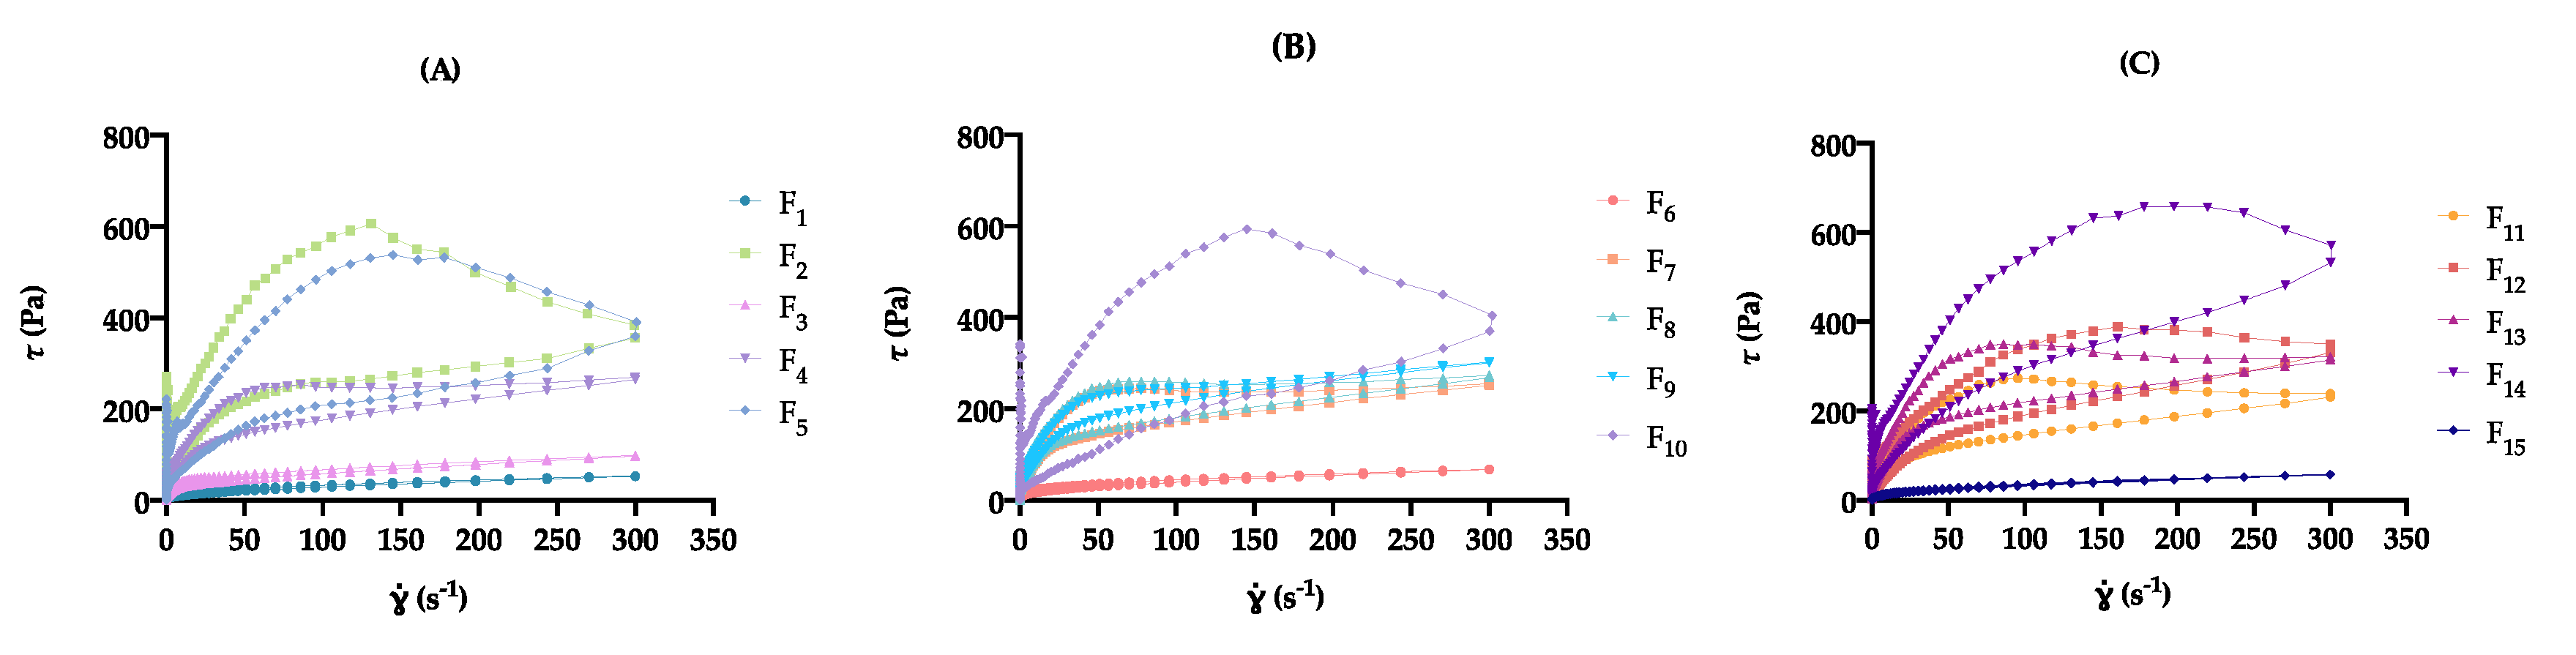
Rotational Measurements
Apparent Viscosity
Rheological Modeling
Thixotropic Behavior
Oscillatory Measurements
4.3.4. Product Performance
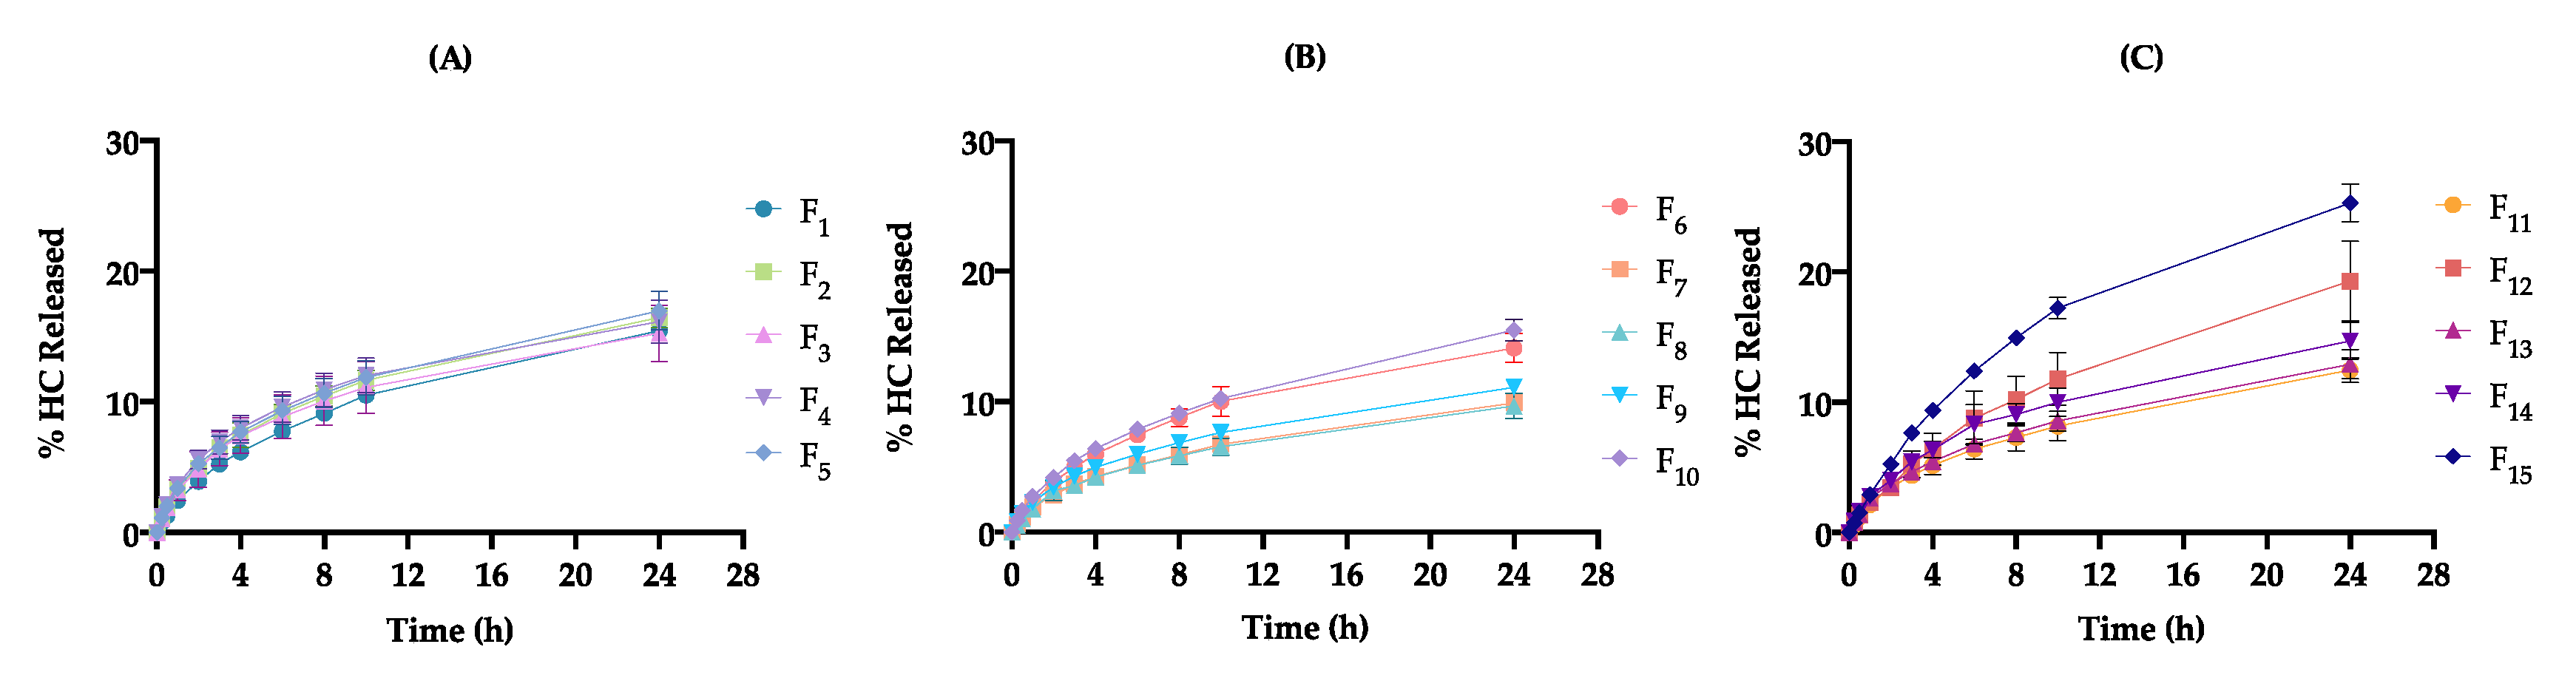
IVRT
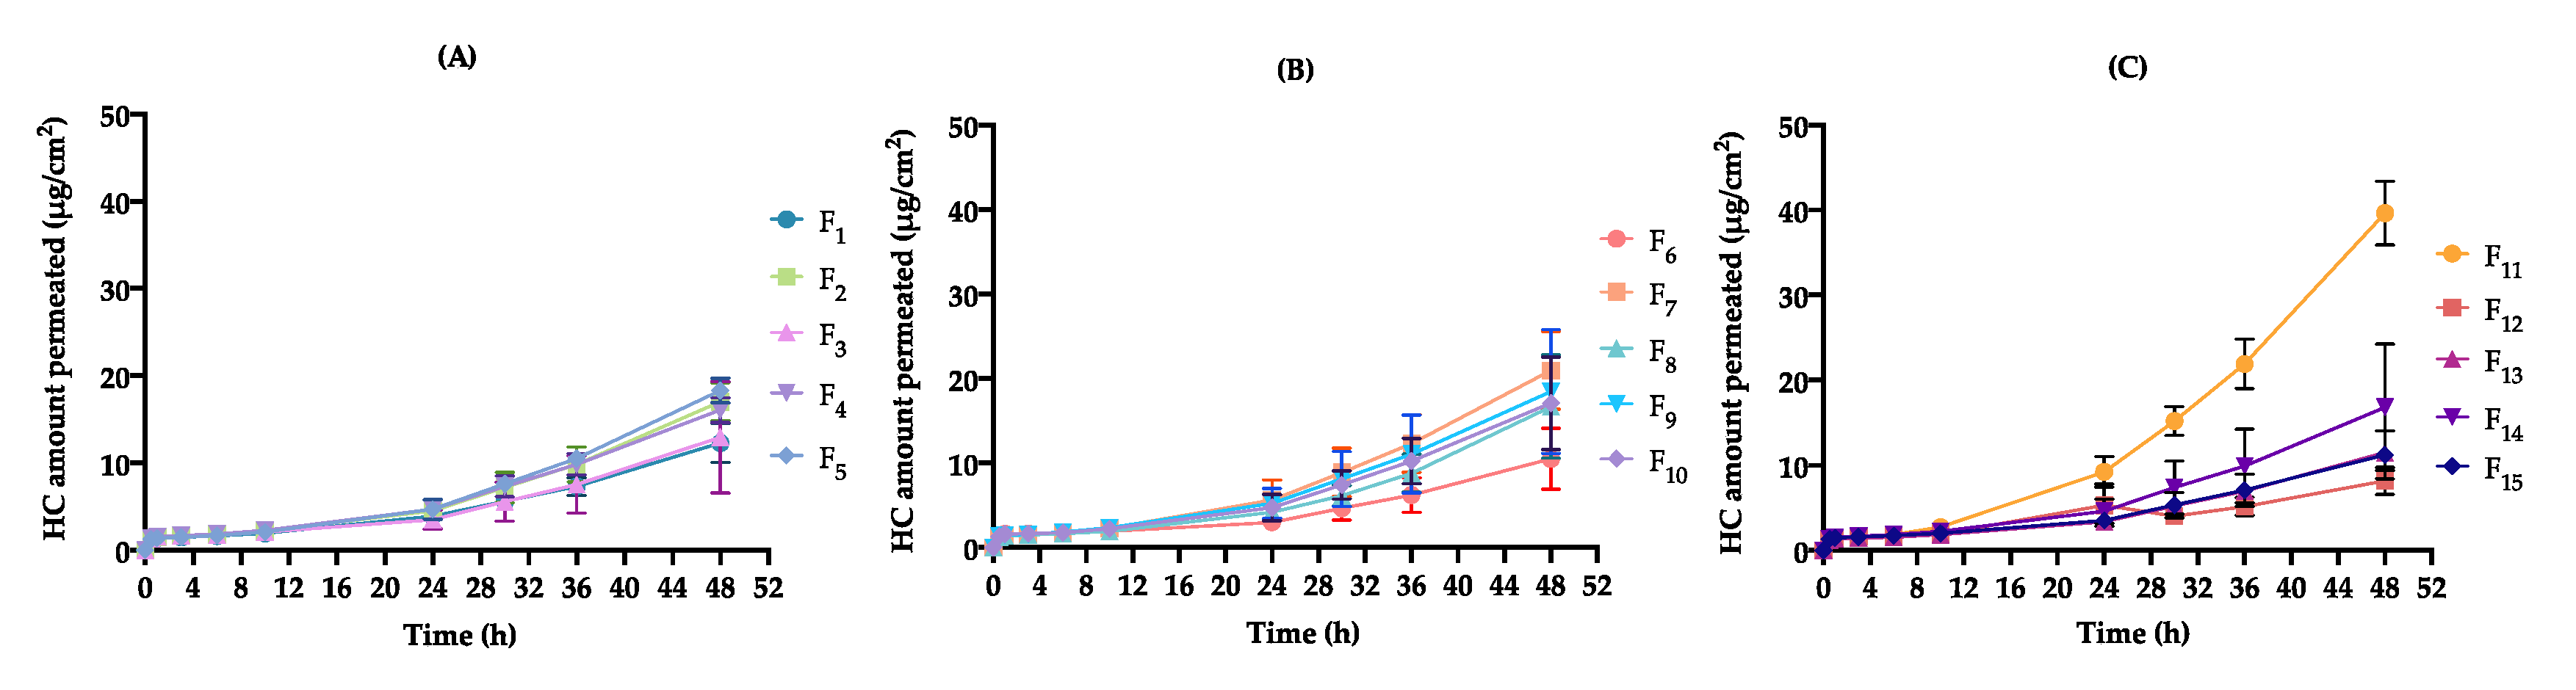
IVPT
4.3.5. Stability Protocol
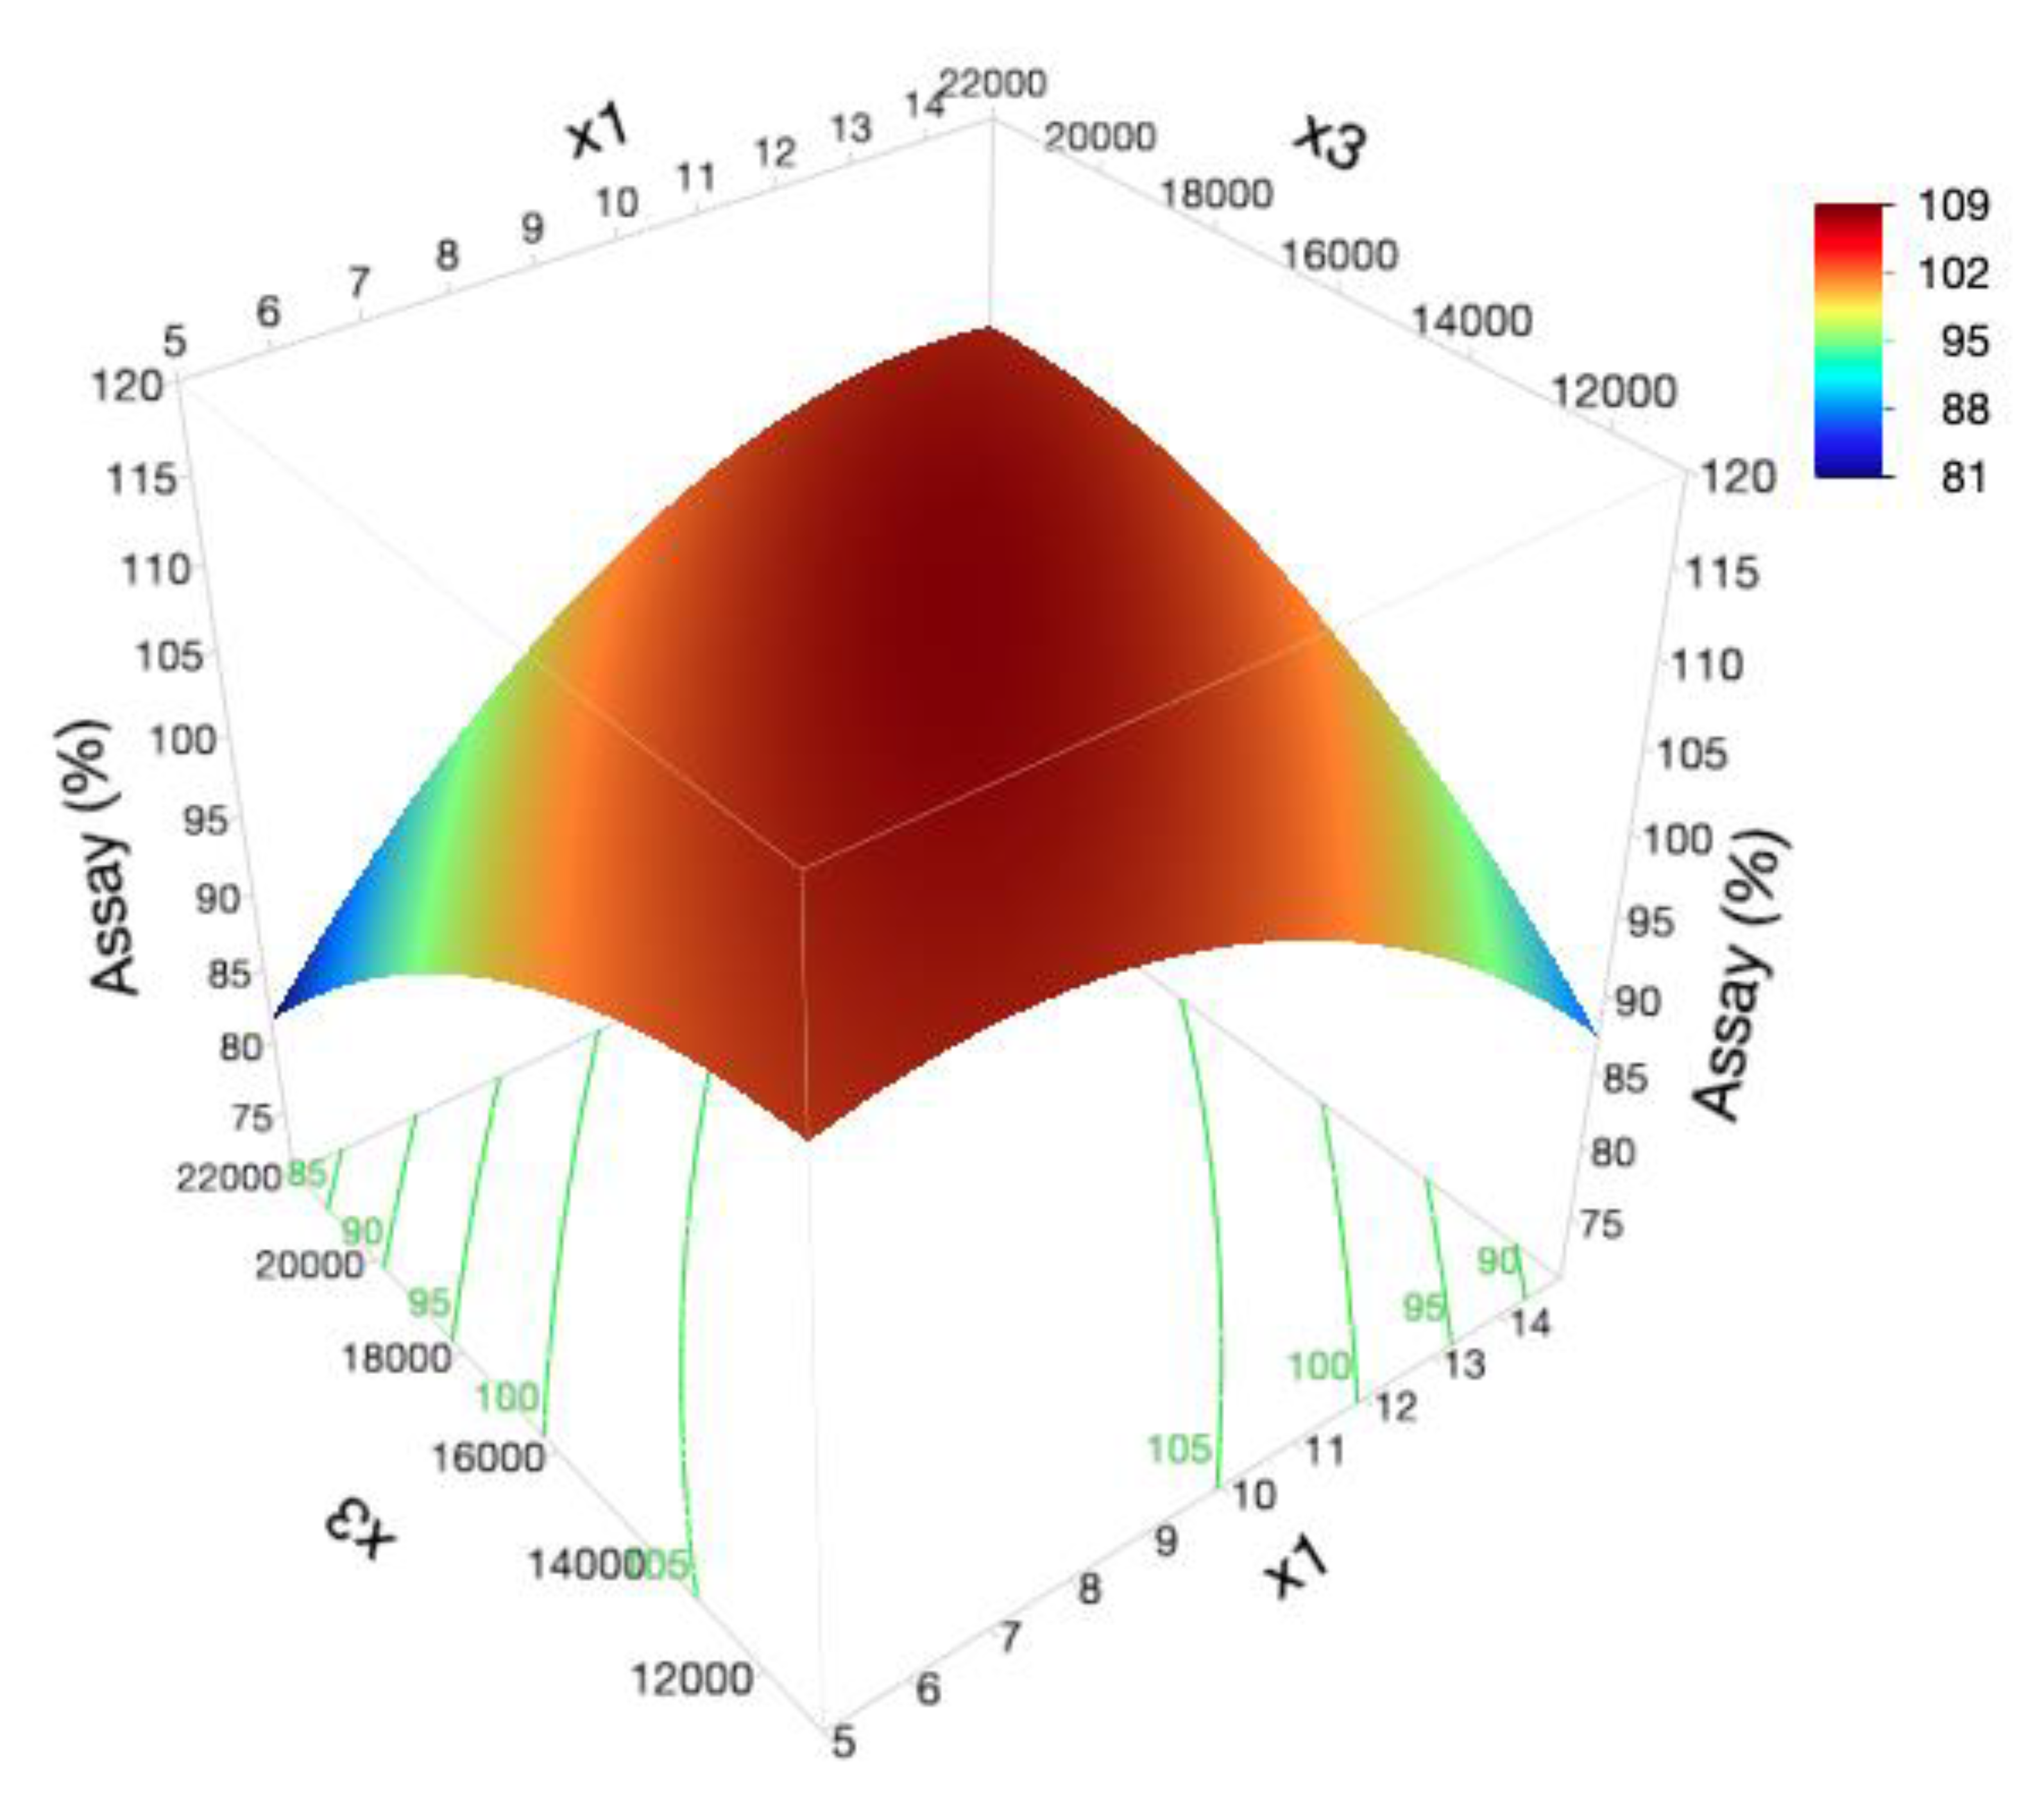
Assay
pH
Instability Index, Sedimentation and Creaming Rate
4.3.6. Overall Outlook
4.3.7. Summing-Up
- ♦
- Glycerol monostearate amount is a critical material attribute, due to its significant impact on formulation droplet size, rheological properties, physical stability and IVRT results.
- ♦
- An important contribution to drug-vehicle-skin interaction is given by glycerol monostearate.
- ♦
- Isopropyl myristate amount presents a wide impact on formulation physical stability.
- ♦
- As permeation enhancer, isopropyl myristate plays an important role in drug penetration through the skin.
- ♦
- Formulation droplet size and, consequently, physical stability are highly dependent on homogenization rate.
- ♦
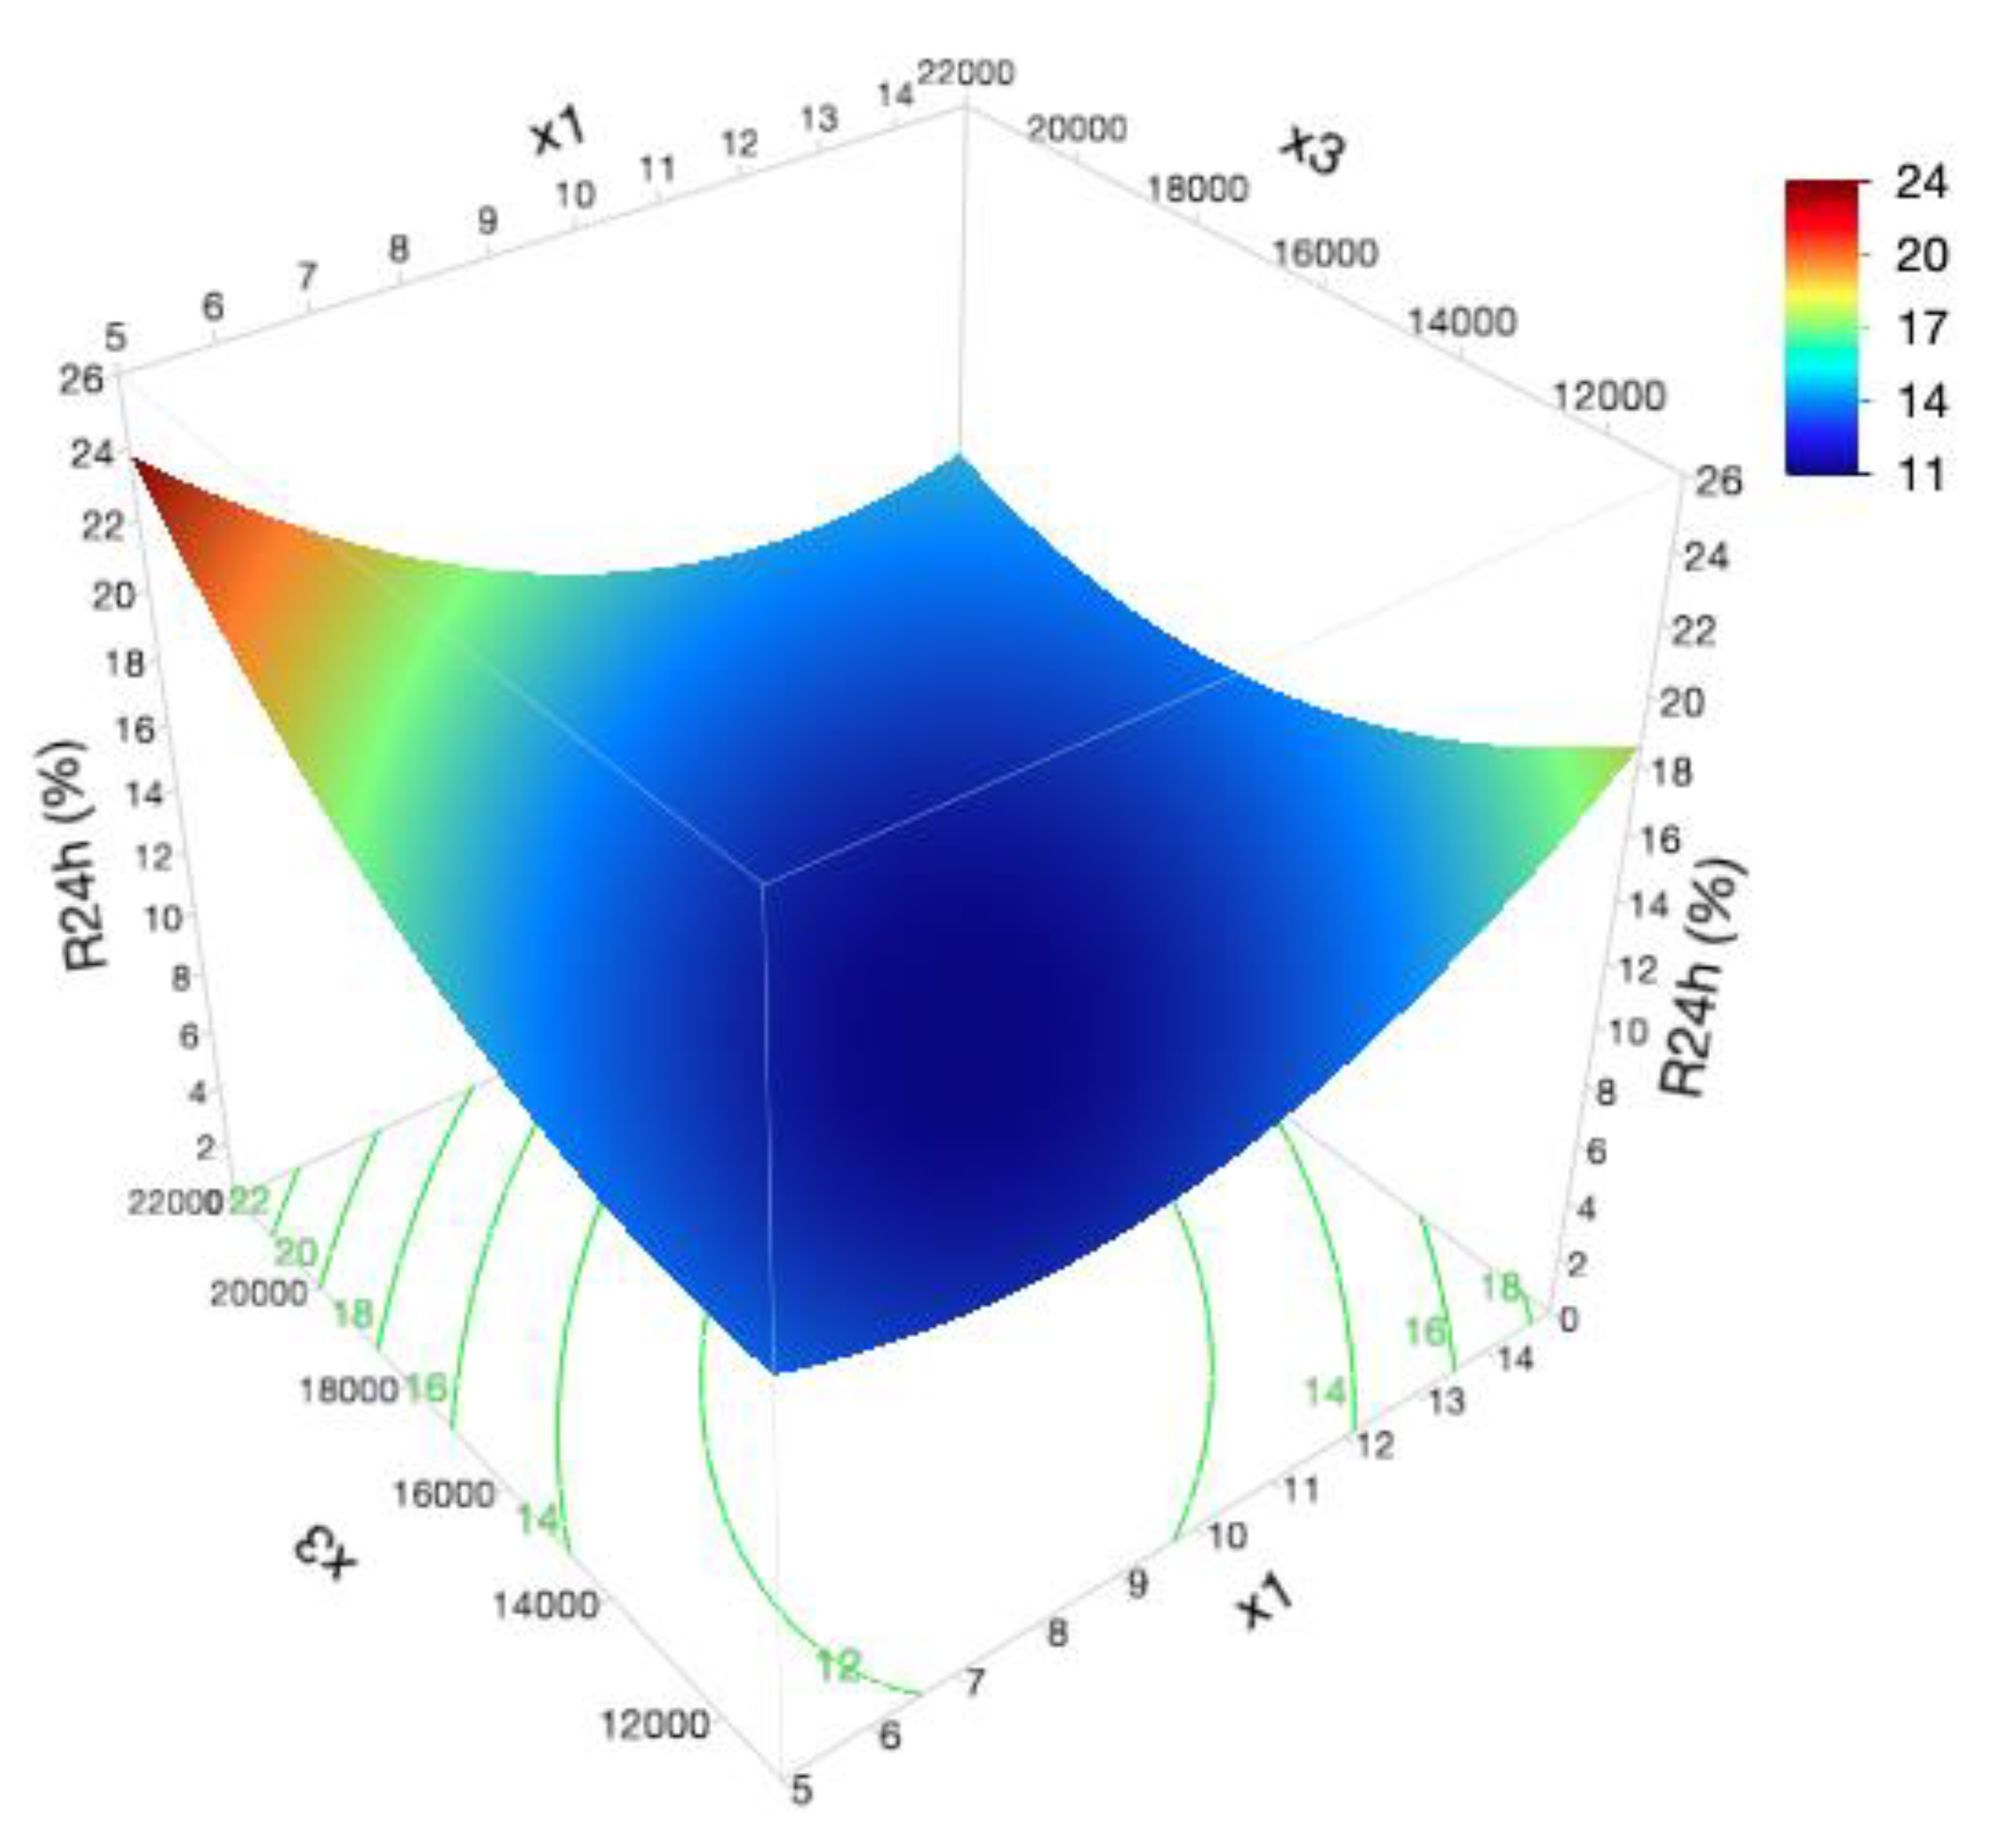
- Glycerol monostearate amount and homogenization rate interaction demonstrated to govern HC release.
- ♦
- Isopropyl myristate and homogenization rate interaction seems to significantly influence formulation droplet size.
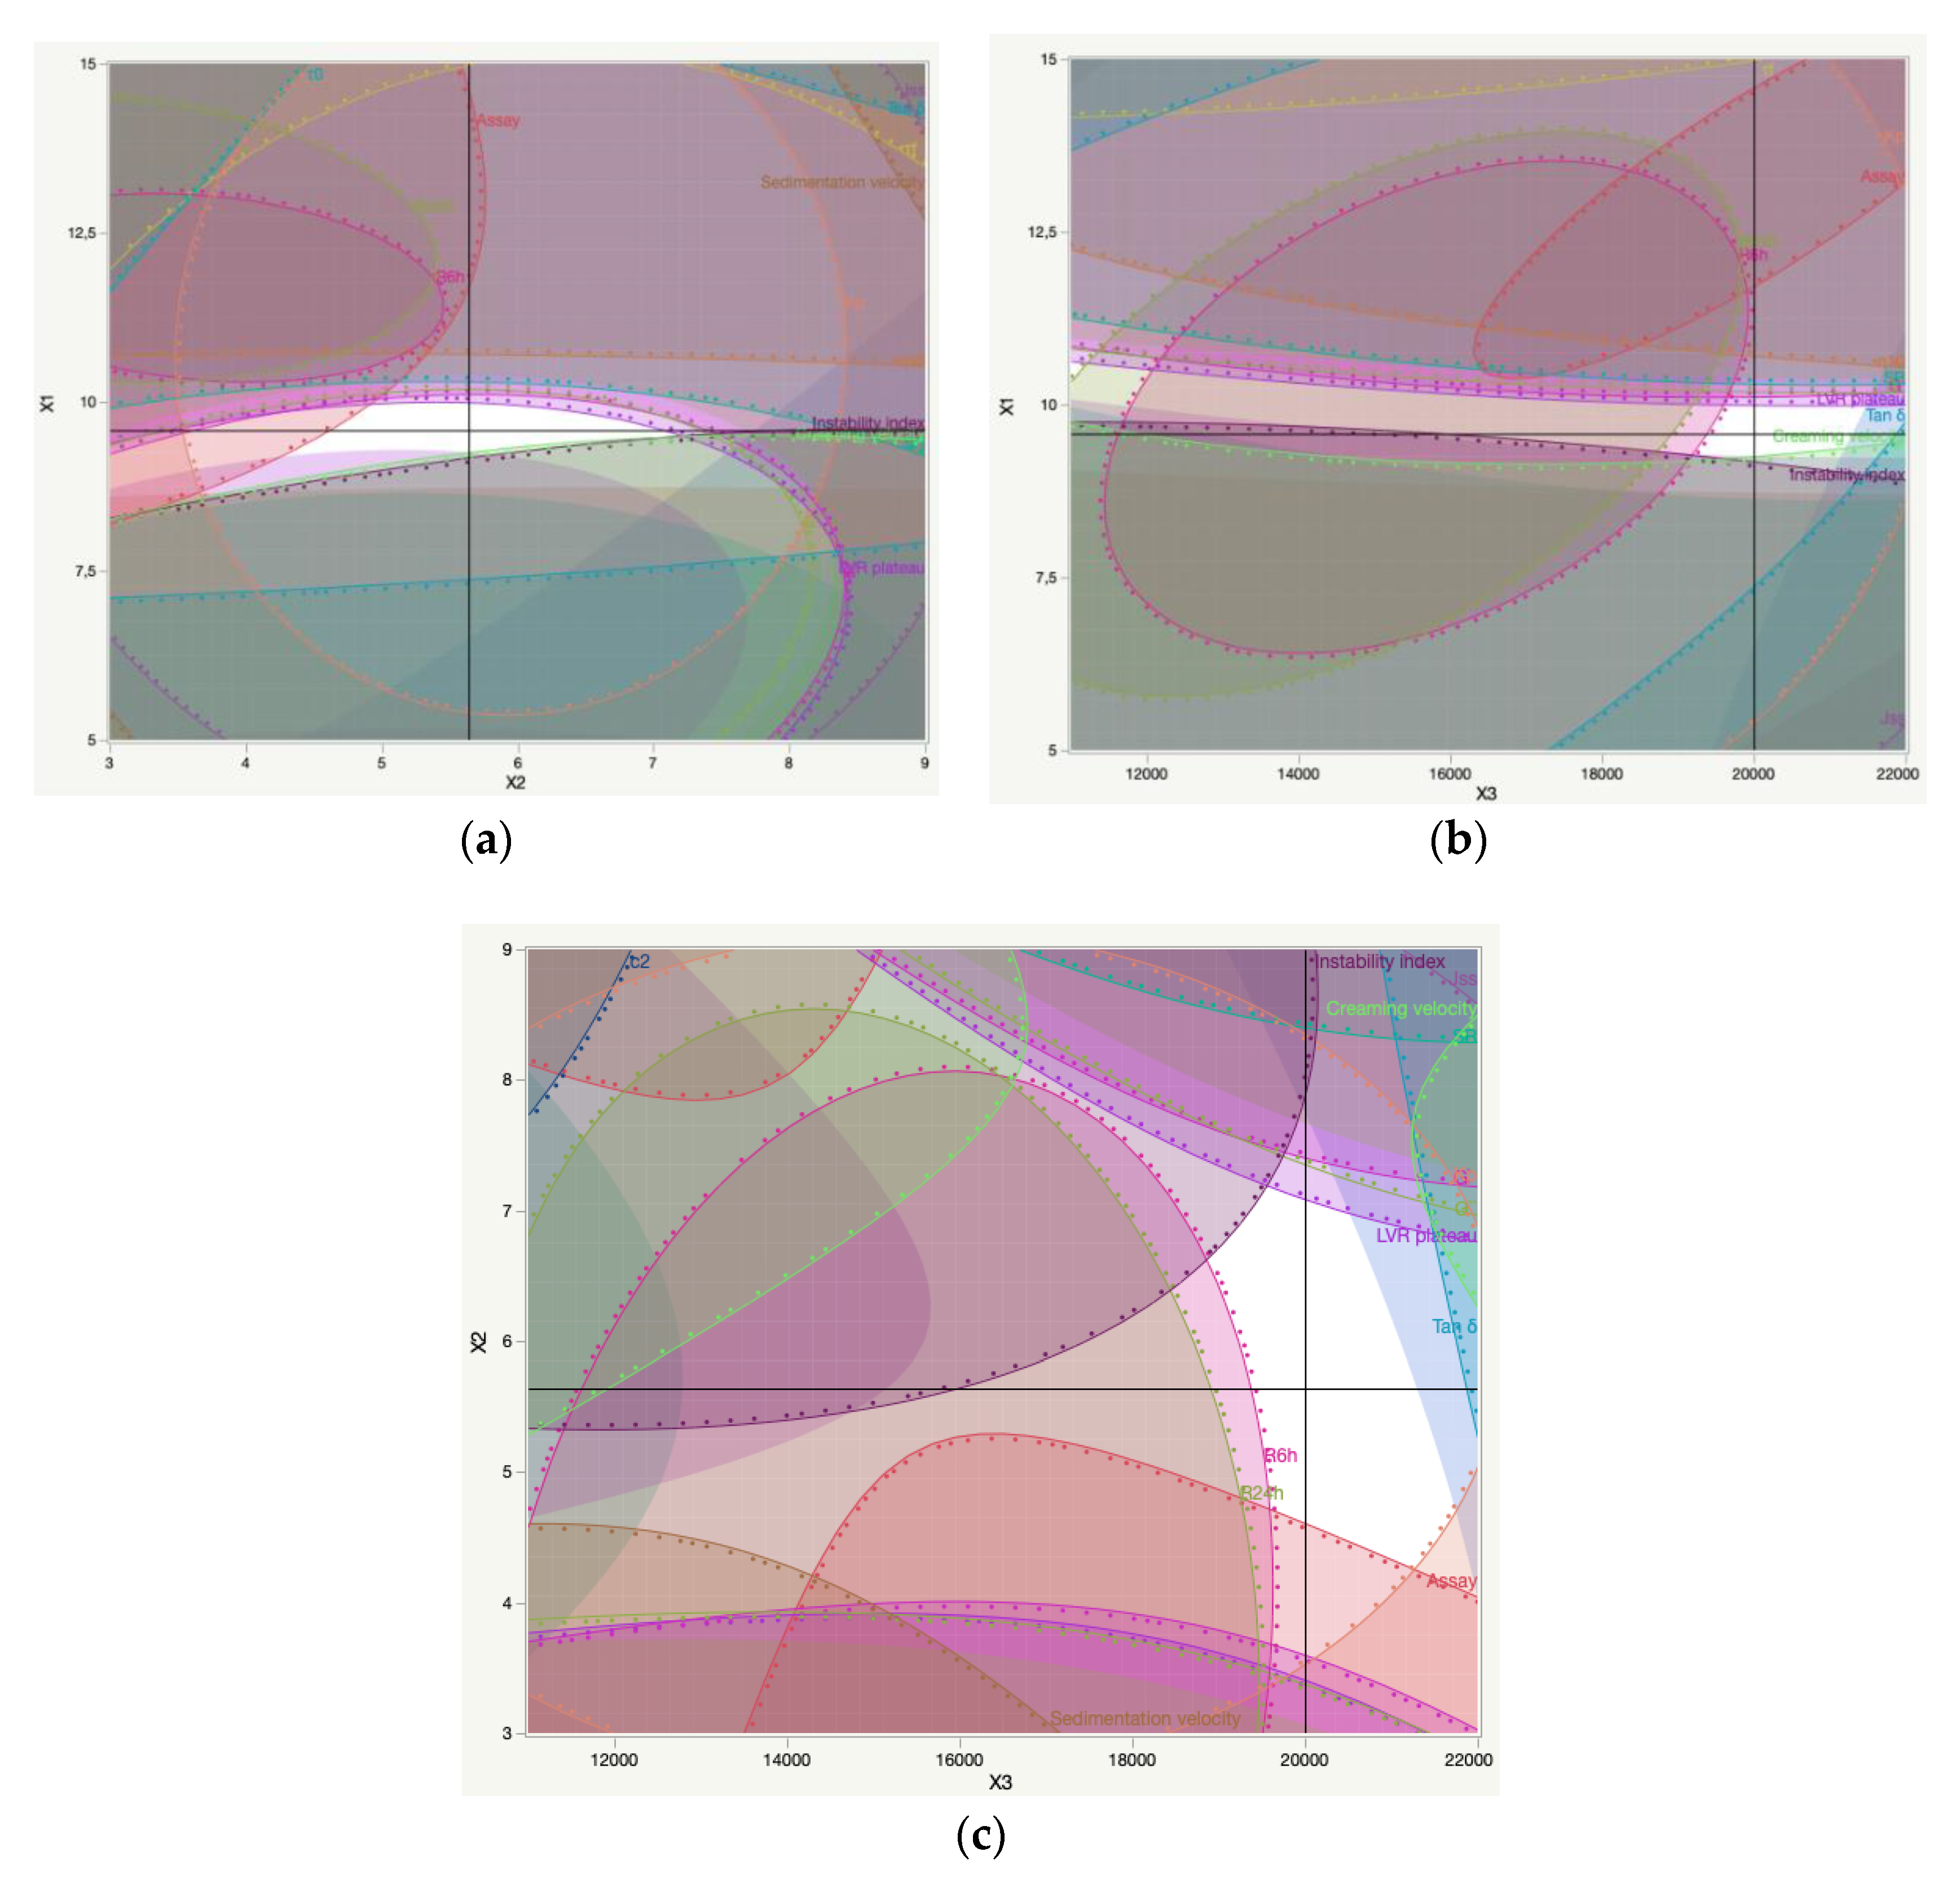
4.4. Optimal Working Conditions
5. Conclusions
Supplementary Materials
Author Contributions
Funding
Acknowledgments
Conflicts of Interest
List of Abbreviations
| ANOVA | Analysis of variance |
| CMA | Critical material attributes |
| CPP | Critical process parameters |
| CQA | Critical quality attributes |
| D | Detectability |
| DoE | Design of experiment |
| DS | Design space |
| ER | Enhancement ratio |
| FMECA | Failure Mode, Effects and Criticality Analysis |
| HC | Hydrocortisone |
| HPLC | High performance liquid chromatography |
| IVPT | In vitro permeation testing |
| IVRT | In vitro release testing |
| LVR | Linear viscoelastic region |
| NIR | Near-infrared |
| P | Probability of occurrence |
| QbD | Quality by Design |
| RP-HPLC | Reversed-phase high performance liquid chromatography |
| RPN | Risk priority number |
| S | Severity |
| SC | Stratum corneum |
| TEWL | Transepidermal water loss |
References
- Simões, A.; Veiga, F.; Vitorino, C. Developing Cream Formulations: Renewed Interest in an Old Problem. J. Pharm. Sci. 2019. [Google Scholar] [CrossRef] [PubMed]
- USP. Unites States Pharmacopeia, 40th ed.; United States Pharmacopoeial Convention: Bethesda, MD, USA, 2017. [Google Scholar]
- Krishnaiah, Y.S.; Xu, X.; Rahman, Z.; Yang, Y.; Katragadda, U.; Lionberger, R.; Peters, J.R.; Uhl, K.; Khan, M.A. Development of performance matrix for generic product equivalence of acyclovir topical creams. Int. J. Pharm. 2014, 475, 110–122. [Google Scholar] [CrossRef] [PubMed]
- Park, E.-K.; Song, K.-W. Rheological Evaluation of Petroleum Jelly as a Base Material in Ointment and Cream Formulations: Steady Shear Flow Behavior. Arch. Pharmacal. Res. 2010, 33, 141–150. [Google Scholar] [CrossRef] [PubMed]
- Głowińska, E.; Datta, J. A mathematical model of rheological behavior of novel bio-based isocyanate-terminated polyurethane prepolymers. Ind. Crop. Prod. 2014, 60, 123–129. [Google Scholar] [CrossRef]
- Kim, J.Y.; Song, J.Y.; Lee, E.J.; Park, S.K. Rheological properties and microstructures of Carbopol gel network system. Colloid Polym. Sci. 2003, 281, 614–623. [Google Scholar] [CrossRef]
- Isaac, V.L.B.; Chiari-Andréo, B.G.; Marto, J.M.; Moraes, J.D.D.; Leone, B.A.; Corrêa, M.A.; Ribeiro, H.M. Rheology as a Tool to Predict the Release of Alpha-Lipoic Acid from Emulsions Used for the Prevention of Skin Aging. Biomed. Res. Int. 2015, 2015, 1–8. [Google Scholar] [CrossRef] [Green Version]
- Vitorino, C.; Almeida, J.; Gonçalves, L.M.; Almeida, A.J.; Sousa, J.J.; Pais, A.A.C.C. Co-encapsulating nanostructured lipid carriers for transdermal application: From experimental design to the molecular detail. J. Control. Release 2013, 167, 301–314. [Google Scholar] [CrossRef] [PubMed]
- Jain, S. Quality by Design (QbD): A comprehensive understanding of implementation and challenges in pharmaceuticals development. Int. J. Pharm. Pharm. Sci. 2013, 6, 29–35. [Google Scholar]
- Yang, X.; Trinh, H.M.; Agrahari, V.; Sheng, Y.; Pal, D.; Mitra, A.K. Nanoparticle-Based Topical Ophthalmic Gel Formulation for Sustained Release of Hydrocortisone Butyrate. AAPS PharmSciTech 2016, 17, 294–306. [Google Scholar] [CrossRef] [Green Version]
- Takeuchi, H.; Ishida, M.; Furuya, A.; Todo, H.; Urano, H.; Sugibayashi, K. Influence of Skin Thickness on the in Vitro Permeabilities of Drugs through Sprague-Dawley Rat or Yucatan Micropig Skin. Biol. Pharm. Bull. 2012, 35, 192–202. [Google Scholar] [CrossRef] [PubMed] [Green Version]
- Vitorino, C.; Carvalho, F.A.; Almeida, A.J.; Sousa, J.J.; Pais, A.A.C.C. The size of solid lipid nanoparticles: An interpretation from experimental design. Colloids Surf. B Biointerfaces 2011, 84, 117–130. [Google Scholar] [CrossRef] [PubMed]
- Sobisch, T.; Lerche, D. Thickener performance traced by multisample analytical centrifugation. Colloids Surf. A Physicochem. Eng. Asp. 2008, 331, 114–118. [Google Scholar] [CrossRef]
- Ngan, C.L.; Basri, M.; Tripathy, M.; Abedi Karjiban, R.; Abdul-Malek, E. Skin intervention of fullerene-integrated nanoemulsion in structural and collagen regeneration against skin aging. Eur. J. Pharm. Sci. 2015, 70, 22–28. [Google Scholar] [CrossRef] [PubMed]
- Kan, S.; Lu, J.; Liu, J.; Wang, J.; Zhao, Y. A quality by design (QbD) case study on enteric-coated pellets: Screening of critical variables and establishment of design space at laboratory scale. Asian J. Pharm. Sci. 2014, 9, 268–278. [Google Scholar] [CrossRef] [Green Version]
- Kovács, A.; Berkó, S.; Csányi, E.; Csóka, I. Development of nanostructured lipid carriers containing salicyclic acid for dermal use based on the Quality by Design method. Eur. J. Pharm. Sci. 2017, 99, 246–257. [Google Scholar] [CrossRef] [PubMed] [Green Version]
- Q8, ICH. International Conference on Harmonisation of Technical Requirements for Registration of Pharmaceuticals for Human Use. In ICH Harmonised Tripartite Q8 (R2) Guideline: Pharmaceutical Development; Food and Drug Administration: Rockville, MD, USA, 2009. [Google Scholar]
- Raina, H.; Kaur, S.; Jindal, A.B. Development of efavirenz loaded solid lipid nanoparticles: Risk assessment, quality-by-design (QbD) based optimisation and physicochemical characterisation. J. Drug Deliv. Sci. Technol. 2017, 39, 180–191. [Google Scholar] [CrossRef]
- Osborne, D.W. Impact of Quality by Design on Topical Product Excipient Suppliers, Part I: A Drug Manufacturer’s Perspective. Pharm. Technol. Eur. 2016, 28, 30–37. [Google Scholar]
- Fowler, M. Quality by Design (QbD) Approach to Generic Transdermal or Topical Product Development. Am. Pharm. Rev. 2015. [Google Scholar]
- FDA. Guidance for Industry: Transdermal and Topical Delivery Systems-Product Development and Quality Considerations; FDA: Rockville, MD, USA, 2019.
- Chang, R.K.; Raw, A.; Lionberger, R.; Yu, L. Generic Development of Topical Dermatologic Products: Formulation Development, Process Development, and Testing of Topical Dermatologic Products. AAPS J. 2013, 15, 41–52. [Google Scholar] [CrossRef] [PubMed] [Green Version]
- EMA. Draft Guideline on Quality and Equivalence of Topical Products. (CHMP); European Medicines Agency: Amsterdam, The Netherlands, 2018; CHMP/QWP/708282/2018. [Google Scholar]
- Zsikó, S.; Csányi, E.; Kovács, A.; Budai-Szűcs, M.; Gácsi, A.; Berkó, S. Methods to Evaluate Skin Penetration In Vitro. Scientia Pharm. 2019, 87, 19. [Google Scholar] [CrossRef] [Green Version]
- Q9, ICH. International Conference on Harmonisation of Technical Requirements for Registration of Pharmaceuticals for Human Use. In ICH Harmonised Tripartite Q9 Guideline: Quality Risk Management; Food and Drug Administration: Rockville, MD, USA, 2005. [Google Scholar]
- Chang, R.K.; Raw, A.; Lionberger, R.; Yu, L. Generic Development of Topical Dermatologic Products, Part II: Quality by Design for Topical Semisolid Products. AAPS J. 2013, 15, 674–683. [Google Scholar] [CrossRef] [PubMed] [Green Version]
- Raposo, S.C.; Simoes, S.D.; Almeida, A.J.; Ribeiro, H.M. Advanced systems for glucocorticoids’ dermal delivery. Expert Opin. Drug Deliv. 2013, 10, 857–877. [Google Scholar] [CrossRef]
- Djuris, J.; Djuric, Z. Modeling in the quality by design environment: Regulatory requirements and recommendations for design space and control strategy appointment. Int. J. Pharm. 2017. [Google Scholar] [CrossRef]
- Benson, H.A.E. Skin Structure, Function and Permeation. In Transdermal and Topical Drug Delivery: Principles and Practices, 1st ed.; John Wiley & Sons: Hoboken, NJ, USA, 2012; pp. 3–22. [Google Scholar]
- Shah, V.P.; Yacobi, A.; Rădulescu, F.Ş.; Miron, D.S.; Lane, M.E. Review: A science based approach to topical drug classification system (TCS). Int. J. Pharm. 2015, 491, 21–25. [Google Scholar] [CrossRef] [PubMed]
- Ostrenga, J.; Steinmetz, C.; Poulsen, B. Significance of vehicle composition. I. Relationship between topical vehicle composition, skin penetrability, and clinical efficacy. J. Pharm. Sci. 1971, 60, 1175–1179. [Google Scholar] [CrossRef]
- Dejaegher, B.; Heyden, Y.V. Experimental designs and their recent advances in set-up, data interpretation, and analytical applications. J. Pharm. Biomed. Anal. 2011, 56, 141–158. [Google Scholar] [CrossRef] [PubMed]
- Vera Candioti, L.; De Zan, M.M.; Cámara, M.S.; Goicoechea, H.C. Experimental design and multiple response optimization. Using the desirability function in analytical methods development. Talanta 2014, 124, 123–138. [Google Scholar] [CrossRef] [PubMed]
- Patravale, V.B.; Disouza, J.I.; Rustomjee, M. Pharmaceutical Product Development: Insights into Parmaceutical Processes, Management and Regulatory Affairs; CRC Press: Boca Raton, FL, USA, 2016. [Google Scholar]
- Razzaghi, K.; Shahraki, F. On the effect of phase fraction on drop size distribution of liquid-liquid dispersions in agitated vessels. Chem. Eng. Res. Des. Trans. Inst. Chem. Eng. Part A 2010, 88, 803–808. [Google Scholar] [CrossRef]
- Zhao, Y.; Li, X.; Cheng, J.; Yang, C.; Mao, Z.-S. Experimental Study on liquid-liquid Macromixing in a Stirred Tank. Ind. Eng. Chem. Res. 2011, 50, 5952–5958. [Google Scholar] [CrossRef]
- Zhang, J.; Xu, S.; Li, W. High shear mixers: A review of typical applications and studies on power draw, flow pattern, energy dissipation and transfer properties. Chem. Eng. Process. 2012, 57–58, 25–41. [Google Scholar] [CrossRef]
- Carrillo De Hert, S.; Rodgers, T.L. On the effect of dispersed phase viscosity and mean residence time on the droplet size distribution for high-shear mixers. Chem. Eng. Sci. 2017, 172, 423–433. [Google Scholar] [CrossRef] [Green Version]
- Chen, G.; Tao, D. An experimental study of stability of oil-water emulsion. Fuel Process. Technol. 2005, 86, 499–508. [Google Scholar] [CrossRef]
- Boxall, J.A.; Koh, C.A.; Sloan, E.D.; Sum, A.K.; Wu, D.T. Droplet size scaling of water-in-oil emulsions under turbulent flow. Langmuir 2012, 28, 104–110. [Google Scholar] [CrossRef]
- Khajeh Naeeni, S.; Pakzad, L. Experimental and numerical investigation on mixing of dilute oil in water dispersions in a stirred tank. Chem. Eng. Res. Des. Trans. Inst. Chem. Eng. Part A 2019, 147, 493–509. [Google Scholar] [CrossRef]
- Hall, S.; Pacek, A.W.; Kowalski, A.; Cooke, M.; Rothman, D. The effect of scale and interfacial tension on liquid-liquid dispersion in in-line Silverson rotor-stator mixers. Chem. Eng. Res. Des. Trans. Inst. Chem. Eng. Part A 2013, 91, 2156–2168. [Google Scholar] [CrossRef] [Green Version]
- Perlekar, P.; Biferale, L.; Sbragaglia, M.; Srivastava, S.; Toschi, F. Droplet size distribution in homogeneous isotropic turbulence. Phys. Fluids 2012, 24, 065101. [Google Scholar] [CrossRef] [Green Version]
- Zhu, S.; Pudney, P.D.A.; Heppenstall-Butler, M.; Butler, M.F.; Ferdinando, D.; Kirkland, M. Interaction of the acid soap of triethanolamine stearate and stearic acid with water. J. Phys. Chem. B 2007, 111, 1016–1024. [Google Scholar] [CrossRef]
- Fiume, M.M.; Heldreth, B.; Bergfeld, W.F.; Belsito, D.V.; Hill, R.A.; Klaassen, C.D.; Liebler, D.; Marks, J.G., Jr.; Shank, R.C.; Slaga, T.J.; et al. Safety Assessment of Triethanolamine and Triethanolamine-Containing Ingredients as Used in Cosmetics. Int. J. Toxicol. 2013, 32, 59S–83S. [Google Scholar] [CrossRef] [PubMed]
- Fredrick, E.; Heyman, B.; Moens, K.; Fischer, S.; Verwijlen, T.; Moldenaers, P.; Van der Meeren, P.; Dewettinck, K. Monoacylglycerols in dairy recombined cream: II. The effect on partial coalescence and whipping properties. Food Res. Int. 2013, 51, 936–945. [Google Scholar] [CrossRef]
- Rowe, R.C.; Sheskey, P.J.; Quinn, M.E. Handbook of Pharmaceutical Excipients, 6th ed.; Pharmaceutical Press: London, UK, 2009. [Google Scholar]
- Ethier, A.; Bansal, P.; Baxter, J.; Langley, N.; Richardson, N.; Patel, A.M. The Role of Excipients in the Microstructure of Topical Semisolid Drug Products. In The Role of Microstructure in Topical Drug Product Development; AAPS Advances in the Pharmaceutical Sciences Series; American Association of Pharmaceutical Scientists: Arlington, VA, USA, 2019; pp. 155–193. [Google Scholar]
- Ribeiro, H.M.; Morais, J.A.; Eccleston, G.M. Structure and rheology of semisolid o/w creams containing cetyl alcohol/non-ionic surfactant mixed emulsifier and different polymers. Int. J. Cosmet. Sci. 2004, 26, 47–59. [Google Scholar] [CrossRef]
- Eccleston, G.M. Multiple-phase oil-in-water emulsions. J. Soc. Cosmet. Chem. 1990, 41, 1–22. [Google Scholar]
- Awad, T.; Johnson, E.; Bureiko, A.; Olsson, U. Colloidal Structure and Physical Properties of Gel Networks Containing Anionic Surfactant and Fatty Alcohol Mixture. J. Dispers. Sci. Technol. 2011, 32, 807–815. [Google Scholar] [CrossRef]
- UKEssays. Formulation of Ointment and Cream. Available online: https://www.ukessays.com/essays/education/formulation-of-ointment-and-cream.php#citethis (accessed on 6 January 2020).
- Eccleston, G.M. Functions of mixed emulsifiers and emulsifying waxes in dermatological lotions and creams. Colloids Surf. A Physicochem. Eng. Asp. 1997, 123, 169–182. [Google Scholar] [CrossRef]
- Eccleston, G.M.; Behan-Martin, M.K.; Jones, G.R.; Towns-Andrews, E. Synchrotron X-ray investigations into the lamellar gel phase formed in pharmaceutical creams prepared with cetrimide and fatty alcohols. Int. J. Pharm. 2000, 203, 127–139. [Google Scholar] [CrossRef]
- Wang, F.C.; Marangoni, A.G. Internal and external factors affecting the stability of glycerol monostearate structured emulsions. RSC Adv. 2015, 5, 93108–93116. [Google Scholar] [CrossRef]
- Yamagata, Y.; Senna, M. Change in the two-step flow behavior on aging the ternary mixture comprising monoalkyl cationic surfactant, long-chain alcohol and water—II. Analysis of the creep behavior. Colloids Surf. A Physicochem. Eng. Asp. 1998, 133, 245–251. [Google Scholar] [CrossRef]
- Joaquim, S.-C.; Ana, C.-C.; Lyda, H.-B.; Beatriz, C.-N.; María José, R.-L.; Elena, B.; Joanna, Z.-L.; Antonio, B.-M. Biopharmaceutical Development of a Bifonazole Multiple Emulsion for Enhanced Epidermal Delivery. Pharmaceutics 2019, 66. [Google Scholar] [CrossRef] [Green Version]
- Vianna-Filho, R.P.; Petkowicz, C.L.O.; Silveira, J.L.M. Rheological characterization of O/W emulsions incorporated with neutral and charged polysaccharides. Carbohydr. Polym. 2013, 93, 266–272. [Google Scholar] [CrossRef] [PubMed] [Green Version]
- Galindo-Rosales, F.J.; Rubio-Hernández, F.J.; Sevilla, A. An apparent viscosity function for shear thickening fluids. J. Nonnewton. Fluid Mech. 2011, 166, 321–325. [Google Scholar] [CrossRef]
- Mezger, T.G. The Rheology Handbookfor Users of Rotational & Oscillatory Rheometers, 4th ed.; Vincentz Network: Hannover, Germany, 2014. [Google Scholar]
- Xie, J.; Jin, Y. Parameter determination for the Cross rheology equation and its application to modeling non-Newtonian flows using the WC-MPS method. Eng. Appl. Comput. Fluid Mech. 2016, 10, 111–129. [Google Scholar] [CrossRef] [Green Version]
- Ghica, M.V.; Hirjau, M.; Lupuleasa, D.; Dinu-Pirvu, C.-E. Flow and Thixotropic Parameters for Rheological Characterization of Hydrogels. Molecules 2016, 21, 786. [Google Scholar] [CrossRef]
- Ilić, T.; Pantelić, I.; Lunter, D.; Đorđević, S.; Marković, B.; Ranković, D.; Daniels, R.; Savić, S. Critical quality attributes, in vitro release and correlated in vitro skin permeation—In vivo tape stripping collective data for demonstrating therapeutic (non)equivalence of topical semisolids: A case study of “ready-to-use” vehicles. Int. J. Pharm. 2017, 528, 253–267. [Google Scholar] [CrossRef] [PubMed]
- Trujillo-Cayado, L.A.; Natera, A.; García, M.C.; Muñoz, J.; Alfaro, M.C. Rheological properties and physical stability of ecological emulsions stabilized by a surfactant derived from cocoa oil and high pressure homogenization. Grasas y Aceites 2015, 66, 1–8. [Google Scholar] [CrossRef] [Green Version]
- Trujillo-Cayado, L.A.; Santos, J.; Carmen Alfaro, M.; Calero, N.; Munoz, J. A Further Step in the Development of Oil-in-Water Emulsions Formulated with a Mixture of Green Solvents. Ind. Eng. Chem. Res. 2016, 55, 7259–7266. [Google Scholar] [CrossRef]
- Rheology, C.F.I. Making Use Of Models: The Cross Model; Rheology School: Warnford, UK, 2013. [Google Scholar]
- Souza, C.; Campos, P.M.B.G.M. Development and photoprotective effect of a sunscreen containing the antioxidants Spirulina and dimethylmethoxy chromanol on sun-induced skin damage. Eur. J. Pharm. Sci. 2017, 104, 52–64. [Google Scholar] [CrossRef] [PubMed]
- Carrico, C.; Pinto, P.; Graca, A.; Goncalves, L.M.; Ribeiro, H.M.; Marto, J. Design and Characterization of a New Quercus Suber-Based Pickering Emulsion for Topical Application. Pharmaceutics 2019, 11, 131. [Google Scholar] [CrossRef] [Green Version]
- Rawat, A.; Singh Gupta, S.S.; Kalluri, K.; Lowenborg, M.; Bhatia, K.; Warner, K. Rheological Characterization in the Development of Topical Drug Products. In The Role of Microstructure in Topical Drug Product Development; AAPS Advances in the Pharmaceutical Sciences Series; American Association of Pharmaceutical Scientists: Arlington, VA, USA, 2019. [Google Scholar]
- Mewis, J.; Wagner, N.J. Thixotropy. Adv. Colloid Interface Sci. 2009, 147, 214–227. [Google Scholar] [CrossRef] [PubMed]
- Mendes, P. Modeling the thixotropic behavior of structured fluids. J. Nonnewton. Fluid Mech. 2009, 164, 66–75. [Google Scholar] [CrossRef]
- Pisal, P.B.; Patil, S.S.; Pokharkar, V.B. Rheological investigation and its correlation with permeability coefficient of drug loaded carbopol gel: Influence of absorption enhancers. Drug Dev. Ind. Pharm. 2013, 39, 593–599. [Google Scholar] [CrossRef] [PubMed]
- Li, D.; Zhao, Y.; Wang, X.; Tang, H.; Wu, N.; Wu, F.; Yu, D.; Elfalleh, W. Effects of (+)-catechin on a rice bran protein oil-in-water emulsion: Droplet size, zeta-potential, emulsifying properties, and rheological behavior. Food Hydrocoll. 2020, 98, 105306. [Google Scholar] [CrossRef]
- Chanamai, R.; McClements, D.J. Dependence of creaming and rheology of monodisperse oil-in-water emulsions on droplet size and concentration. Colloids Surf. A Physicochem. Eng. Asp. 2000, 172, 79–86. [Google Scholar] [CrossRef]
- Tadros, T.F. Emulsion Formation, Stability, and Rheology. In Emulsion Formation and Stability; Wiley-VCH: Weinheim, Germany, 2013; Chapter 1. [Google Scholar]
- Adeyeye, M.; Jain, A.; Ghorab, M.; Reilly, W. Viscoelastic evaluation of topical creams containing microcrystalline cellulose/sodium carboxymethyl cellulose as stabilizer. AAPS Pharmscitech 2002, 3, E8. [Google Scholar] [CrossRef]
- Rangarajan, S. The Rheology Handbook. Paintindia 2011, 61, 151. [Google Scholar]
- Iqbal, N.; Vitorino, C.; Taylor, K.M.G. How can lipid nanocarriers improve transdermal delivery of olanzapine? Pharm. Dev. Technol. 2017, 22, 587–596. [Google Scholar] [CrossRef] [PubMed]
- Fernández-Campos, F.; Obach, M.; Moreno, M.C.; García, A.; González, J. Pharmaceutical development of a generic corticoid semisolid formulation. J. Drug Deliv. Sci. Technol. 2017, 42, 227–236. [Google Scholar] [CrossRef]
- Mircioiu, C.; Voicu, V.; Anuta, V.; Tudose, A.; Celia, C.; Paolino, D.; Fresta, M.; Sandulovici, R.; Mircioiu, I. Mathematical Modeling of Release Kinetics from Supramolecular Drug Delivery Systems. Pharmaceutics 2019, 11, 140. [Google Scholar] [CrossRef] [PubMed] [Green Version]
- Miranda, M.; Cruz, M.T.; Vitorino, C.; Cabral, C. Nanostructuring lipid carriers using Ridolfia segetum (L.) Moris essential oil. Mater. Sci. Eng. C Mater. Biol. Appl. 2019, 103, 109804. [Google Scholar] [CrossRef] [PubMed]
- Lauterbach, A.; Müller-Goymann, C.C. Comparison of rheological properties, follicular penetration, drug release, and permeation behavior of a novel topical drug delivery system and a conventional cream. Eur. J. Pharm. Biopharm. 2014, 88, 614–624. [Google Scholar] [CrossRef] [PubMed]
- Li, C.; Liu, C.; Liu, J.; Fang, L. Correlation Between Rheological Properties, In Vitro Release, and Percutaneous Permeation of Tetrahydropalmatine. AAPS PharmSciTech 2011, 12, 1002–1010. [Google Scholar] [CrossRef] [Green Version]
- Dong, Y.; Qu, H.; Pavurala, N.; Wang, J.; Sekar, V.; Martinez, M.N.; Fahmy, R.; Ashraf, M.; Cruz, C.N.; Xu, X. Formulation characteristics and in vitro release testing of cyclosporine ophthalmic ointments. Int. J. Pharm. 2018, 544, 254–264. [Google Scholar] [CrossRef]
- Mendonsa, N.S.; Pradhan, A.; Sharma, P.; Prado, R.M.B.; Murthy, S.N.; Kundu, S.; Repka, M.A. A quality by design approach to develop topical creams via hot-melt extrusion technology. Eur. J. Pharm. Sci. 2019, 136, 104948. [Google Scholar] [CrossRef] [PubMed]
- He, W.; Tan, Y.; Tian, Z.; Chen, L.; Hu, F.; Wu, W. Food protein-stabilized nanoemulsions as potential delivery systems for poorly water-soluble drugs: Preparation, in vitro characterization, and pharmacokinetics in rats. Int. J. Nanomed. 2011, 6, 521–533. [Google Scholar]
- Hamed, R.; Al Baraghthi, T.; Alkilani, A.Z.; Abu-Huwaij, R. Correlation Between Rheological Properties and In Vitro Drug Release from Penetration Enhancer-Loaded CarbopolA (R) Gels. J. Pharm. Innov. 2016, 11, 339–351. [Google Scholar] [CrossRef]
- Fini, A.; Bergamante, V.; Ceschel, G.C.; Ronchi, C.; De Moraes, C.A.F. Control of Transdermal Permeation of Hydrocortisone Acetate from Hydrophilic and Lipophilic Formulations. AAPS PharmSciTech 2008, 9, 762–768. [Google Scholar] [CrossRef] [PubMed] [Green Version]
- Pradeep Kumar, B.; Bradley, A.C.; Abhishek, J.; Hanumanth Srikanth, C.; Jwala, R. Evaluation of Formulation Parameters on Permeation of Ibuprofen from Topical Formulations Using Strat-M® Membrane. Pharmaceutics 2020, 12, 151. [Google Scholar] [CrossRef] [Green Version]
- Garg, T.; Rath, G.; Goyal, A.K. Comprehensive review on additives of topical dosage forms for drug delivery. Drug Delivery 2015, 22, 969–987. [Google Scholar] [CrossRef] [Green Version]
- Lodén, M. Role of Topical Emollients and Moisturizers in the Treatment of Dry Skin Barrier Disorders. Am. J. Clin. Dermatol. 2003, 4, 771–788. [Google Scholar] [CrossRef] [PubMed]
- Purnamawati, S.; Indrastuti, N.; Danarti, R.; Saefudin, T. The Role of Moisturizers in Addressing Various Kinds of Dermatitis: A Review. Clin. Med. Res. 2017, 15, 75–87. [Google Scholar] [CrossRef] [PubMed] [Green Version]
- Garg, N.K.; Sharma, G.; Singh, B.; Nirbhavane, P.; Tyagi, R.K.; Shukla, R.; Katare, O.P. Quality by Design (QbD)-enabled development of aceclofenac loaded-nano structured lipid carriers (NLCs): An improved dermatokinetic profile for inflammatory disorder(s). Int. J. Pharm. 2017, 517, 413–431. [Google Scholar] [CrossRef] [PubMed]
- Hadgraft, J. Modulation of the Barrier Function of the Skin. Ski. Pharmacol. Appl. Ski. Physiol. 2001, 14, 72–81. [Google Scholar] [CrossRef]
- Eichner, A.; Stahlberg, S.; Sonnenberger, S.; Lange, S.; Dobner, B.; Ostermann, A.; Schrader, T.E.; Hauß, T.; Schroeter, A.; Huster, D.; et al. Influence of the penetration enhancer isopropyl myristate on stratum corneum lipid model membranes revealed by neutron diffraction and 2H NMR experiments. BBA Biomembr. 2017, 1859, 745–755. [Google Scholar] [CrossRef] [PubMed]
- Santos, P.; Watkinson, A.C.; Hadgraft, J.; Lane, M.E. Influence of penetration enhancer on drug permeation from volatile formulations. Int. J. Pharm. 2012, 439, 260–268. [Google Scholar] [CrossRef] [PubMed]
- Hadgraft, J.; Lane, M.E. Advanced topical formulations (ATF). Int. J. Pharm. 2016, 514, 52–57. [Google Scholar] [CrossRef] [PubMed] [Green Version]
- Lennernas, H.; Skrtic, S.; Johannsson, G. Replacement therapy of oral hydrocortisone in adrenal insufficiency: The influence of gastrointestinal factors. Expert Opin. Drug Metab. Toxicol. 2008, 4, 749–758. [Google Scholar] [CrossRef] [PubMed]
- Van Buskirk, G.A.; Arsulowicz, D.; Basu, P.; Block, L.; Cai, B.; Cleary, G.W.; Ghosh, T.; González, M.A.; Kanios, D.; Marques, M.; et al. Passive transdermal systems whitepaper incorporating current chemistry, manufacturing and controls (CMC) development principles. AAPS Pharmscitech 2012, 13, 218–230. [Google Scholar] [CrossRef] [PubMed] [Green Version]
- Simões, A.; Veiga, F.; Vitorino, C.; Figueiras, A. A Tutorial for Developing a Topical Cream Formulation Based on the Quality by Design Approach. J. Pharm. Sci. 2018, 107, 2653–2662. [Google Scholar] [CrossRef] [PubMed]
- Paudel, K.S.; Milewski, M.; Swadley, C.L.; Brogden, N.K.; Ghosh, P.; Stinchcomb, A.L. Challenges and opportunities in dermal/transdermal delivery. Ther. Deliv. 2010, 1, 109. [Google Scholar] [CrossRef] [Green Version]
- Frum, Y.; Eccleston, G.M.; Meidan, V.M. Factors influencing hydrocortisone permeation into human hair follicles: Use of the skin sandwich system. Int. J. Pharm. 2008, 358, 144–150. [Google Scholar] [CrossRef] [PubMed]
- Wei, Z.; Gao, Y. Physicochemical properties of β -carotene bilayer emulsions coated by milk proteins and chitosan e EGCG conjugates. Food Hydrocoll. 2016, 52, 590–599. [Google Scholar] [CrossRef]
- Ngan, C.L.; Basri, M.; Lye, F.F.; Masoumi, H.R.F.; Karjiban, R.A.; Abdul-Malek, E.; Tripathy, M. Comparison of process parameter optimization using different designs in nanoemulsion-based formulation for transdermal delivery of fullerene. Int. J. Nanomed. 2014, 9, 4375–4386. [Google Scholar] [CrossRef] [PubMed] [Green Version]
- Chen, S.H. Brownian diffusion in a dilute dispersion of droplets. J. Colloid Interface Sci. 1999, 209, 31–43. [Google Scholar] [CrossRef] [PubMed]
- Liu, H.; Galbraith, S.C.; Ricart, B.; Stanton, C.; Smith-Goettler, B.; Verdi, L.; O’Connor, T.; Lee, S.; Yoon, S. Optimization of critical quality attributes in continuous twin-screw wet granulation via design space validated with pilot scale experimental data. Int. J. Pharm. 2017, 525, 249–263. [Google Scholar] [CrossRef] [PubMed]
- Rosas, J.G.; Blanco, M.; González, J.M.; Alcalá, M. Pharmaceutical Technology: Quality by design approach of a pharmaceutical gel manufacturing process, part 1: Determination of the design space. J. Pharm. Sci. 2011, 100, 4432–4441. [Google Scholar] [CrossRef] [PubMed]
- Marto, J.; Gouveia, L.; Jorge, I.M.; Duarte, A.; Gonçalves, L.M.; Silva, S.M.C.; Antunes, F.; Pais, A.A.C.C.; Oliveira, E.; Almeida, A.J.; et al. Starch-based Pickering emulsions for topical drug delivery: A QbD approach. Colloids Surf. B Biointerfaces 2015, 135, 183–192. [Google Scholar] [CrossRef] [PubMed]


| Independent Variables | Level | ||
|---|---|---|---|
| −1 | 0 | +1 | |
| x1: Glycerol monostearate amount (%) | 5 | 10 | 15 |
| x2: Isopropyl myristate amount (%) | 3 | 6 | 9 |
| x3: Homogenization rate (rpm) | 11,000 | 16,000 | 22,000 |
| ID | x1 (%) | x2 (%) | x3 (rpm) |
|---|---|---|---|
| F1 | 5 | 3 | 16,000 |
| F2 | 15 | 9 | 16,000 |
| F3 | 5 | 6 | 11,000 |
| F4 | 10 | 9 | 11,000 |
| F5 | 15 | 6 | 11,000 |
| F6 | 5 | 9 | 16,000 |
| F7 | 10 | 6 | 16,000 |
| F8 | 10 | 6 | 16,000 |
| F9 | 10 | 3 | 11,000 |
| F10 | 15 | 3 | 16,000 |
| F11 | 10 | 6 | 16,000 |
| F12 | 10 | 9 | 22,000 |
| F13 | 10 | 3 | 22,000 |
| F14 | 15 | 6 | 22,000 |
| F15 | 5 | 6 | 22,000 |
| Drug Product Quality Attributes | Target | Is it a CQA? | Justification |
|---|---|---|---|
| Dosage form | Cream | - | Emulsion-based semisolid product assists in topical delivery improvement. |
| Route of administration | Topical | - | Local administration avoids systemic side effects. Non-invasive, convenient and painless administration. High patient compliance. |
| Dosage strength | 1 % w/w | - | 1 % hydrocortisone ensures formulation efficacy. |
| Dosage form design | o/w emulsion with solubilized hydrocortisone | - | Biphasic semisolid systems are vehicles that enable an appropriate delivery of hydrocortisone to the target skin layer. |
| Assay | 90.0–110.0 % of the labelled claim; RSD NMT 6.0% | Yes | Influence on therapeutic efficacy. |
| Physical attributes | |||
| Appearance | White smooth cream | No | Not directly related with safety and efficacy. |
| Color | No addition of artificial colors | No | Required to ensure patient compliance and acceptance. |
| Odor | No objectionable odor | No | Impact on physical and chemical stability. |
| pH | 5.5–7.0 | Yes | Compatible with skin pH to prevent local irritation. |
| Droplet size | 2.0–4.5 μm | Yes | Impact on drug product efficacy and stability. |
| Rheological aspects | |||
| η10 | 6.0–8.0 Pa.s | Yes | Impact on cream spreadability which is important for patient compliance. Influence on in situ cream persistence and consequently its duration of action. Influence on physical stability. Impact on drug release and diffusion rate at the microstructure level. |
| Rheological behavior | Non-Newtonian, pseudoplastic pattern | Yes | |
| Rheological model | Herschel-Bulkley and Cross | Yes | |
| SR | 10,000–20,000 Pa/s | Yes | |
| LVR plateau | 3000–5000 Pa | Yes | |
| τ0 | 35.0–50.0 Pa | Yes | |
| τf | 55.0–65.0 Pa | Yes | |
| G’ | 4500–5500 Pa | Yes | |
| G″ | 1500–2000 Pa | Yes | |
| tan δ | 0.35 | Yes | |
| Product performance | |||
| IVRT | |||
| c1 | >120–125 μg/cm2/√t | Yes | To ensure therapeutic efficacy. Useful to assess the sameness of the dosage form. Reflect the effect of formulation and/or process parameters on cream microstructure. |
| k | >2.5–3 t−1 | Yes a | |
| c2 | >0.45–0.55 | Yes | |
| R6h | >6.35–10.0% | Yes | |
| R24h | >12.25–20% | Yes | |
| IVPT | |||
| Jss | >0.25–0.35 μg/cm2/h | Yes | Impact on therapeutic efficacy. Critical to detect particular differences regarding the hydrocortisone permeation rate and extent through the skin. Important to better understand the impact of formulation and/or process parameters. |
| ER | 1 | Yes a | |
| kp | >1.06 × 10⁻² cm/h | Yes | |
| Q6h | >0.8–3.0 μg/cm2 | Yes | |
| Q24h | >2.0–8.0 μg/cm2 | Yes | |
| Q48h | >6.0–15.0 μg/cm2 | Yes | |
| tlag | 10 h | Yes a | |
| Physical stability | |||
| Instability index | NMT 0.13 | Yes | Critical to forecast physical stability. Important to maintain formulations performance during the storage period. |
| Sedimentation rate | NMT 0.15 μm/s | Yes | |
| Creaming rate | NMT 0.08 μm/s | Yes |
| Category | Risk Area | Variables | Failure Mode | Failure Cause | Failure Effect | S | P | D | RPN |
|---|---|---|---|---|---|---|---|---|---|
| CMAs | Formulation | API | Inadequate phase solubilization Low/excessive concentration | Non-homogeneity. | 5 | 2 | 3 | 30 | |
| Emollients | Weighing error Lack of scientific knowledge Lack of detail formulation understanding Lack of excipients function | Cream with inappropriate structure-form. | 3 | 2 | 1 | 6 | |||
| Emulsifying agent | Undesirable droplet size. Physical instability. | 5 | 3 | 1 | 15 | ||||
| Stiffening agent | Inadequate rheological properties. Inadequate drug release and permeation. Physical instability. | 4 | 3 | 4 | 48 | ||||
| Permeation enhancer | Inadequate drug permeation. | 5 | 3 | 3 | 45 | ||||
| Alkalizing agent | Skin irritancy. Inadequate rheological properties. Inadequate drug release and permeation. Physical instability. Chemical instability. | 5 | 2 | 1 | 10 | ||||
| Humectant | Cream with inappropriate structure-form. | 3 | 1 | 1 | 3 | ||||
| Antioxidants | Chemical instability. | 5 | 2 | 1 | 10 | ||||
| Preservatives | Microbiological instability. | 5 | 2 | 1 | 10 | ||||
| Solvent | Non-homogeneity. Drug recrystallization. | 5 | 2 | 1 | 10 | ||||
| Purified water | Cream with inappropriate structure-form. | 5 | 2 | 1 | 10 | ||||
| CPPs | Production process | Equipment type | Inappropriate shear mechanism Low/excessive bend/homogenization time/rate Low/excessive blend/homogenization temperature Equipment stop inadvertently | Lack of process monitoring Lack of scientific knowledge Lack of equipment specifications knowledge Malfunction of the equipment | Non-homogeneity. Undesirable droplet size. Physical instability. | 5 | 3 | 1 | 15 |
| Rotor–stator rod | Non-homogeneity. Physical instability. | 5 | 3 | 1 | 15 | ||||
| De-aeration via vacuum | Excessive air entrapment. | 3 | 2 | 2 | 12 | ||||
| Phase addition order | Undesirable droplet size. Physical instability. | 5 | 2 | 1 | 10 | ||||
| Blending temperature | Non-homogeneity. Impurities. Chemical instability. Premature drug crystallization. | 4 | 3 | 1 | 12 | ||||
| Blending rate | Non-homogeneity. Undesirable droplet size. Physical instability. | 5 | 2 | 1 | 10 | ||||
| Blending time | Non-homogeneity. Undesirable droplet size. Physical instability. | 5 | 3 | 1 | 15 | ||||
| Homogenization temperature | Non-homogeneity. Impurities. Chemical instability. Premature crystallization. | 5 | 3 | 1 | 15 | ||||
| Homogenization rate | Non-homogeneity. Undesirable droplet size. Inadequate rheological properties. Inadequate drug release and permeation rate. Physical instability. | 5 | 4 | 2 | 40 | ||||
| Homogenization time | Non-homogeneity. Undesirable droplet size. Inadequate rheological properties. Inadequate drug release and permeation rate. Physical instability. | 5 | 3 | 1 | 15 | ||||
| Cooling rate | Non-homogeneity. Inadequate rheological properties. Inadequate drug release and permeation rate. Physical instability. | 3 | 3 | 1 | 9 |
| ID | Droplet Size (μm) | Assay (%/RSD) | pH | Instability Index | Sedimentation Rate (μm/s) | Creaming Rate (μm/s) |
|---|---|---|---|---|---|---|
| F1 | 2.49 ± 0.86 C | 92.0/0.8 C | 6.65 ± 0.04 C | 0.270 ± 0.093 NC | 0.255 ± 0.124 NC | 0.24 ± 0.04 NC |
| F2 | 2.74 ± 0.81 C | 93.0/ 1.1 C | 6.73 ± 0.04 C | 0.077 ± 0.006 C | 0.15 ± 0.05 NC | 0.03 ± 0.03 C |
| F3 | 3.1 ± 1.0 C | 101.6/4.1 C | 6.60 ± 0.05 C | 0.28 ± 0.13 NC | 0.08 ± 0.03 C | 0.37 ± 0.08 NC |
| F4 | 3.0 ± 1.0 C | 106.7/9.9 NC | 6.62 ± 0.06 C | 0.17 ± 0.05 NC | 0.11 ± 0.03 C | 0.099 ± 0.006 NC |
| F5 | 3.2 ± 1.0 C | 87.1/0.1 NC | 6.653 ± 0.012 C | 0.072 ± 0.006 C | 0.19 ± 0.07 NC | 0.019 ± 0.011 C |
| F6 | 2.26 ± 0.50 C | 118.5/15.5 NC | 6.570 ± 0.008 C | 0.3 ± 0.2 NC | 0.12 ± 0.02 C | 0.36 ± 0.13 NC |
| F7 | 2.70 ± 0.68 C | 111.9/0.9 NC | 6.677 ± 0.012 C | 0.116 ± 0.007 C | 0.13 ± 0.02 C | 0.05 ± 0.02 C |
| F8 | 2.72 ± 0.68 C | 107.3/0.2 C | 6.660 ± 0.009 C | 0.113 ± 0.003 C | 0.10 ± 0.03 C | 0.05 ± 0.02 C |
| F9 | 2.6 ± 1.0 C | 112.6/0.6 NC | 6.680 ± 0.008 C | 0.071 ± 0.004 C | 0.19 ± 0.08 NC | 0.03 ± 0.02 C |
| F10 | 2.59 ± 0.79 C | 110.7/0.4 NC | 6.675 ± 0.012 C | 0.031 ± 0.012 C | 0.11 ± 0.04 NC | - |
| F11 | 2.50 ± 0.77 C | 108.7/1.1 C | 6.733 ± 0.017 C | 0.14 ± 0.02 NC | 0.11 ± 0.03 C | 0.06 ± 0.01C |
| F12 | 1.63 ± 0.36 C | 84.4/3.1 NC | 6.75 ± 0.02 C | 0.118 ± 0.004 C | 0.12 ± 0.03 C | 0.05 ± 0.02C |
| F13 | 2.15 ± 0.62 C | 120.5/ 0.8 NC | 6.673 ± 0.005 C | 0.06 ± 0.02 C | 0.052 ± 0.000 C | 0.03 ± 0.02 C |
| F14 | 2.17 ± 0.69 C | 112.0/1.7 NC | 6.74 ± 0.00 C | 0.048 ± 0.003 C | 0.082 ± 0.009 C | 0.009 ± 0.000 C |
| F15 | 1.40 ± 0.28 C | 81.9/ 2.1 NC | 6.627 ± 0.005 C | 0.27 ± 0.12 NC | 0.031 ± 0.002 C | 0.38 ± 0.07 NC |
| ID | Rotational Measurements | Oscillatory Measurements | ||||||
|---|---|---|---|---|---|---|---|---|
| CR Step Test | CR Ramp Test | Amplitude Sweep Test | Frequency Sweep Test at 1 Hz | |||||
| η10 (Pa.s) | SR (Pa/s) | LVR (Pa) plateau | τ0 (Pa) | τf (Pa) | G’ (Pa) | G″ (Pa) | tan δ | |
| F1 | 0.91 ± 0.11 NC | 942 ± 224 NC | 52 ± 3 NC | 6.1 ± 0.4 NC | 7.4 ± 1.1 NC | 84 ± 5 NC | 29.7 ± 1.3 NC | 0.356 ± 0.008 NC |
| F2 | 11.1 ± 0.9 NC | 71,770 ± 3532 NC | 26,613 ± 458 NC | 40 ± 5 NC | 102 ± 14 NC | 29,621 ± 223 NC | 9846 ± 250 NC | 0.332 ± 0.011 C |
| F3 | 2.08 ± 0.02 NC | 2225 ± 125 NC | 330 ± 38 NC | 5.6 ± 0.7 NC | 10.0 ± 0.5 NC | 337 ± 15 NC | 86.24 ± 0.91 NC | 0.256 ± 0.009 C |
| F4 | 6.5 ± 0.6 NC | 13,417 ± 533 C | 3257 ± 335 C | 10.4 ± 0.6 NC | 13.4 ± 1.3 | 3242 ± 265 NC | 916 ± 9 NC | 0.28 ± 0.02 C |
| F5 | 8.5 ± 1.0 NC | 62,847 ± 7888 NC | 28,510 ± 623 | 32 ± 3 NC | 64 ± 2 C | 30,522 ± 858 NC | 11,247 ± 151 NC | 0.369 ± 0.007 NC |
| F6 | 1.265 ± 0.007 NC | 1157 ± 24 NC | 106 ± 3 NC | 5.63 ± 0.02 NC | 7.90 ± 0.08 NC | 130 ± 6 NC | 34.0 ± 0.5 NC | 0.262 ± 0.011 C |
| F7 | 7.2 ± 0.6 C | 12,720 ± 401 C | 3226 ± 262 C | 13 ± 3 NC | 21 ± 2 NC | 3465 ± 106 NC | 855 ± 20 NC | 0.247 ± 0.003 C |
| F8 | 7.7 ± 0.3 C | 14,600 ± 640 C | 3549 ± 328 C | 28 ± 5 NC | 35 ± 9 NC | 3374 ± 236 NC | 779 ± 72 NC | 0.231 ± 0.005 C |
| F9 | 7.1 ± 0.2 C | 6319 ± 310 NC | 2907 ± 59 NC | 51 ± 2 NC | 69 ± 2 NC | 3191 ± 173 NC | 840 ± 22 NC | 0.264 ± 0.008 C |
| F10 | 9.5 ± 0.3 NC | 78,470 ± 3401 NC | 42,207 ± 1848 NC | 74 ± 10 NC | 104 ± 15 NC | 50,732 ± 1381 NC | 18,732 ± 1150 NC | 0.369 ± 0.013 NC |
| F11 | 6.4 ± 0.8 NC | 21,017 ± 927 NC | 6259 ± 526 NC | 12.8 ± 1.4 NC | 20 ± 3 NC | 6159 ± 351 NC | 1878 ± 92 C | 0.305 ± 0.004 C |
| F12 | 7.21 ± 0.03 C | 32,537 ± 140 NC | 16,213 ± 204 NC | 22 ± 3 NC | 33.7 ± 1.2 NC | 17,935 ± 592 NC | 6977 ± 311 NC | 0.39 ± 0.02 NC |
| F13 | 8.0 ± 1.2 NC | 22,513 ± 873 NC | 5799 ± 172 NC | 44 ± 11 C | 60 ± 10 C | 6358 ± 298 NC | 1791 ± 75 C | 0.282 ± 0.006 C |
| F14 | 10.9 ± 0.2 NC | 60,910 ± 1467 NC | 24,680 ± 549 NC | 30.9 ± 0.2 NC | 45.8 ± 0.4 NC | 27,372 ± 1399 NC | 9645 ± 932 NC | 0.35 ± 0.03 NC |
| F15 | 0.98 ± 0.06 NC | 440 ± 80 NC | 19 ± 3 NC | 3.6 ± 0.6 NC | 3.6 ± 1 NC | 112 ± 8 NC | 57 ± 3 NC | 0.513 ± 0.016 NC |
| ID | Ostwald de Waele | Herschel-Bulkley | Bingham | |||
|---|---|---|---|---|---|---|
| τ = K.n | R2 | τ = τ0+ K.n | R2 | τ = τ0+ K. | R2 | |
| F1 | 4.062.0.4342 | 0.9926 | 1.05 + 3.1.0.4965 | 0.9939 | 4.125 + 0.4404. | 0.95 |
| F2 | 86.54.0.3104 | 0.8258 | 83.89 + 8.255.0.8938 | 0.9291 | 87.94 + 5.556. | 0.9275 |
| F3 | 19.46.0.233 | 0.9775 | 3.894 + 15.47.0.2741 | 0.9781 | 19.32 + 0.7574. | 0.8649 |
| F4 | 48.44.0.3501 | 0.9514 | 38.97 + 11.78.0.6901 | 0.9859 | 49.6 + 3.6. | 0.9705 |
| F5 | 91.62.0.2211 | 0.7604 | 88.32 + 2.924.1.09 | 0.9412 | 86.35 + 4.071. | 0.9402 |
| F6 | 9.929.0.2993 | 0.991 | 4.161 + 5.721.0.4169 | 0.9955 | 9.85 + 0.5764. | 0.9363 |
| F7 | 65.02.0.2385 | 0.9223 | 53.73 + 10.28.0.6643 | 0.9792 | 63.27 +2.877. | 0.9598 |
| F8 | 46.05.0.3749 | 0.9694 | 32.06 + 16.160.6235 | 0.9886 | 47.46 + 3.853. | 0.965 |
| F9 | 39.64.0.4130 | 0.9775 | 23.91 + 18.01.0.6001 | 0.9885 | 41.30 + 9.911. | 0.9615 |
| F10 | 135.1.0.115 | 0.4347 | 124.8 + 0.9316.1.387 | 0.7642 | 118.8 + 3.861. | 0.7508 |
| F11 | 57.24.0.2924 | 0.9674 | 35.81 + 21.32.0.5125 | 0.9838 | 56.95 + 3.233. | 0.941 |
| F12 | 59.34.0.3036 | 0.9263 | 52.65 + 8.325.0.7822 | 0.9863 | 59.09 + 3.679. | 0.9799 |
| F13 | 60.1.0.3452 | 0.9497 | 49.49 + 13.43.07069 | 0.988 | 61.34 + 4.444. | 0.975 |
| F14 | 110.1.0.2337 | 0.6908 | 106.3 + 4.432.1.042 | 0.8661 | 105.1 + 5.173. | 0.8659 |
| F15 | 5.232.0.409 | 0.9896 | 1.316 + 3.997.0.4702 | 0.9909 | 5.298 + 0.5069. | 0.9402 |
| ID | Casson | Cross | ||||
| τ1/2= τ01/2 + (K.)1/2 | R2 | η = η∞ + [(η0− η∞)/(1+ (C.)m)] | R2 | |||
| F1 | 2.261/2 + (0.258.)1/2 | 0.9838 | 1.804 + [(2.73e+04 − 1.804)/(1 + 716.)0.436)] | 0.9945 | ||
| F2 | 66.391/2 + (1.939.)1/2 | 0.8762 | 16.02 + [(25.59e+04 − 16.02)/(1 + 341.)0.785)] | 0.9978 | ||
| F3 | 14.31/2 + (0.2839.)1/2 | 0.9485 | 3.647 + [(6.99e+04 − 3.647)/(1 + 1197.)0.212)] | 0.9987 | ||
| F4 | 35.111/2 + (1.517.)1/2 | 0.976 | 12.27 + [(0.31e+04 − 12.27)/(1 + 26.54.)0.506)] | 0.998 | ||
| F5 | 72.231/2 + (1.054.)1/2 | 0.8754 | 11.34 + [(13.35e+04 − 11.34)/(1 + 335.12.)0.797)] | 0.9926 | ||
| F6 | 6.8181/2 + (0.2492.)1/2 | 0.9813 | 2.073 + [(3.23e+04 − 2.073)/(1 + 1596.)0.147)] | 0.9974 | ||
| F7 | 50.061/2 + (0.903.)1/2 | 0.9721 | 9.467 + [(7.087e+04 − 9.467)/(1 + 557.)0.1568)] | 0.9903 | ||
| F8 | 31.761/2 + (1.766.)1/2 | 0.9818 | 11.35 + [11.2e+04 − 11.35)/(1 + 549.)0.342)] | 0.999 | ||
| F9 | 25.78/2 + (1.98.)1/2 | 0.9833 | 12.91 + [(23.51e+04 − 12.91)/(1 + 610.)0.54)] | 0.997 | ||
| F10 | 104.21/2 + (0.7152.)1/2 | 0.6719 | 21.34 + [(9.021e+04 − 21.34)/(1 + 117.43.)0.544)] | 1 | ||
| F11 | 40.851/2 + (1.3.)1/2 | 0.9747 | 11.44 + [(1.35e+04 − 11.44)/(1 + 83.)0.497)] | 0.9981 | ||
| F12 | 44.641/2 + (1.327.)1/2 | 0.9687 | 13.88 + [(0.41e+04 − 13.88)/(1 + 341.)0.476)] | 0.999 | ||
| F13 | 43.79/2 + (1.818.)1/2 | 0.975 | 15.17 + [(0.516e+04 − 15.17)/(1 + 33.)0.494)] | 0.9992 | ||
| F14 | 84.221/2 + (1.472.)1/2 | 0.7959 | 6.826 + [(5.35e+04 − 6.826)/(1+ 82.)0.561)] | 1 | ||
| F15 | 31/2 + (0.2874.)1/2 | 0.9774 | 1.83 + [(2.7e+04 − 1.83)/(1 + 471.3.)0.683)] | 0.9909 | ||
| ID | Higuchi-c1.√t | Korsmeyer-Peppas-k.tc2 | R6h (%) | R24h (%) | |||
|---|---|---|---|---|---|---|---|
| c1 (μg/cm2/√t) | R2 | k (t−1) | c2 | R2 | |||
| F1 | 149 ± 3 C | 0.98786 | 2.83 ± 0.15 | 0.54 ± 0.02 C | 0.99225 | 7.8 ± 0.2 C | 15.4 ± 0.5 C |
| F2 | 158 ± 3 C | 0.99034 | 3.7 ± 0.2 | 0.49 ± 0.02 C | 0.99081 | 9.1 ± 0.5 C | 16.4 ± 0.6 C |
| F3 | 147 ± 3 C | 0.98910 | 3.05 ± 0.17 | 0.49 ± 0.02 C | 0.98917 | 7.6 ± 0.3 C | 13.7 ± 0.5 C |
| F4 | 153 ± 4 C | 0.97747 | 4.1 ± 0.2 | 0.45 ± 0.02 NC | 0.98578 | 9.6 ± 0.9 C | 16.1 ± 1.4 C |
| F5 | 149 ± 2 C | 0.99276 | 3.8 ± 0.2 | 0.48 ± 0.02 C | 0.99224 | 9.3 ± 0.9 C | 17.0 ± 1.2 C |
| F6 | 112 ± 2 NC | 0.98950 | 2.84 ± 0.17 | 0.52 ± 0.02 C | 0.98932 | 7.5 ± 0.4 C | 14.1 ± 0.9 C |
| F7 | 125.4 ± 1.6 NC | 0.99546 | 2.06 ± 0.08 | 0.502 ± 0.015 C | 0.99544 | 5.2 ± 0.0 NC | 9.9 ± 0.1 NC |
| F8 | 114 ± 2 NC | 0.99245 | 2.04 ± 0.11 | 0.50 ± 0.02 C | 0.99125 | 5.1 ± 0.4 F | 9.7 ± 0.8 F |
| F9 | 137 ± 2 C | 0.99316 | 2.47 ± 0.09 | 0.481 ± 0.015 C | 0.99495 | 6.0 ± 0.2 F | 11.1 ± 0.4 NC |
| F10 | 173 ± 2 C | 0.99489 | 3.00 ± 0.11 | 0.523 ± 0.014 C | 0.99587 | 7.9 ± 0.2 C | 15.5 ± 0.7 C |
| F11 | 138 ± 2 C | 0.99231 | 2.39 ± 0.11 | 0.53 ± 0.02 C | 0.99407 | 6.4 ± 0.6 F | 12.5 ± 0.8 NC |
| F12 | 134 ± 5 C | 0.96969 | 2.67 ± 0.13 | 0.63 ± 0.02 C | 0.99549 | 8.8 ± 1.7 C | 19.3 ± 2.5 C |
| F13 | 156 ± 2 C | 0.99532 | 2.63 ± 0.09 | 0.506 ± 0.015 C | 0.99551 | 6.8 ± 0.3 C | 12.9 ± 0.9 NC |
| F14 | 157 ± 3 C | 0.99226 | 3.08 ± 0,16 | 0.50 ± 0.02 C | 0.99076 | 8.3 ± 1.2 C | 14.7 ± 1.2 C |
| F15 | 196 ± 7 C | 0.96899 | 4.1 ± 0.4 | 0.59 ± 0.03 C | 0.98454 | 12.4 ± 0.2C | 25 ± 1 C |
| ID | Jss (μg/cm2/h) | ER (Jss) | Kp (e−2) (cm/h) | Q6h (μg/cm2) | Q24h (μg/cm2) | Q48h (μg/cm2) | tlag (h) |
|---|---|---|---|---|---|---|---|
| F1 | 0.27 ± 0.04 NC | 0.77 | 0.839 NC | 1.6 ± 0.9 NC | 4 ± 2 C | 12 ± 7 NC | 10 |
| F2 | 0.31 ± 0.09 C | 0.89 | 0.953 NC | 1.8 ± 1.1 NC | 5 ± 3 C | 17 ± 10 C | 10 |
| F3 | 0.4 ± 0.2 C | 1.14 | 1.12 C | 1.8 ± 1.0 C | 4 ± 2 C | 13 ± 7 C | 24 |
| F4 | 0.37 ± 0.02 C | 1.06 | 0.991 NC | 1.9 ± 1.1 C | 5 ± 3 C | 16 ± 9 C | 10 |
| F5 | 0.43 ± 0.03 C | 0.94 | 1.08 C | 1.7 ± 1.0 NC | 5 ± 3 C | 18 ± 11 C | 10 |
| F6 | 0.31 ± 0.11 C | 0.89 | 0.747 NC | 1.8 ± 1.0 C | 3.0 ± 1.7 C | 11 ± 6 NC | 24 |
| F7 | 0.49 ± 0.09 C | 1.40 | 1.25 C | 1.8 ± 1.0 C | 6 ± 3 C | 21 ± 12 C | 10 |
| F8 | 0.5 ± 0.2 C | 1.51 | 1.41 C | 1.7 ± 1.0 NC | 4 ± 2 C | 17 ± 10 C | 24 |
| F9 | 0.43 ± 0.15 C | 1.23 | 1.09 C | 1.8 ± 1.1 F | 5 ± 3 C | 18 ± 11 C | 10 |
| F10 | 0.39 ± 0.11 C | 1.10 | 1.01 NC | 1.8 ± 1.0 C | 5 ± 3 C | 17 ± 10 C | 10 |
| F11 | 0.97 ± 0.08 C | 2.77 | 2.55 C | 1.8 ± 1.1 NC | 9 ± 5 C | 40 ± 23 C | 10 |
| F12 | 0.16 ± 0.03 NC | 0.46 | 0.542 NC | 1.7 ± 1.0 NC | 3 ± 2 NC | 8 ± 5 NC | 10 |
| F13 | 0.255 ± 0.015 NC | 0.73 | 0.563 NC | 1.6 ± 0.9 NC | 3 ± 2 NC | 11 ± 7 NC | 10 |
| F14 | 0.394 ± 0.142 C | 1.13 | 1.01 NC | 1.9 ± 1.1 C | 5 ± 3 C | 17 ± 10 C | 10 |
| F15 | 0.245 ± 0.061 NC | 0.70 | 0.855 NC | 1.8 ± 1.0 C | 4 ± 2 C | 11 ± 6 NC | 10 |
| CQAs | IVRT | IVPT | |||||||
|---|---|---|---|---|---|---|---|---|---|
| c1 | c2 | R6h | R24h | Jss | Kp | Q6h | Q24h | Q48h | |
| Droplet size | +++ | + | +++ | +++ | + | + | + | + | + |
| η10 | +++ | + | +++ | +++ | + | + | + | + | + |
| SR | +++ | + | +++ | +++ | + | + | + | + | + |
| LVR plateau | ++ | + | + | + | + | + | + | + | + |
| τ0 | ++ | + | + | + | + | + | + | + | + |
| τf | ++ | + | + | + | + | + | + | + | + |
| G’ | ++ | + | ++ | ++ | + | + | + | + | + |
| G″ | ++ | + | ++ | ++ | + | + | + | + | + |
| tan δ | ++ | + | + | + | + | + | + | + | + |
| Assay | +++ | +++ | +++ | +++ | + | + | + | + | + |
| pH | ++ | ++ | ++ | ++ | +++ | +++ | +++ | +++ | +++ |
| Instability index | ++ | + | ++ | ++ | + | ++ | ++ | ++ | ++ |
| Sedimentation rate | ++ | + | ++ | ++ | + | ++ | ++ | ++ | ++ |
| Creaming rate | ++ | + | ++ | ++ | + | ++ | ++ | ++ | ++ |
© 2020 by the authors. Licensee MDPI, Basel, Switzerland. This article is an open access article distributed under the terms and conditions of the Creative Commons Attribution (CC BY) license (http://creativecommons.org/licenses/by/4.0/).
Share and Cite
Simões, A.; Veiga, F.; Vitorino, C. Progressing Towards the Sustainable Development of Cream Formulations. Pharmaceutics 2020, 12, 647. https://doi.org/10.3390/pharmaceutics12070647
Simões A, Veiga F, Vitorino C. Progressing Towards the Sustainable Development of Cream Formulations. Pharmaceutics. 2020; 12(7):647. https://doi.org/10.3390/pharmaceutics12070647
Chicago/Turabian StyleSimões, Ana, Francisco Veiga, and Carla Vitorino. 2020. "Progressing Towards the Sustainable Development of Cream Formulations" Pharmaceutics 12, no. 7: 647. https://doi.org/10.3390/pharmaceutics12070647