1. Introduction
The emergence of antibiotic resistance in bacteria is a serious global threat to human health. Common enteric bacterial pathogens have become progressively more resistant to conventional frontline antibiotics [
1,
2]. Treatment of antibiotic resistant bacterial infections is an urgent priority. National State Health Departments around the world are banning general antibiotic use in animal husbandry; alternative, safe, and low-cost biocontrol strategies to reduce pathogen carriage in livestock and poultry are urgently needed. Development of new classes of novel antibiotics are not keeping pace with the rate of antibiotic resistance [
3]. Exploration of alternative treatment options are urgently needed [
4]. Truly virulent bacteriophages (phages) are viruses that infect and kill bacteria in a highly specific manner. They represent a promising approach to targeting bacterial infections in a treatment known as phage therapy [
5,
6,
7,
8]. The specific interaction between bacteriophages and their bacterial hosts makes them an attractive alternative to employing broad spectrum antibiotics in modulating and maintaining a healthy gut microbiome [
4,
9]. In instances of enteric bacterial infections where the causative agent and strain may be suitably diagnosed, treatment with a sufficiently high initial phage dose could promote rapid in situ phage multiplication and killing of the targeted bacteria [
10,
11,
12]. Enteric infections worldwide are typically caused by pathogens such as
Escherichia coli,
Salmonella spp,
Vibrio cholerae, and
Clostridium difficile [
13]. Enteric pathogens could be promising candidates for the development of phage therapy; however, there are significant barriers to be overcome in terms of the logistics of delivering a stable, defined phage dose to the infection site [
14].
There is likely to be a significant loss in the titre of orally administered phages by the time they reach the intended infection site [
15]. Liquid phage formulations taken orally exposes phages to stomach acidity and digestive tract contents (enzymes such as pepsin and pancreatin), increasing the risk of phage viability loss [
16]. A recent in vivo study in chickens showed a significant reduction (3 log reductions compared to the dose given) in viable phages reaching the gastrointestinal tract due to stomach acid exposure [
17]. Mice receiving an oral dose (T4 coliphages in drinking water) of 10
9 PFU/g gut contents had a thousand-fold lower phage titer, indicating a sizable loss in phage activity [
16]. Phage inactivation attributed to stomach acidity may in part have been responsible for failure of a recent clinical trial in children using phage therapy to treat acute bacterial diarrhoea symptoms [
14]. Acidity in the stomach as well as bile and digestive enzymes and other proteases in the intestinal tract and stomach are important environmental stresses for phage inactivation [
18,
19,
20]. Oral application of phages in Georgia and Poland are typically preceded by gastric neutralization [
21]. There is a clear need to protect phages against adverse gastrointestinal environmental conditions and to control their targeted release at the site of infection such as in the lower gastrointestinal tract (GIT) compartments of the cecum and colon for
E. coli infections; this is achievable through encapsulation [
19,
20,
22]. Microencapsulated phages may also result in longer transit times through the GIT in comparison with application of free phages due to mucoadhesive interactions with the gastrointestinal mucus [
23] or in animals such as chickens, where retention of microparticles in the crop may result in slowing their transit through the GIT [
17]. The purpose of encapsulation is to protect phages from harsh environmental stresses found in the gastrointestinal tract as well as to protect the phages during processing and storage prior to use [
24], whilst yielding a product that is easy to handle and apply, e.g., with animal feed [
17].
We report here for the first time the use of a scalable membrane emulsification platform technology to encapsulate phages suitable for targeted delivery to the gastrointestinal tract. Small microparticles with encapsulated E. coli-phage K1F in a composite ES100® and alginate matrix were produced using microsieve membranes, which are arrays of uniform micropores. A novel aspect of the research presented here is demonstration of the suitability of microencapsulation of phages using a low-shear membrane emulsification process that allows the manufacture of uniform micron-sized, pH-responsive solid oral dosage forms using acidified oil for the precipitation of Eudragit® S100 (ES100) and calcium ions to induce alginate gelation in solution. The technique affords control over the choice of formulation as well as morphology of the microparticles, including their size and size distribution; these influence phage release kinetics, phage loading, and encapsulation efficiency. The resulting pH-sensitive microcapsules were designed to survive the transition of phages delivered orally via the mouth and through the stomach, followed by phage release in the intestine. The small size of the microcapsules is particularly useful for efficacy testing of encapsulated phages via oral delivery using small-bore gavage tubes for testing in animal models such as in mice and rats.
2. Materials and Methods
2.1. Chemical Reagents
A methyl methacrylate co-methacrylic acid copolymer Eudragit® S100 was bought from Evonik, Germany. Alginate (medium viscosity) was bought from Sigma Aldrich, Gillingham, UK. Miglyol 840 (propylene glycol diester of caprylic/capric acid) was bought from Safic-Alcan UK Ltd., Warrington, UK. Food grade Castor oil was purchased from Elf Foods, Loughborough, UK. Polyglycerol polyricinoleate (PGPR), which is an oil-soluble surfactant, was bought from Aston Chemicals Ltd., Aylesbury, UK. Calcium chloride, p-toluenesulfonic acid, Tween 20, and sodium chloride were bought from Fisher Scientific, Loughborough, UK. Sorensen’s buffer (0.2 M) was used to dissolve the microparticles. It was prepared by mixing different proportions of potassium phosphate monobasic (KH2PO4) with sodium phosphate dibasic (Na2HPO4) (for pH 7, 50 mL of KH2PO4, and 50 mL of Na2HPO4) (Fisher Scientific, Loughborough, UK). Pancreatin and pepsin were bought from Sigma Aldrich, UK for addition to the simulated intestinal fluid and simulated gastric fluid, respectively.
2.2. Model Bacterium and Bacteriophage
E. coli strain EV36, which is a K12/K1 hybrid developed by conjugation of Hfr kps + strain [
25], was kindly provided by Dr. Eric R. Vimr. This strain is susceptible to K1-specific phages, including K1F and K1-5 [
26]. Phage K1F was kindly provided by Dr. Dean Scholl (to Dr. Sagona) and is a T7-like phage first isolated from sewage in 1984 [
27].
E. coli strain EV36 cells were made electrocompetent and were transformed with an RFP plasmid according to a published protocol [
28].
E. coli strain EV36-RFP cells were cultured in a Luria–Bertani (LB) medium (Oxoid, Ltd., Basingstoke, UK) with the addition of 0.5 mM IPTG and 10 mg/mL Ampicillin sodium salt (Sigma Aldrich, Gillingham, UK).
Phage K1F was propagated on E. coli strain EV36-RFP. Phage stocks were propagated by growing a fresh culture of E. coli strain EV36-RFP in an incubator shaker at 37 °C until the OD550 reached 0.2. Subsequently, phage K1F was added at a Multiplicity of Infection (MOI) of 0.01. Following complete lysis of the bacteria, the culture was centrifuged for 15 min at 2000× g and the supernatant was filtered through a 0.2-µm filter (Millipore, Watford, UK). The phage stock was stored at 4 °C until further use.
The double-layer agar method was used for plaque assays, as described by Mahony et al. [
29] and Goh at al. [
30]. Briefly, 10 µL of overnight culture of
E. coli strain EV36-RFP was added to a 50:50 mixture of LB soft agar 0.9% (
w/
v) and salt mixture (0.4 M MgCl
2 and 0.1 M CaCl
2; Oxoid Ltd. Basingstoke, UK). This was poured onto LB agar plates and set under a laminar flow hood. Ten µL of phage solution was serially diluted ten-fold in LB over an 8-log dilution range 10
−1 through 10
−8. Each dilution was spotted in triplicate and incubated at 37 °C overnight. The next day, the number of phage plaques in each spot were enumerated. In a similar manner, for bacterial growth, serial dilutions of bacterial cultures were spotted on LB agar and incubated overnight at 37 °C. Bacteria concentration was determined by counting colonies and expressed as a colony forming unit (CFU/mL).
2.3. Free Phage Sensitivity at Different pH Values
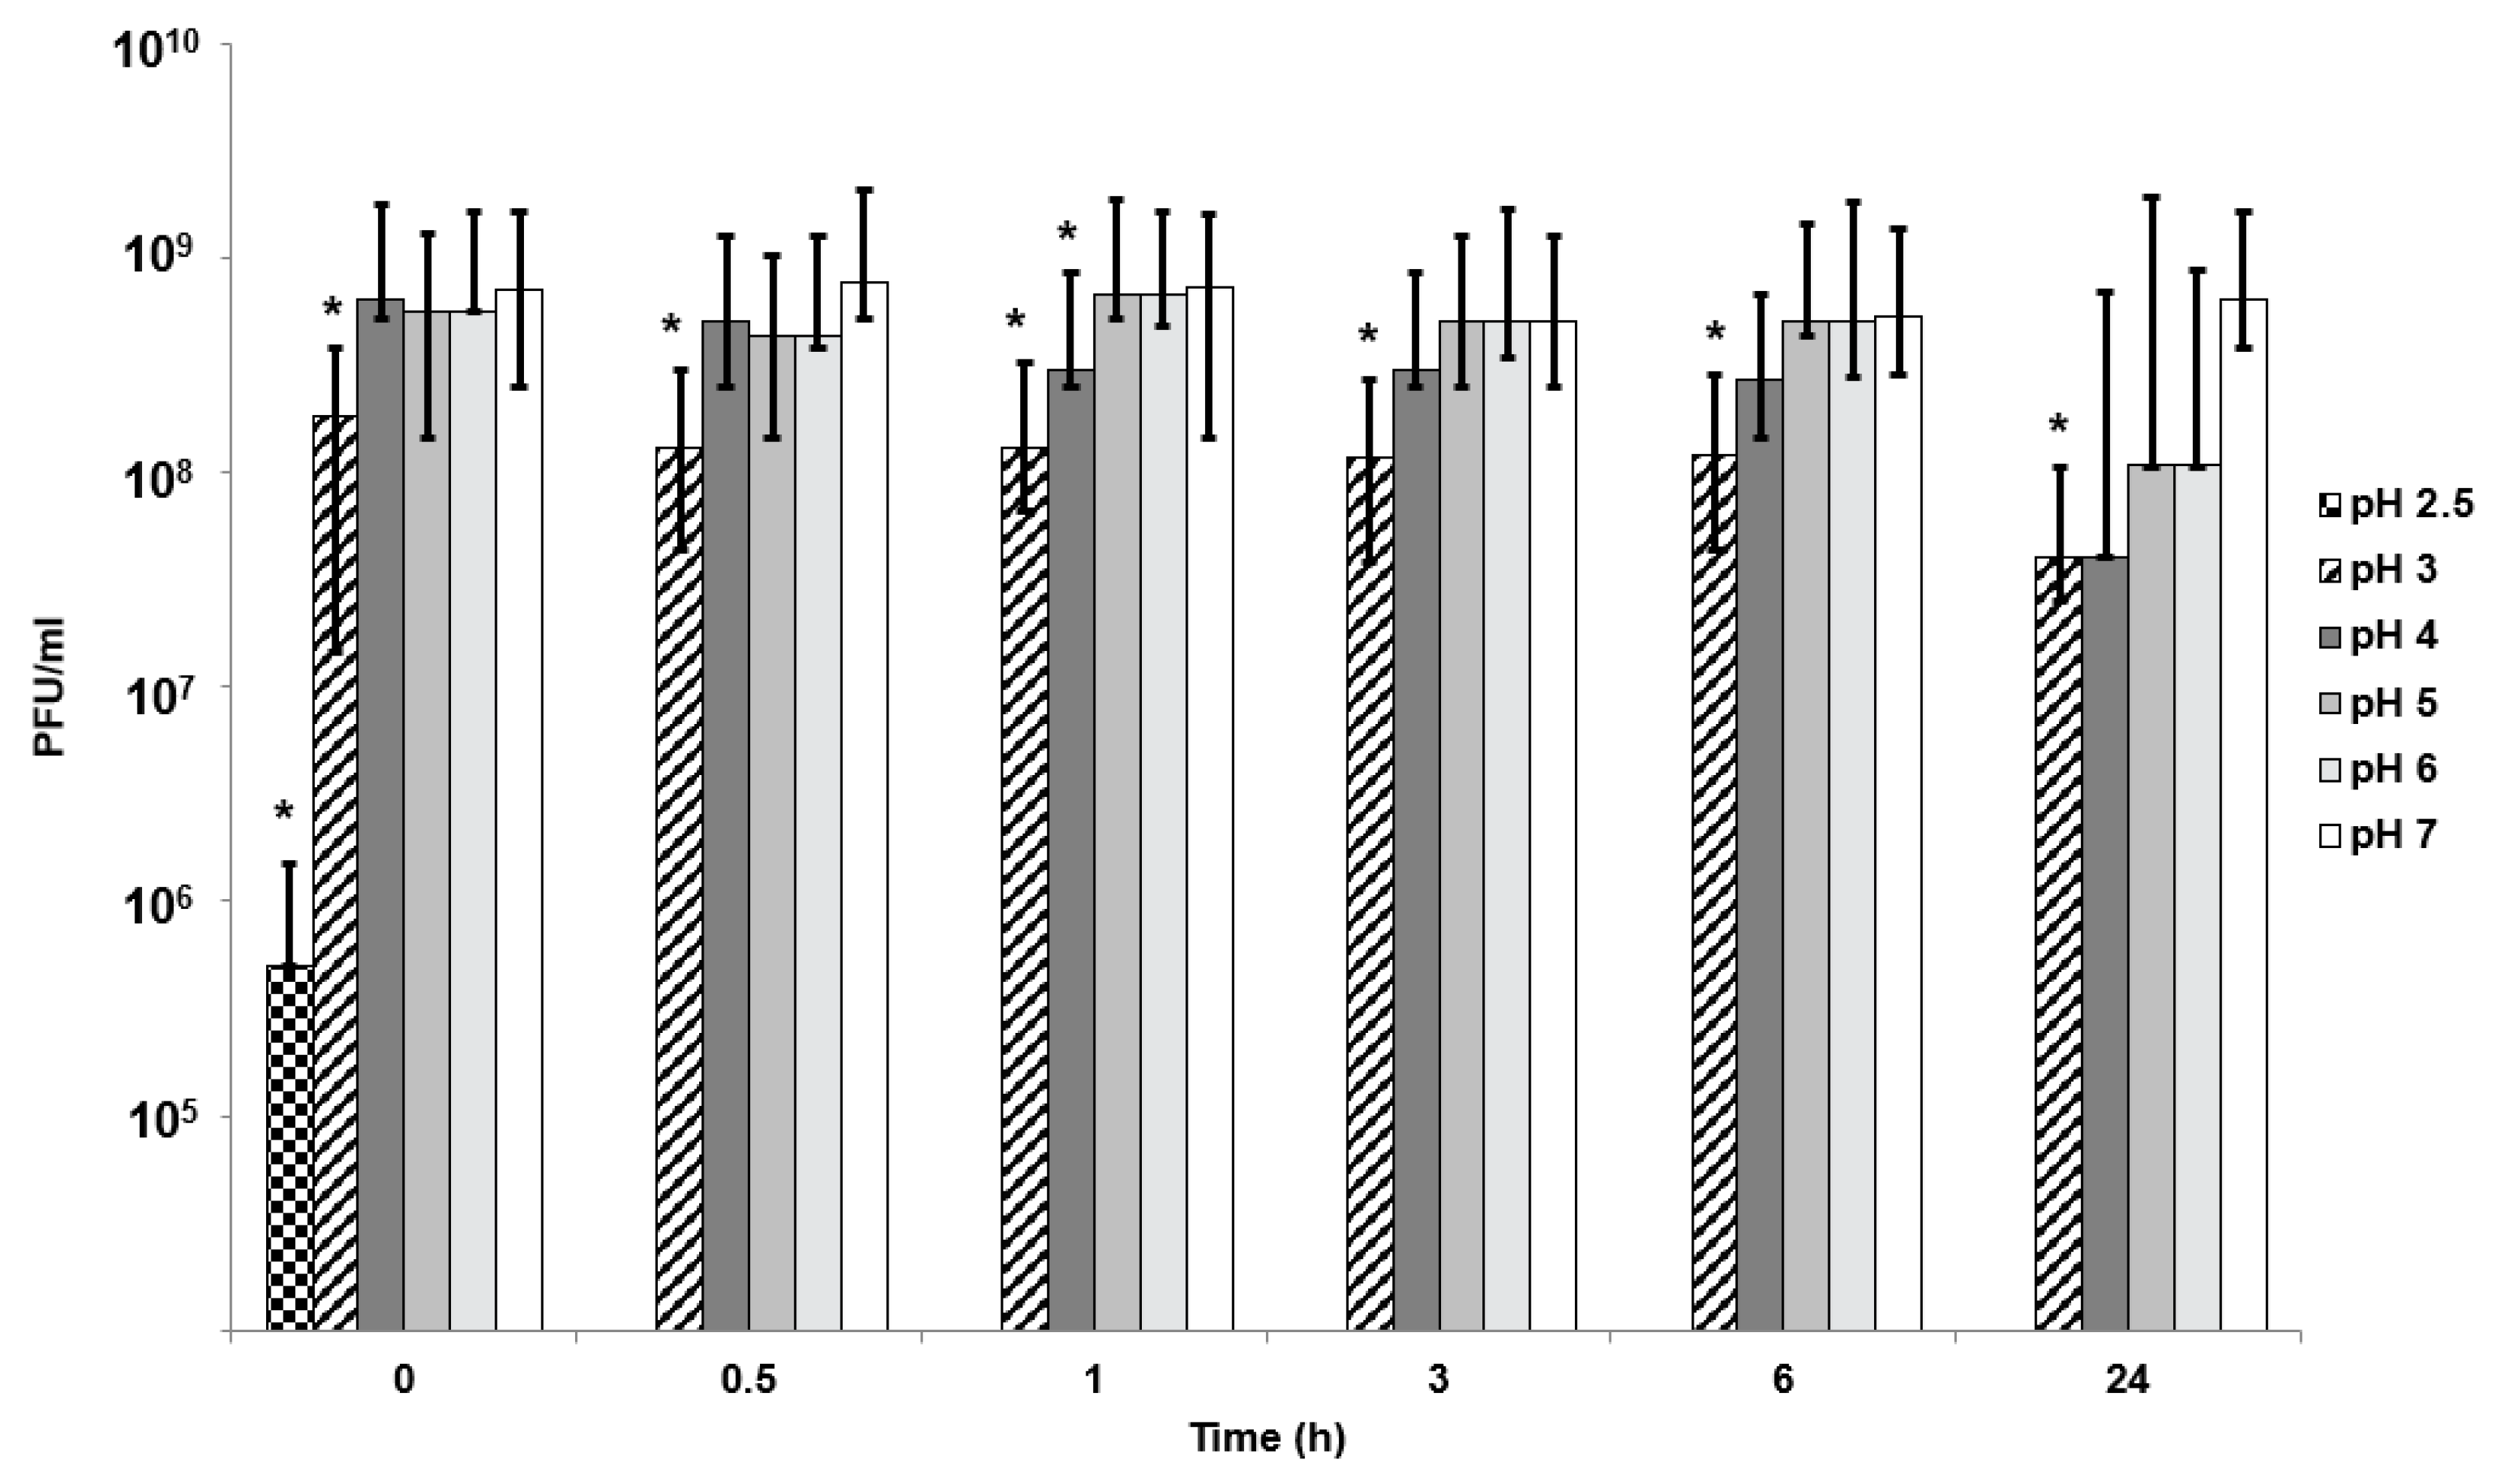
Simulated gastric fluid (SGF) was used to test phage sensitivity to different pH values. SGF formulation contained 0.2 M NaCl with pepsin at 3.2 mg/mL. Solution pH 2, 2.5, and 3 were adjusted using 0.1 M HCl. For simulated intestinal fluid (SIF) at pH 4 to 7, 0.2 M Sorensen’s buffer was used with the addition of 10 mg/mL pancreatin. Time points were taken at 0 min, 30 min, 1 h, 3 h, 5 h, and 24 h. For phages exposed to pH 2 and 2.5, exposure time points were also taken every minute for the first 10 min. A 10-µL sample was removed at each time point and serially diluted 10-fold in LB to 10−8 as described above. LB broth was used as a positive control.
2.4. Preparation of Bacteriophage-Containing Water-in-Oil (W/O) Emulsion
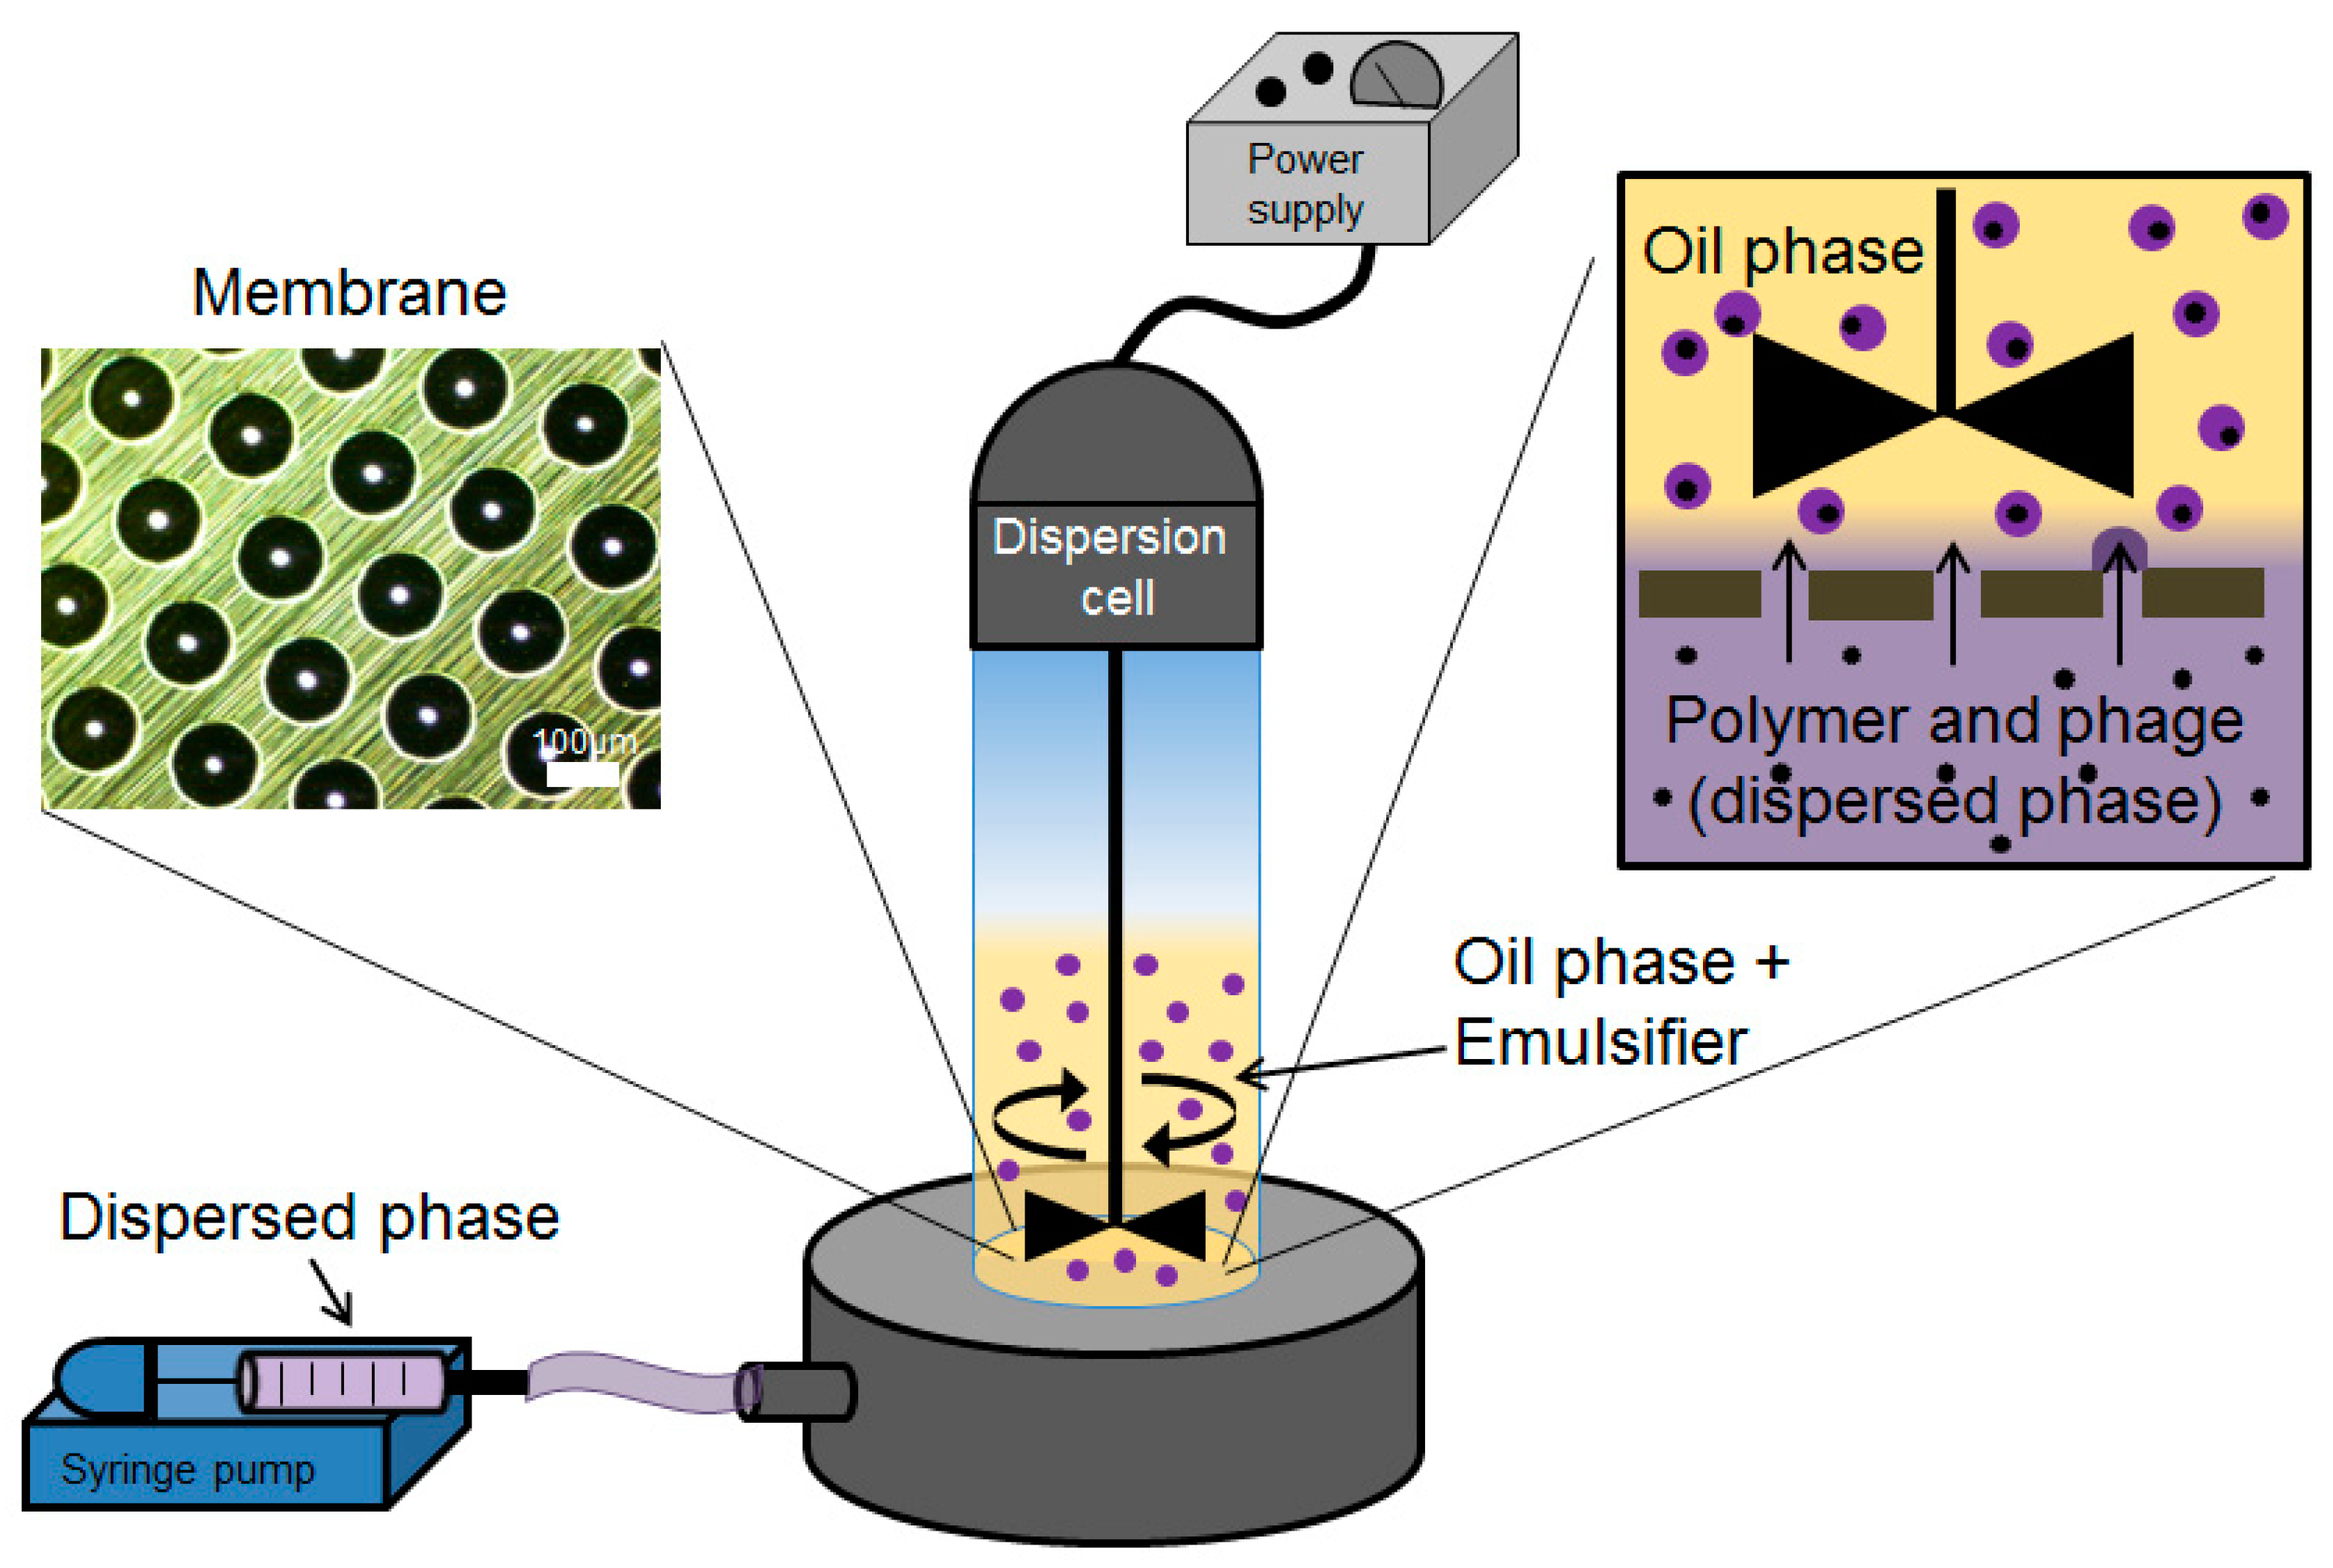
The dispersed phase (aqueous phase containing the bacteriophages mixed in a pH-responsive polymer formulation) was prepared by dissolving Eudragit® S100 powder (final working concentration of 10% (w/v) in ultrapure water. Typically, 4 mL of 4 M NaOH solution was added to 36 mL of deionised water and 4 g of S100 powder was added to this solution in 100-mL Duran bottles equipped with a magnetic stirrer bar to aid stirring. The solution was left stirring overnight at 60 °C or until the solution was clear, with complete dissolution of the S100 powder. The resulting solution pH was typically between pH 6.5–7. To this solution, 0.4 g of sodium alginate powder was dissolved by stirring overnight at 60 °C. Ten mL of phage stock with titre ~109 PFU/mL in an SM buffer (Trizma base (50 mM, Sigma Aldrich, Gillingham, UK), NaCl (100 mM, Fisher Scientific, Loughborough, UK), MgSO4·7H2O (8 mM, Fisher Scientific, Loughborough, UK), and 5 M HCl (~10 mL added per litre to adjust to pH 7.5)) was concentrated ten-fold using 100 kDa Amicon Ultrafiltration centrifuge tubes (Millipore, Watford, UK). One mL of concentrated phage stock was added to the cooled S100/alginate solution, resulting in a final phage titre of ~109 PFU/mL in the final formulation used to make the microparticles. The continuous (oil) phase for the water-in-oil (W/O) emulsion was prepared by dissolving 5% (w/w) of PGPR in a mixture of Miglyol 840 and castor oil (9:1 by volume).
Phage-containing S100/alginate droplets were prepared as a W/O emulsion using a batch membrane emulsification dispersion cell (Micropore Technologies Ltd., Redcar, UK). The dispersed phase was introduced into the bottom of the cylindrical glass emulsion chamber (working volume ~100 mL) using a syringe pump (Harvard Apparatus, Cambourne, UK). The base of the cell was equipped with a flat stainless-steel membrane having circular (3.3 cm diameter), 40-µm micropore arrays (
Figure 1). The flow rate of the aqueous phase was controlled at 25 mL/h, equating to a flux of 29 l/m
2 h. The glass cell carried the continuous oil phase above the membrane surface. Controlled shear was provided at the membrane surface using a paddle-blade stirrer operated by a 12-V DC motor with the rotation rate set at 250 rpm. Shear at the membrane surface is necessary for droplet detachment from the membrane pore resulting in a W/O emulsion. The dispersed phase was injected through uniformly spaced membrane pores, which were dispersed uniformly over the membrane surface. The stainless-steel membranes were purchased from Micropore Technologies Ltd. (Teesside, UK). They were pretreated with a hydrophobic silane coating by immersing the membrane for 10 min in 1H, 1H, 2H, 2H-Perfluorodecyltriethoxysilane (Sigma Aldrich, Gillingham, UK) prior to use. The stainless-steel membrane with pore size 40 µm had an effective surface area of 8.54 cm
2, with pores spaced at a distance of 200 µm. The continuous phase volume used was 50 mL for every 5 mL of dispersed phase introduced into the glass cell.
2.5. Preparation and Characterisation of S100/Alginate Microparticles
Fifty-five mL of the W/O emulsion was transferred into 60 mL of the acidified-oil phase in a 150-mL glass vessel. The vessel was equipped with an overhead-stirrer with a three-bladed marine impeller (to provide good axial mixing), which was operated at a low agitation rate ~150 rpm (to avoid droplet breakup and settling). The acidified oil consisted of a 9:1 mixture of miglyol to castor oil with 5% (v/v) PGPR and 0.05 M toluenesulfonic acid (TSA). The droplets were left to crosslink for 1 h and then allowed to settle (overhead stirrer was turned off). The supernatant was discarded, and any residual miglyol was washed out using 99.9% analytical grade hexane (Sigma Aldrich, Gillingham, UK). The TSA-crosslinked microparticles were resuspended in 0.1 M calcium chloride (CaCl2) with 2% (v/v) Tween 20, and the solution was pre-acidified at pH 3 (using 0.1 M HCl). Microparticles were left in suspension to crosslink the alginate for 2 h. The crosslinked particles were subsequently allowed to settle, the CaCl2 solution was removed, and the microparticles were washed with 2% (v/v) Tween 20 acidified at pH 3. The gelled microparticles were stored at 4 °C in sealed, 15-mL falcon tubes.
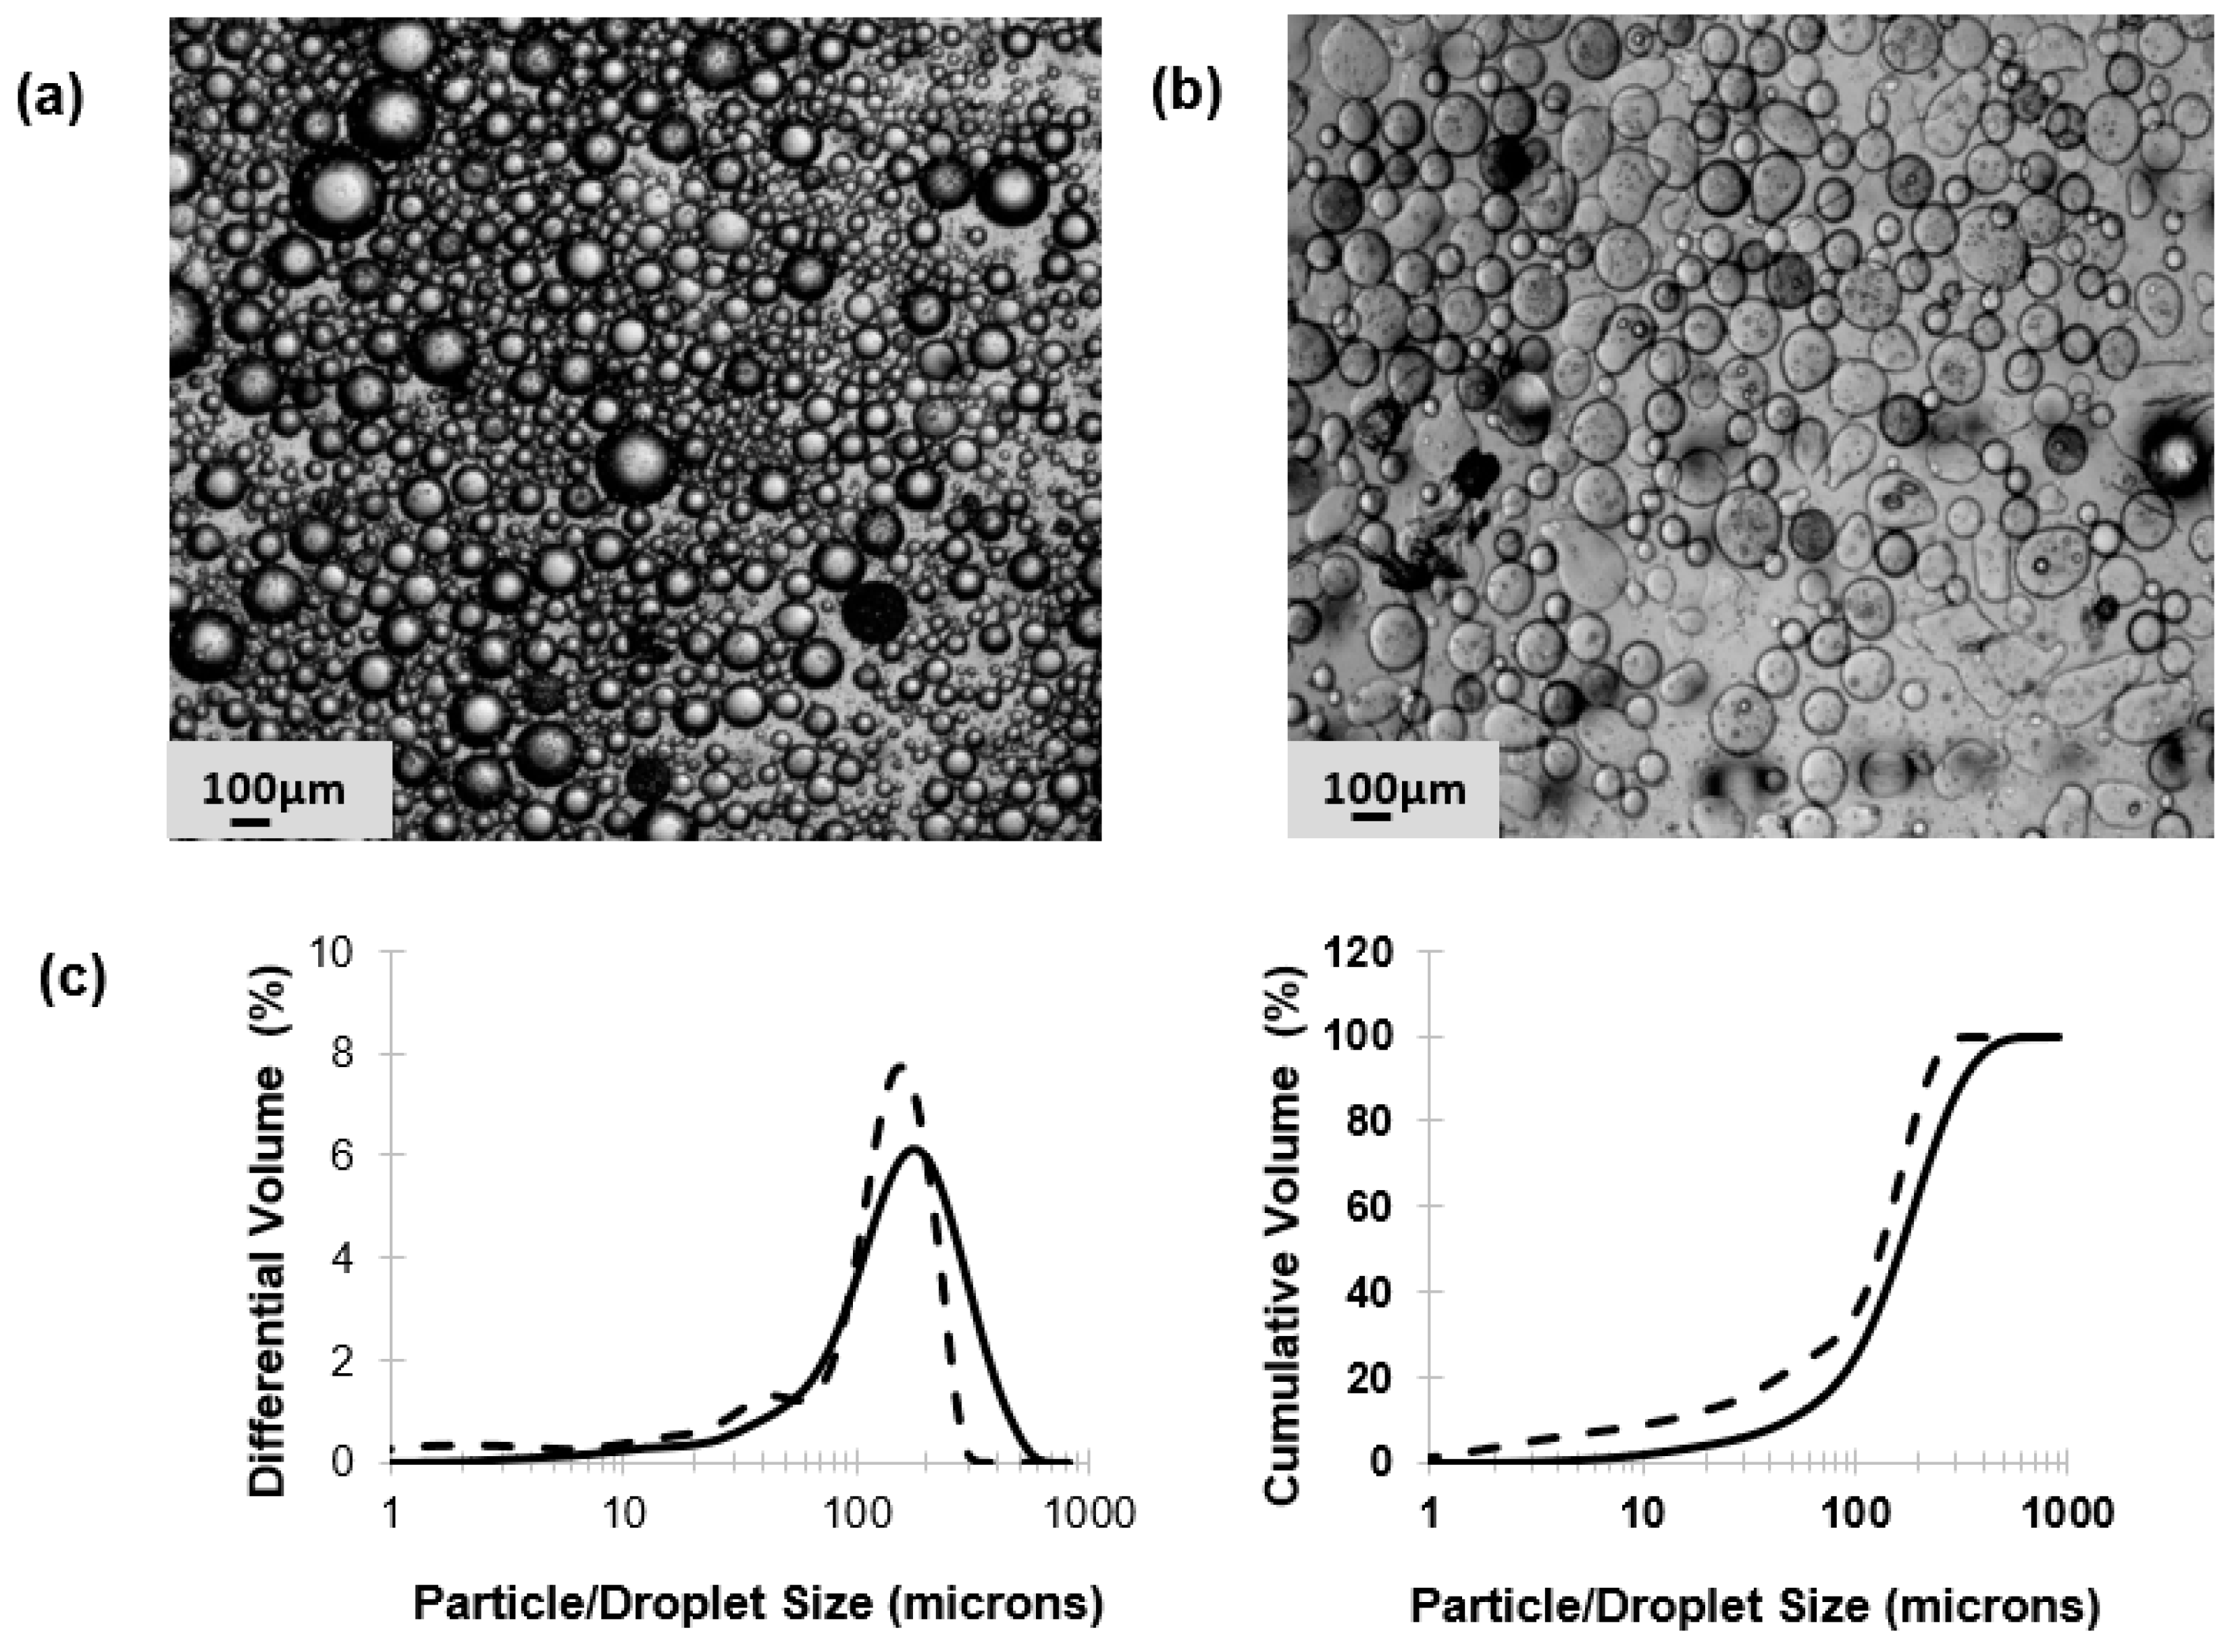
Photographs of the droplets and particles were taken with an optical microscope (Nikon Eclipse E200, Kingston-Upon-Thames, UK) using a ×4 magnification objective lens. The particle sizes for the W/O emulsion and the gelled microparticles were measured using a Coulter LS series 130 (Beckman Coulter Inc., High Wycombe, USA) instrument employing a Fraunhofer optical model for data regression.
2.6. Sample Preparation for the Ion Microscopy
Critical point drying (CPD) and freeze-drying methods were used to prepare the hydrogel samples for ion microscopy. In the CPD-method, the silicon substrate (Tedpella, Redding, CA, USA) was incubated for 5 min in poly-l-lysine (150–300 kMW, Sigma-Aldrich, Hamburg, Germany), washed three times with ion-exchanged water, and allowed to dry under ambient conditions (room temperature and atmospheric pressure). Using a spatula, hydrogel microparticles were added to 500 µl acetate buffer (50 mM, pH 5, 20 mM CaCl2) and vortexed. The solution was pipetted over the lysine coated substrate, and the microparticles were allowed to adhere for about 1 h at 4 °C and, after that, were fixed overnight with 2.5% glutaraldehyde in 0.1 M acetate buffer (pH 5) at 4 °C. After fixing, the sample was washed two times with 0.1 M acetate buffer (pH 5), stained with 1% OsO4 for 30 min, and then washed three times with the buffer. Samples were dehydrated in ethanol (EtOH) using a series of steps with increasing EtOH concentration: 50, 70, 90, 95, and 2 × 99.5%, 15 min each. Dehydrated samples were dried to ambient conditions with CPD (Leica CPD 300) using 16 exchange cycles. The dried sample was attached to the metal stub with carbon tape prior to microscopy. In the freeze-drying method, gelled microparticles were frozen on filter paper (0.2-µm pore size, Millipore Ltd., Watford, UK) at −20 °C overnight. The particles were freeze dried (VirTis Wizard 2.0, SP Scientific, New York, NY, USA) for 24 h at 50 Pa pressure and −20 °C. Dried powder was applied directly on the carbon tape, which was attached to the sample stub.
2.7. Ion Microscopy
To analyse the morphology of the hydrogel particles, both freeze-dried and critical-point-dried hydrogels were examined with ion microscopy. Zeiss Orion NanoFab (University of Jyväskylä) with He+ beam and acceleration voltage 35 kV, 0.20 pA current, 32 line averages, and 1 µs dwell time was used for He+ imaging. For cutting, an about 20-pA Ne+ beam with 10 kV acceleration voltage was used. Milling was carried out using a 45 degrees tilted angle by setting the reduced raster scan rectangle over the area to be removed and scanning until the material disappeared. After cutting, the sample stage was rotated 180° and the cross section was imaged with a He+ beam. Flood gun charge compensation was used during both milling and imaging.
2.8. Encapsulated Phage Release from Microparticles in SIF Following Exposure to SGF
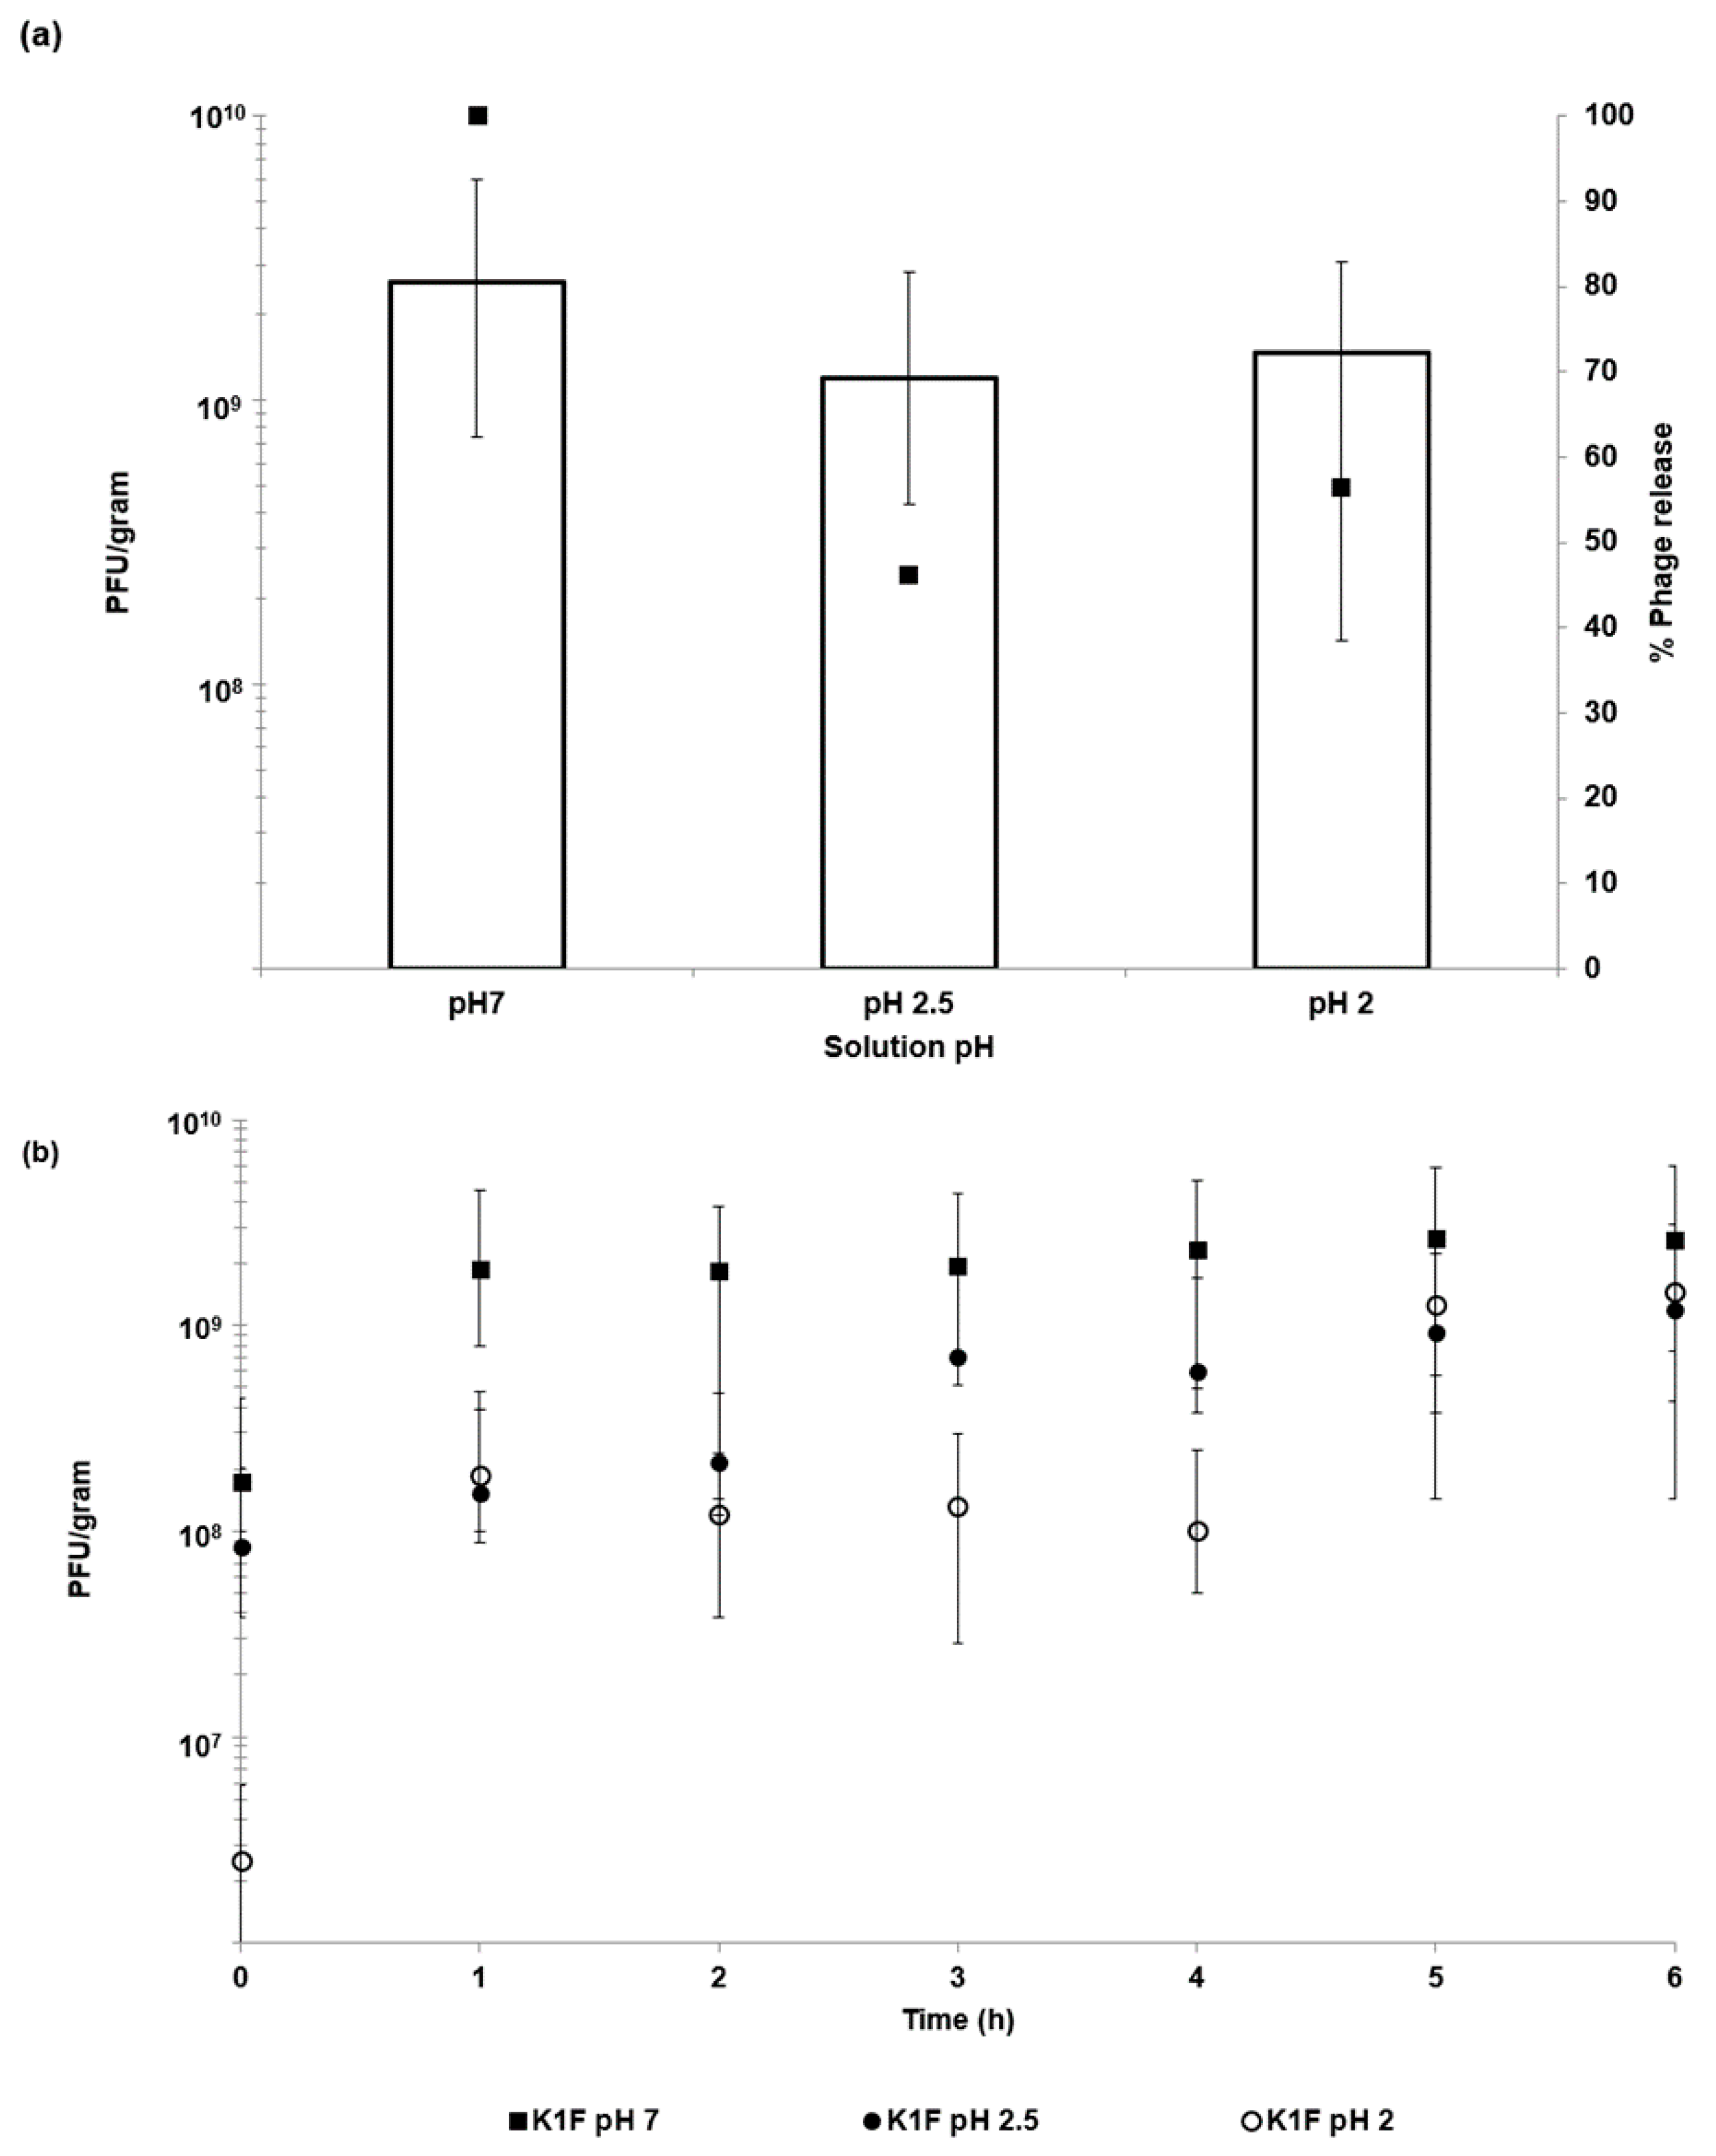
Typically, 1 g of hydrogel microparticles was added to prewarmed 10 mL SIF and shaken in a temperature-controlled incubator shaker (Certomat, Sartorius, UK) at 120 rpm and 37 °C. For SGF exposure, the microparticles were first added to 10 mL SGF and left shaking for an exposure period of 2 h at 37 °C. Particles were centrifuged at 2000× g for 10 min and resuspended in 10 mL SIF (pH adjusted to 5, 6, or 7) until dissolution of the particles was complete. Spot assays were used for enumeration of the released phage by removing 10 µL of the sample at hourly intervals, by serially diluting in LB broth, and by spotting on a host bacterial lawn.
2.9. Storage Stability of Bacteriophages Encapsulated in the Microparticles
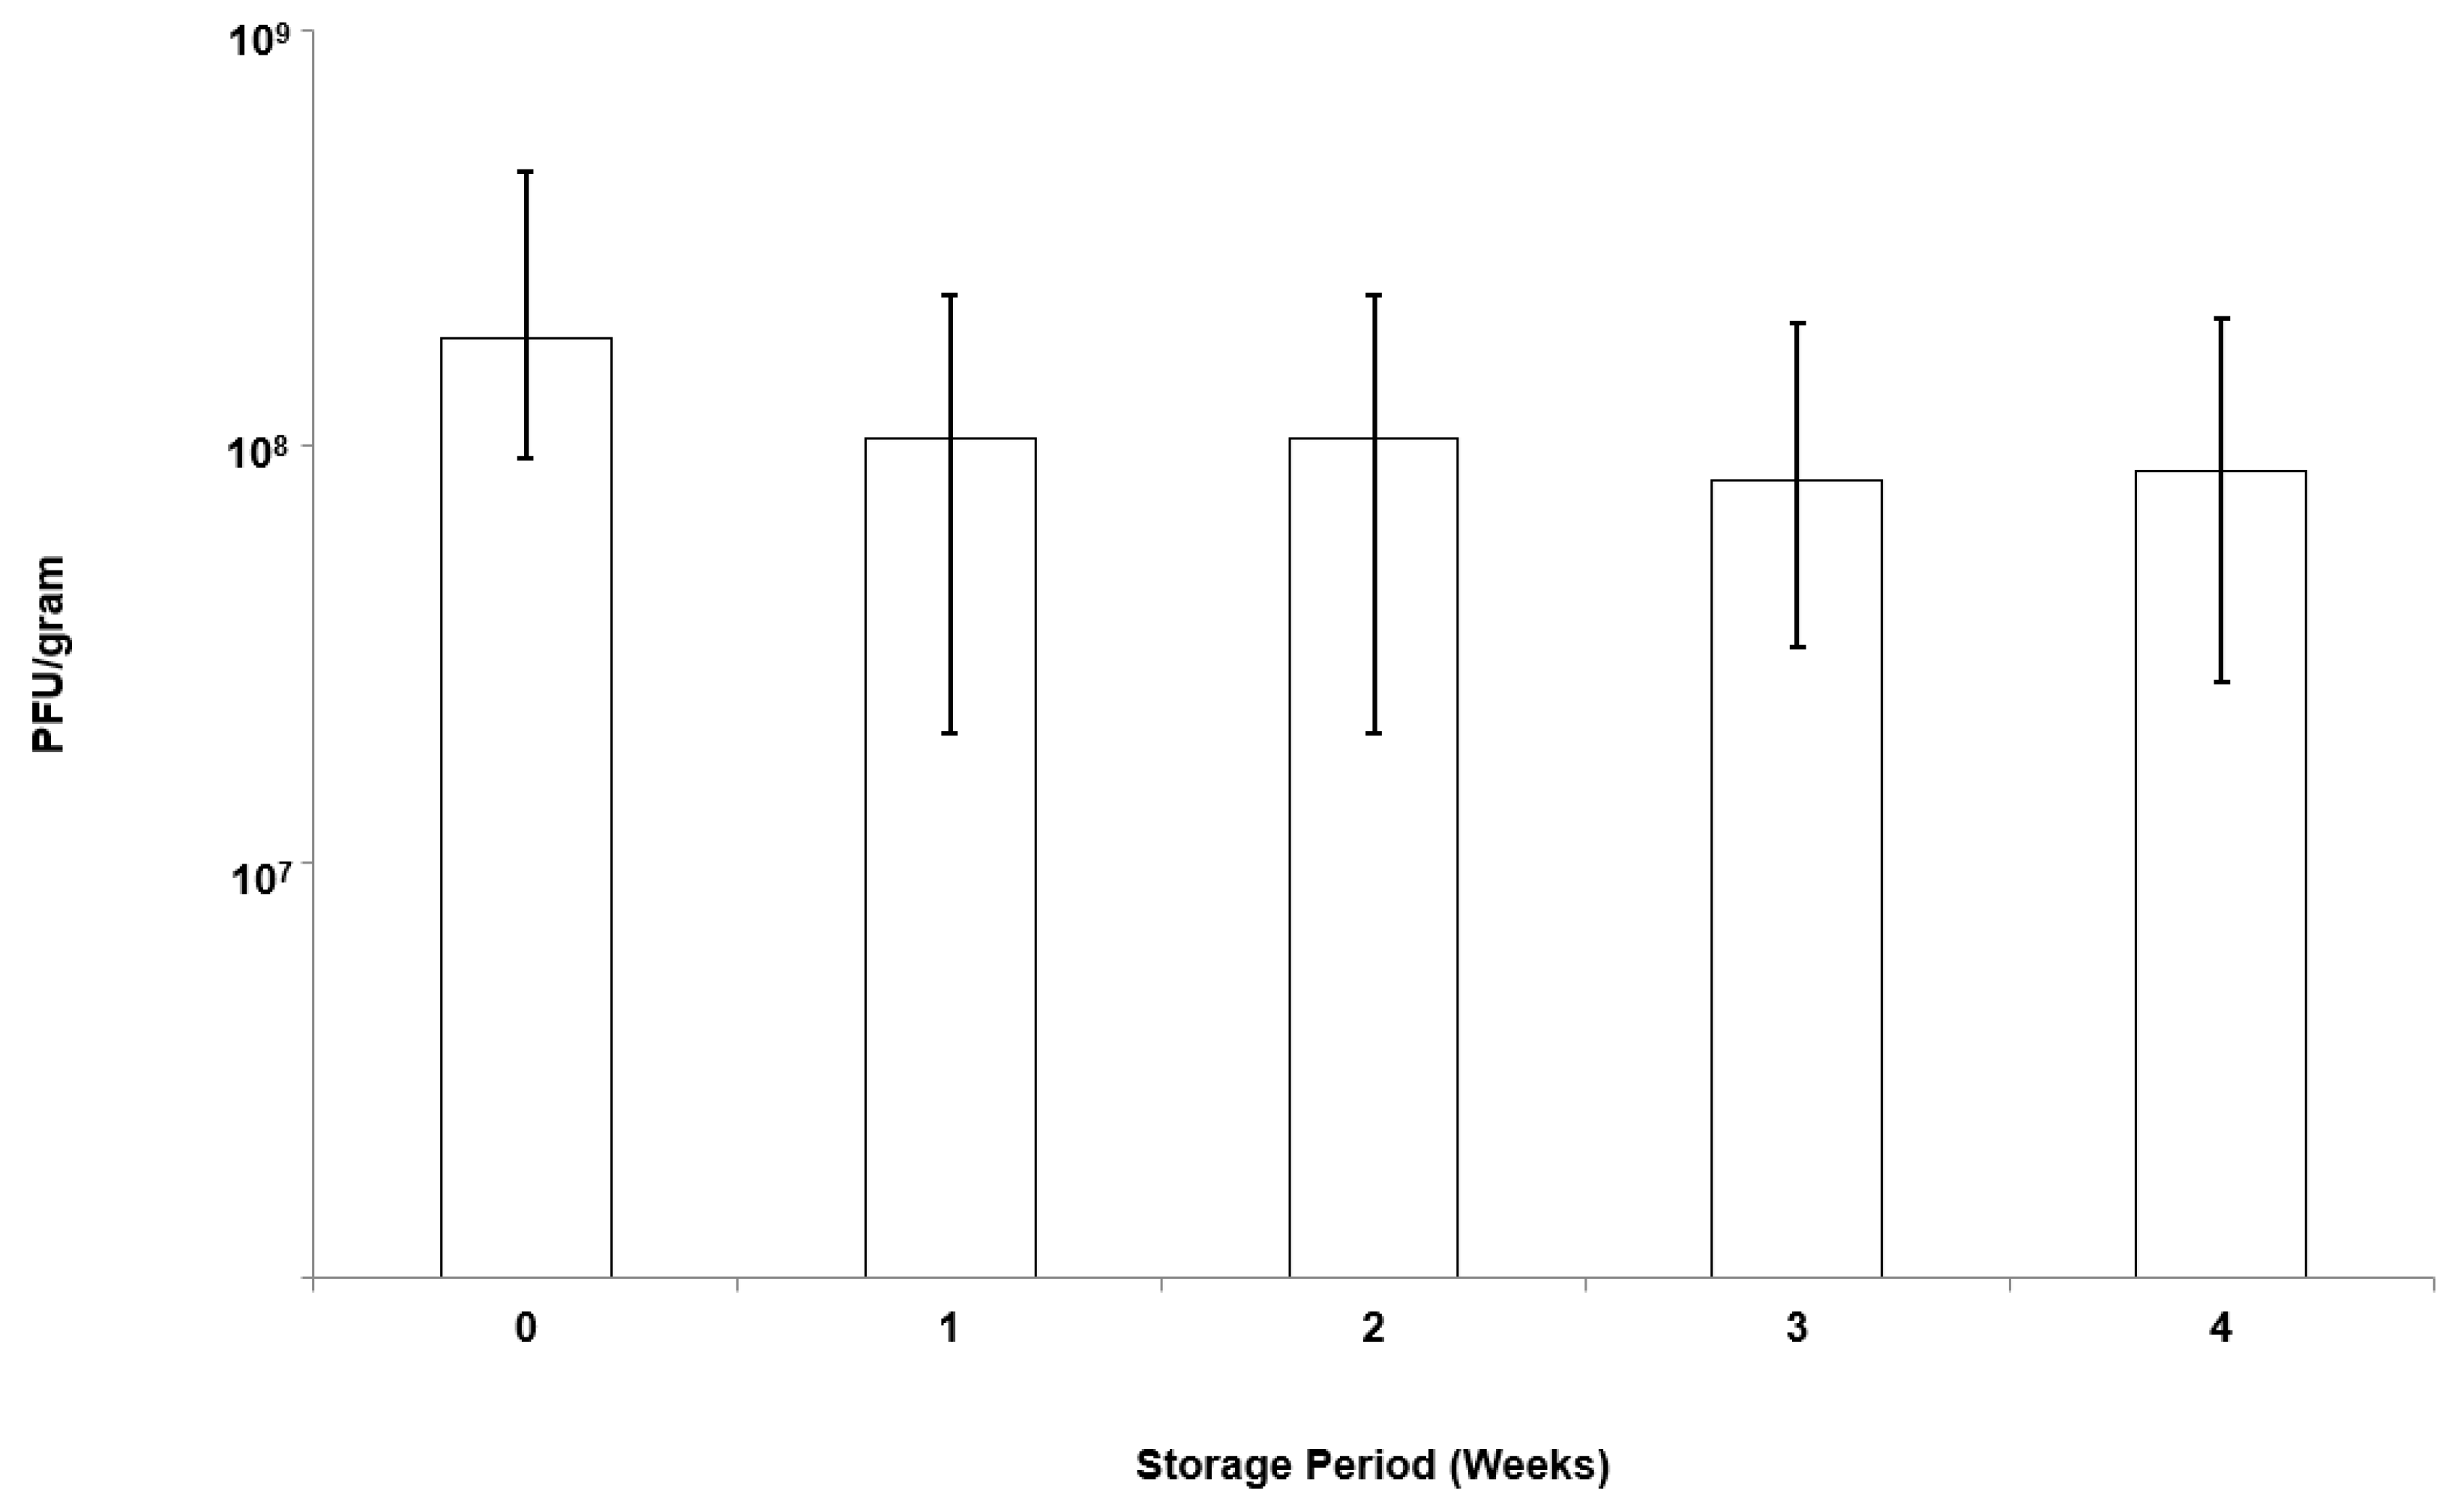
Microparticles were stored in screw-top bottles under controlled refrigerated conditions (4 °C) for a period of 4 weeks. At specific time intervals, 0.1 g of microparticles was weighed and dissolved in SIF (as per the protocol outlined above). Phage release was enumerated using plaque assays.
2.10. In Vitro Assay to Measure Phage Release and E. coli Killing Dynamics
The effect of encapsulated phage (EK1F) and free phages in killing bacterial was investigated. Bacteria were grown from a single colony until log phase was reached at 0.2 (O.D. 550) (approximately 10
8 CFU/mL).
E. coli strain EV36 bacteria were grown either in LB or cell culture media (Leibovitz), as described previously [
28]. Two mL of bacteria (at 0.2 OD) were added to 24-well tissue-culture plates. Twenty µL of free phage (non-encapsulated) was added at different concentrations (resulting in working concentrations of 10
2, 10
4, 10
6, and 10
8 PFU/mL). Twenty µL of encapsulated phages (EK1F) were also added to separate wells containing 2 mL of bacterial culture. Encapsulated phages were tested either without acid exposure or after exposure to SGF (pH 2) for 2 h. Negative controls contained 20 µL of EK1F in LB media or cell culture media without bacteria. Positive controls contained bacteria only. After phage/EK1F addition, the samples were withdrawn at hourly intervals up to 5 h post phage/EK1F addition. At each time point, 1 mL of sample was removed to record the O.D. One mL of the sample was centrifuged at 2000×
g to remove infected cells and to measure phage titre using plaque assay.
2.11. E. coli Killing Using Encapsulated Phages in an Epithelial Cell Culture Assay
The human urinary bladder epithelial cell line (ATCC
® HTB-4
™) was acquired from LGC Standards (UK). T24 cells were cultured in uncoated T75 flasks containing McCoy’s 5A (Modified) medium (Gibco, MA, USA) supplemented with 10%
v/v Foetal Bovine Serum (FBS) (Labtech International, UK) and 1%
v/v Penicillin-Streptomycin and were maintained in 5% CO
2 under a humidified atmosphere, as described previously [
28]. For the live microscopy experiments, the T24 cells were seeded onto uncoated 35-mm glass-bottom microscope dishes (ThermoFisher Scientific, UK) at a density of approximately 4 × 10
4 cells/cm
2 in McCoy’s 5A (Modified) medium (supplemented with 10%
v/v FBS only) and were allowed to settle for 24 h. The culture media were aspirated and replaced with Leibovitz medium (Lonza, Switzerland) that sustains cell viability in the absence of CO
2 equilibrium. While maintaining the confluent cultures at 37 °C, the cultures were incubated with
E. coli strain EV36-RFP at OD 600 nm of approximately 0.4 to 0.6 (~10
8 CFU/mL), which was added to 1 mL of Leibovitz media for 2 h. Controls included bacteria left to grow with the addition of LB (20 µL) without phages. Free phages at different titres (10
2, 10
4, 10
6, and 10
8 PFU/mL) (volume 20 µL) were added to wells as positive controls. Microparticles with phage K1F (EK1F) were exposed to pH 2 for 2 h before they (20 µL, ~10 mg) were added to infected epithelial cells. In the last 20 min of infection, NucBlue
® Live (ThermoFisher Scientific, UK) was added as a stain for the nucleus. The samples were then visualized under an Andor/Nikon Spinning Disk Confocal Laser Microscope. Imaging was taken at hourly intervals (each sample was staggered accordingly). During imaging, the temperature was maintained at 37 °C.
For the experiments with fixed cells on the confocal microscope, T24 cells were seeded onto uncoated 22 × 22 mm coverslips in 6-well plates at a density of 4 × 10
4 cells/cm
2 and were allowed to settle for 24 h. The cultures were fixed in 4% paraformaldehyde (PFA) (ThermoFisher Scientific, UK), permeabilised in ice-cold PEM (PIPES, EGTA, Magnesium) buffer with 0.05% Saponin, and quenched with 50 mM NH
4Cl in PBS (Phosphate-Buffered Saline). A wash step with PBS was performed between each step, as described previously [
28]. In order to visualize the periphery of the cells, an actin filament stain, Phalloidin CF680R Conjugate (Biotium, CA, USA), was used at a concentration of 5 ug/mL. Finally, the stained cells were mounted on microscope slides using Flouroshield Mounting Medium (Abcam, UK) containing DAPI nuclear stain. All fixed cells were imaged using the Zeiss LSM 880 confocal microscope with Airyscan.
2.12. Statistical Analysis of Results
Minitab version 18 (Minitab UK Ltd, Coventry, UK) was used for carrying out statistical analysis of the data. Sample means were compared using two-sample t-tests (n = 3) with reporting of p < 0.05 as statistically significant. For multiple tests, the alpha value was adjusted using Bonferroni correction.
4. Discussion
The motivation behind the microencapsulation of phages in solid oral dosage forms stems from the need to protect bacteriophages from gastric acidity and to ensure delivery of high phage doses to specific intestinal compartments at the site of infection, such as the ileum or colon. Targeted delivery of viable phages avoids issues such as a reduction in phage titres due to dilution effects
en route to the infection site in the lower gastrointestinal tract. Small microparticles (size less than 0.5 mm) are particularly useful for phage delivery via oral gavage for routine preclinical in vivo testing in small animals such as mice and rats. Previous published studies suggest that particles around 100 µm are well suited in terms of protecting bacteriophages from gastric acidity typically encountered in the stomach environment [
23,
31]. We have previously demonstrated the potential of microfluidic fabrication processes for phage microencapsulation in uniform small pH-responsive microparticles (mean size ~100 µm) containing an encapsulated
Salmonella Myoviridae Felix O1 phage [
31]. Microfluidic single droplet generation units suffer from low throughputs with typical production rates of less than 1 mL/h. Here, we have demonstrated the scalability afforded by the process of membrane emulsification whereby phages may be encapsulated under low shear rate conditions resulting in near 100% phage encapsulation efficiency and preparation of large industrial quantities of uniform small microcapsules (
Figure 2). The process can be scaled-up based on the membrane area, e.g., a typical tubular membrane module (50-cm tube length and 1-cm diameter) would produce 0.5 L/h of microparticles operating under the conditions used in the present study. Tube bundles in a shell-and-tube arrangement would allow considerably higher production rates. The membrane emulsification process itself is generic in terms of production of W/O emulsions containing different enteric phages. The process is highly flexible such that different formulations can be used and microparticles with phage-release properties can be tailored for specific applications using different stimuli-responsive polymers. Phages are known to be sensitive to chemical and physical stresses; these include pH [
32], temperature [
33], exposure to organic solvents [
34,
35], shear [
33,
36], and ionic strength [
37]. A number of studies have previously shown that particle size is an important factor affecting phage protection from SGF for acid permeable beads [
31,
38]. We have shown that Eudragit ES100 co-formulated with medium viscosity alginate in 100-µm microcapsules protected the phages exposed to SGF at pH 2 for an exposure period of 2 h (
Figure 5). We have also shown that, when using an in vitro bacterial growth assay, phage-mediated rapid killing of actively growing bacteria requires high titres of viable phages to arrest bacterial growth in a timely fashion (
Figure 7). Furthermore, we have demonstrated the suitability of using membrane emulsification to prepare
E. coli-specific K1F phages encapsulated in pH-responsive microcapsules suitable for gastrointestinal applications (
Figure 5). The internal microstructure of the hydrogel beads was shown to consist of a matrix-like polymer network. In all likelihood, the polymer microstructure is swollen in a hydrated state yielding solid core microparticles, which afforded the phages protection from the external gastric acid environment (
Figure 3). It was not possible to image encapsulated bacteriophage particles within the internal structure, suggesting that most probably these were buried within the hydrogel matrix. Preparation methods clearly affected visualization of the inner structure of the microparticles. CPD-dried samples most probably represent the wet hydrogel microstructure more accurately because CPD-drying avoids all phase boundaries during the drying process. Previously, it has been shown that freeze-drying modifies the gel matrix structure towards bigger pores [
39].
In vitro phage stability experiments where phages (encapsulated and free phages) are exposed to different acidic pH encountered in vivo may be a useful predictor of in vivo phage survival and a prerequisite during formulation development prior to testing in animal models. Unencapsulated bacteriophages were highly sensitive to acidic pH exposure with complete loss of viable phages within 10 min at pH 2.5 (
Figure 4). The loss of unencapsulated phage activity upon exposure to an acidic environment highlights the need for encapsulation in order to deliver controlled high doses of viable phages to the infected gut using oral dosage forms. Phage encapsulation in the ES100/alginate microparticles protected them from acid damage at pH 2 (
Figure 5). The combination of small particle size (
Figure 2) and pH-responsive character of the ES100/alginate microcapsules resulted in release of encapsulated K1F phages within the first hour upon exposure to pH 7 (
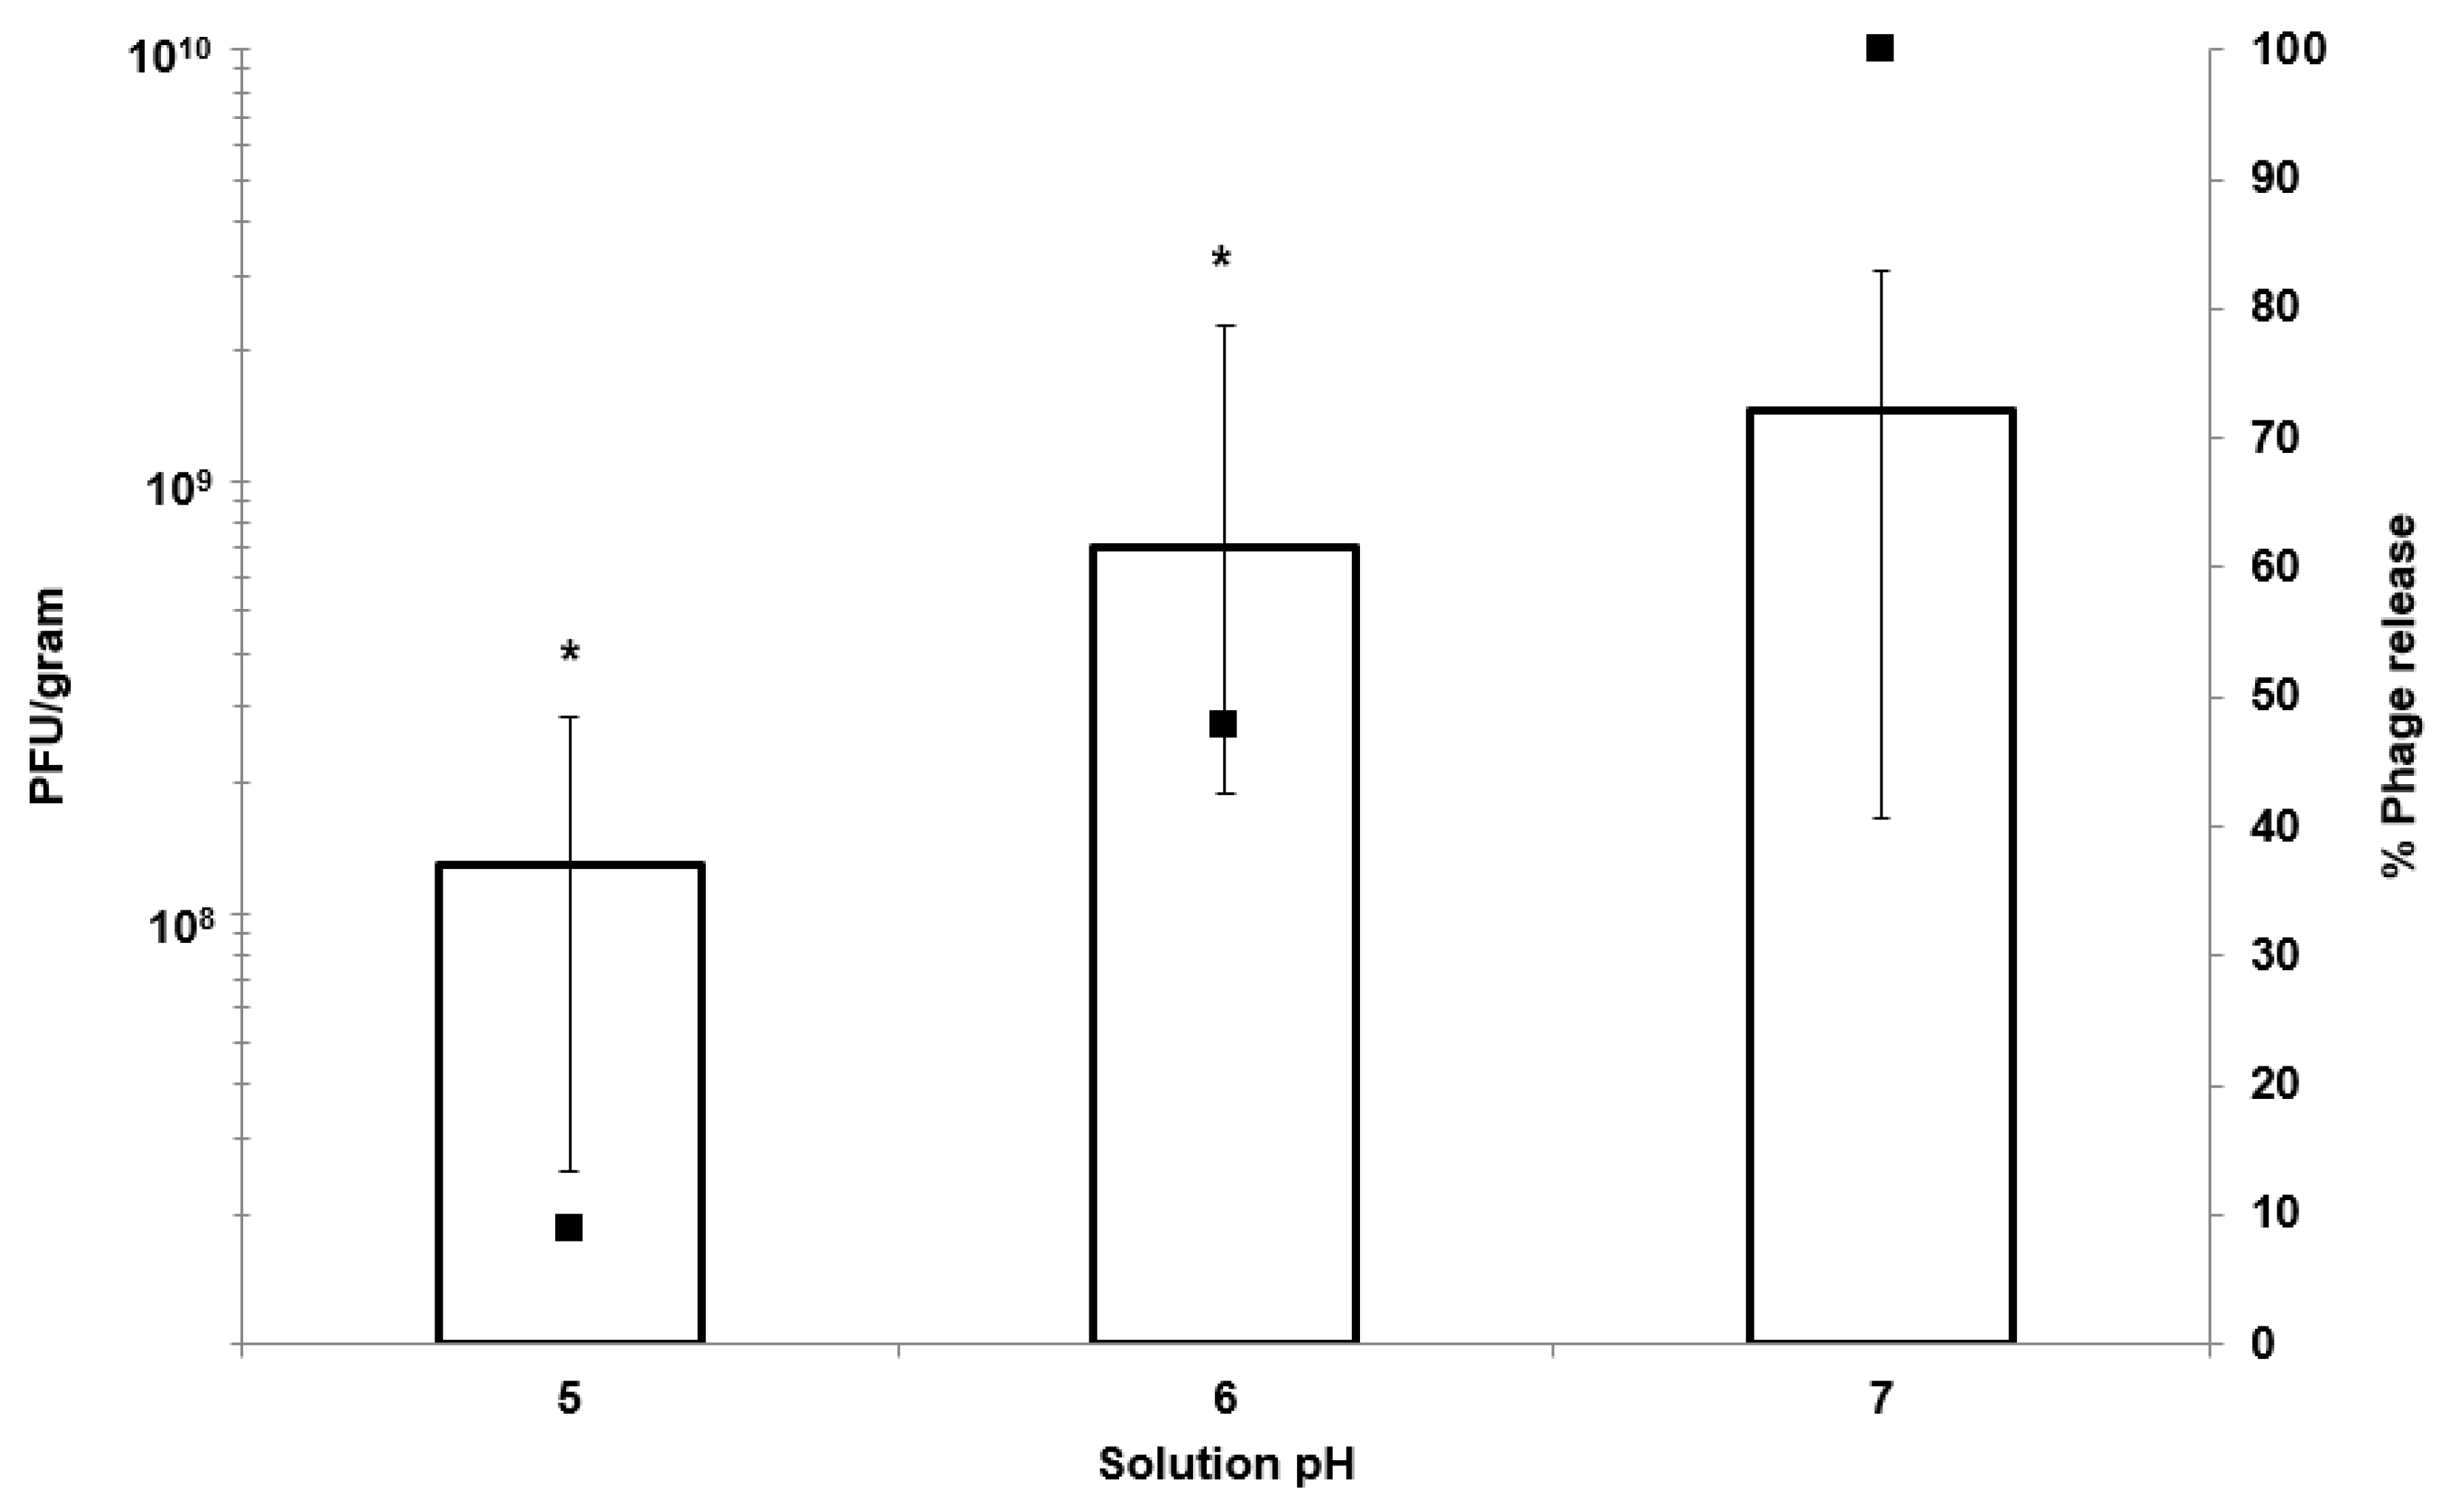
Figure 5b). Ten percent of the encapsulated phage dose was released at pH 5, whereas 50% of it was released at pH 6 after 2 h of exposure to SIF. Complete phage release and complete dissolution of microparticles occurred within 1 h upon exposure to pH 7 (
Figure 5b). It took 1 h longer for SGF-exposed EK1F phages to amplify to levels reached in bacterial cultures compared with a free phage dose of 10
6 PFU/mL (
Figure 7b). This delay may be attributed to slower release kinetics of SGF-exposed EK1F phages (
Figure 5b). The encapsulated phages were not released immediately upon addition of the microparticles to the bacterial cultures; therefore, it took extra time for the phage titre to reach levels similar to an equivalent free phage dose. Previous published research on phage encapsulation employing large microparticles (~1 mm) reported slower sustained-release kinetics for phages encapsulated in alginate microcapsules [
19,
22]. Colom et al. [
23] reported faster release from small alginate microparticles containing CaCO
3 as antacid (mean size ~100 µm). However, in that particular study, exposure to simulated gastric fluid (pH 2.8 for 60 min) resulted in between 2 and 3 log reduction in
Salmonella phage titre, suggesting that even with the addition of CaCO
3, phages were highly susceptible to SGF [
23]. The ES100/alginate formulation used in the present study for similarly sized small microparticles showed considerably better acid protection and released phages in response to a pH-trigger.
A number of in vivo animal studies have demonstrated dose-dependent phage therapy outcomes for the treatment of bacterial infections, with high doses resulting in better clinical results [
40,
41,
42,
43]. Controlling the phage dose delivered at the site of infection and controlling the timing of the delivery are important considerations [
14]. Careful formulation and encapsulation of phages in uniform-sized microcapsules may facilitate better control over the phage release dynamics. This would allow control over the accurate delivery of high concentrations of phages and effective killing of actively growing
E. coli strain EV36 cells as shown using an in vitro assay (
Figure 7). Even after exposure of encapsulated K1F phages in the microparticles to simulated gastric fluid at pH 2 for 2 h, the released phage dose was unchanged: ~10
9 PFU g
−1 of microparticles (
Figure 5). In humans the mean residence time for gastric emptying is typically less than 3 h for both pre-fed and fasted states [
44]. In the absence of phage encapsulation, a loss in phage titre due to stomach acidity exposure would result in a low dose of phages reaching the site of infection. This may potentially result in a lack of in situ phage amplification in the presence of low concentrations of bacteria during infection [
14].
Phage delivery systems and their formulation will impact phage bioavailability at the site of infection. Constituents of the formulation should not be toxic to the host (human) cells. Bacterial killing by K1F phages released from the microcapsules in the presence of epithelial cells suggested that the phages retained potency at levels similar to free phages at the same dose levels (
Figure 8). Confocal and live microscopy images provided visual confirmation that phages released from microcapsules arrested bacterial damage to the epithelial cell actin cytoskeleton and significantly decreased the number of bacteria in the human cell environment compared with controls containing bacteria but not treated with phages (
Figure 8). Furthermore, the release of encapsulated phages was not hindered by the microparticles interacting with epithelial cells. These in vitro results are encouraging in the development of phage oral dosage formulations as a precursor to future evaluation in animal systems such as mice or rats.

 ,
, 


