Optimization of Aceclofenac Proniosomes by Using Different Carriers, Part 1: Development and Characterization

 , ,
, ,
Abstract
:1. Introduction
2. Materials and Methods
2.1. Materials
2.2. Methods
2.2.1. Preparation of Proniosomes
2.2.2. Characterization of Proniosomes
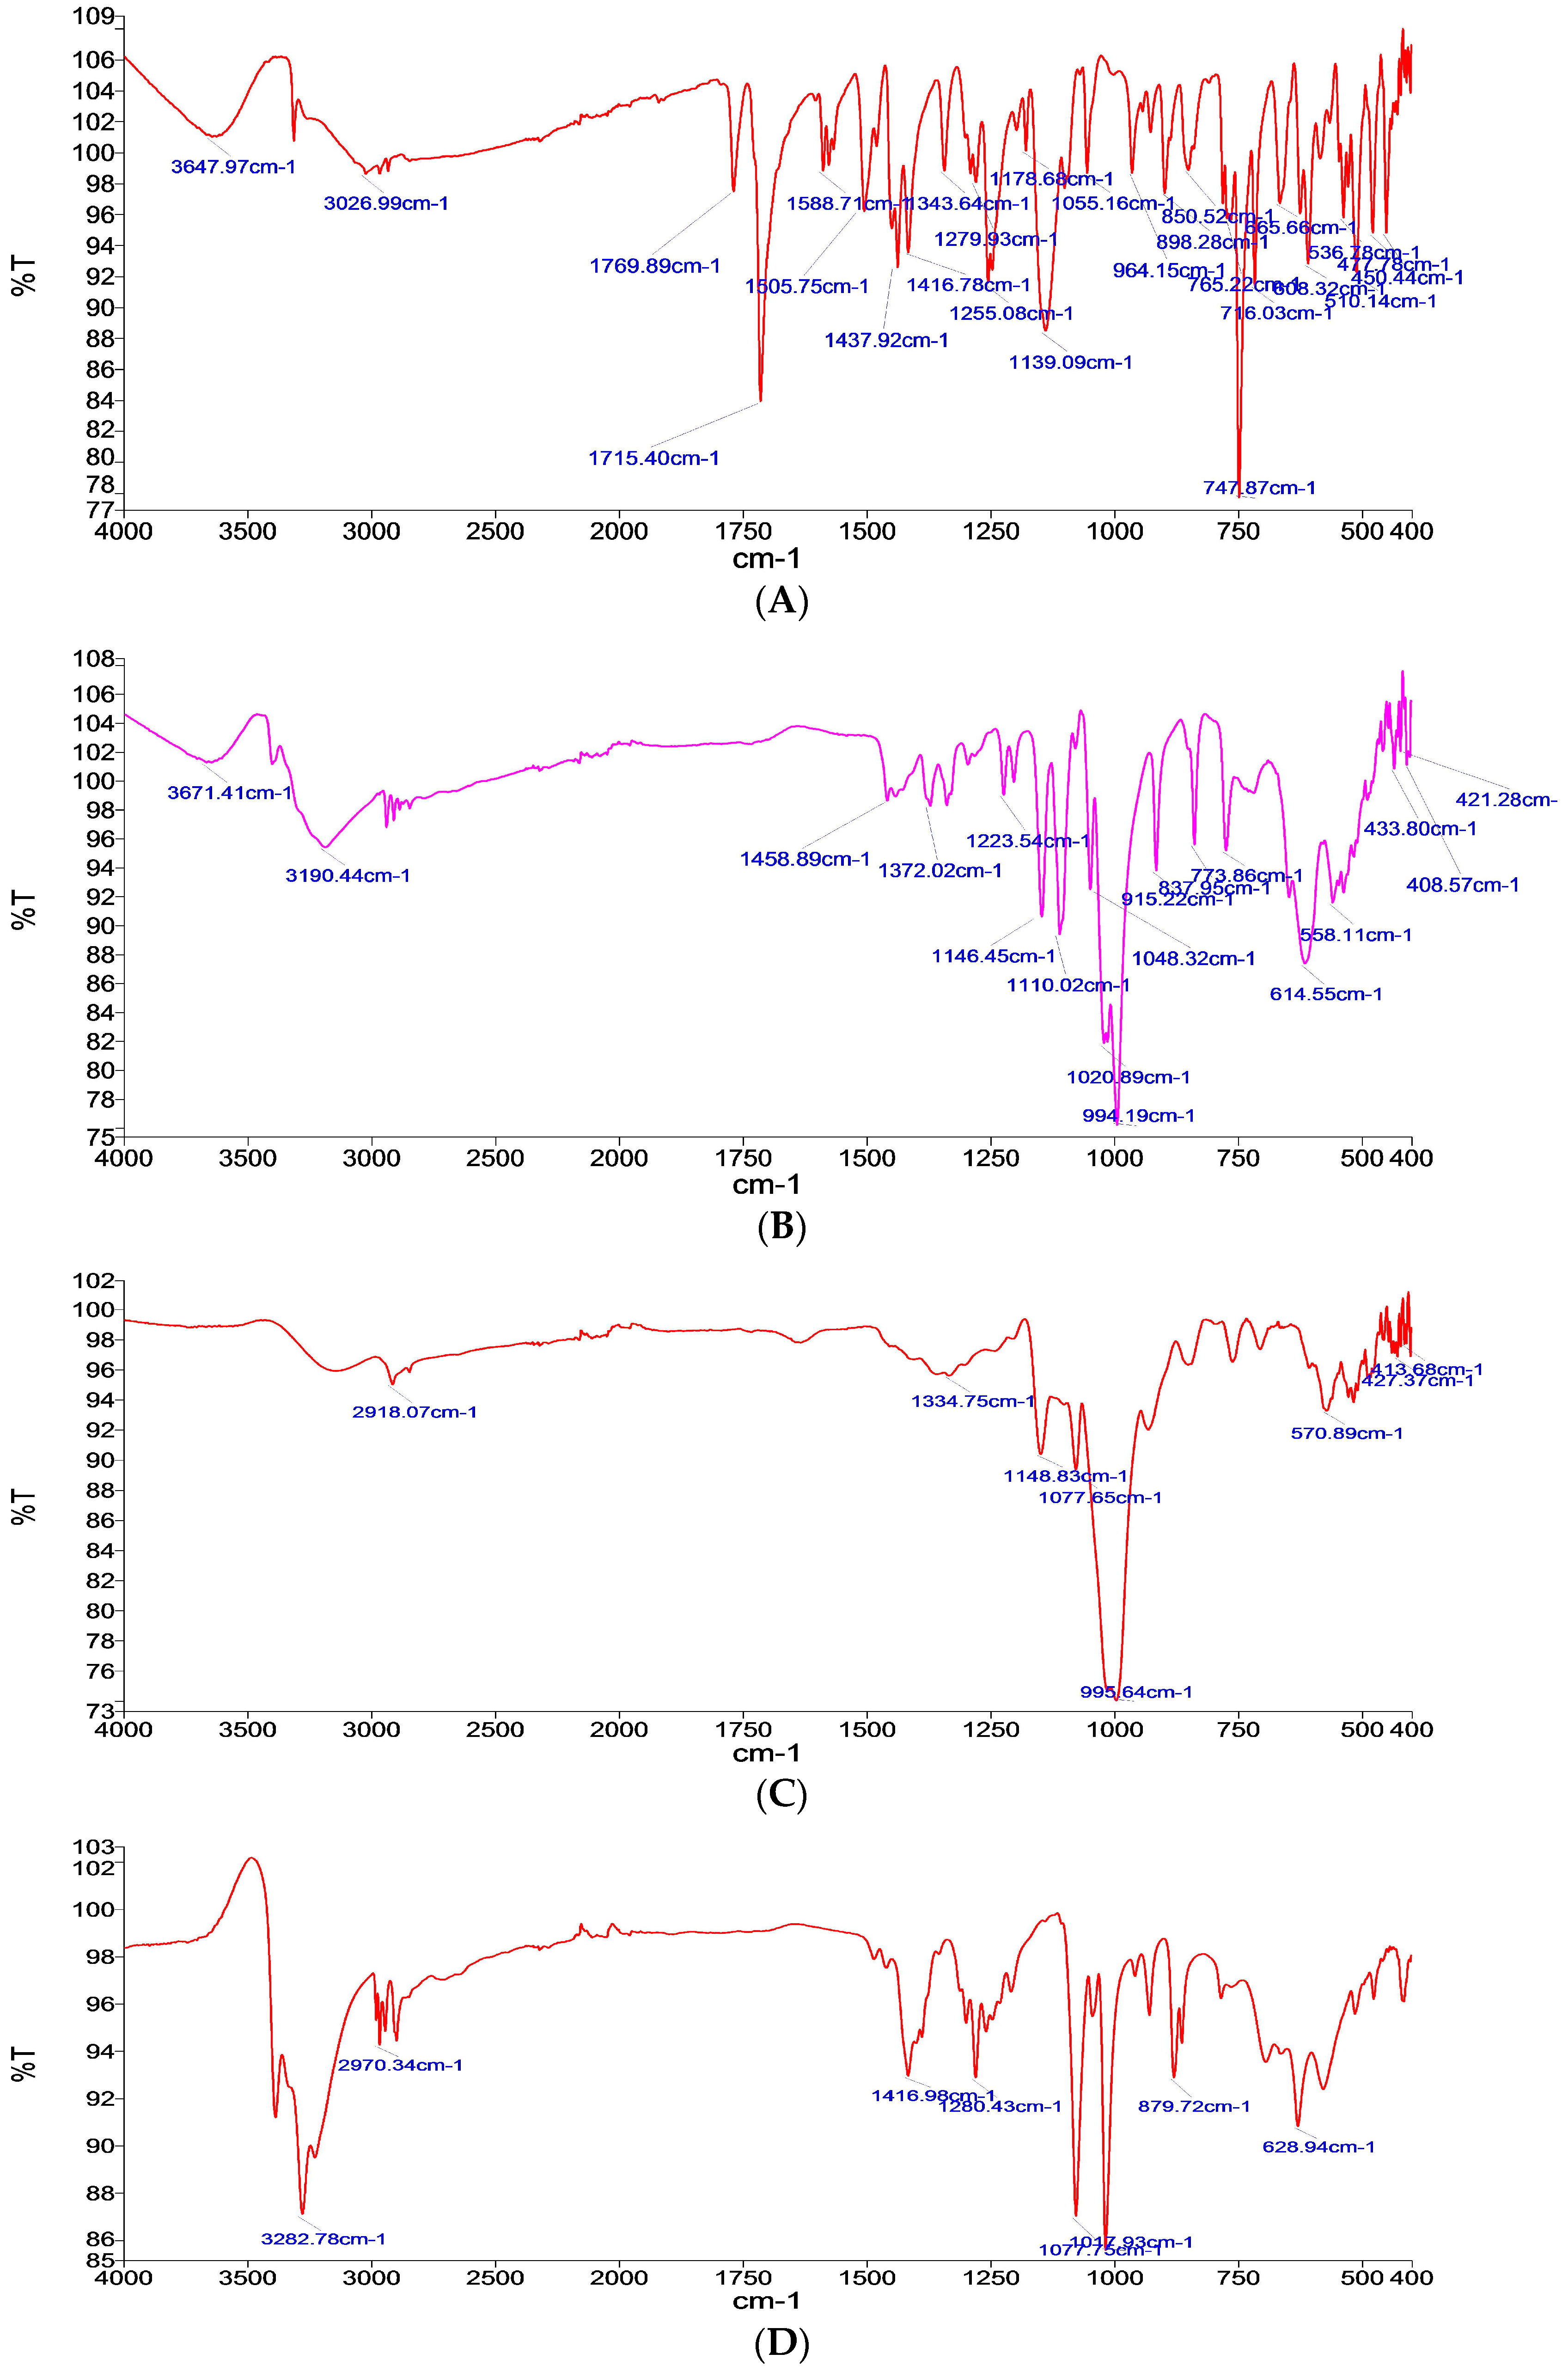
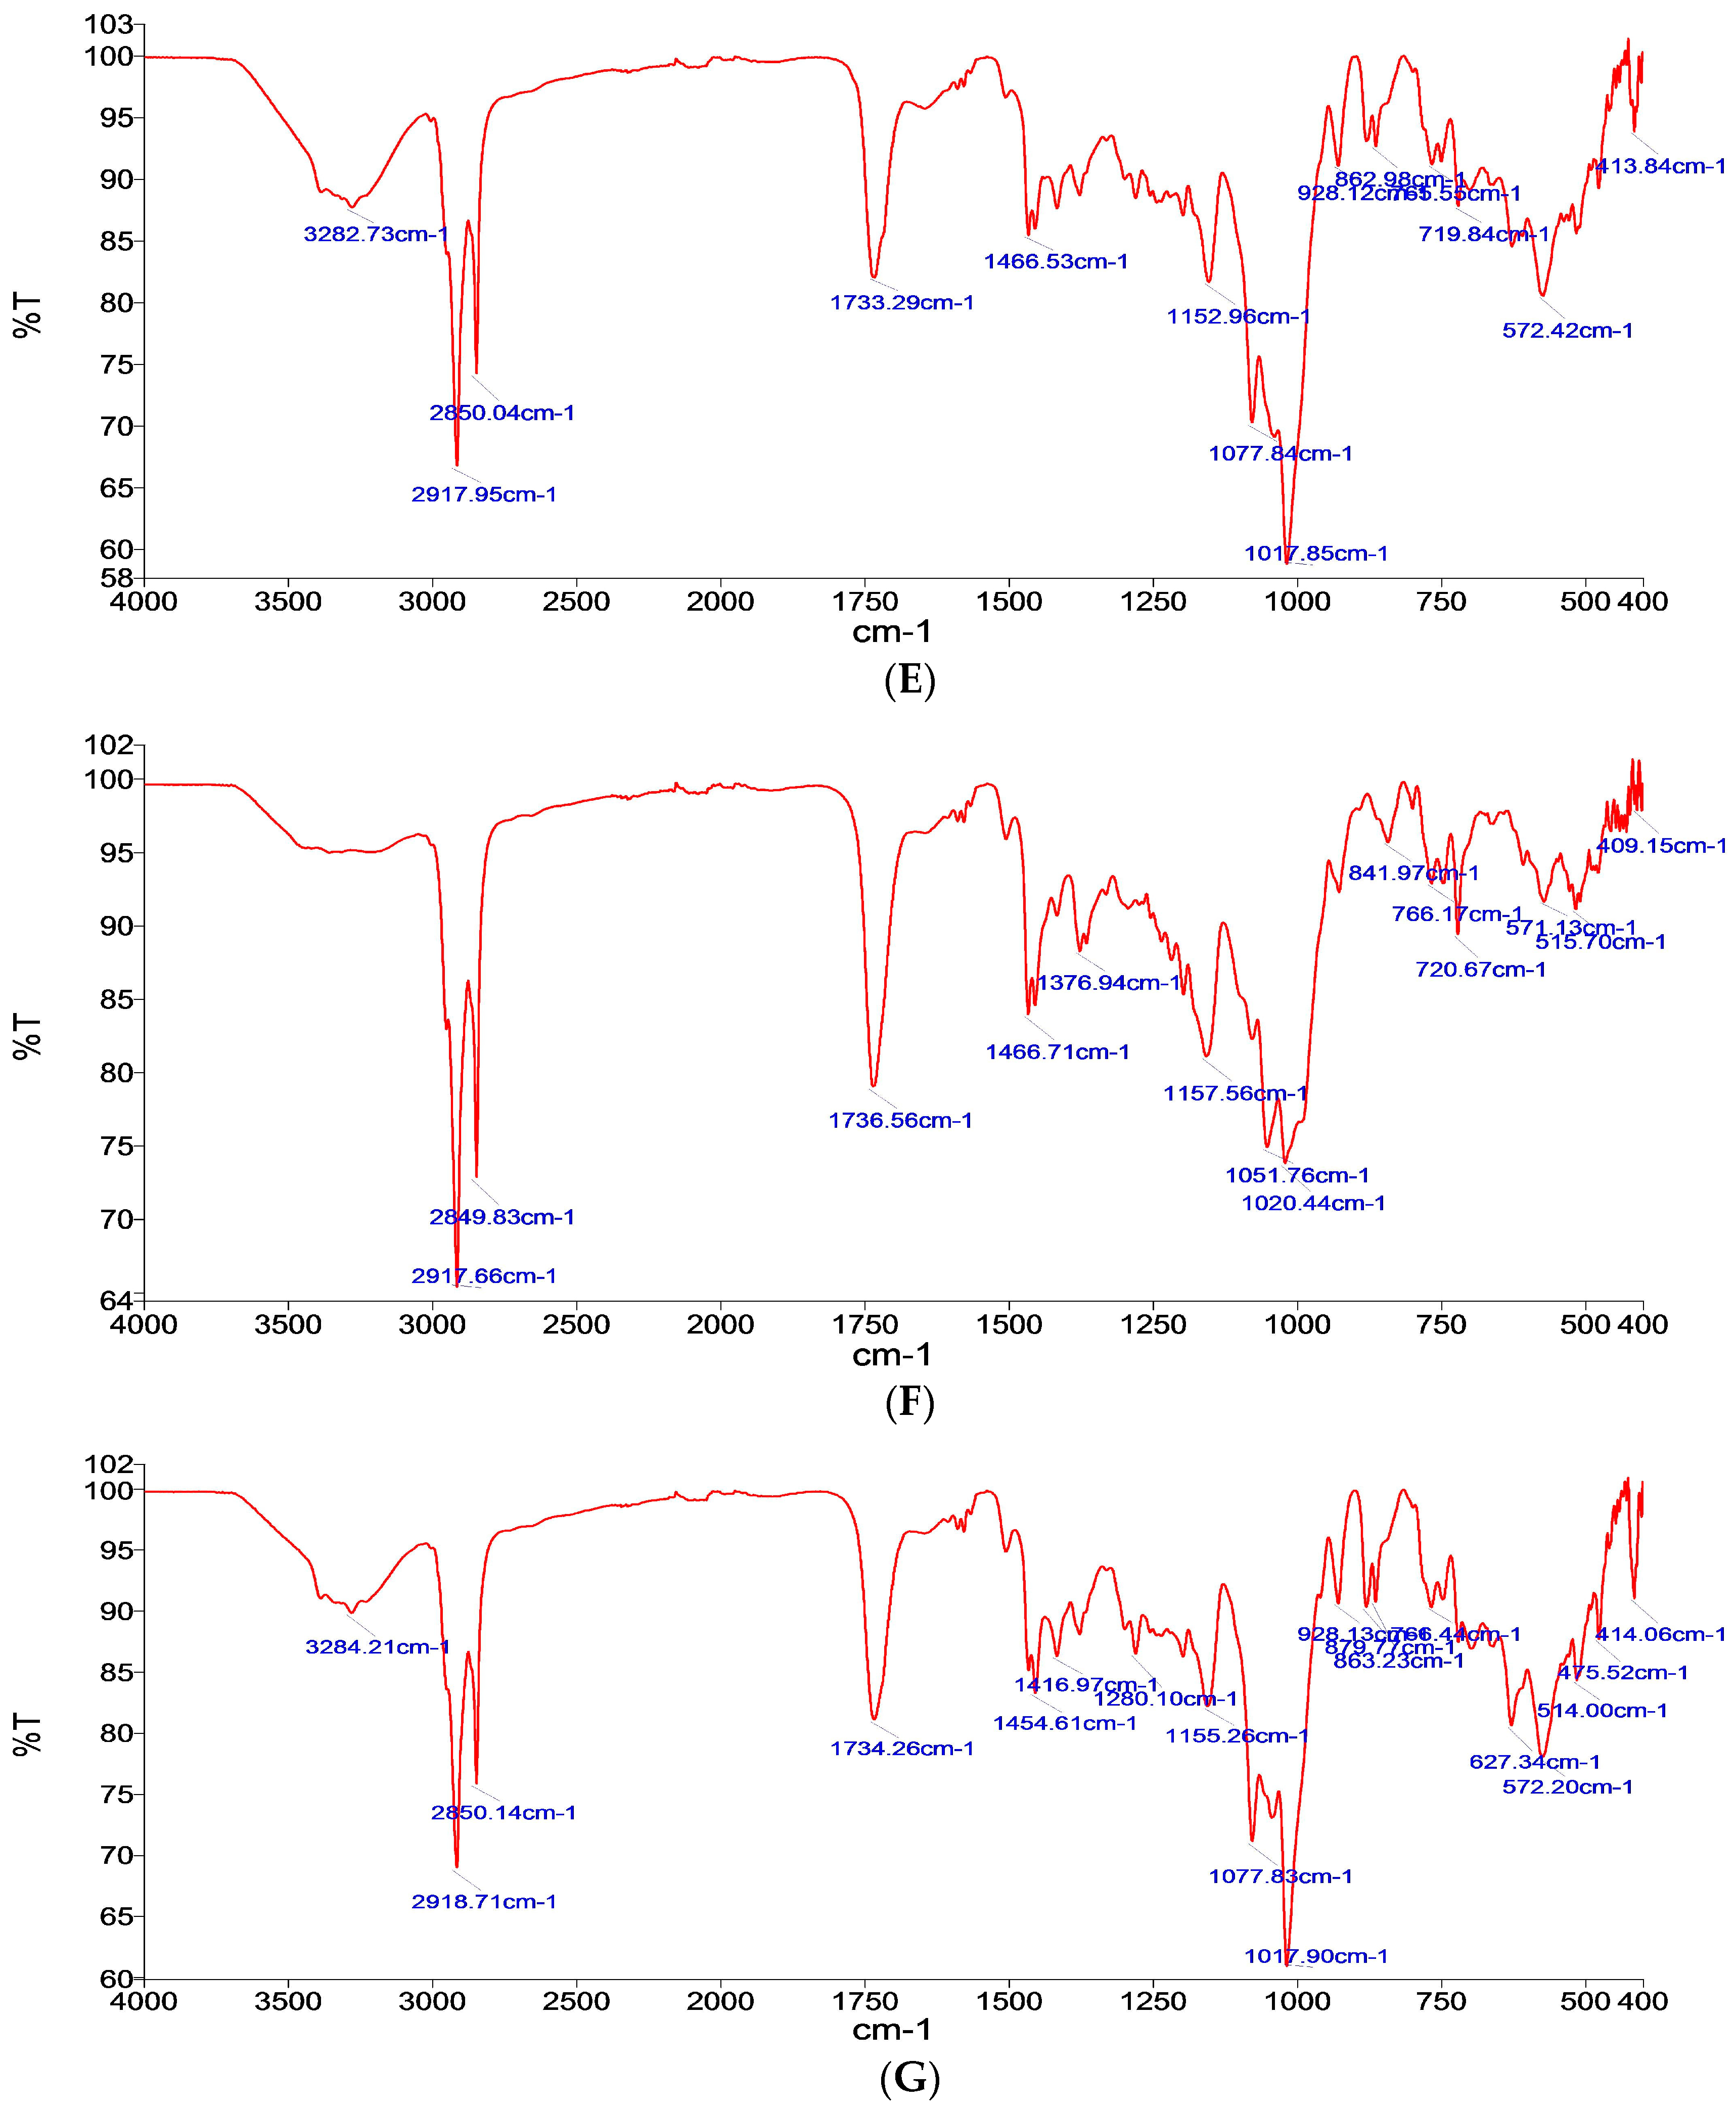
Fourier Transform Infrared (FTIR) Analysis
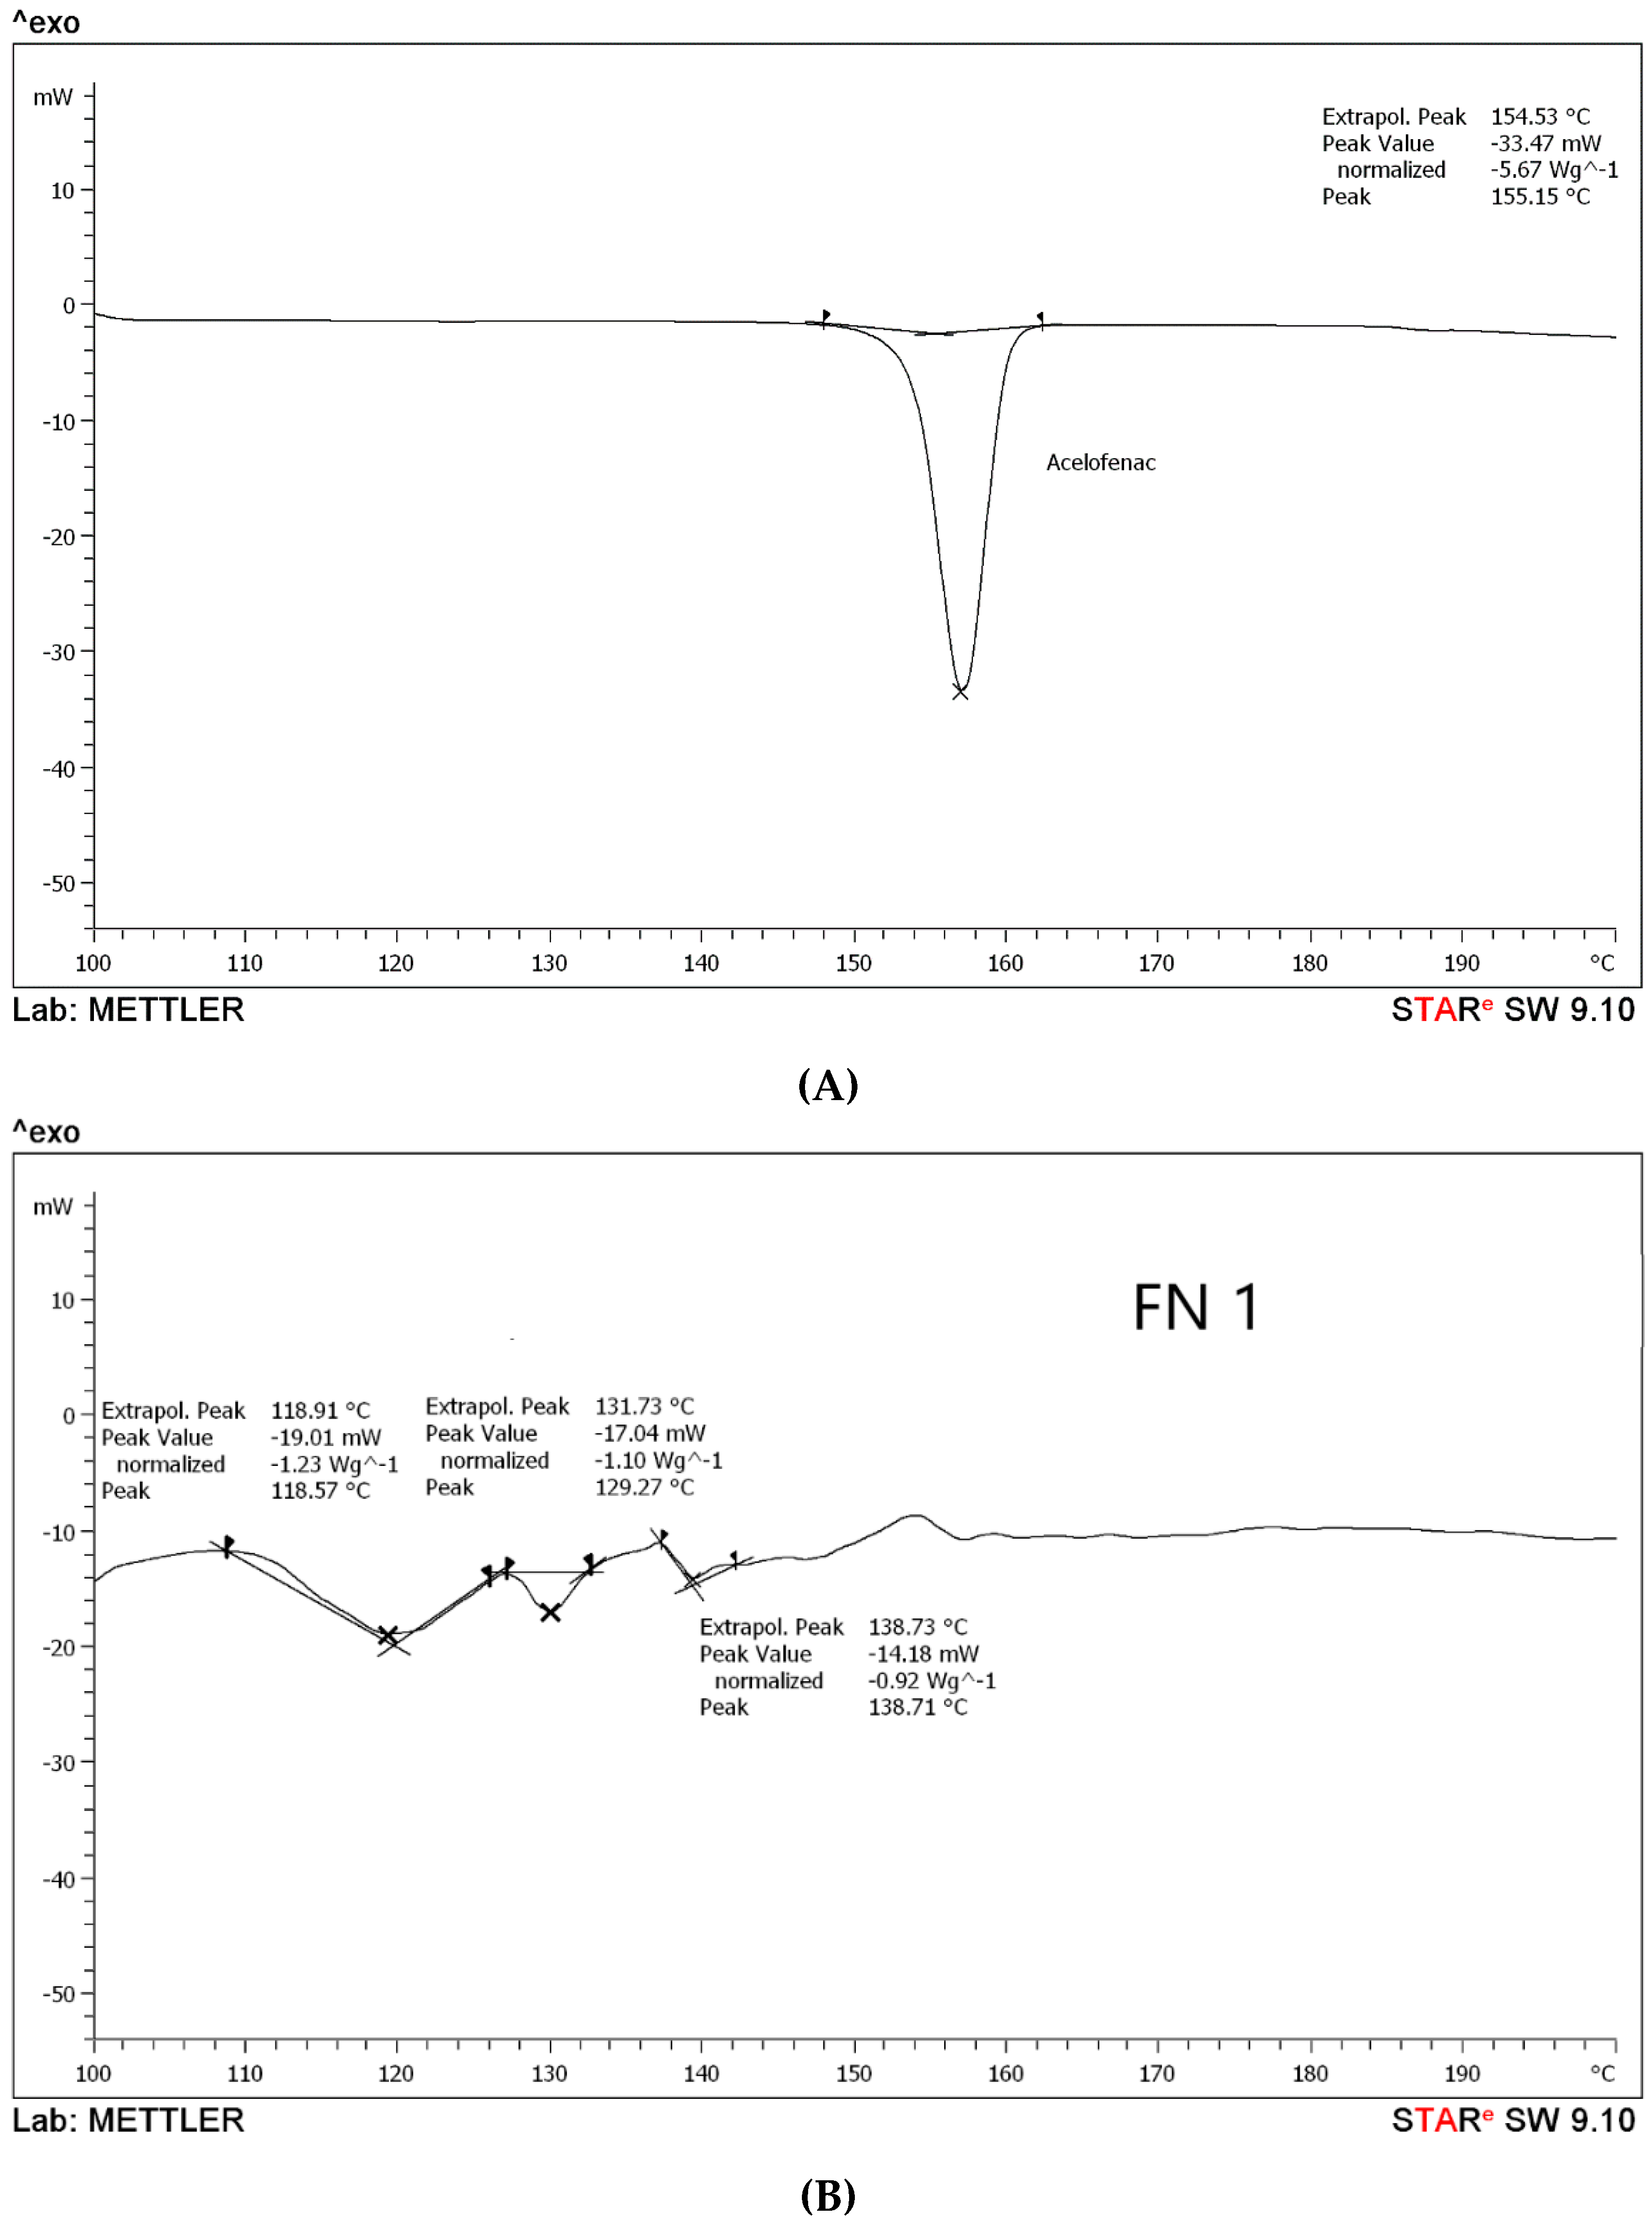
Differential Scanning Calorimetry (DSC) Analysis
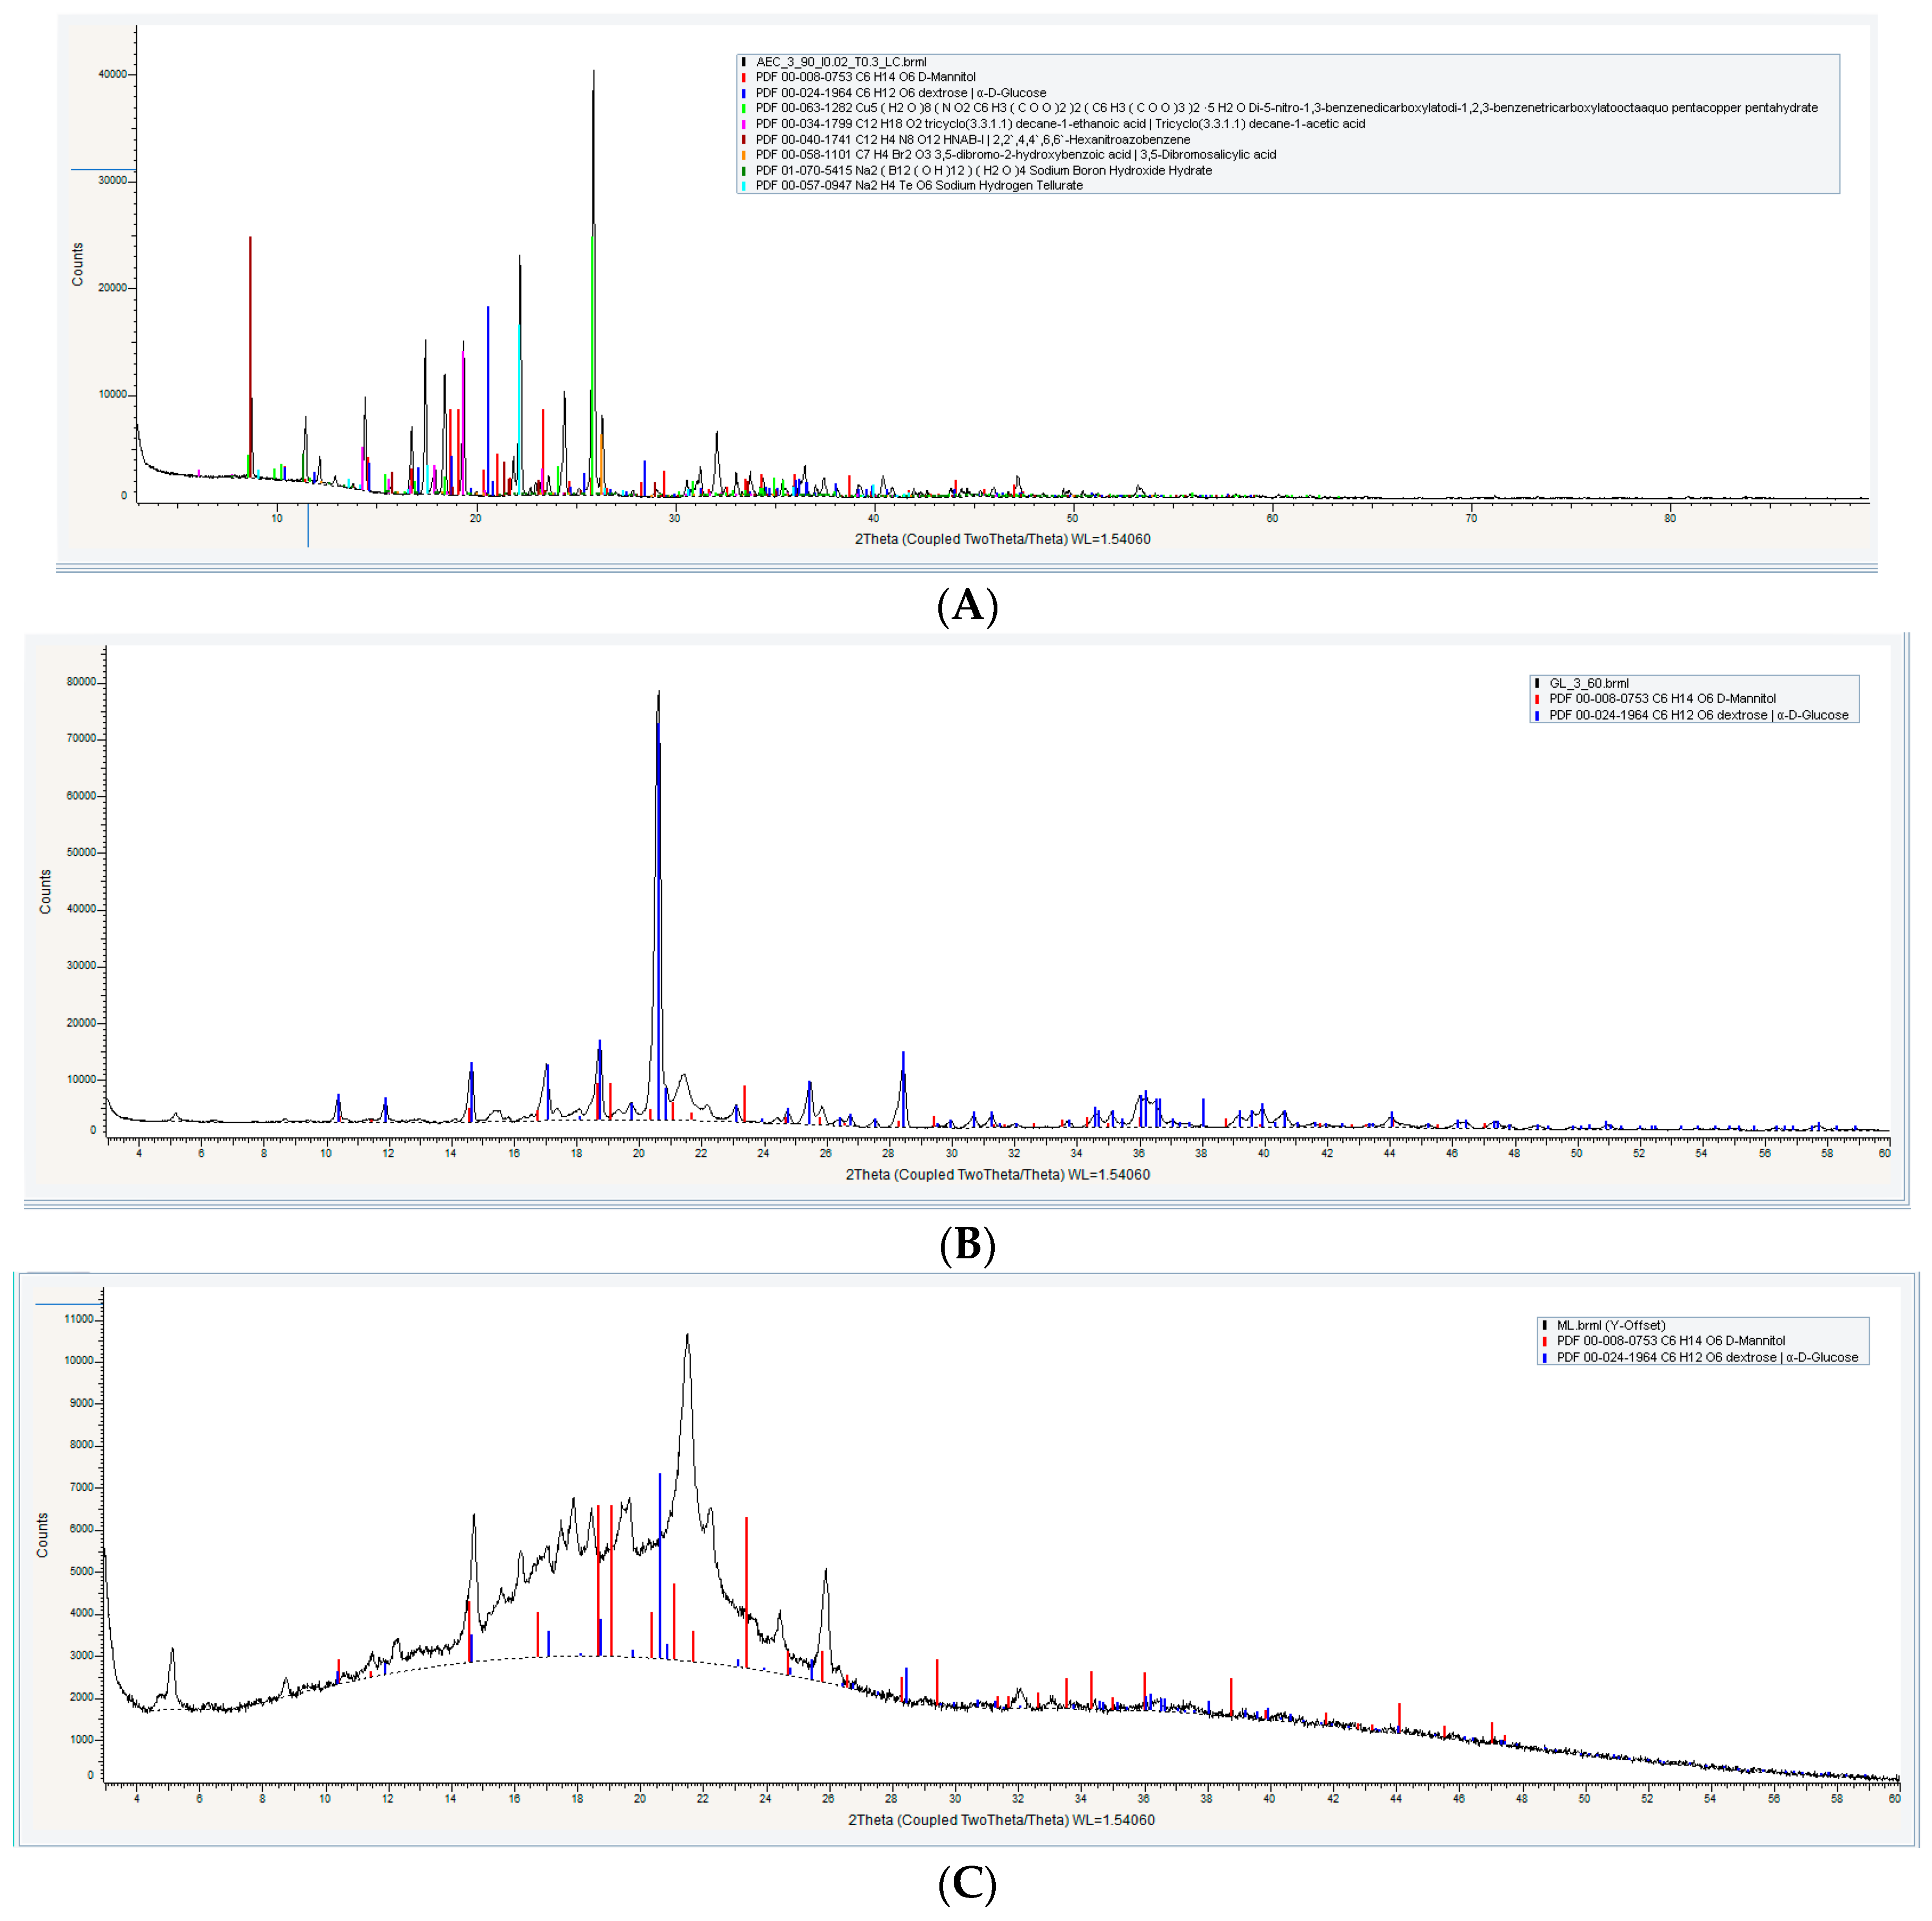
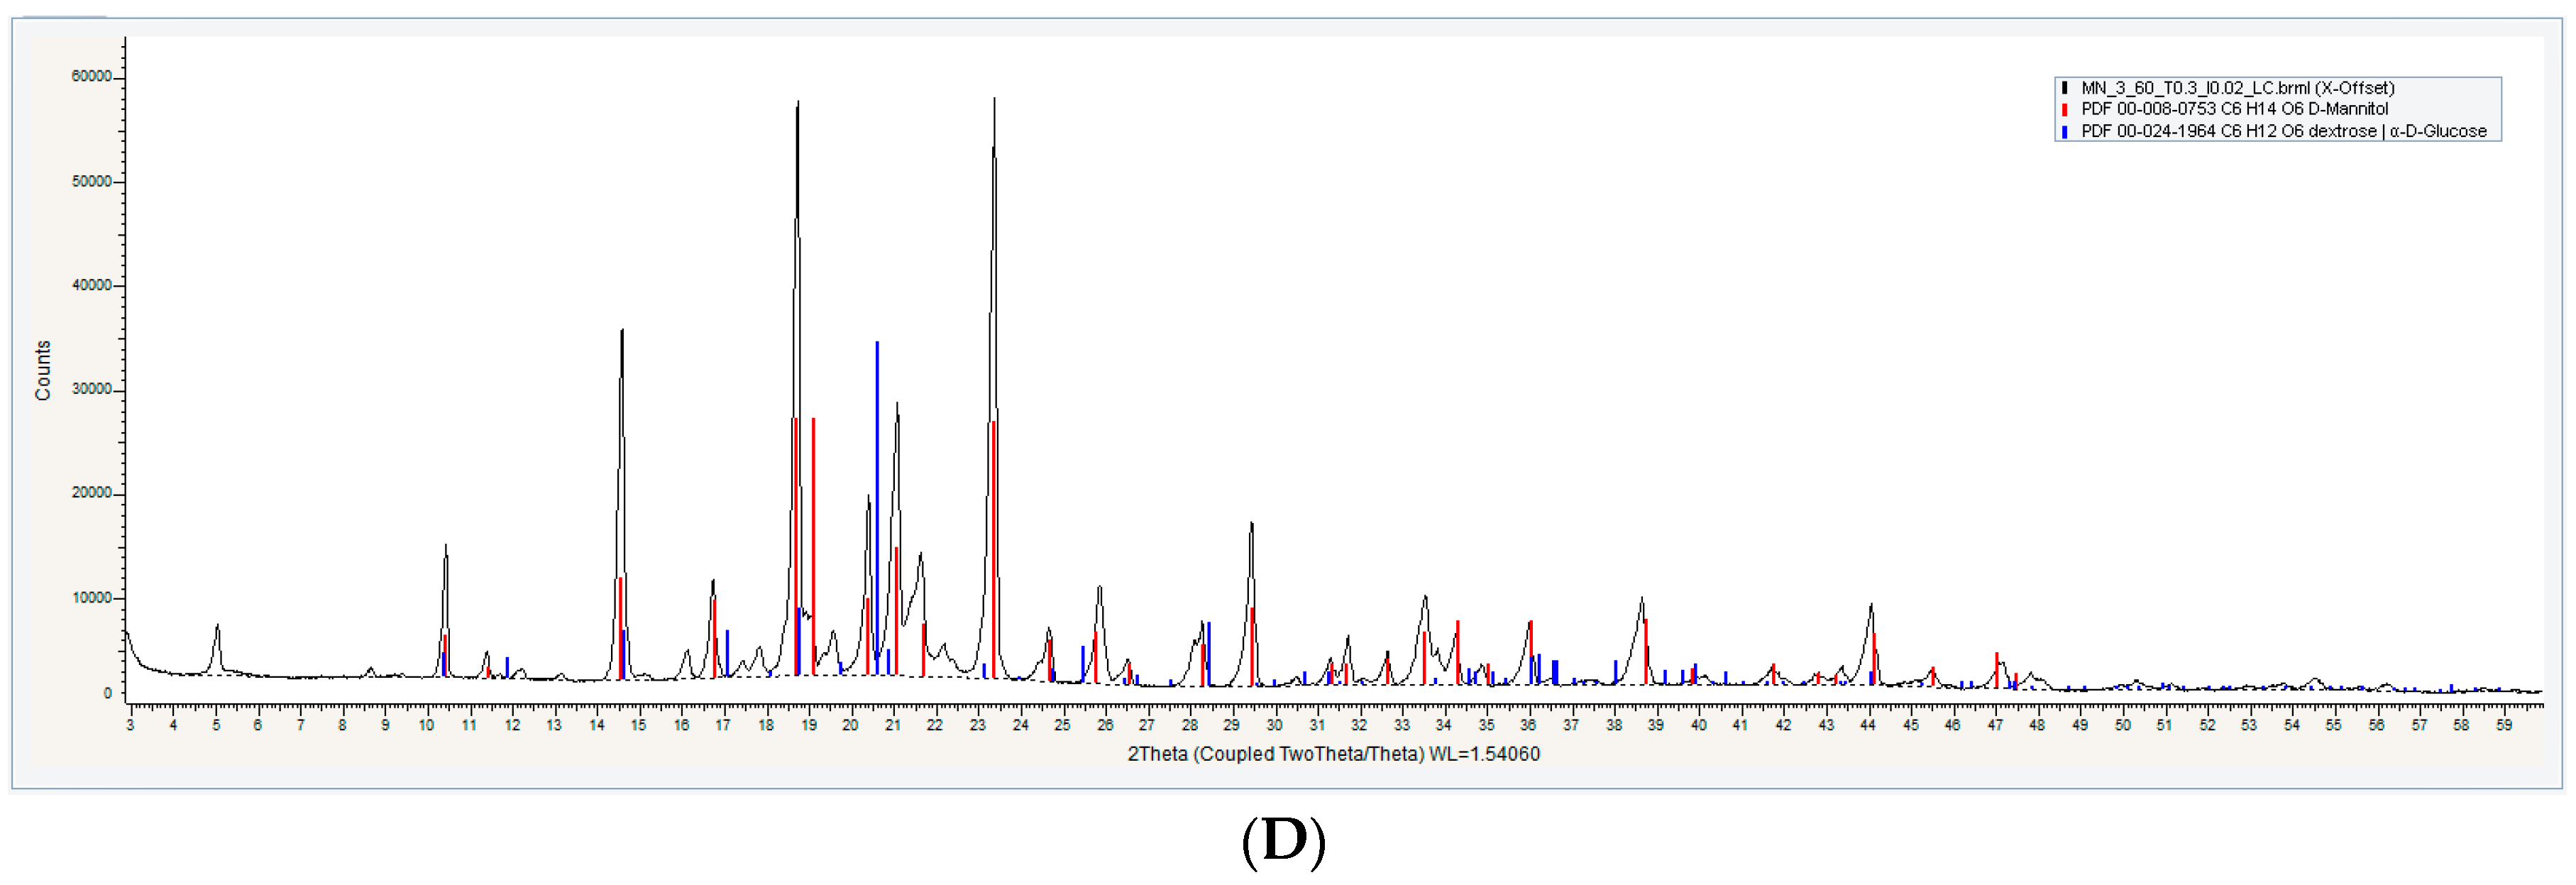
Powder X-ray Diffractometry (XRD) Analysis
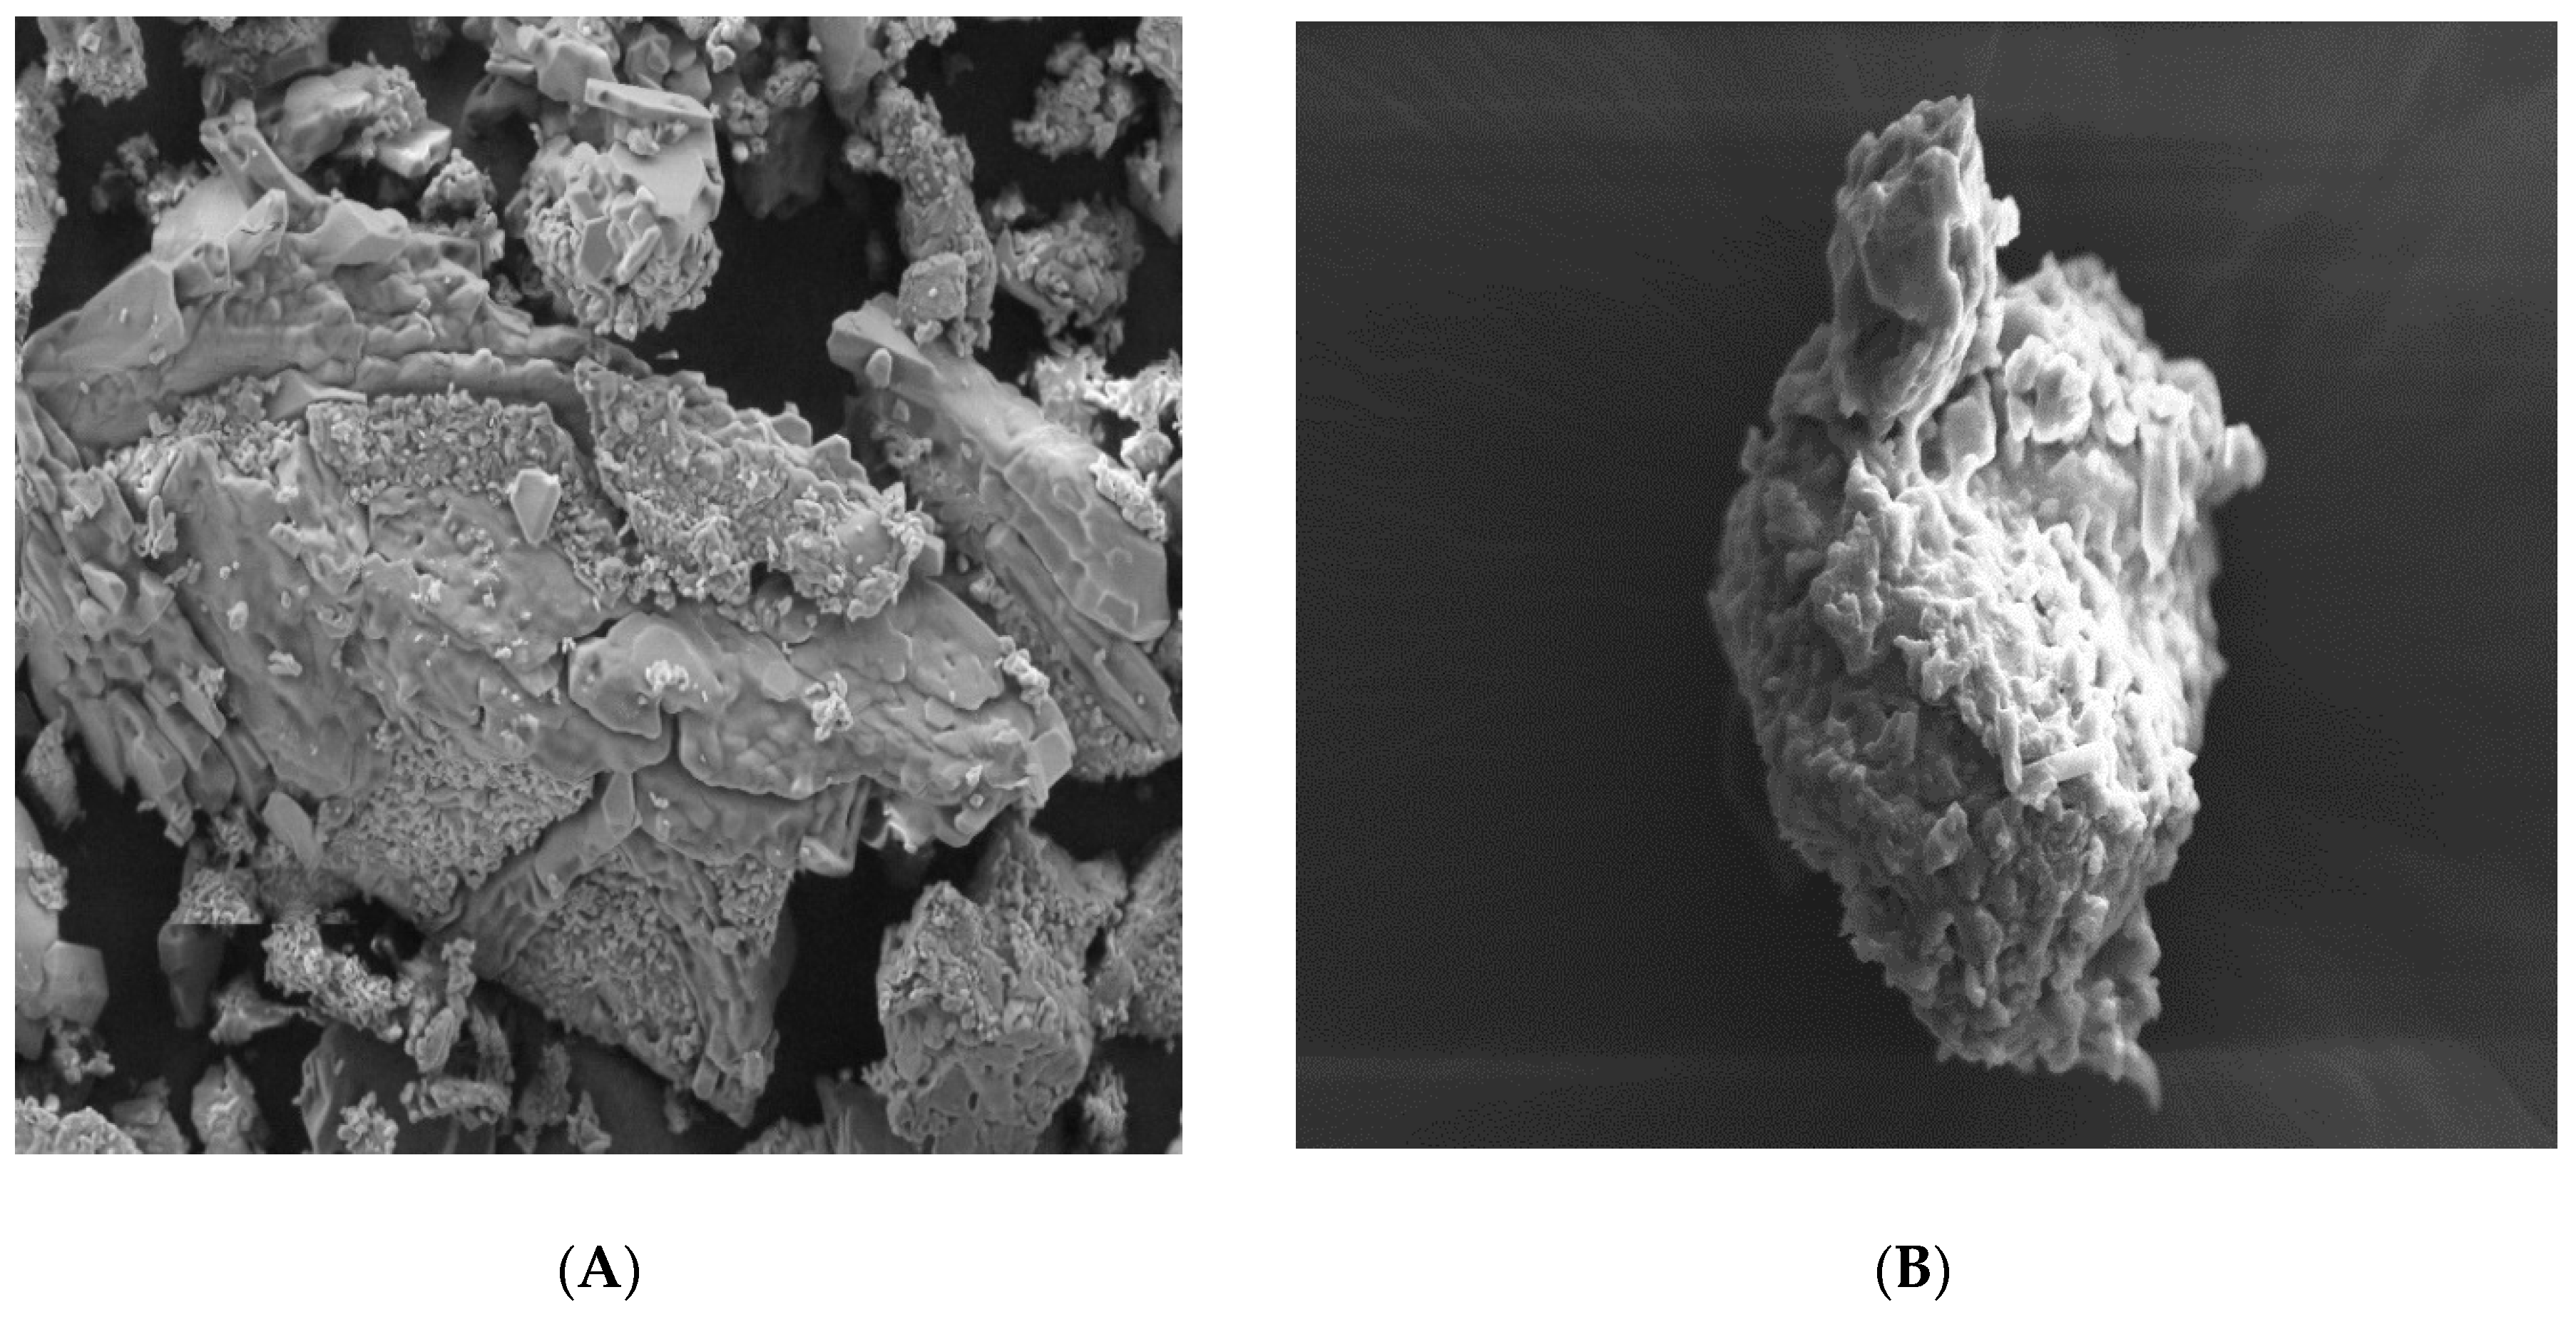
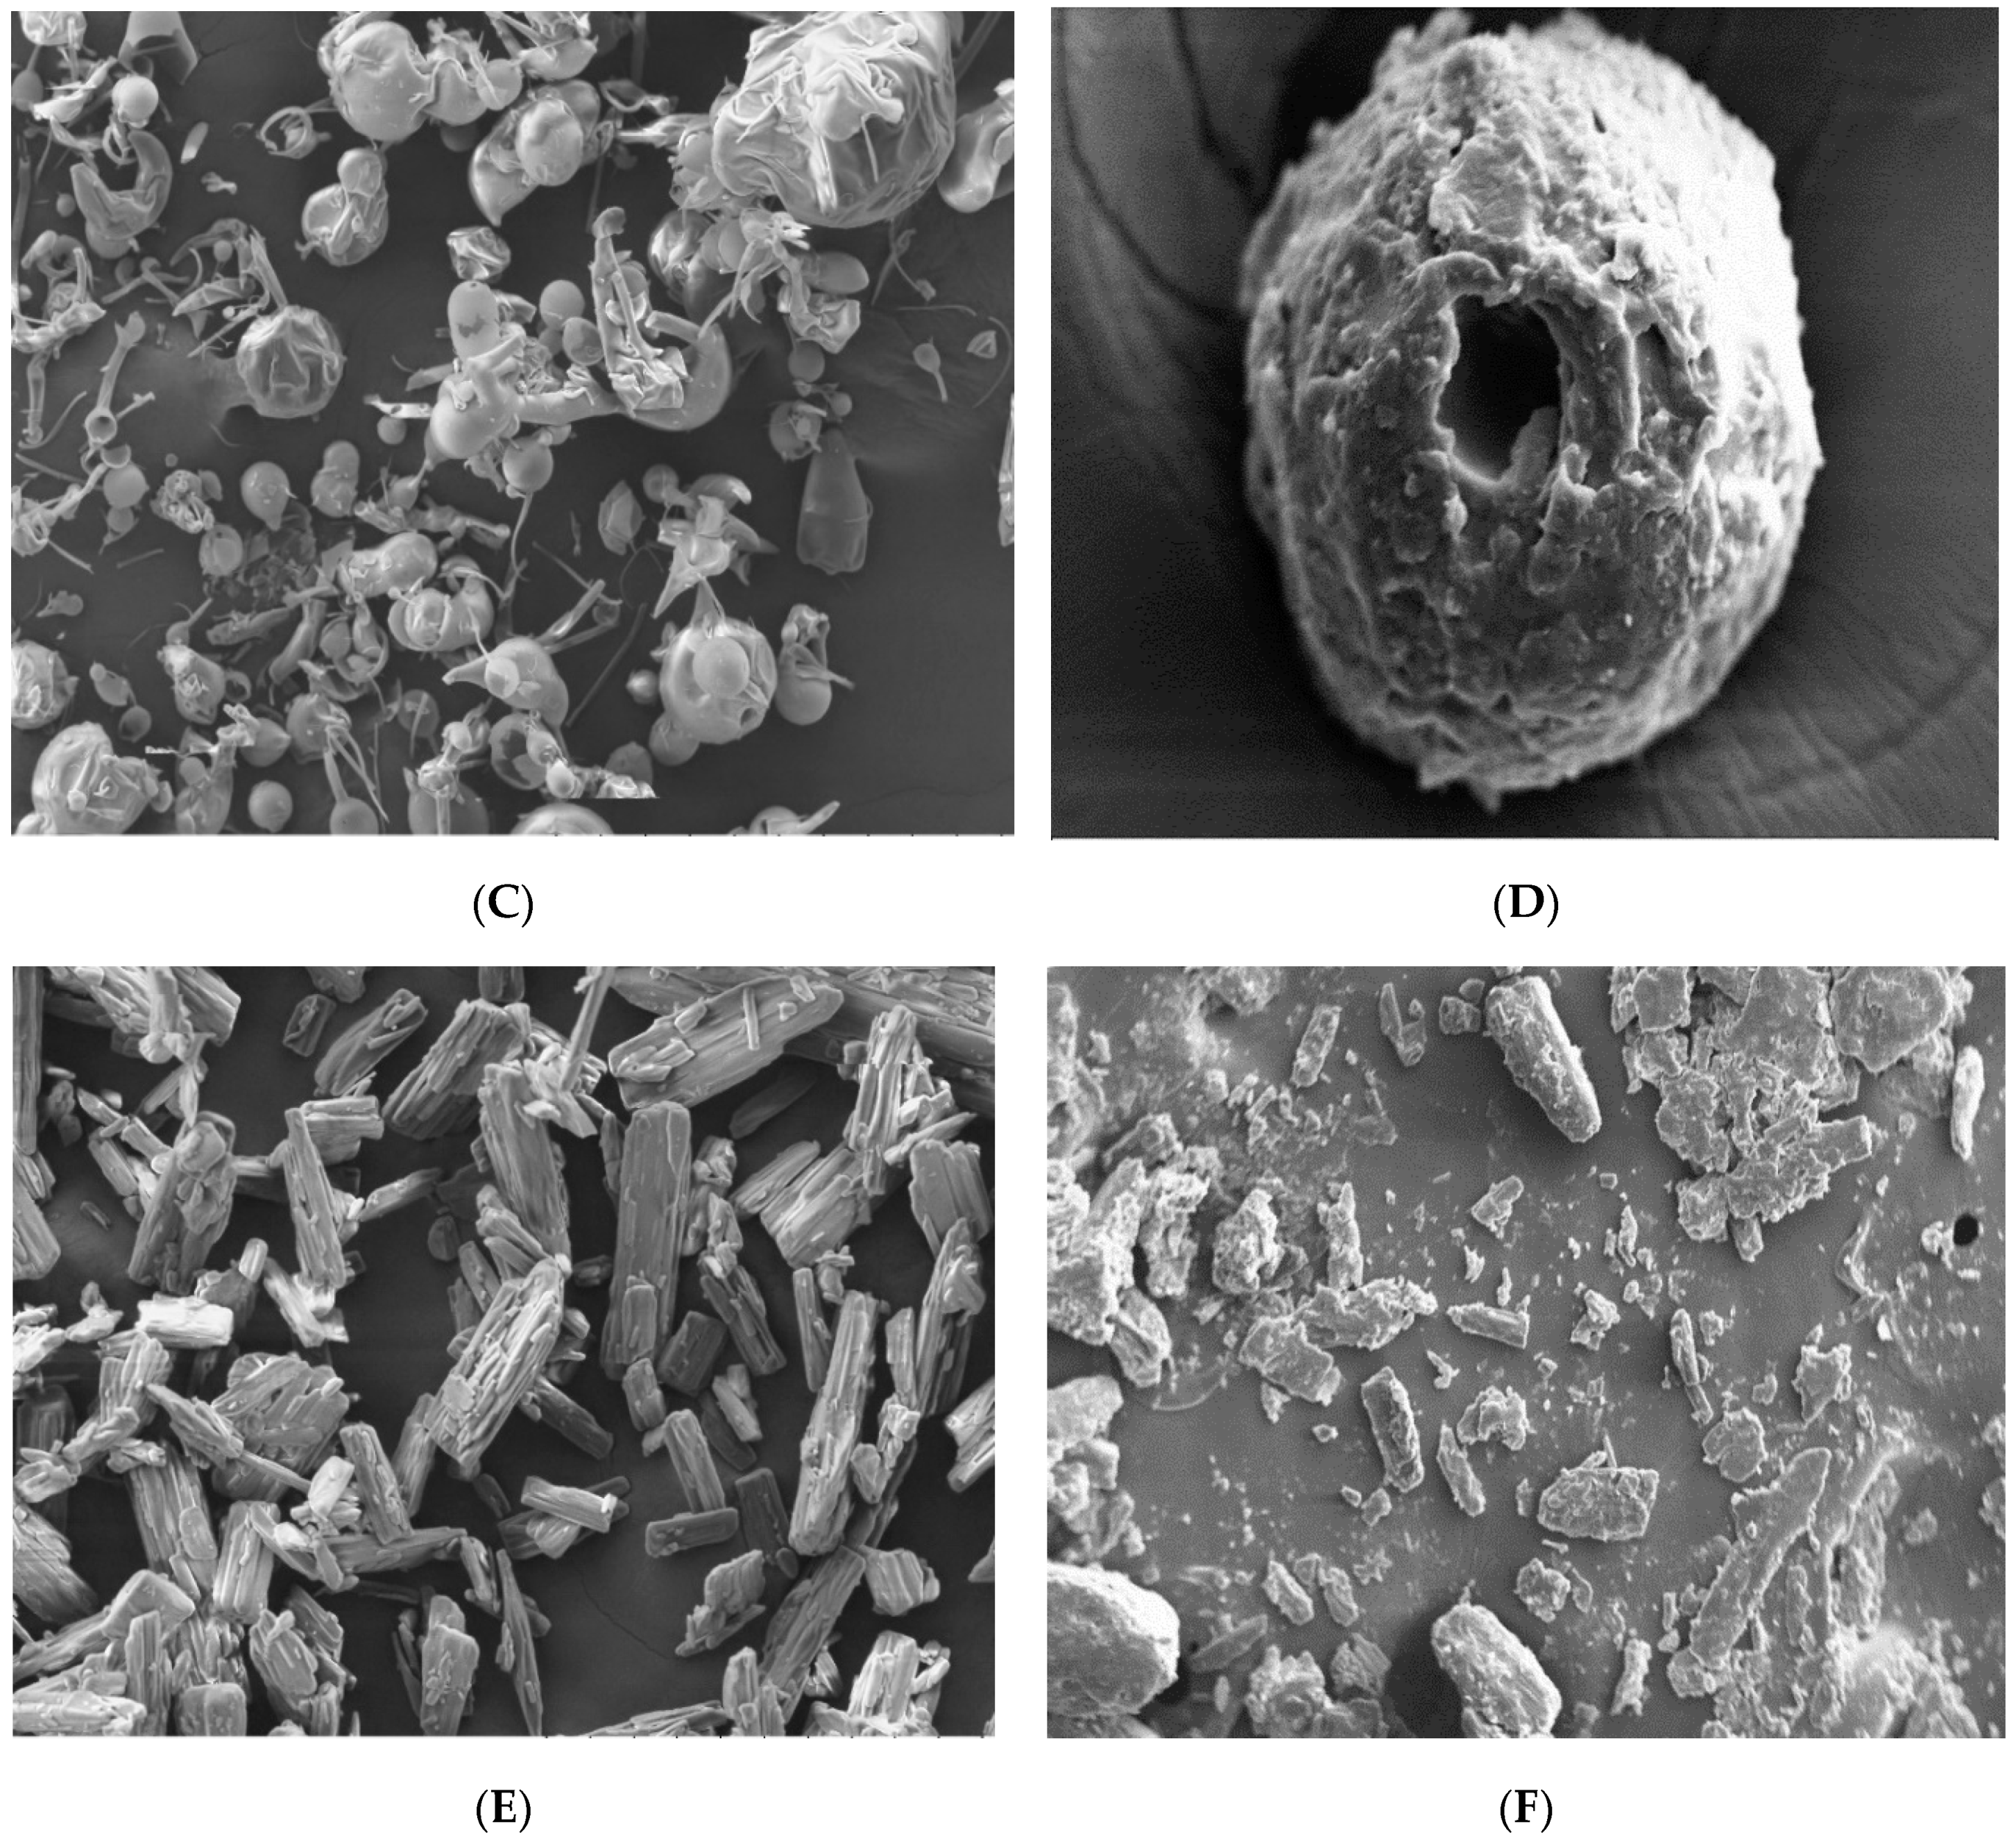
Scanning Electron Microscopy (SEM)
Proniosomes Flowability
2.2.3. Hydration of Niosomes and Optimization of Hydration Conditions by Using %EE
2.2.4. Characterization of Niosomes Derived from Proniosomes
Vesicle Size, PDI, and Zeta Potential Measurements
Drug Content
Optical Microscopy
Statistical Analysis
3. Results and Discussion
3.1. Proniosomes Characterization
3.1.1. Fourier Transform Infrared (FTIR) Analysis
3.1.2. Differential Scanning Calorimetry (DSC) Analysis
3.1.3. Powder X-ray Diffractometry (XRD) Analysis
3.1.4. Scanning Electron Microscopy (SEM)
3.1.5. Powder Flowability
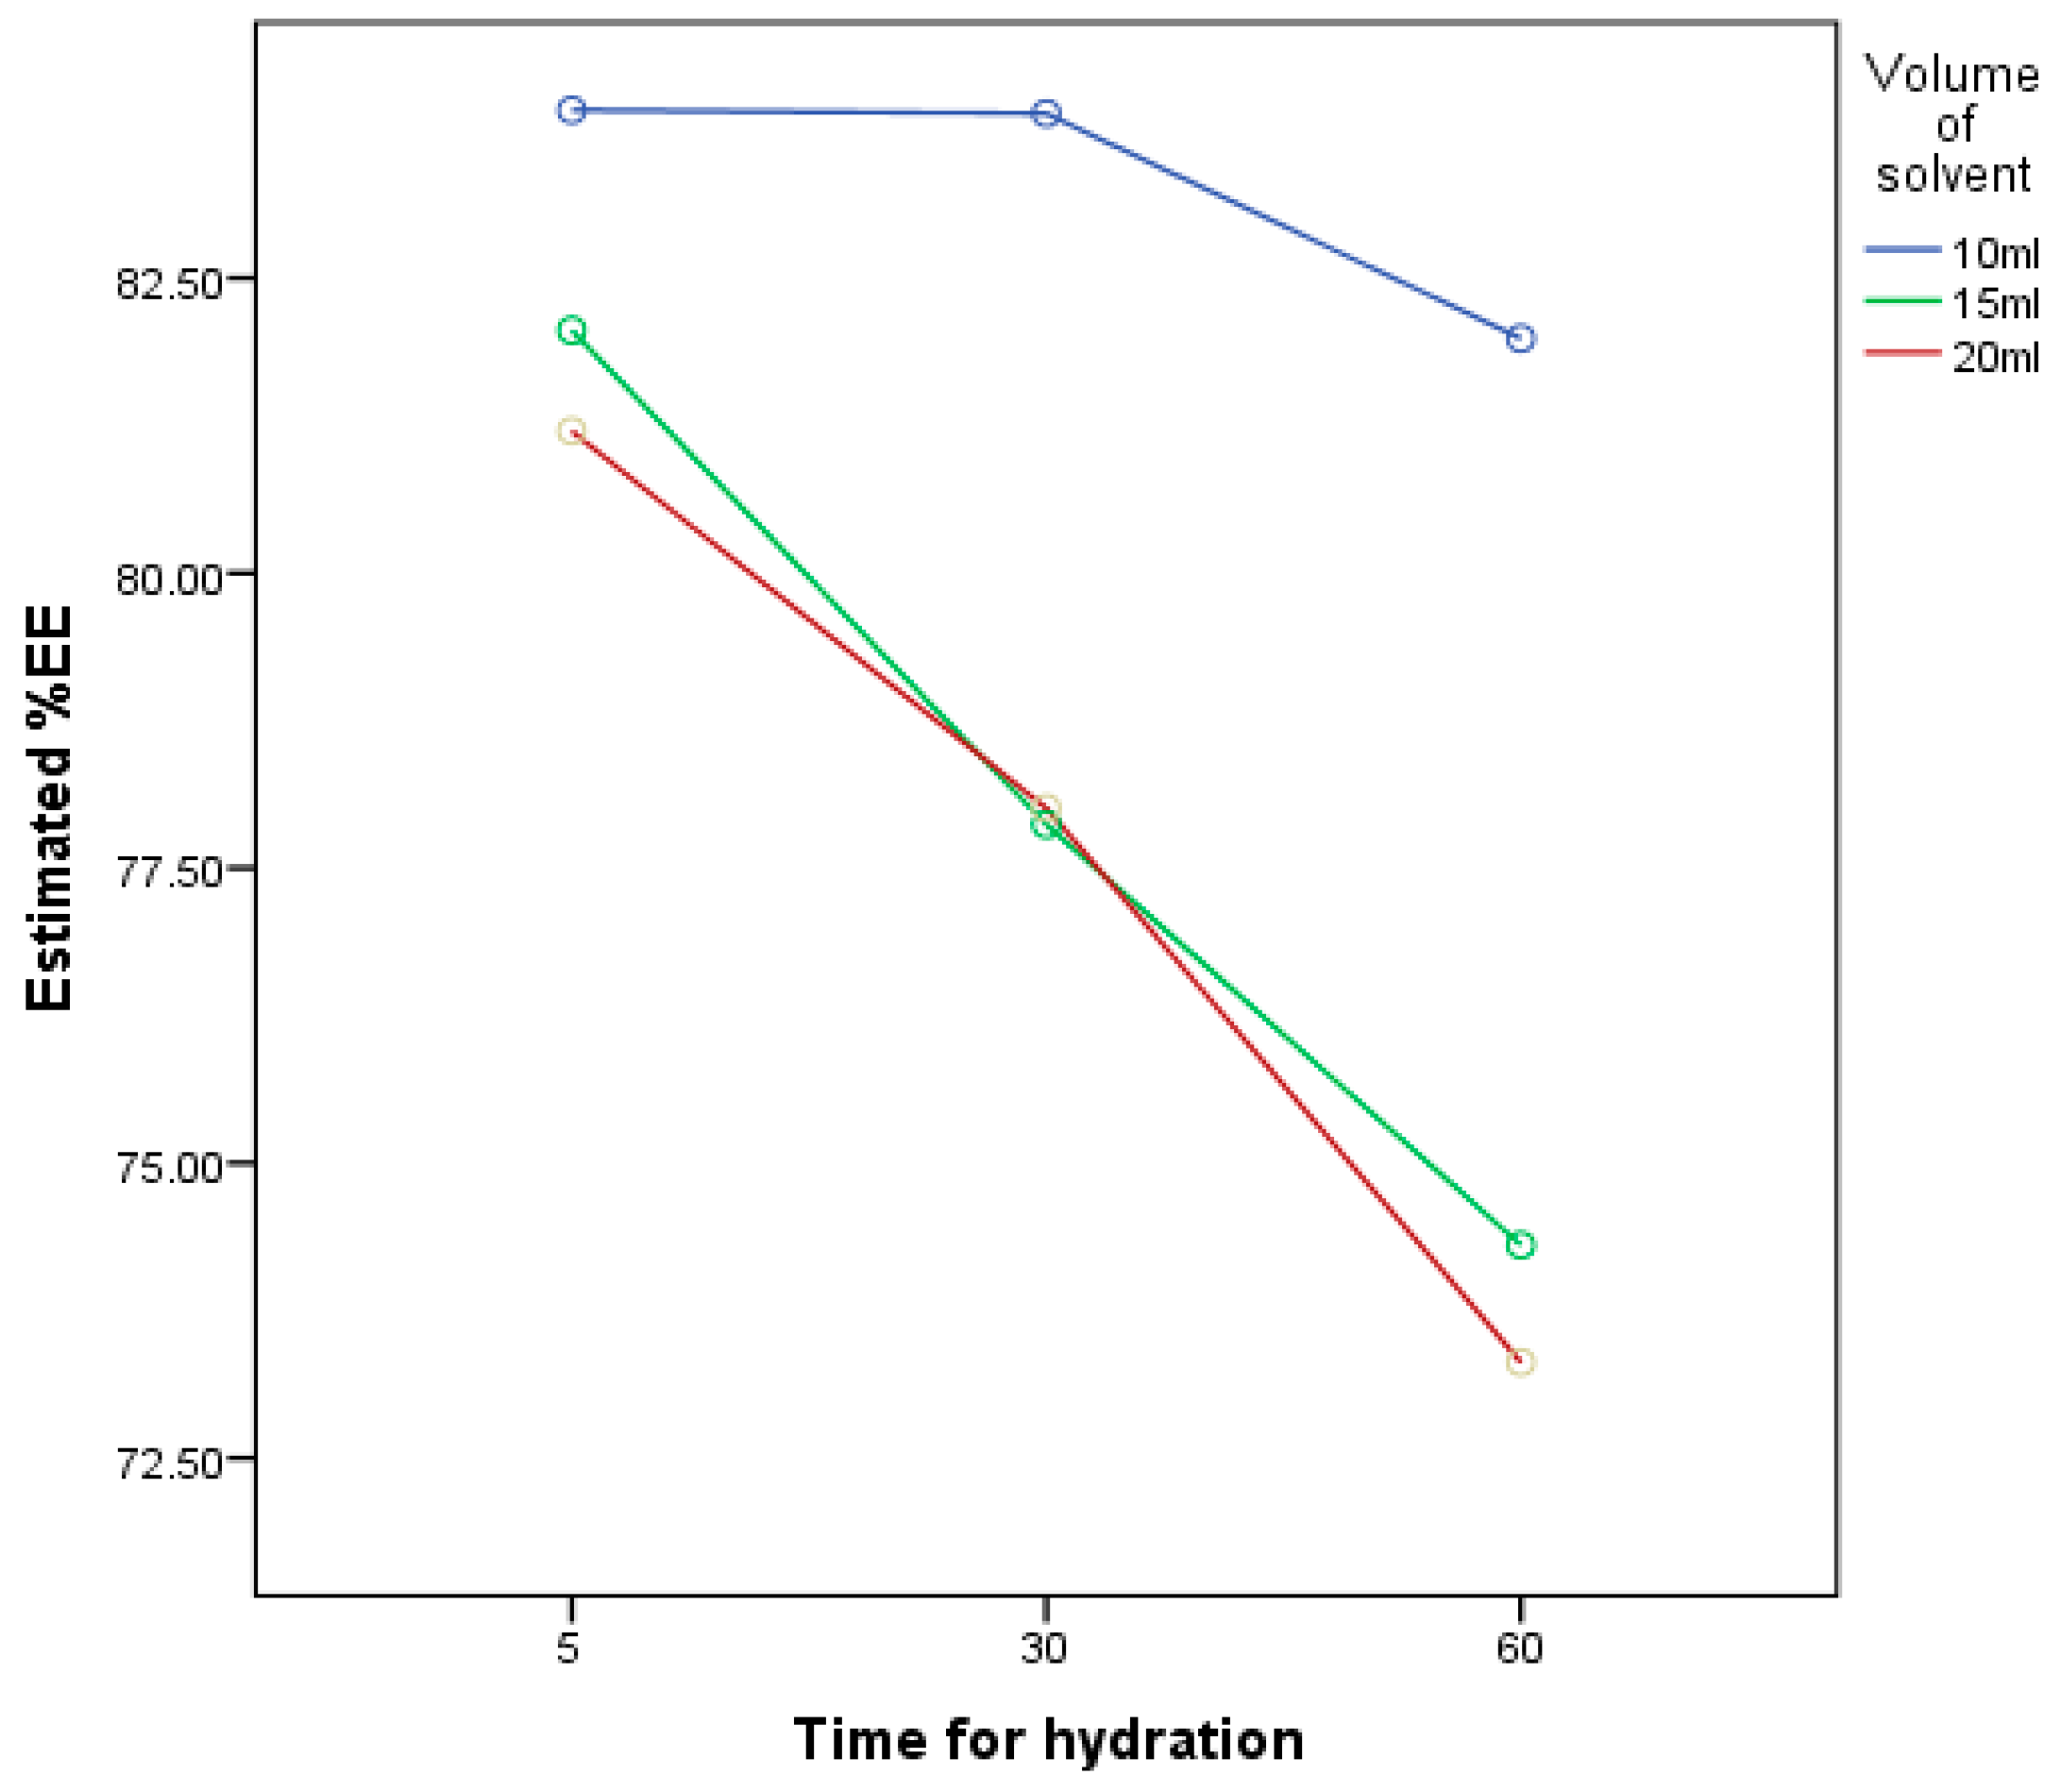
3.2. Effect of Volume of Hydration and Time of Hydration
3.3. Characterization of Niosomes Derived from Proniosomes
3.3.1. Entrapment Efficiency
3.3.2. Vesicle size, PDI, and Zeta Potential Measurements
3.3.3. Drug Content
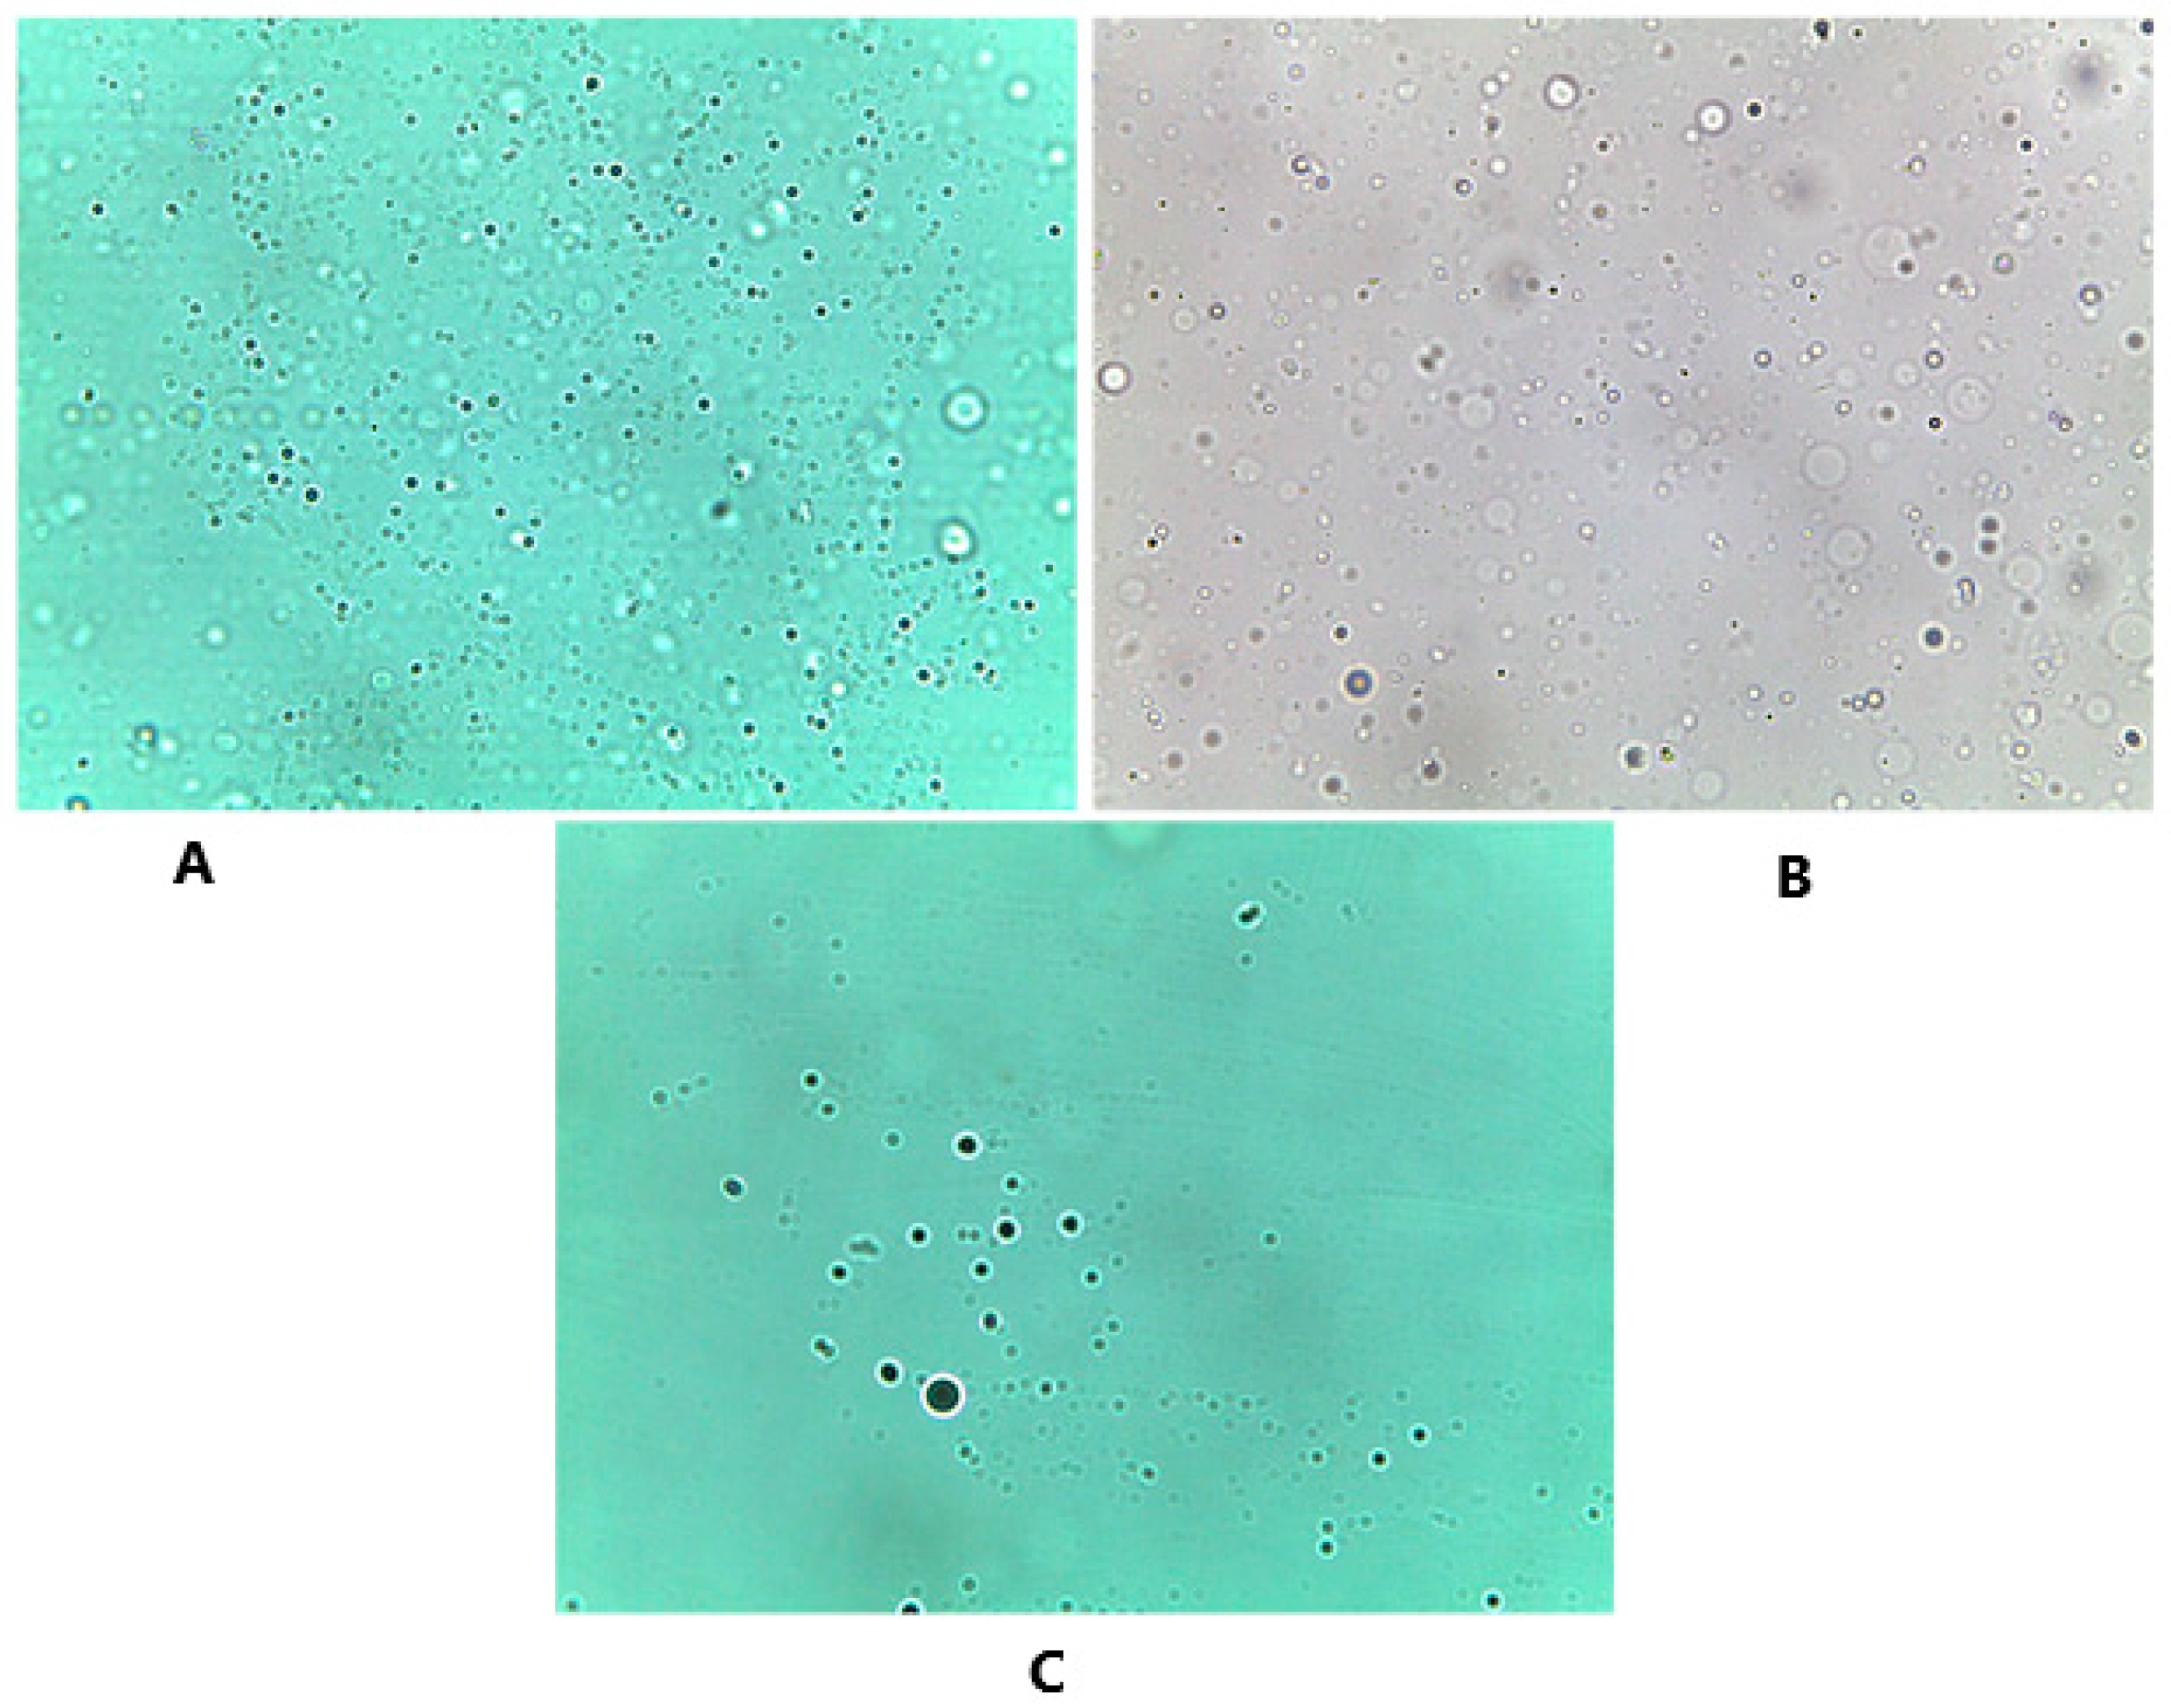
3.3.4. Optical Microscope
4. Conclusions
Author Contributions
Funding
Acknowledgments
Conflicts of Interest
References
- Talegaonkar, S.; Mishra, P.; Khar, R.; Biju, S. Vesicular systems: An overview. Indian J. Pharm. Sci. 2006, 68, 141. [Google Scholar] [CrossRef] [Green Version]
- Lohumi, A. A novel drug delivery system: Niosomes review. J. Drug Deliv. Ther. 2012, 2. [Google Scholar] [CrossRef]
- Hu, C.; Rhodes, D.G. Proniosomes: A Novel Drug Carrier Preparation. Int. J. Pharm. 1999, 185, 23–35. [Google Scholar] [CrossRef]
- Radha, G.V.; Rani, T.S.; Sarvani, B. A review on proniosomal drug delivery system for targeted drug action. J. Basic Clin. Pharm. 2013, 4, 42–48. [Google Scholar] [CrossRef] [Green Version]
- Yasam, V.R.; Jakki, S.L.; Natarajan, J.; Kuppusamy, G. A review on novel vesicular drug delivery: Proniosomes. Drug Deliv. 2014, 21, 243–249. [Google Scholar] [CrossRef]
- Song, S.; Tian, B.; Chen, F.; Zhang, W.; Pan, Y.; Zhang, Q.; Yang, X.; Pan, W. Potentials of proniosomes for improving the oral bioavailability of poorly water-soluble drugs. Drug Dev. Ind. Pharm. 2015, 41, 51–62. [Google Scholar] [CrossRef]
- Veerareddy, P.R.; Bobbala, S.K.R. Enhanced oral bioavailability of isradipine via proniosomal systems. Drug Dev. Ind. Pharm. 2013, 39, 909–917. [Google Scholar] [CrossRef]
- Sivaprasad, S.N.V.; Kumar, P.L.; Srinivas, M.; Brahmaiah, B.; Nama, S. Proniosome: A novel approach to vesicular drug delivery system. Int. J. Pharm. Pharm. Sci. Res. 2013, 3, 6. [Google Scholar]
- Akhilesh, D.; Faishal, G.; Kamath, J. Comparative Study of Carriers Used in Proniosomes. Int. J. Pharm. Chem. Sci. 2012, 3, 6–12. [Google Scholar]
- Setty, C.M.; Prasad, D.V.K.; Gupta, V.R.M.; Sa, B. Development of fast dispersible aceclofenac tablets: Effect of functionality of superdisintegrants. Indian J. Pharm. Sci. 2008, 70, 180. [Google Scholar] [CrossRef]
- Srinivas, S.; Anand Kumar, Y.; Hemanth, A.; Anitha, M. Preparation and evaluation of niosomes containing Aceclofenac. Dig. J. Nanomater. Biostruct. 2010, 5, 249–254. [Google Scholar]
- Chandra, A.; Sharma, P.K. Proniosome based drug delivery system of piroxicam. Afr. J. Pharm. Pharmacol. 2008, 2, 184–190. [Google Scholar]
- Gurrapu, A.; Jukanti, R.; Bobbala, S.R.; Kanuganti, S.; Jeevana, J.B. Improved oral delivery of valsartan from maltodextrin based proniosome powders. Adv. Powder Technol. 2012, 23, 583–590. [Google Scholar] [CrossRef]
- Wen, M.M.; Farid, R.M.; Kassem, A.A. Nano-proniosomes enhancing the transdermal delivery of mefenamic acid. J. Liposome Res. 2014, 24, 280–289. [Google Scholar] [CrossRef]
- Alsarra, I.A.; Bosela, A.A.; Ahmed, S.M.; Mahrous, G.M. Proniosomes as a drug carrier for transdermal delivery of ketorolac. Eur. J. Pharm. Biopharm. 2005, 59, 485–490. [Google Scholar] [CrossRef]
- Thakur, G.; Singh, A.; Singh, I. Chitosan-Montmorillonite Polymer Composites: Formulation and Evaluation of Sustained Release Tablets of Aceclofenac. Sci. Pharm. 2016, 84, 603. [Google Scholar] [CrossRef]
- Solanki, A.B.; Parikh, J.R.; Parikh, R.H. Formulation and optimization of piroxicam proniosomes by 3-factor, 3-level box-behnken design. AAPS PharmSciTech 2007, 8, 43–49. [Google Scholar] [CrossRef]
- Kyaw Oo, M.; Mandal, U.K.; Chatterjee, B. Polymeric behavior evaluation of PVP K30-poloxamer binary carrier for solid dispersed nisoldipine by experimental design. Pharm. Dev. Technol. 2017, 22, 2–12. [Google Scholar] [CrossRef]
- Ghadiri, M.; Fatemi, S.; Vatanara, A.; Doroud, D.; Najafabadi, A.R.; Darabi, M.; Rahimi, A.A. Loading hydrophilic drug in solid lipid media as nanoparticles: Statistical modeling of entrapment efficiency and particle size. Int. J. Pharm. 2012, 424, 128–137. [Google Scholar] [CrossRef]
- Sahoo, R.K.; Biswas, N.; Guha, A.; Kuotsu, K. Maltodextrin based proniosomes of nateglinide: Bioavailability assessment. Int. J. Biol. Macromol. 2014, 69, 430–434. [Google Scholar] [CrossRef]
- Paul, K.; Nagarajan, J.S.K.; Chandan, R.S. Standardization of a RP-HPLC method for the estimation of aceclofenac in dosage form. Int. J. Res. Pharm. Chem. 2011, 1, 853–859. [Google Scholar]
- Okore, V.C.; Attama, A.A.; Ofokansi, K.C.; Esimone, C.O.; Onuigbo, E.B. Formulation and Evaluation of Niosomes. Indian J. Pharm. Sci. 2011, 73, 323–328. [Google Scholar]
- Marwa, H.A.; Omaima, A.S.; Hanaa, A.E.; Hanan, M.E. Optimizing proniosomes for controlled release of ketoprofen using Box-Behnken experimental design. Int. J. Pharm. Sci. Res. 2011, 2, 2195. [Google Scholar]
- Ibrahim, M.; Alaam, M.; El-Haes, H.; Jalbout, A.F.; de Leon, A. Analysis of the structure and vibrational spectra of glucose and fructose. Eclética Quím. 2006, 31, 15–21. [Google Scholar] [CrossRef]
- Castro-Cabado, M.; Parra-Ruiz, F.J.; Casado, A.L.; Román, J.S. Thermal Crosslinking of Maltodextrin and Citric Acid. Methodology to Control the Polycondensation Reaction under Processing Conditions. Polym. Polym. Compos. 2016, 24, 643–654. [Google Scholar] [CrossRef]
- Ye, P.; Byron, T. Characterization of D-mannitol by thermal analysis, FTIR and Raman spectroscopy. Am. Lab. 2008, 40, 24–27. [Google Scholar]
- Wang, Y.; Truong, T.; Li, H.; Bhandari, B. Co-melting behaviour of sucrose, glucose & fructose. Food Chem. 2019, 275, 292–298. [Google Scholar]
- Kumaresan, G.; Velraj, R.; Iniyan, S. Thermal Analysis of D-mannitol for Use as Phase Change Material for Latent Heat Storage. J. Appl. Sci. 2011, 11, 3044–3048. [Google Scholar] [CrossRef]
- Jana, S.; Manna, S.; Nayak, A.K.; Sen, K.K.; Basu, S.K. Carbopol gel containing chitosan-egg albumin nanoparticles for transdermal aceclofenac delivery. Colloids Surf. B Biointerfaces 2014, 114, 36–44. [Google Scholar] [CrossRef]
- Takagaki, A.; Tagusagawa, C.; Domen, K. Glucose production from saccharides using layered transition metal oxide and exfoliated nanosheets as a water-tolerant solid acid catalyst. Chem. Commun. 2008, 42, 5363–5365. [Google Scholar] [CrossRef]
- Qian, J.-Y.; Chen, W.; Zhang, W.-M.; Zhang, H. Adulteration identification of some fungal polysaccharides with, SEM, XRD, IR and optical rotation: A primary approach. Carbohydr. Polym. 2009, 78, 620–625. [Google Scholar] [CrossRef]
- Nunes, C.; Suryanarayanan, R.; Botez, C.E.; Stephens, P.W. Characterization and Crystal Structure of D-Mannitol Hemihydrate. J. Pharm. Sci. 2004, 93, 2800–2809. [Google Scholar] [CrossRef]
- Bomma, G.; Harika, S.M.; Babu, A.M.; Bakshi, V. Formulation Development and Evaluation of Proniosomal Powder of Candesartan. Anal. Chem. Lett. 2017, 7, 567–577. [Google Scholar] [CrossRef]
- Fässler, C.; Arrigoni, E.; Venema, K.; Hafner, V.; Brouns, F.; Amadò, R. Digestibility of resistant starch containing preparations using two in vitro models. Eur. J. Nutr. 2006, 45, 445–453. [Google Scholar] [CrossRef] [Green Version]
- Maulvi, F.A.; Dalwadi, S.J.; Thakkar, V.T.; Soni, T.G.; Gohel, M.C.; Gandhi, T.R. Improvement of dissolution rate of aceclofenac by solid dispersion technique. Powder Technol. 2011, 207, 47–54. [Google Scholar] [CrossRef]
- Maas, S.G.; Schaldach, G.; Littringer, E.M.; Mescher, A.; Griesser, U.J.; Braun, D.E.; Walzel, P.E.; Urbanetz, N.A. The impact of spray drying outlet temperature on the particle morphology of mannitol. Powder Technol. 2011, 213, 27–35. [Google Scholar] [CrossRef]
- Garnero, C.; Chattah, A.K.; Longhi, M. Supramolecular complexes of maltodextrin and furosemide polymorphs: A new approach for delivery systems. Carbohydr. Polym. 2013, 94, 292–300. [Google Scholar] [CrossRef]
- Barletta, D.; Berry, R.J.; Larsson, S.H.; Lestander, T.A.; Poletto, M.; Ramírez-Gómez, Á. Assessment on bulk solids best practice techniques for flow characterization and storage/handling equipment design for biomass materials of different classes. Fuel Process. Technol. 2015, 138, 540–554. [Google Scholar] [CrossRef] [Green Version]
- Blazek-Welsh, A.I.; Rhodes, D.G. Maltodextrin-based proniosomes. Aaps Pharmsci. 2001, 3, 1. [Google Scholar] [CrossRef]
- Abd-Elbary, A.; El-laithy, H.M.; Tadros, M.I. Sucrose stearate-based proniosome-derived niosomes for the nebulisable delivery of cromolyn sodium. Int. J. Pharm. 2008, 357, 189–198. [Google Scholar] [CrossRef]
- Attia, I.A.; El-Gizawy, S.A.; Fouda, M.A.; Donia, A.M. Influence of a niosomal formulation on the oral bioavailability of acyclovir in rabbits. AAPS PharmSciTech 2007, 8, 206–212. [Google Scholar] [CrossRef] [Green Version]
- Yuksel, N.; Bayindir, Z.S.; Aksakal, E.; Ozcelikay, A.T. In situ niosome forming maltodextrin proniosomes of candesartan cilexetil: In vitro and in vivo evaluations. Int. J. Biol. Macromol. 2016, 82, 453–463. [Google Scholar] [CrossRef]
- Gupta, A.; Prajapati, S.K.; Singh, M.; Balamurugan, M. Proniosomal Powder of Captopril: Formulation and Evaluation. Mol. Pharm. 2007, 4, 596–599. [Google Scholar] [CrossRef]
- Ruckmani, K.; Sankar, V. Formulation and Optimization of Zidovudine Niosomes. AAPS PharmSciTech 2010, 11, 1119–1127. [Google Scholar] [CrossRef] [Green Version]
- Bhandari, N.; Verma, P.; Sing, H. Proniosomes: A surrogate for Transdermal drug delivery. Int. J. Pharm. Res. Biol. Sci. 2012, 1, 10–26. [Google Scholar]
- El Maghraby, G.M.; Ahmed, A.A.; Osman, M.A. Penetration enhancers in proniosomes as a new strategy for enhanced transdermal drug delivery. Saudi Pharm. J. SPJ Off. Publ. Saudi Pharm. Soc. 2015, 23, 67–74. [Google Scholar] [CrossRef]
- Mokhtar, M.; Sammour, O.A.; Hammad, M.A.; Megrab, N.A. Effect of some formulation parameters on flurbiprofen encapsulation and release rates of niosomes prepared from proniosomes. Int. J. Pharm. 2008, 361, 104–111. [Google Scholar] [CrossRef]
- Debnath, A.; Kumar, A. Structural and functional significance of niosome and proniosome in drug delivery system. Int. J. Pharm. Eng. 2015, 3, 621–637. [Google Scholar]
- Kakar, R.; Rao, R.; Goswami, A.; Nanda, S.; Saroha, K. Proniosomes: An emerging vesicular system in drug delivery and cosmetics. Pharm. Lett. 2010, 2, 227–239. [Google Scholar]
- Nasr, M. In Vitro and In Vivo Evaluation of Proniosomes Containing Celecoxib for Oral Administration. AAPS PharmSciTech 2010, 11, 85–89. [Google Scholar] [CrossRef] [Green Version]
- Ge, X.; Wei, M.; He, S.; Yuan, W.-E. Advances of Non-Ionic Surfactant Vesicles (Niosomes) and Their Application in Drug Delivery. Pharmaceutics 2019, 11, 55. [Google Scholar] [CrossRef]


| Factor | Level | Response | ||
|---|---|---|---|---|
| −1 | 0 | 1 | ||
| The volume of hydration (mL) | 10 | 15 | 20 | Entrapment Efficiency |
| Time for hydration (min) | 5 | 30 | 60 | |
| Formulation Code | Bulk Density (g/mL) | Tapped Density (g/mL) | Carr’s Index | Hausner’s Ratio | Type of Powder |
|---|---|---|---|---|---|
| FN 1 | 0.36 ± 0.01 | 0.43 ± 0.01 | 16.6 ± 0 | 1.2 ± 0 | Good Flowable |
| FN 2 | 0.22 ± 0.04 | 0.28 ± 0.05 | 19.4 ± 1.3 | 1.24 ± 0.02 | Fairly Flowable |
| FN 3 | 0.27 ± 0.02 | 0.38 ± 0.01 | 21.7 ± 2.5 | 1.31 ± 0.04 | Fairly Flowable |
| Std Order | Formulas | The Volume of Hydrating Medium | Time for Hydration | %Entrapment Efficiency |
|---|---|---|---|---|
| 1 | FM 1 | 10 mL | 5 min | 84 ± 0.66 |
| 2 | FM 2 | 10 mL | 30 min | 84 ± 0.75 |
| 3 | FM 3 | 10 mL | 60 min | 82 ± 0.28 |
| 4 | FM 4 | 15 mL | 5 min | 82 ± 0.29 |
| 5 | FM 5 | 15 mL | 30 min | 78 ± 0.66 |
| 6 | FM 6 | 15 mL | 60 min | 74 ± 0.74 |
| 7 | FM 7 | 20 mL | 5 min | 81 ± 0.94 |
| 8 | FM 8 | 20 mL | 30 min | 78 ± 0.61 |
| 9 | FM 9 | 20 mL | 60 min | 73 ± 0.31 |
| Formulation Code | %EE ± Standard Deviation (SD) | Z-Average ± SD (d.nm) | Pdl | Zeta Potential ± SD (mV) | % of Drug Content ± SD |
|---|---|---|---|---|---|
| FN 1 | 82 ± 0.5 | 5240 ±128 | 0.58 | −46.3 ± 5.96 | 101 ± 0.65 |
| FN 2 | 84 ± 0.66 | 4669 ± 20 | 0.7 | −45.2 ± 5.14 | 98 ± 4 |
| FN 3 | 84 ± 0.34 | 6403 ±25 | 1 | −48.5 ± 5.06 | 96 ± 8 |
© 2019 by the authors. Licensee MDPI, Basel, Switzerland. This article is an open access article distributed under the terms and conditions of the Creative Commons Attribution (CC BY) license (http://creativecommons.org/licenses/by/4.0/).
Share and Cite
Sammour, R.M.F.; Taher, M.; Chatterjee, B.; Shahiwala, A.; Mahmood, S. Optimization of Aceclofenac Proniosomes by Using Different Carriers, Part 1: Development and Characterization. Pharmaceutics 2019, 11, 350. https://doi.org/10.3390/pharmaceutics11070350
Sammour RMF, Taher M, Chatterjee B, Shahiwala A, Mahmood S. Optimization of Aceclofenac Proniosomes by Using Different Carriers, Part 1: Development and Characterization. Pharmaceutics. 2019; 11(7):350. https://doi.org/10.3390/pharmaceutics11070350
Chicago/Turabian StyleSammour, Rana M.F., Muhammad Taher, Bappaditya Chatterjee, Aliasgar Shahiwala, and Syed Mahmood. 2019. "Optimization of Aceclofenac Proniosomes by Using Different Carriers, Part 1: Development and Characterization" Pharmaceutics 11, no. 7: 350. https://doi.org/10.3390/pharmaceutics11070350