Comparison of Oral, Intranasal and Aerosol Administration of Amiodarone in Rats as a Model of Pulmonary Phospholipidosis

 , ,
, ,
Abstract
:
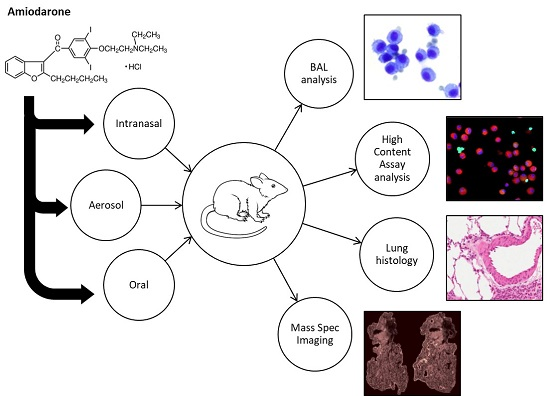
1. Introduction
2. Materials and Methods
2.1. Materials
2.2. Amiodarone Characterisation
2.2.1. Aerodynamic Particle Sizer
2.2.2. Chemical Analysis of Amiodarone and Target Dose
2.3. Animals
2.4. Dosing of Amiodarone
2.4.1. Intranasal Administration of Amiodarone
2.4.2. Aerosol Administration of Amiodarone (Dosing Protocol One)
2.4.3. Aerosol Administration of Amiodarone (Dosing Protocol Two)
2.4.4. Oral Administration of Amiodarone
2.5. Differential Cell Counts of BAL Cellular Fraction
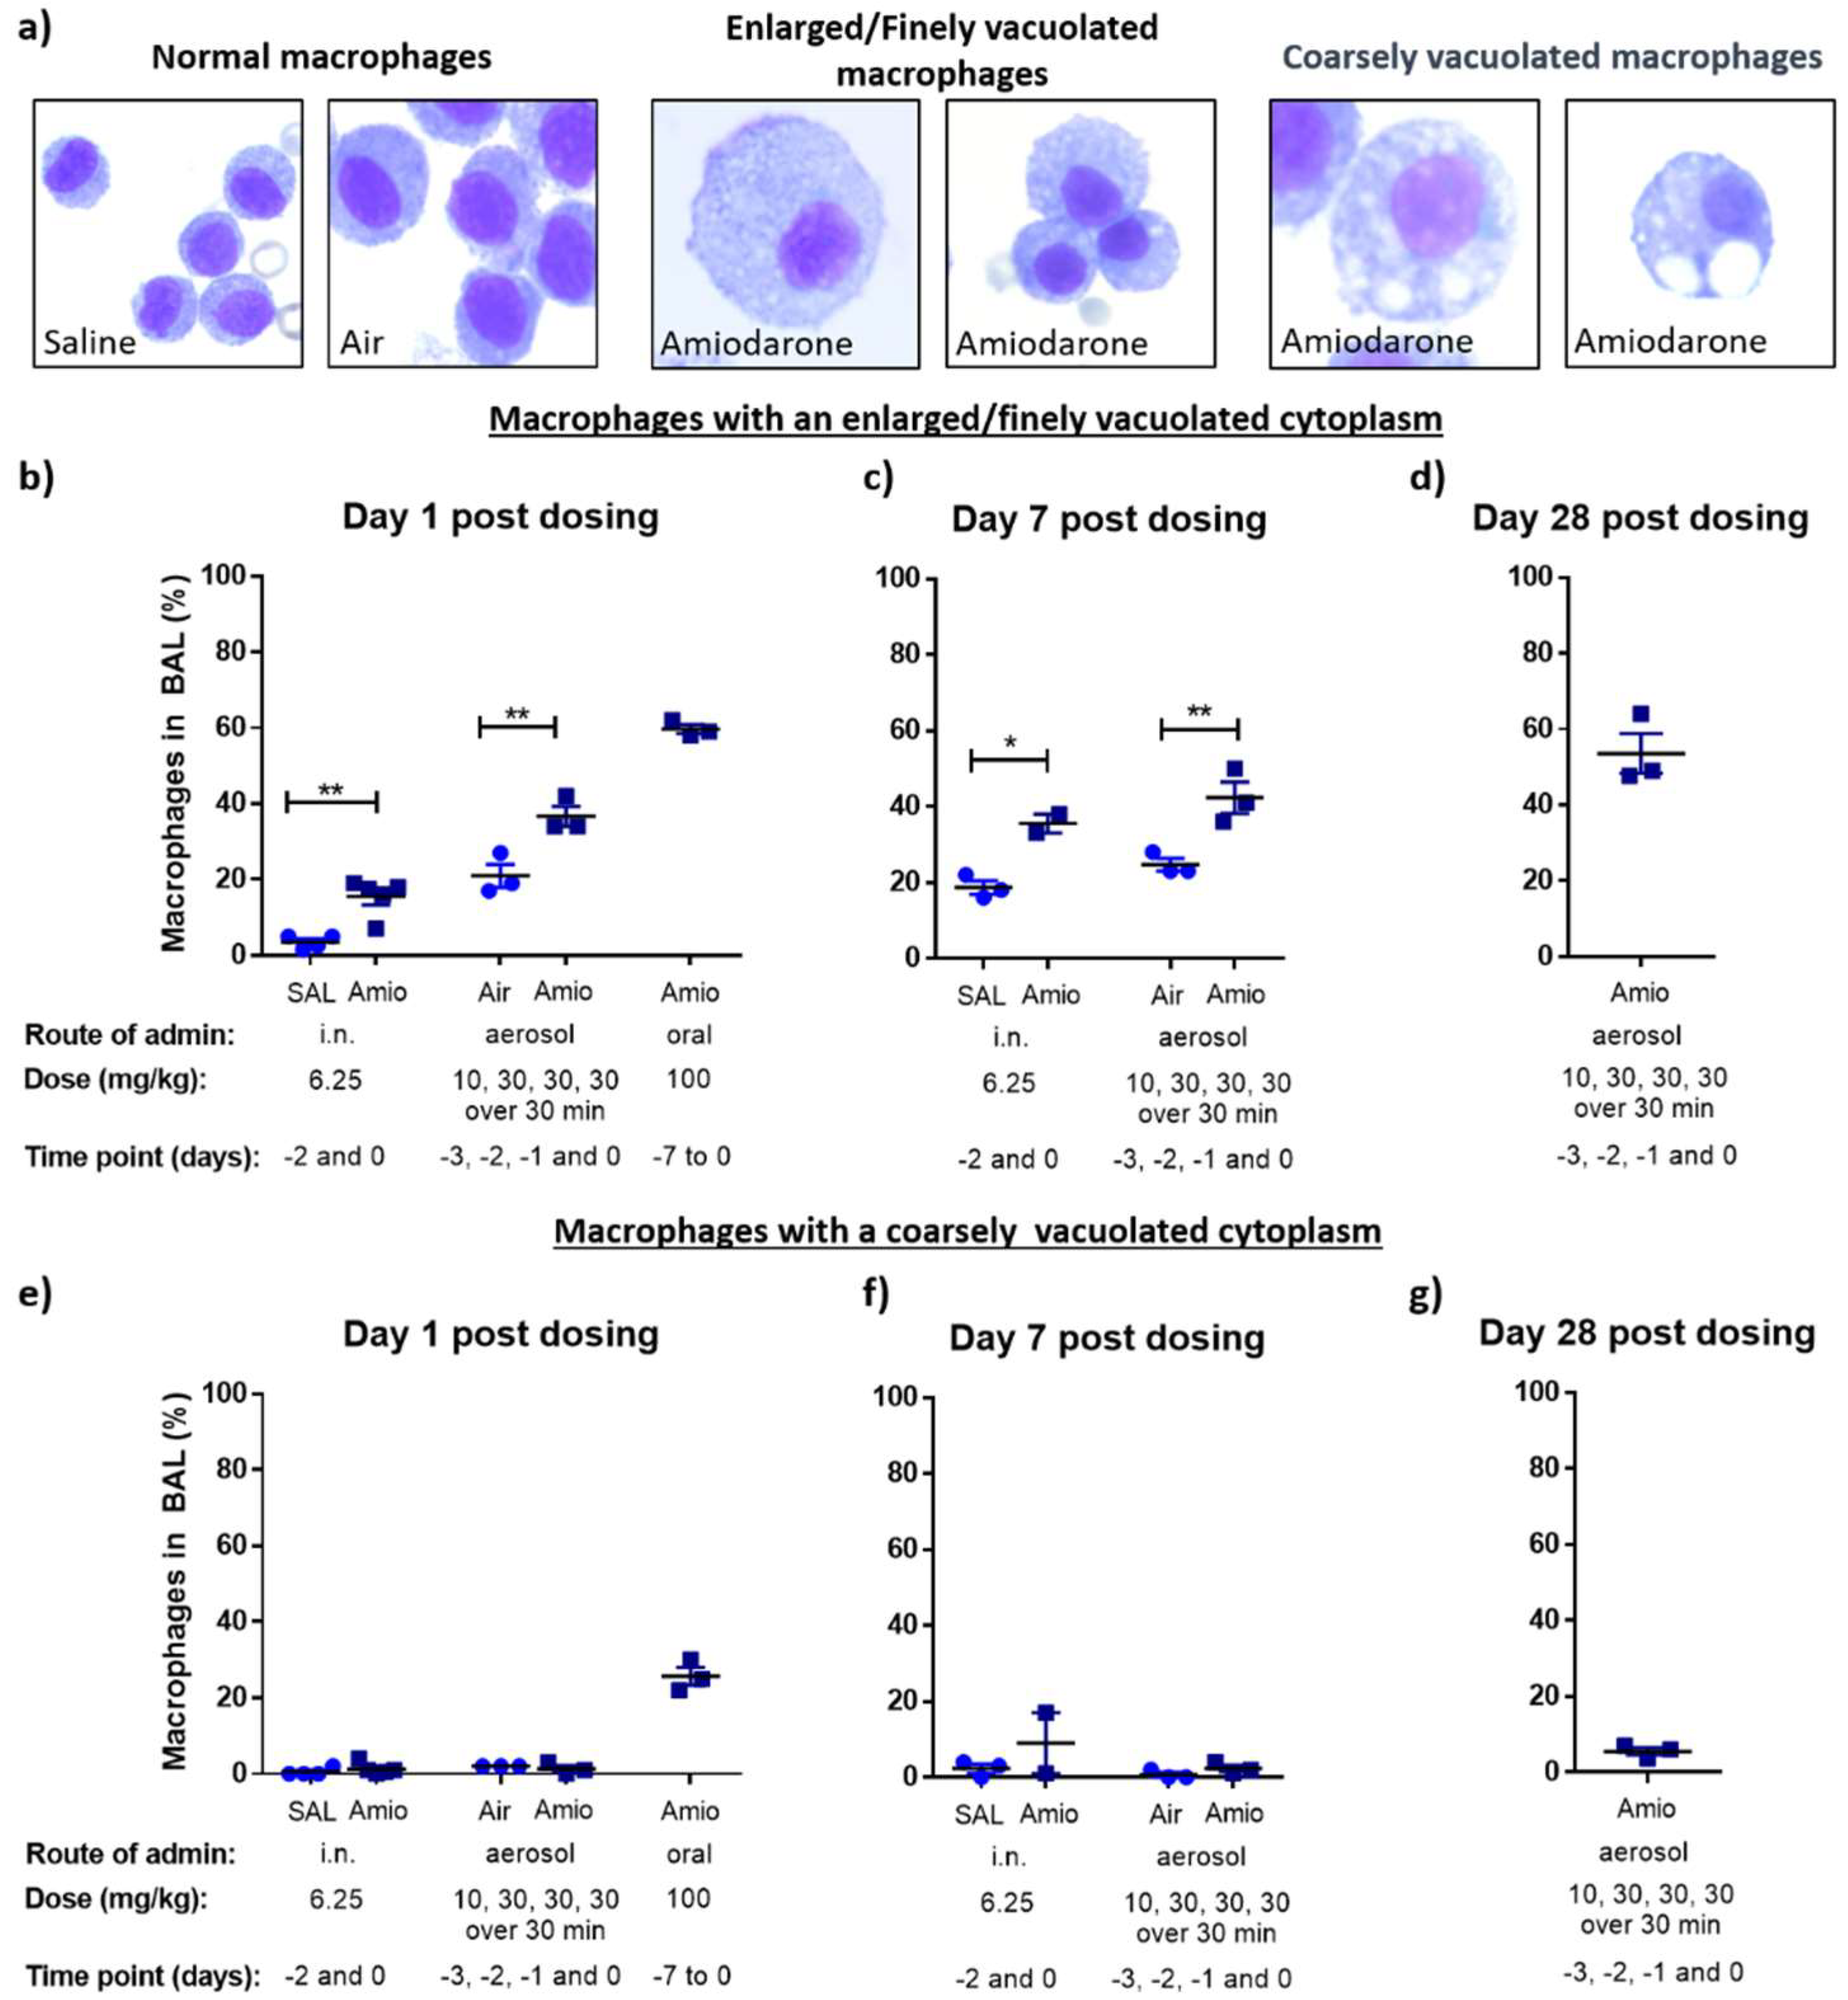
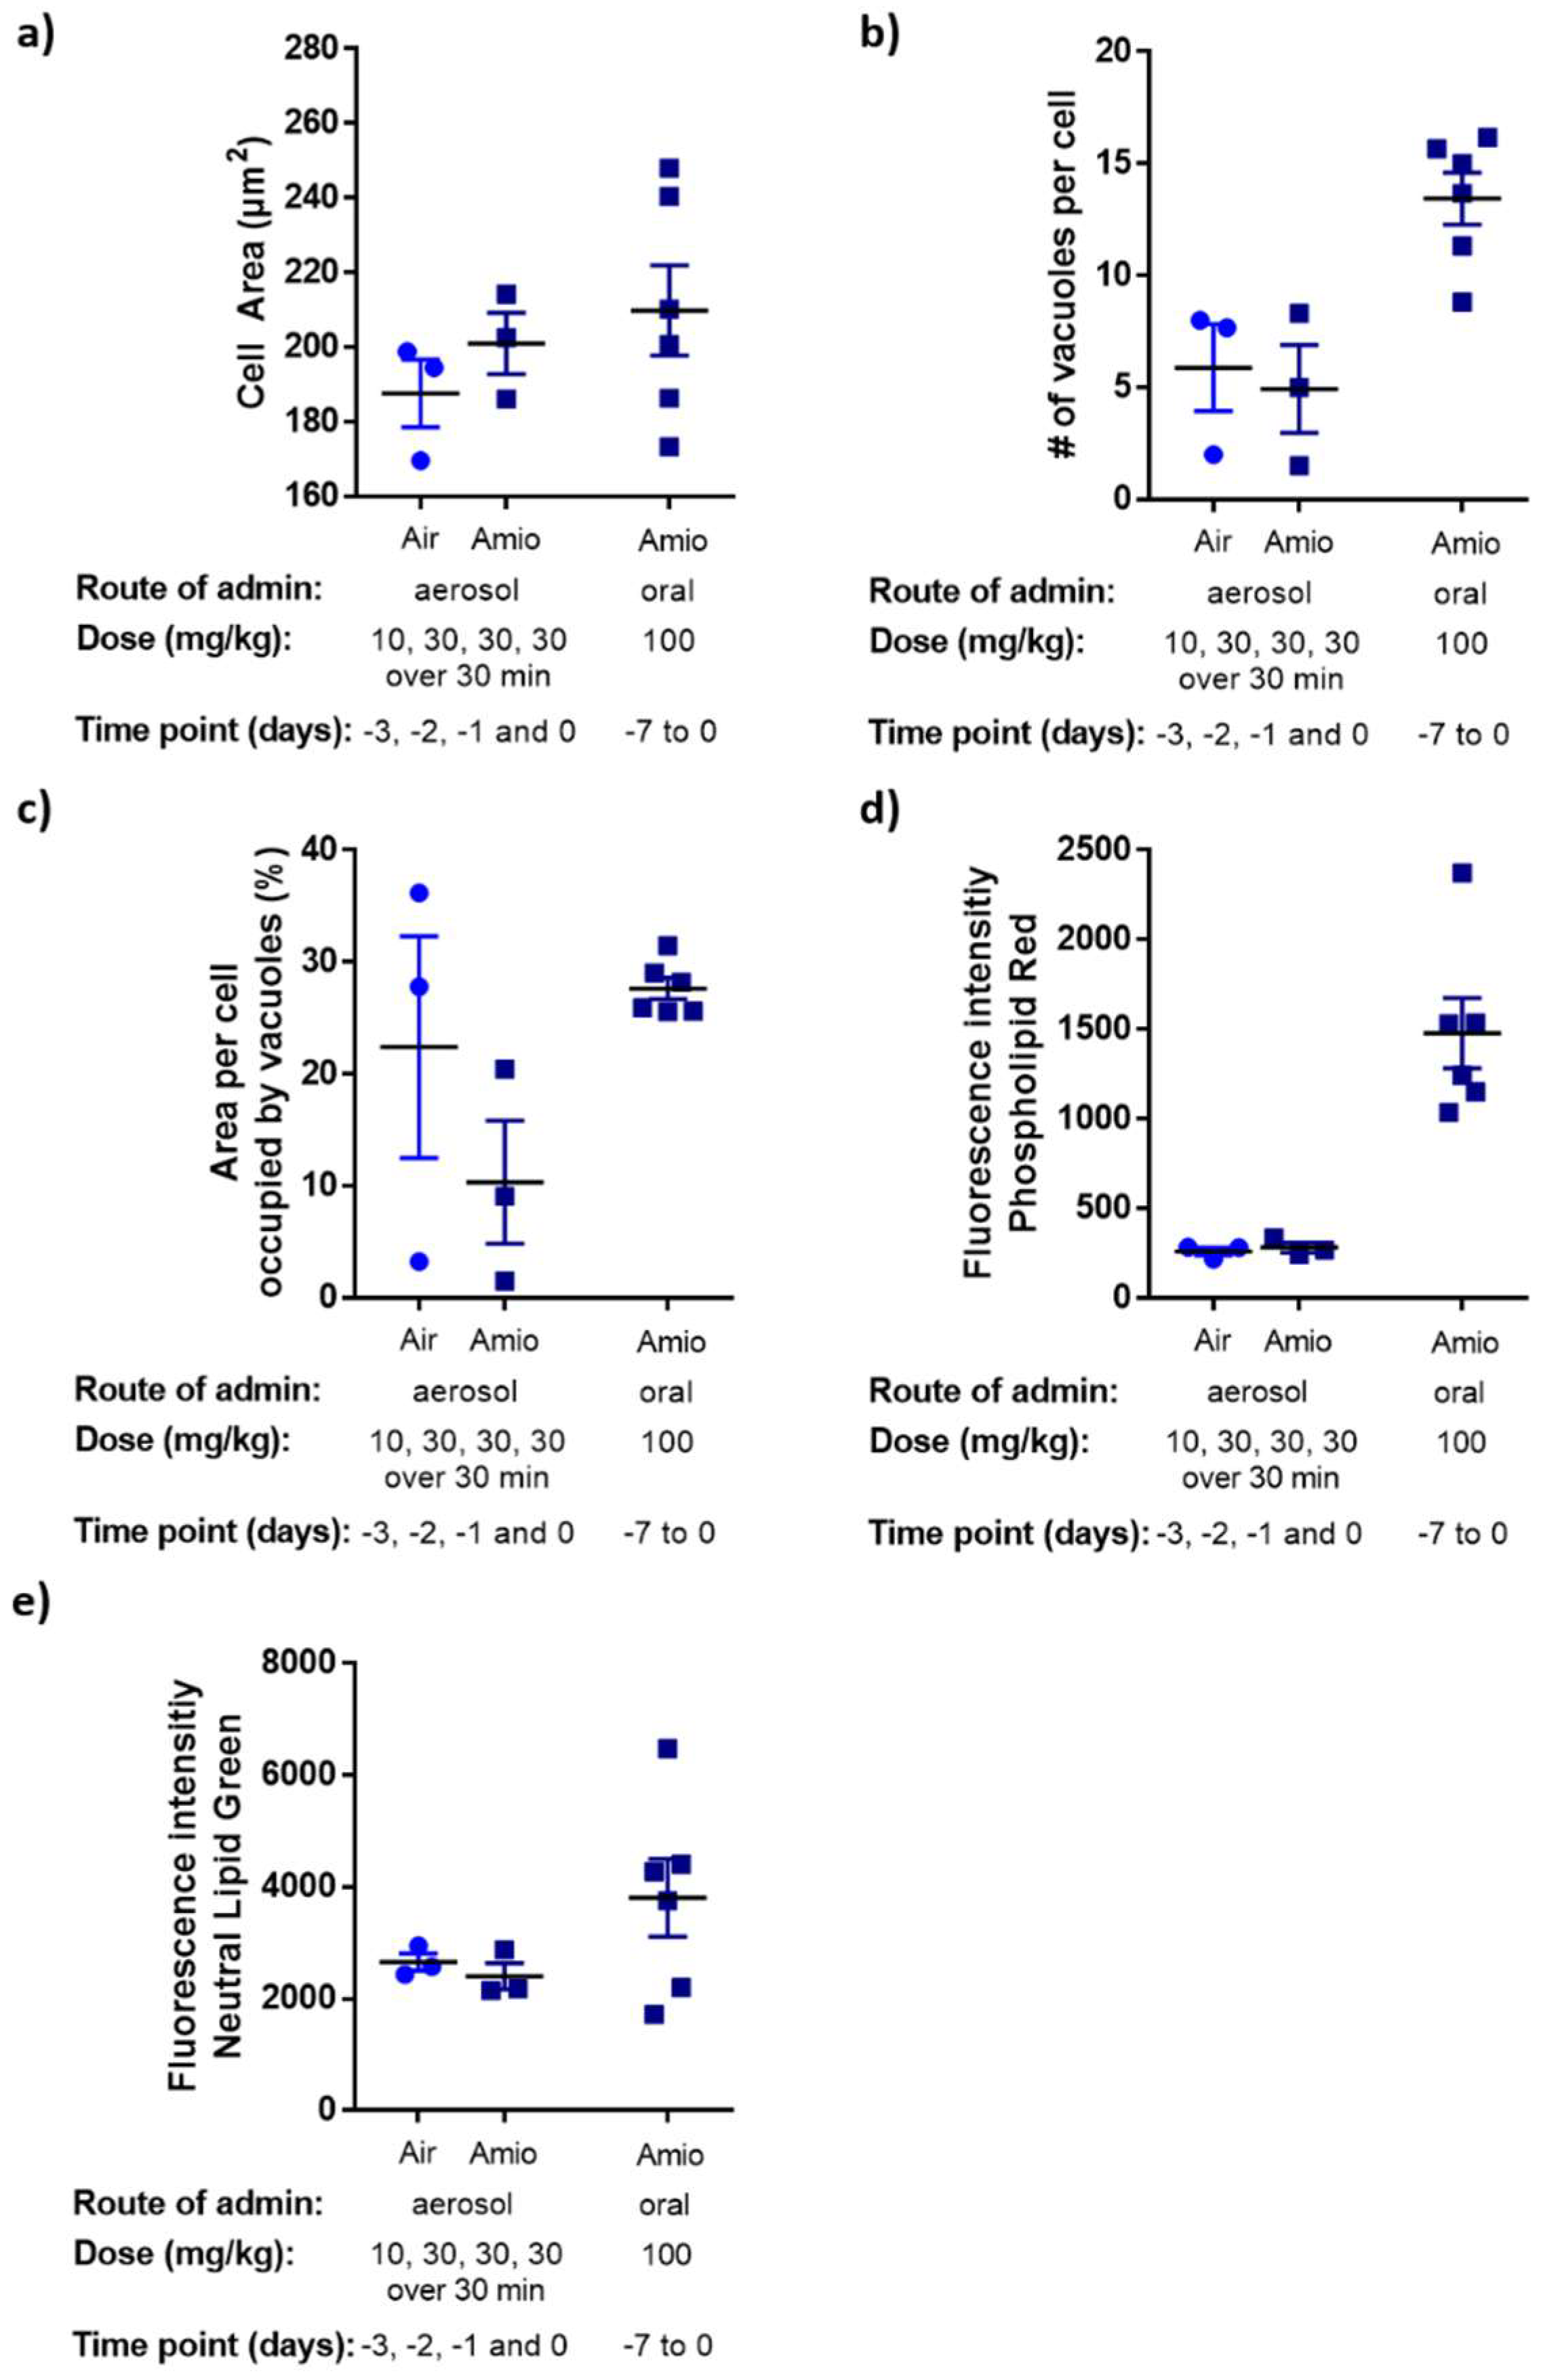
2.6. High Content Analysis of BAL Macrophages
2.7. Lung Histology
2.8. Mass Spectrometry Imaging and Analysis
2.9. Statistics
3. Results
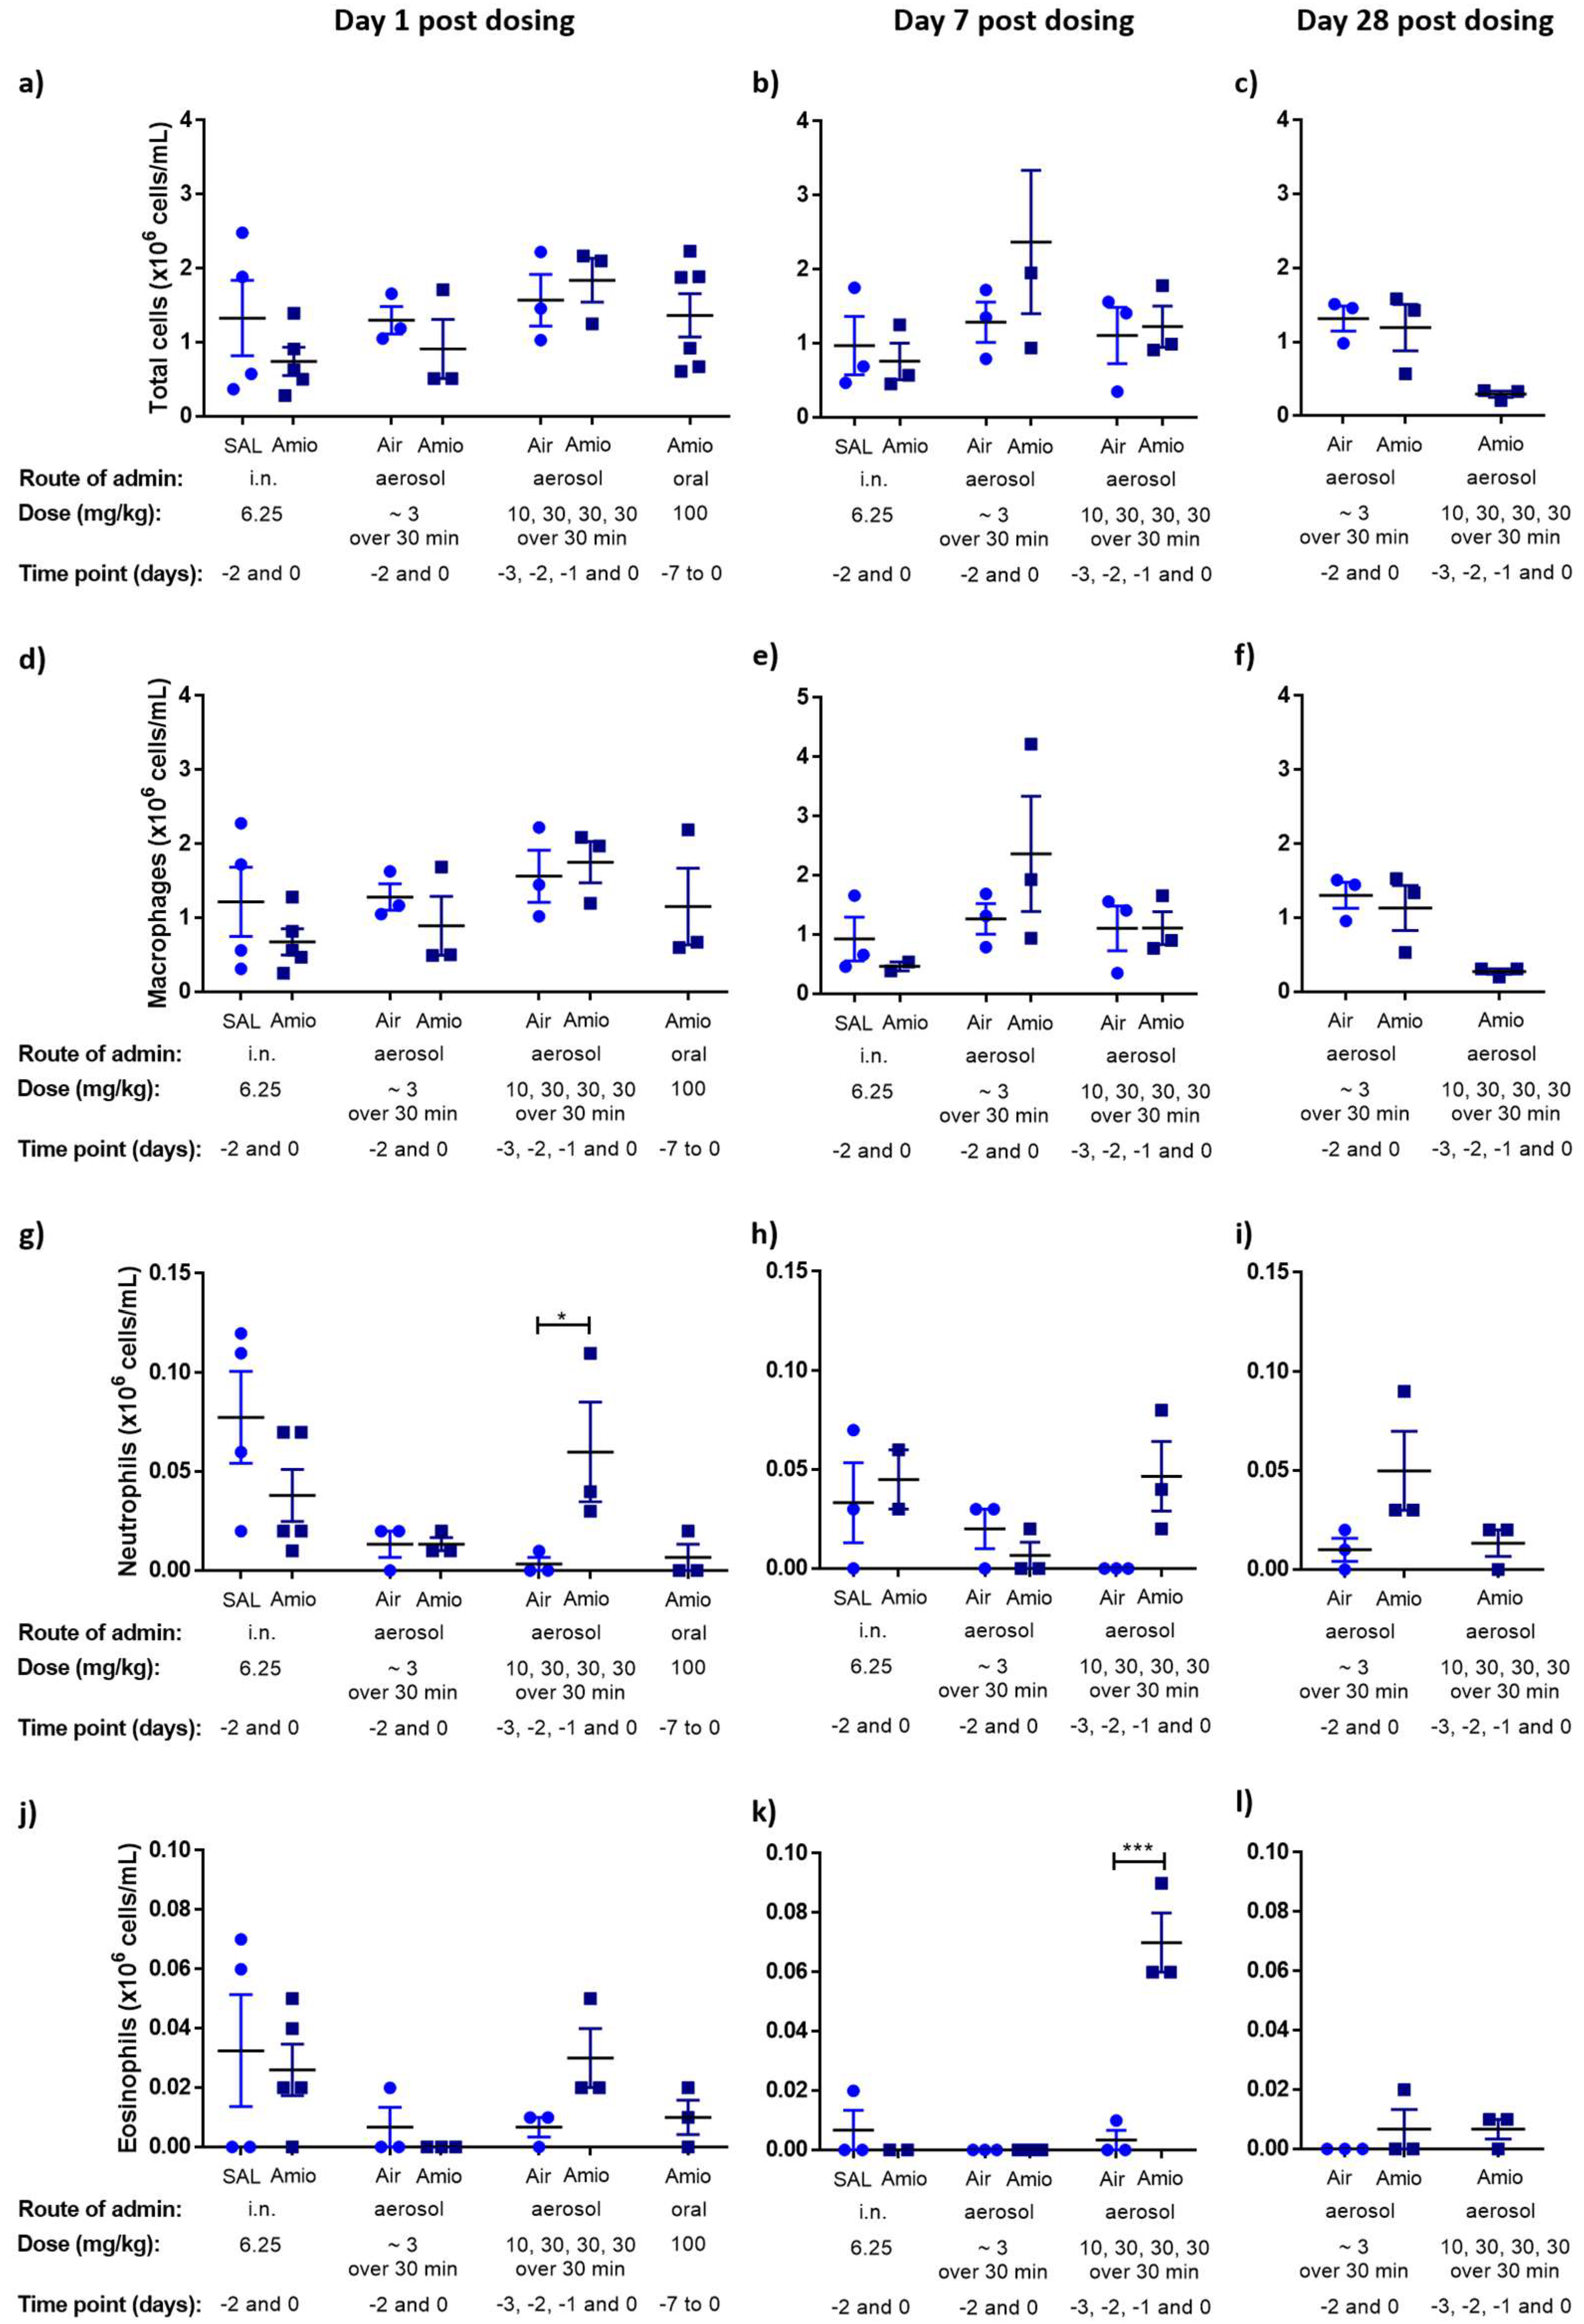
3.1. Assessment of Inflammation and Phospholipidosis Markers in the BAL Cellular Fraction
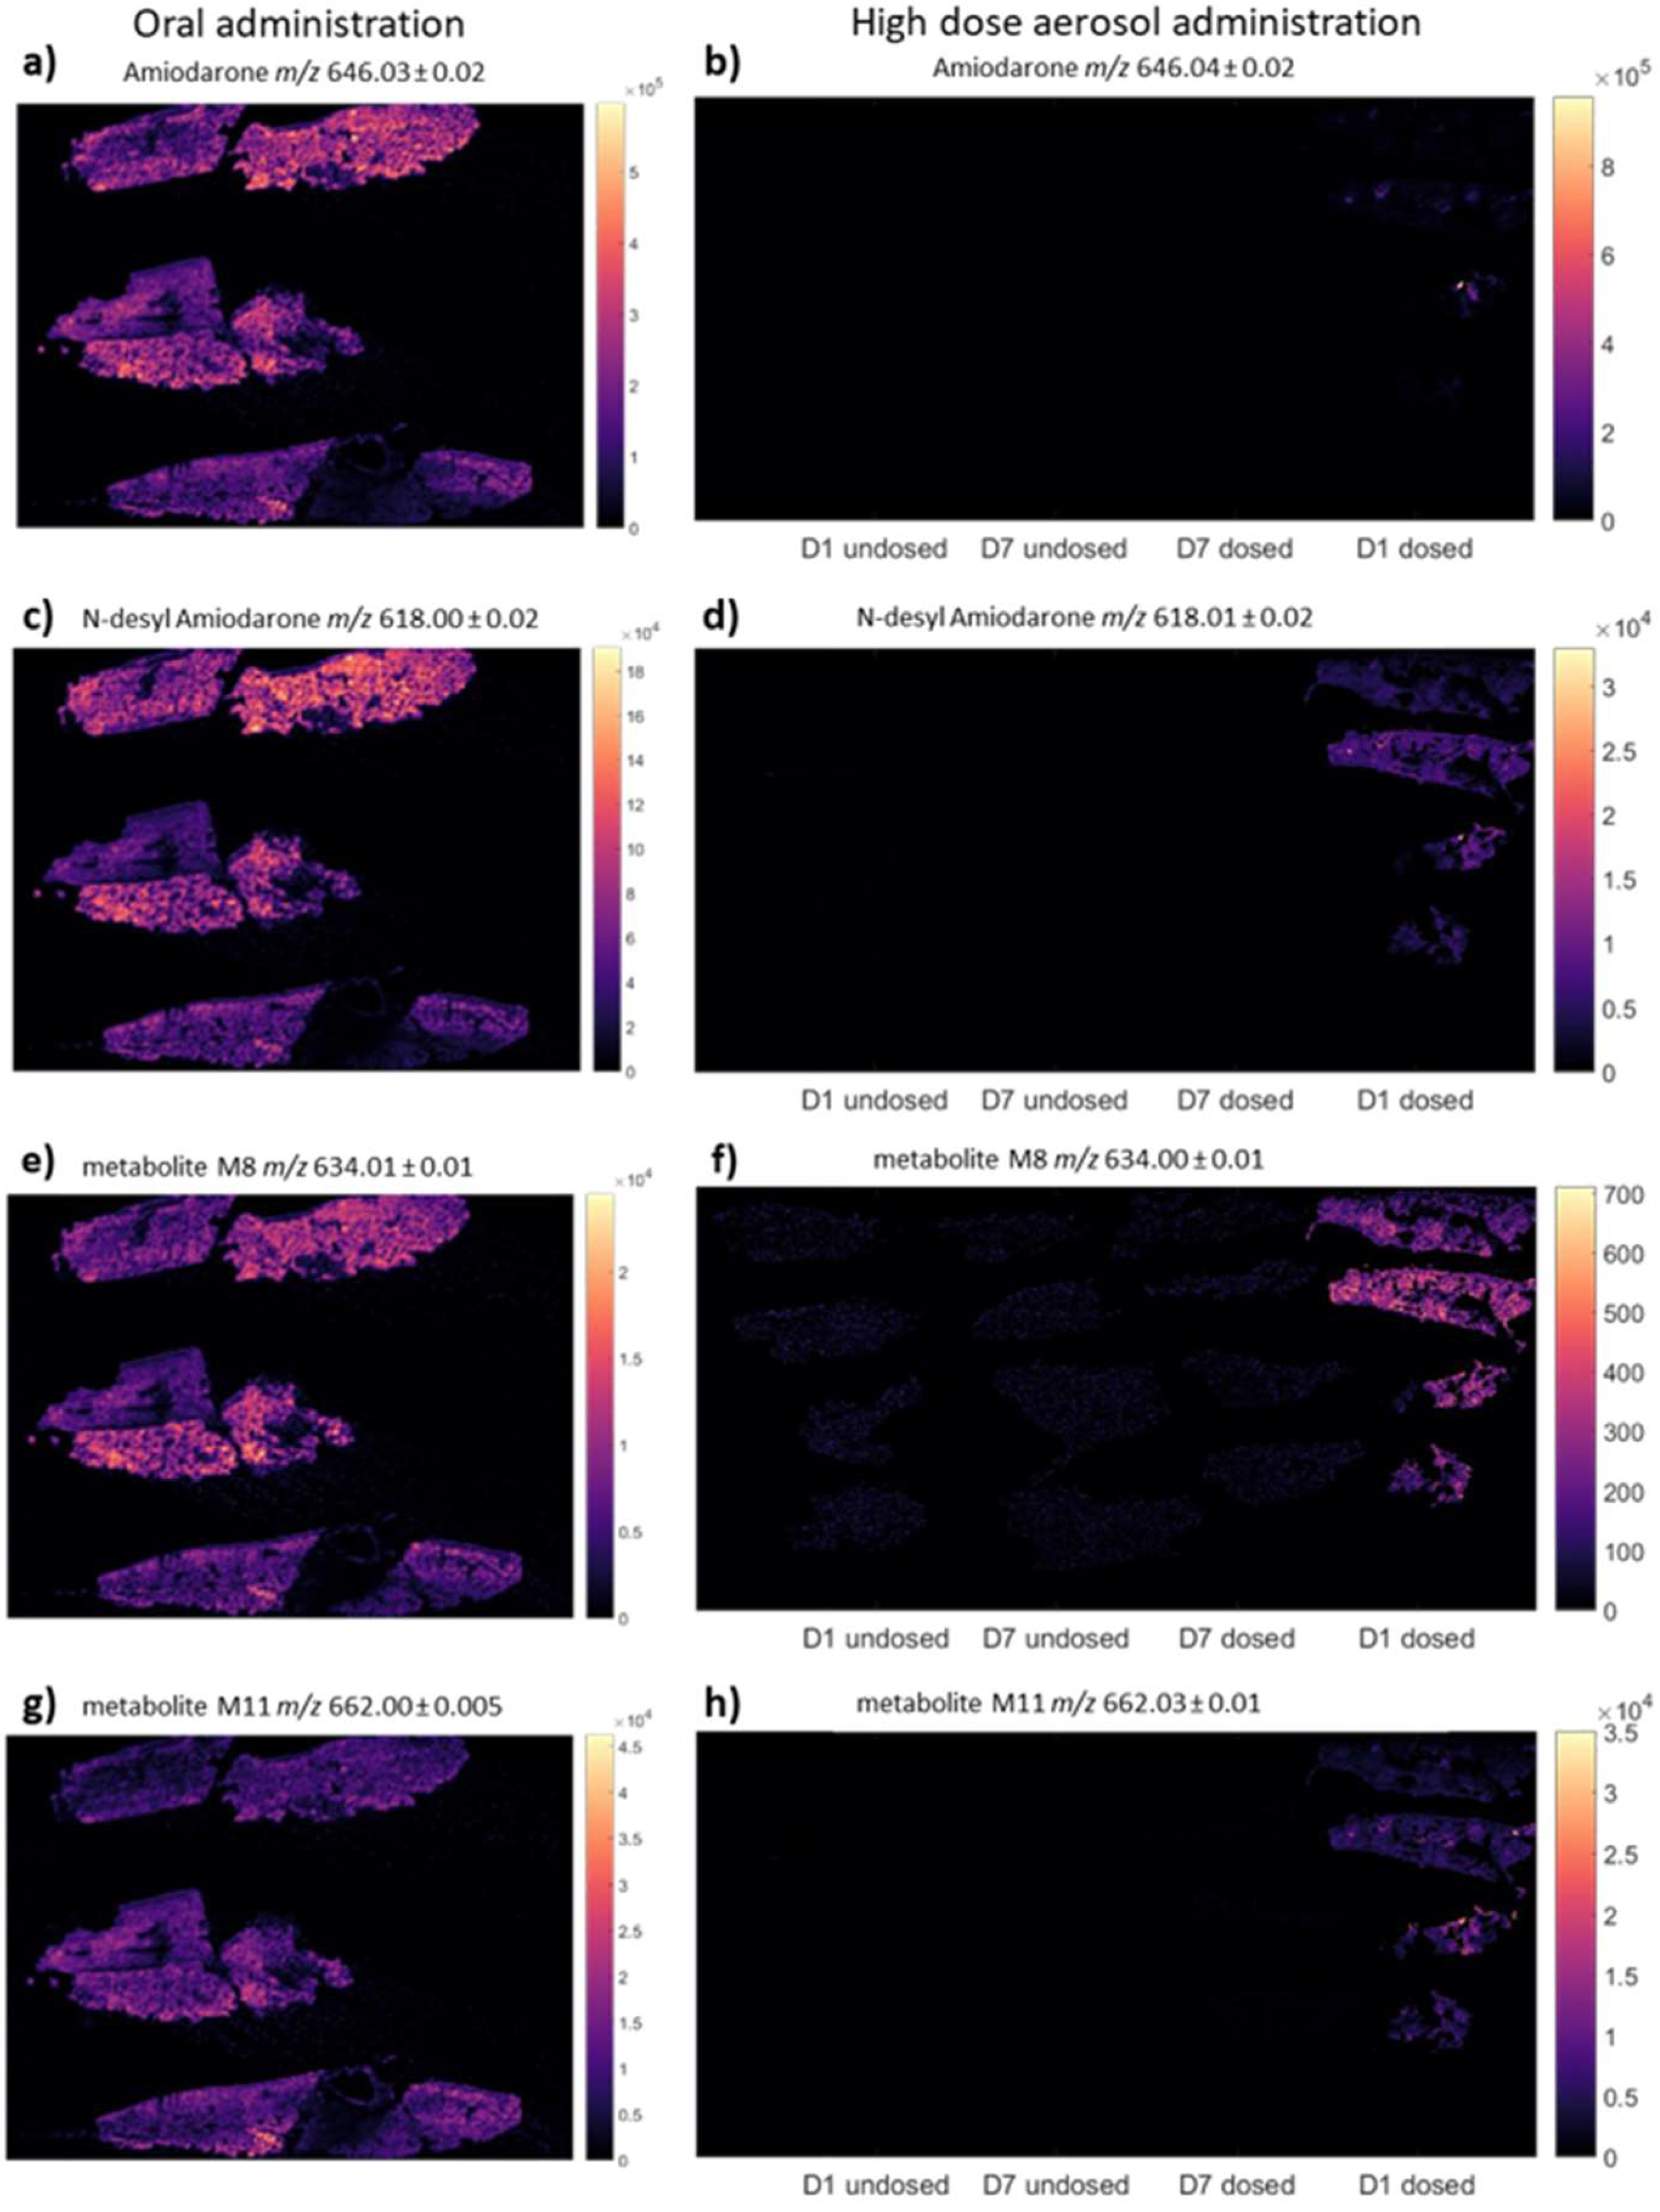
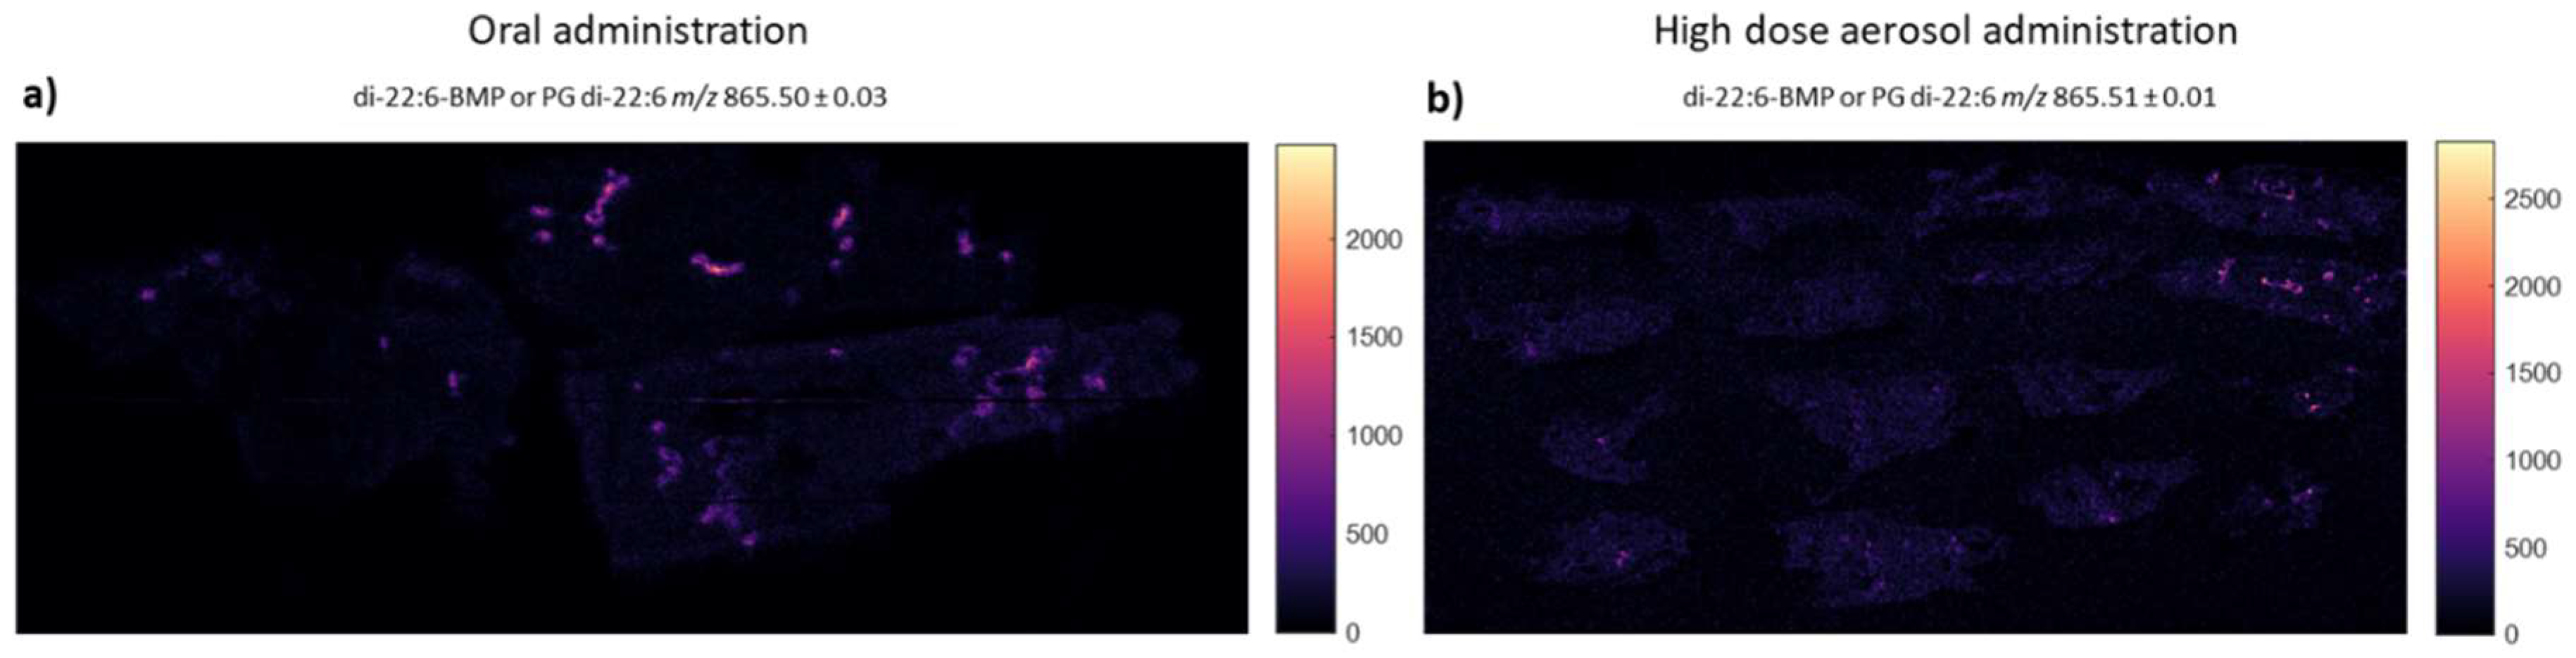
3.2. Assessment of Inflammation and Phospholipidosis Markers in Lung Tissue
4. Discussion
5. Conclusions
Supplementary Materials
Author Contributions
Funding
Acknowledgments
Conflicts of Interest
References
- Hickey, A.J. Back to the Future: Inhaled Drug Products. J. Pharm. Sci. 2013, 102, 1165–1172. [Google Scholar] [CrossRef] [PubMed]
- Forbes, B.; O’Lone, R.; Allen, P.P.; Cahn, A.; Clarke, C.; Collinge, M.; Dailey, L.A.; Donnelly, L.E.; Dybowski, J.; Hassall, D.; et al. Challenges for inhaled drug discovery and development: Induced alveolar macrophage responses. Adv. Drug Deliv. Rev. 2014, 71, 15–33. [Google Scholar] [CrossRef] [PubMed] [Green Version]
- Nikula, K.J.; McCartney, J.E.; McGovern, T.; Miller, G.K.; Odin, M.; Pino, M.V.; Reed, M.D. STP position paper: Interpreting the significance of increased alveolar macrophages in rodents following inhalation of pharmaceutical materials. Toxicol. Pathol. 2014, 42, 472–486. [Google Scholar] [CrossRef] [PubMed]
- Hoffman, E.; Kumar, A.; Kanabar, V.; Arno, M.; Preux, L.; Millar, V.; Page, C.; Collins, H.; Mudway, I.; Dailey, L.A.; et al. In Vitro Multiparamater Assay Development Strategy toward Differentiating Macrophage Responses to Inhaled Medicines. Mol. Pharm. 2015, 12, 2675–2678. [Google Scholar] [CrossRef] [PubMed]
- Jones, R.M.; Neef, N. Interpretation and prediction of inhaled drug particle accumulation in the lung and its associated toxicity. Xenobiotica 2012, 42, 86–93. [Google Scholar] [CrossRef] [PubMed]
- Reasor, M.J.; Ogle, C.L.; Walker, E.R.; Kacew, S. Amiodarone-induced phospholipidosis in rat alveolar macrophages. Am. Rev. Respir. Dis. 1988, 137, 510–518. [Google Scholar] [CrossRef] [PubMed]
- Wilson, B.D.; Clarkson, C.E.; Lippmann, M.L. Amiodarone-induced pulmonary inflammation. Correlation with drug dose and lung levels of drug, metabolite, and phospholipid. Am. Rev. Respir. Dis. 1991, 143, 1110–1114. [Google Scholar] [CrossRef]
- Papiris, S.A.; Triantafillidou, C.; Kolilekas, L.; Markoulaki, D.; Manali, E.D. Amiodarone. Drug Saf. 2010, 33, 539–558. [Google Scholar] [CrossRef]
- Camus, P.; Mehendale, H.M. Pulmonary sequestration of amiodarone and desethylamiodarone. J. Pharmacol. Exp. Ther. 1986, 237, 867–873. [Google Scholar]
- Ernawati, D.K.; Stafford, L.; Hughes, J.D. Amiodarone-induced pulmonary toxicity. Br. J. Clin. Pharmacol. 2008, 66, 82–87. [Google Scholar] [CrossRef] [Green Version]
- Wolkove, N.; Baltzan, M. Amiodarone pulmonary toxicity. Can. Respir. J. 2009, 25, 43–48. [Google Scholar] [CrossRef] [PubMed]
- Blake, T.L.; Reasor, M.J. Pulmonary responses to amiodarone in hamsters: Comparison of intratracheal and oral administrations. Toxicol. Appl. Pharmacol. 1995, 131, 325–331. [Google Scholar] [CrossRef] [PubMed]
- Reasor, M.J.; Kacew, S. An evaluation of possible mechanisms underlying amiodarone-induced pulmonary toxicity. Proc. Soc. Exp. Biol. Med. 1996, 212, 297–304. [Google Scholar] [CrossRef] [PubMed]
- Mazue, G.; Vic, P.; Gouy, D.; Remandet, B.; Lacheretz, F.; Berthe, J.; Barchewttz, G.; Gagnol, J.P. Recovery from amiodarone-induced lipidosis in laboratory animals: A toxicological study. Toxicol. Sci. 1984, 4, 992–999. [Google Scholar] [CrossRef]
- Wilson, B.D.; Lippmann, M.L. Pulmonary accumulation of amiodarone and N-desethylamiodarone. Relationship to the development of pulmonary toxicity. Am. Rev. Respir. Dis. 1990, 141, 1553–1558. [Google Scholar] [CrossRef] [PubMed]
- Nagata, N.; Suematsu, R.; Yoshii, C.; Miyazaki, H.; Sueishi, K.; Kido, M. Characterization of amiodarone pneumonitis as related to inflammatory cells and surfactant apoprotein. Chest 1997, 112, 1068–1074. [Google Scholar] [CrossRef]
- Riva, E.; Marchi, S.; Pesenti, A.; Bizzi, A.; Cini, M.; Veneroni, E.; Tavbani, E.; Boeri, R.; Bertani, T.; Latini, R. Amiodarone induced phospholipidosis. Biochemical, morphological and functional changes in the lungs of rats chronically treated with amiodarone. Biochem. Pharmacol. 1987, 36, 3209–3214. [Google Scholar] [CrossRef]
- Taylor, M.D.; Van Dyke, K.; Bowman, L.L.; Miles, P.R.; Hubbs, A.F.; Mason, R.J.; Shannon, K.; Reasor, M.J. A characterization of amiodarone-induced pulmonary toxicity in F344 rats and identification of surfactant protein-D as a potential biomarker for the development of the toxicity. Toxicol. Appl. Pharmacol. 2000, 167, 182–190. [Google Scholar] [CrossRef]
- Lee, K.-Y.; Oh, S.; Choi, Y.-J.; Oh, S.-H.; Yang, Y.-S.; Yang, M.-J.; Lee, K.; Lee, B.-H. Activation of Autophagy Rescues Amiodarone-Induced Apoptosis of Lung Epithelial Cells and Pulmonary Toxicity in Rats. Toxicol. Sci. 2013, 136, 193–204. [Google Scholar] [CrossRef] [Green Version]
- Chung, W.H.; Bennett, B.M.; Racz, W.J.; Brien, J.F.; Massey, T.E. Induction of c-jun and TGF-beta 1 in Fischer 344 rats during amiodarone-induced pulmonary fibrosis. Am. J. Physiol. Lung Cell. Mol. Physiol. 2001, 281, L1180–L1188. [Google Scholar] [CrossRef]
- Card, J.W.; Racz, W.J.; Brien, J.F.; Margolin, S.B.; Massey, T.E. Differential effects of pirfenidone on acute pulmonary injury and ensuing fibrosis in the hamster model of amiodarone-induced pulmonary toxicity. Toxico. Sci. 2003, 75, 169–180. [Google Scholar] [CrossRef] [PubMed]
- Alexander, D.J.; Collins, C.J.; Coombs, D.W.; Gilkison, I.S.; Hardy, C.J.; Healey, G.; Karantabias, G.; Johnson, N.; Karlsson, A.; Kilgour, J.D.; et al. Association of Inhalation Toxicologists (AIT) Working Party Recommendation for Standard Delivered Dose Calculation and Expression in Non-Clinical Aerosol Inhalation Toxicology Studies with Pharmaceuticals. Inhal. Toxicol. 2008, 20, 1179–1189. [Google Scholar] [CrossRef] [PubMed]
- Kuronuma, K.; Mitsuzawa, H.; Takeda, K.; Nishitani, C.; Chan, E.D.; Kuroki, Y.; Nakamura, M.; Voelker, D.R. Anionic pulmonary surfactant phospholipids inhibit inflammatory responses from alveolar macrophages and U937 cells by binding the lipopolysaccharide-interacting proteins CD14 and MD-2. J. Biol. Chem. 2009, 284, 25488–25500. [Google Scholar] [CrossRef] [PubMed]
- Hoffman, E.; Patel, A.; Ball, D.; Klapwijk, J.; Millar, V.; Kumar, A.; Martin, A.; Mahendran, R.; Dailey, L.A.; Forbes, B.; et al. Morphometric Characterization of Rat and Human Alveolar Macrophage Cell Models and their Response to Amiodarone using High Content Image Analysis. Pharm. Res. 2017, 34, 2466–2476. [Google Scholar] [CrossRef] [PubMed] [Green Version]
- Gurdak, E.; Green, F.M.; Rakowska, P.D.; Seah, M.P.; Salter, T.L.; Gilmore, I.S. VAMAS interlaboratory study for desorption electrospray ionization mass spectrometry (DESI MS) intensity repeatability and constancy. Anal. Chem. 2014, 86, 9603–9611. [Google Scholar] [CrossRef] [PubMed]
- Kessner, D.; Chambers, M.; Burke, R.; Agus, D.; Mallick, P. ProteoWizard: Open source software for rapid proteomics tools development. Bioinformatics 2008, 24, 2534–2536. [Google Scholar] [CrossRef] [PubMed]
- Race, A.M.; Styles, I.B.; Bunch, J. Inclusive sharing of mass spectrometry imaging data requires a converter for all. J. Proteomics 2012, 75, 5111–5112. [Google Scholar] [CrossRef]
- Race, A.M.; Palmer, A.D.; Dexter, A.; Steven, R.T.; Styles, I.B.; Bunch, J. SpectralAnalysis: Software for the Masses. Anal. Chem. 2016, 88, 9451–9458. [Google Scholar] [CrossRef]
- Song, J.-A.; Yang, H.; Lee, J.-S.; Kwon, S.; Jung, K.-J.; Heo, J.; Cho, K.; Song, C.-W.; Lee, K. Standardization of Bronchoalveolar Lavage Method Based on Suction Frequency Number and Lavage Fraction Number Using Rats. Toxicol. Res. 2010, 26, 203–208. [Google Scholar] [CrossRef] [Green Version]
- Laloy, J.; Lozano, O.; Alpan, L.; Masereel, B.; Toussaint, O.; Dogné, J.M.; Lucas, S. Limited inflammatory response in rats after acute exposure to a silicon carbide nanoaerosol. J. Nanoparticle Res. 2015, 17, 346. [Google Scholar] [CrossRef]
- Morissette, G.; Ammoury, A.; Rusu, D.; Marguery, M.C.; Lodge, R.; Poubelle, P.E.; Marceau, F. Intracellular sequestration of amiodarone: Role of vacuolar ATPase and macroautophagic transition of the resulting vacuolar cytopathology. Br. J. Pharmacol. 2009, 157, 1531–1540. [Google Scholar] [CrossRef] [PubMed]
- Quaglino, D.; Ha, H.R.; Duner, E.; Bruttomesso, D.; Bigler, L.; Follath, F.; Realdi, G.; Pettenazzo, A.; Baritussio, A. Effects of metabolites and analogs of amiodarone on alveolar macrophages: Structure-activity relationship. Am. J. Physiol. Lung Cell. Mol. Physiol. 2004, 287, L438–L447. [Google Scholar] [CrossRef] [PubMed]
- Jones, M.-C.; Jones, S.A.; Riffo-Vasquez, Y.; Spina, D.; Hoffman, E.; Morgan, A.; Patel, A.; Page, C.; Forbes, B.; Dailey, L.A. Quantitative assessment of nanoparticle surface hydrophobicity and its influence on pulmonary biocompatibility. J. Control. Release 2014, 183, 94–104. [Google Scholar] [CrossRef] [PubMed]
- Deng, P.; You, T.; Chen, X.; Yuan, T.; Huang, H.; Zhong, D. Identification of amiodarone metabolites in human bile by ultraperformance liquid chromatography/quadrupole time-of-flight mass spectrometry. Drug Metab. Dispos. 2011, 39, 1058–1069. [Google Scholar] [CrossRef] [PubMed]
- Mesens, N.; Desmidt, M.; Verheyen, G.R.; Starckx, S.; Damsch, S.; De Vries, R.; Verhemeldonck, M.; Van Gompel, J.; Lampo, A.; Lammens, L. Phospholipidosis in rats treated with amiodarone: Serum biochemistry and whole genome micro-array analysis supporting the lipid traffic jam hypothesis and the subsequent rise of the biomarker BMP. Toxicol. Pathol. 2012, 40, 491–503. [Google Scholar] [CrossRef] [PubMed]
- Liu, N.; Tengstrand, E.A.; Chourb, L.; Hsieh, F.Y. Di-22:6-bis(monoacylglycerol)phosphate: A clinical biomarker of drug-induced phospholipidosis for drug development and safety assessment. Toxicol. Appl. Pharmacol. 2014, 279, 467–476. [Google Scholar] [CrossRef] [PubMed]
- Forbes, B.; Asgharian, B.; Dailey, L.A.; Ferguson, D.; Gerde, P.; Gumbleton, M.; Gustavsson, L.; Hardy, C.; Hassall, D.; Jones, R.; et al. Challenges in inhaled product development and opportunities for open innovation. Adv. Drug Deliv. Rev. 2011, 63, 69–87. [Google Scholar] [CrossRef]
- Lewis, D.J.; Williams, T.C.; Beck, S.L. Foamy macrophage responses in the rat lung following exposure to inhaled pharmaceuticals: A simple, pragmatic approach for inhaled drug development. J. Appl. Toxicol. 2014, 34, 319–331. [Google Scholar] [CrossRef]
- Reinhart, P.G.; Lai, Y.-L.; Gairola, C.G. Amiodarone-induced pulmonary fibrosis in Fischer 344 rats. Toxicology 1996, 110, 95–101. [Google Scholar] [CrossRef]
- Nasri, H.-R.; Joukar, S.; Kheradmand, H.; Poursalehi, H.-R.; Dabiri, S. Coadministration of Atorvastatin and Amiodarone Increases the Risk of Pulmonary Fibrosis in Rats. Med. Princ. Pract. 2015, 25, 150–154. [Google Scholar] [CrossRef]
- Adams, P.C.; Holt, D.W.; Storey, G.C.; Morley, A.R.; Callaghan, J.; Campbell, R.W. Amiodarone and its desethyl metabolite: Tissue distribution and morphologic changes during long-term therapy. Circulation 1985, 72, 1064–1075. [Google Scholar] [CrossRef] [PubMed]
- Reasor, M.J.; Kacew, S. Drug-induced phospholipidosis: Are there functional consequences? Exp. Biol. Med. (Maywood) 2001, 226, 825–830. [Google Scholar] [CrossRef] [PubMed]


| Cohort Description | Pathology | ||||
|---|---|---|---|---|---|
| Dosing Method | Treatment | Cull Day | Minimal Increases in Alveolar Macrophage Numbers | Foci of Foamy Cells | Minimal Perivascular/Peribronchiolar Inflammatory Cell Infiltrate (Consisting of Neutrophils and Eosinophils) |
| i.n. | Control | 1 | 2/2 | 0/2 | 0/2 |
| Amiodarone | 1 | 2/2 | 0/2 | 0/2 | |
| Control | 7 | 3/3 | 0/3 | 0/3 | |
| Amiodarone | 7 | 3/3 | 0/3 | 0/3 | |
| Aerosol: low dose | Control | 1 | 0/6 | 0/6 | 0/6 |
| Amiodarone | 1 | 3/6 | 1/6 | 0/6 | |
| Control | 7 | 3/6 | 0/6 | 0/6 | |
| Amiodarone | 7 | 3/6 | 0/6 | 0/6 | |
| Control | 28 | 2/6 | 0/6 | 0/6 | |
| Amiodarone | 28 | 3/6 | 0/6 | 0/6 | |
| Aerosol: high dose | Control | 1 | 0/6 | 0/6 | 0/6 |
| Amiodarone | 1 | 2/6 | 0/6 | 3/6 | |
| Control | 7 | 1/6 | 0/6 | 1/6 | |
| Amiodarone | 7 | 1/6 | 0/6 | 6/6 | |
| Study Information | Reported Outcomes | ||||||||
|---|---|---|---|---|---|---|---|---|---|
| Route | Rat Strain | Amiodarone Dosing Protocol | Authors | Total BAL Counts (×106 cells/mL) | BAL Neutrophils (×106 cells/mL) | BAL Eosinophils (×106 Cells/mL) | Macrophage Phospholipid Accumulation | Lamellar Bodies | Foci of Foamy Cells in Tissue |
| Oral | HW 1 | Rats fed 175, 300, 400 or 500 mg/kg for 6 wk suspended in 0.5% methyl cellulose for 5 days/wk by gavage | Wilson et al., 1991 [7] | High dose group had significantly more cells than control or the 175 mg/kg group. | 175 mg/kg < 0.5 300 mg/kg < 2 400 mg/kg ~ 2 500 mg/kg ~ 3 | Not reported | Yes (Only in the three high dose groups) | No | Yes (Only in the three high dose groups) |
| F344 2 | Rats treated orally (50, 100, 150 or 200 mg/kg), daily for 1 wk (5 days/wk) | Reasor et al., 1988 [6] | Not reported | Not reported | Not reported | Yes (Only in the two high dose groups) | Yes | Yes | |
| LE 3 | Rats treated orally 150 mg/kg, daily for 1 wk (5 days/wk) | Reasor et al., 1988 [6] | N/A | Not reported | Not reported | No | N/A | N/A | |
| SD 4 | Rats treated orally 150 mg/kg, daily for 1 wk (5 days/wk) | Reasor et al., 1988 [6] | N/A | N/A | N/A | No | N/A | N/A | |
| HW | Rats fed 175 mg/kg suspended in 0.5% methyl cellulose 5 days/wk by gavage | Wilson and Lippmann, 1990 [15] | No increase in BAL cell counts | No | Not reported | N/A | N/A | Some intra-alveolar FAM | |
| F344 | Rats fed 175 mg/kg suspended in 0.5% methylcellulose 5 days/wk by gavage | Wilson and Lippmann, 1990 [15] | Total lavage cell count was increased (p < 0.001) | Increased neutrophils (p < 0.001) | Not reported | N/A | N/A | AM 5 were much larger than the HW AM. Alveolar spaces contained large FAM 6 | |
| F344 | Fed 150 mg/kg for 2 weeks by gavage | Mazue et al., 1984 [14] | N/A | N/A | N/A | Yes (Lymph nodes and lungs) | Yes | Yes, distended FAM with pale, finely vacuolated cytoplasm | |
| HW | Fed 150 mg/kg for 2 weeks by gavage | Mazue et al., 1984 [14] | N/A | N/A | N/A | No | N/A | N/A | |
| SD | Fed 150 mg/kg for 2 weeks by gavage | Mazue et al., 1984 [14] | N/A | N/A | N/A | Yes (Lymph nodes only) | N/A | N/A | |
| HW | 100 mg/kg suspended in 1% w/v methyl cellulose for seven consecutive days | Patel et al., 2019 | 1.36 | 0.00 | 0.01 | Yes (slight increase) | N/A | No | |
| i.n. | HW | 6.25 mg/kg, dosed twice at days −2 and 0 | Patel et al., 2019 | 0.70 | 0.04 | 0.03 | No | N/A | No |
| i.t. | F344 | 6.25 mg/kg, dosed twice at days 1 and 3 | Taylor et al., 2000 [18] | ~56 | ~14 | ~1.4 | N/A | No | Not reported |
| F344 | 6.25 mg/kg, dosed twice at days 1 and 3 | Lee et al., 2013 [19] | ~5 | ~2 | ~0.8 | Yes (Formation of lipid droplets) | Yes | No | |
| Aero. | HW | ~3 mg/kg over 30 min on day −2 and 0 | Patel et al., 2019 | 0.91 | 0.01 | 0.00 | No | N/A | No |
| HW | 10 mg/kg (day −3) and 30 mg/kg (days −2, 1 and 0) | Patel et al., 2019 | 1.84 | 0.06 | 0.03–0.07 | No | N/A | No | |
| Parameter | Rat NR8383 Cell Line [24] | Rat Primary BAL Macrophages: Ex Vivo 48 h Exposure [24] | Rat Primary BAL Macrophages: Oral Dosing Study |
|---|---|---|---|
| Cell area (span of values) (µm2) | 113–201 | 165–265 | 170–250 |
| Median number of vacuoles per cell | 5 | 10 | 14 |
| Median vacuole area per cell area (%) | 10 | 12 | 27 |
| LipidTOXTM red fluorescence intensity fold-change: amiodarone vs. untreated/naive | 2.7 | 2.8 | 6.0 |
| LipidTOXTM green fluorescence intensity fold-change: amiodarone vs. untreated/naive | 1.3 | 1.2 | 1.6 |
© 2019 by the authors. Licensee MDPI, Basel, Switzerland. This article is an open access article distributed under the terms and conditions of the Creative Commons Attribution (CC BY) license (http://creativecommons.org/licenses/by/4.0/).
Share and Cite
Patel, A.; Hoffman, E.; Ball, D.; Klapwijk, J.; Steven, R.T.; Dexter, A.; Bunch, J.; Baker, D.; Murnane, D.; Hutter, V.; et al. Comparison of Oral, Intranasal and Aerosol Administration of Amiodarone in Rats as a Model of Pulmonary Phospholipidosis. Pharmaceutics 2019, 11, 345. https://doi.org/10.3390/pharmaceutics11070345
Patel A, Hoffman E, Ball D, Klapwijk J, Steven RT, Dexter A, Bunch J, Baker D, Murnane D, Hutter V, et al. Comparison of Oral, Intranasal and Aerosol Administration of Amiodarone in Rats as a Model of Pulmonary Phospholipidosis. Pharmaceutics. 2019; 11(7):345. https://doi.org/10.3390/pharmaceutics11070345
Chicago/Turabian StylePatel, Aateka, Ewelina Hoffman, Doug Ball, Jan Klapwijk, Rory T. Steven, Alex Dexter, Josephine Bunch, Daniel Baker, Darragh Murnane, Victoria Hutter, and et al. 2019. "Comparison of Oral, Intranasal and Aerosol Administration of Amiodarone in Rats as a Model of Pulmonary Phospholipidosis" Pharmaceutics 11, no. 7: 345. https://doi.org/10.3390/pharmaceutics11070345