Review

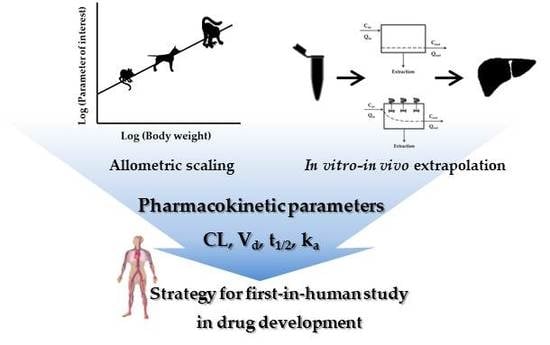
Interpretation of Non-Clinical Data for Prediction of Human Pharmacokinetic Parameters: In Vitro-In Vivo Extrapolation and Allometric Scaling

1
College of Pharmacy, CHA University, 335 Pangyo-ro, Bundang-gu, Seongnam-si, Gyeonggi-do 13488, Korea
2
College of Pharmacy, Chonnam National University, 77 Yongbong-ro, Buk-Gu, Gwangju 61186, Korea
*
Author to whom correspondence should be addressed.
Pharmaceutics 2019, 11(4), 168; https://doi.org/10.3390/pharmaceutics11040168
Submission received: 31 January 2019 / Revised: 22 March 2019 / Accepted: 2 April 2019 / Published: 5 April 2019

Abstract

:
Extrapolation of pharmacokinetic (PK) parameters from in vitro or in vivo animal to human is one of the main tasks in the drug development process. Translational approaches provide evidence for go or no-go decision-making during drug discovery and the development process, and the prediction of human PKs prior to the first-in-human clinical trials. In vitro-in vivo extrapolation and allometric scaling are the choice of method for projection to human situations. Although these methods are useful tools for the estimation of PK parameters, it is a challenge to apply these methods since underlying biochemical, mathematical, physiological, and background knowledge of PKs are required. In addition, it is difficult to select an appropriate methodology depending on the data available. Therefore, this review covers the principles of PK parameters pertaining to the clearance, volume of distribution, elimination half-life, absorption rate constant, and prediction method from the original idea to recently developed models in order to introduce optimal models for the prediction of PK parameters.

Graphical Abstract

1. Introduction

One of the main reasons associated with the termination of drug development is inappropriate pharmacokinetic (PK) properties in humans [1]. Drugability is mainly dependent on the drug’s metabolism and pharmacokinetic (DMPK) properties, which are the main hurdles in pharmaceutical R&D. Approximately 40% of drug failures are attributed to DMPK issues [2]. The main cause of failure in clinical trials is poor efficacy [3]. Although issues related to PK and bioavailability have improved since the 2000s [4], nearly half of all the therapeutic candidates in drug development are lost due to poor absorption, distribution, metabolism, excretion (ADME), toxicology, and pharmacology (safety) [5].
Therefore, the prediction of PK properties in humans before the first-in-human clinical trials is one of the main purposes of non-clinical studies in the drug discovery–development process. The two ways of predicting PK in humans include in vitro-in vivo extrapolation (IVIVE) and allometric scaling (AS).
The physiologically-based IVIVE model is based on physiological, biochemical, and biopharmaceutical factors such as organ size, blood flow rate, enzyme kinetics, drug permeability, partitioning factor into the organ, and various in vitro clearance data. These data are incorporated into the IVIVE model to provide valuable insight into drug properties and evidence to guide decision-making in the drug discovery-development process. Despite its advantages, construction of the IVIVE model requires knowledge of PKs and an understanding of complex mathematical equations. Moreover, this approach is expensive and time-consuming [6]. Although to project in vitro to in vivo data is difficult due to the complexity of the interdependent biological processes and their dynamic nature [7], it is more physiologically relevant than AS, considering that IVIVE incorporates physiological factors and includes the possibility to expand with the mechanistic model [8,9]. In IVIVE, although methods to predict the various forms of clearance are available (e.g., biliary [10], renal [11,12,13], glucuronidation [11], and hydrolysis [14] clearance), we focus on the prediction of hepatic clearance which is the primary elimination pathway. AS is an empirical approach to predict human PK parameters. The origin idea and application of AS in PKs have been discussed in detail by numerous works [15,16,17,18,19,20,21]. Although AS is empirical and has limitations for drugs with high protein bound, extensive active renal secretion, and other transport processes or have species-specific binding or distribution, that may poorly predict human PK parameters [22], it is simple and less complicated, while providing a valuable insight as well.
Although basic principles and methodologies of the two methods vary, they have a common goal which is human PK prediction. Data required for IVIVE and AS were obtained from non-clinical studies prior to the entry of clinical trials [23,24,25]. Animal PK data are routinely obtained in non-clinical drug development processes [26]. These two methods are practically used to estimate the first-in-human dose in clinical trials [25].
Until now, numerous IVIVE and/or AS methods have been developed and comparative analyses have been conducted. However, a general overview of the fundamental principle of PK parameters for the application of IVIVE and AS is lacking, and the available methods are scattered. Therefore, this review will provide a comprehensive overview of the underlying principles of PK parameters with mathematical equations.

2. Theoretical Background for the Prediction of Clearance

2.1. Physiological Clearance Concept

Clearance (CL) is considered the most important PK parameter as it is related to drug elimination and bioavailability [27]. Further, the main purpose of IVIVE is to predict human CL using in vitro data and physiologically relevant mathematical equations. Therefore, an understanding of the basic principles of the CL concept is the first step prior to applying IVIVE. Due to the significance of the parameter itself, and physiological relevance, prediction of CL is one of the key steps in drug discovery and development.
There are three methods for the calculation of CL in PKs [28].
1. Non-compartmental analysis (NCA): This method employs data-dependent and model-independent calculations without the need to define a specific compartment model. The elimination constant is derived from the linear-regression of the elimination phase of a drug. The CL in NCA is calculated using Equation (1), in which the dose is the amount of drug introduced to systemic circulation and AUC0-inf is area under the concentration-time curve from zero to infinity. In this equation, the volume of distribution (V) does not need to be defined. In case of administration involving the absorption pathway, the dose is adjusted based on bioavailability (F).
CL = Dose · F AUC inf
2. Compartmental analysis: CL is calculated using the elimination rate constant (e.g., expressed as k, kel, or k10) and V. This method assumes a defined compartment model. In this method, CL is calculated based on the following equation:
CL = k · V
3. Physiological model: This model describes CL by incorporating physiological, anatomical, and/or biochemical aspects. The knowledge of the physiological PK model is crucial to understand IVIVE since it has improved by the efforts to explain the PK phenomenon as more physiologically relevant. Therefore, comprehensive physiological CL concepts are described in the following subsections.

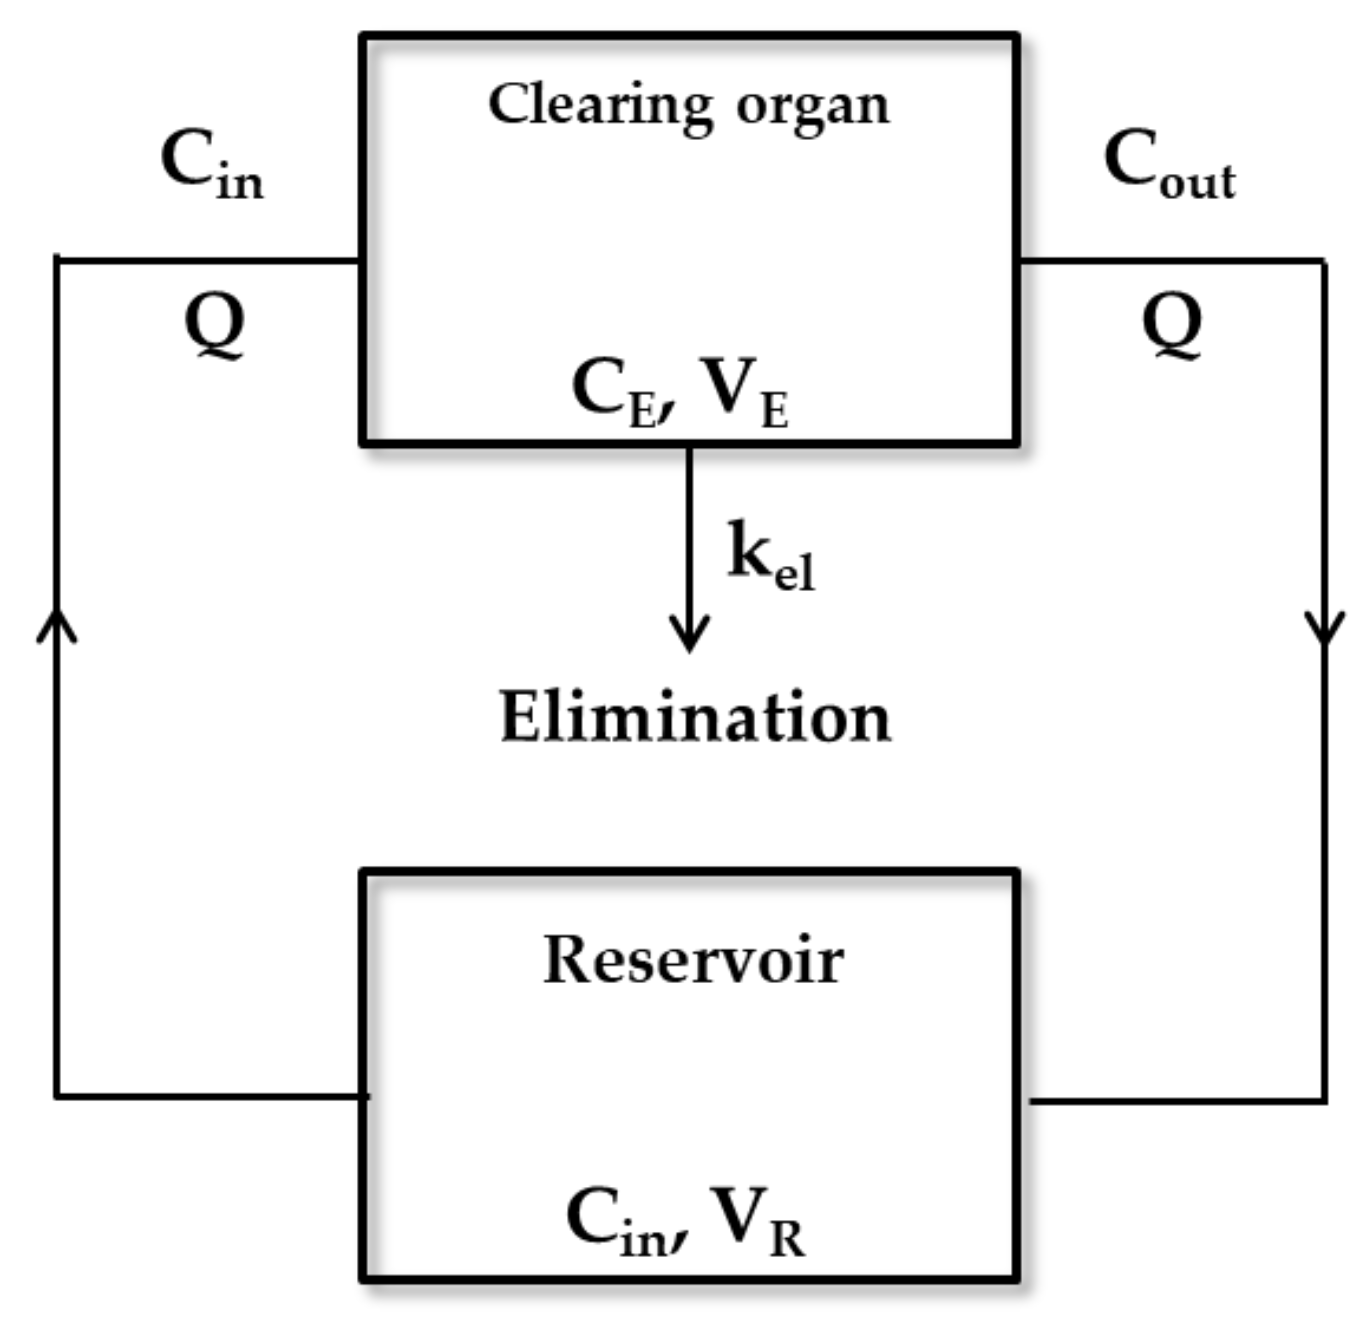
2.1.1. Organ Clearance

The concept of organ clearance is based on the loss of a parent drug across an organ of elimination [29,30,31,32]. A well-perfused clearing organ exhibits the ability to clear xenobiotics. If a drug is cleared in the clearing organ, then Cout is less than Cin (Cout < Cin), in which Cin and Cout indicate drug concentration in artery and venous, respectively.
The rate of the input and output of a drug can be expressed by multiplying drug concentration with flow, Q. Regarding mass balance, the rate of elimination is defined by the difference between input and output as described below.
Rate of elimination = Cin·Q − Cout·Q = Q·(Cin − Cout)
Organ extraction ratio (ER) is the ratio of the elimination rate to the input rate. Thus, ER can be understood as the efficiency with which the organ clears the drug under a specific blood flow, Q. ER is calculated using the following equation:
ER = Q C in C out Q · C in = C in C out C in = 1 C out C in
Organ clearance is the volume of blood cleared of a drug by an organ per unit of time. It is expressed by the following equation [33]:
CL = The   rate   of   elimination C in = Q C in C out C in = Q · ER
The ER is a dimension-less parameter. As shown in Equation (5), it is obvious that the organ clearance is limited by the blood flow in the specific organ. Since ER is greater than or equal to 0 but less than or equal to 1 (0 ≤ ER ≤ 1), CL is greater than or equal to 0 but less than or equal to Q (0 ≤ CL ≤ Q).
In Figure 1, the perfusion model explains the relationship between Q and ER [34]. This model follows the well-stirred model that will be mentioned later. It assumes that the drug distribution in intra-cellular and extra-cellular fluids can instantaneously reach equilibrium, where the blood flow rate is rapid enough not to limit the distribution of a drug. If a drug is bolus administered into the reservoir, the mass balance equations are described by the following Equations (6) to (9).
Differential equations for the reservoir and clearing organs are as follows:
V R dC in dt = Q C in C out
V E dC E dt = Q C in C out k el · V E · C E
where CE is drug concentration in the clearing organ. However, in a practical setting, the analysis of the actual drug concentration in the organ is impossible. Therefore, CE is substituted by Cout which can be measured in a practice setting using the partition coefficient between CE and Cout as shown in the equations below:
K P = C E C out
K P · V E · dC out dt = Q C in C out k el · K P · V E · C out
Solving Equations (7) and (9) for Cin and Cout and substituting these solutions into Equation (1), the final solution yields Equation (10) below. The detailed solving method has been represented in Rowland et al. [34]:
CL org = Q · k el · K P · V E Q + k el · K P · V E
in which CLorg denotes the organ clearance.
In Equation (10), kelKPVE is defined as intrinsic clearance (CLint); in other words, an intrinsic capability of a liver to remove a drug from the blood without any flow limitations. The unit of kelKPVE is identical to CL, and it is expressed by the following equation:
CL int = k el · K P · V E
which from Equation (10) implies
CL org = Q · CL int Q + CL int
Equation (12) indicates that CLorg is a function of Q and CLint. There are two circumstances depending on the relative size of the two variables.
  • The first situation is when the clearance capacity (i.e., CLint) exceeds the Q (CLint >> Q). In this situation, Equation (12) collapses and transforms to Equation (13).
    CL org Q , if   CL int Q
  • The second situation is when Cout is a small fraction of Cin (i.e., when Kp is high, or ER is low). [34]. In this case, Equation (12) collapses in the following equation:
    CL org CL int , if   CL int Q
The basic assumption of the CL concept is that only an unbound free drug is accessible to the enzyme and is subjected to metabolism or biliary excretion. Therefore, the actual intrinsic clearance should be based on the unbound fraction in plasma (fp) or blood (fb). In practical settings, the calculation of protein binding and the analysis of drug concentration are usually performed with plasma. Interconversion between the free fractions in blood and in plasma is shown below:
f b = f p · C P C B
C B = C RBC + C P 1 H ct
where CB and CP refer to the total drug concentration in blood and in plasma, respectively. Hct is the hematocrit with a value of 0.44 in humans [35] and CRBC refers to the drug concentration in red blood cells.
Therefore, CLorg is expressed by the equation below by incorporating fp:
CL org = Q · f p · CL int Q + f p · CL int

2.1.2. Consideration of Enzyme Kinetics

In Equation (12), if the clearing organ is the liver, the correlation between hepatic clearance (CLH) and enzyme kinetics is expressed by the equation below.
The metabolic rate (Vmet) in the liver is described by the Michaelis–Menten equation:
V met = V max · C K m + C
where Vmax is the maximal rate of the reaction, C is the concentration of the substrate, and Km is the Michaelis constant. If both sides of Equation (18) are divided by C, then Vmet/C is the hepatic intrinsic clearance (CLint, H) as shown in the following equation:
CL int , H = V met C = V max K m + C
Since liver enzymes are rarely saturated in clinical practice, generally the value of Km is much greater than C. Thus, Equation (19) can be simplified into the following equation:
CL int , H = V met C = V max K m
Intrinsic clearance is also expressed by the summation of enzyme activities of all parallel metabolic pathways as shown in the following equation:
CL int , H = i = 1 n V max , i K m ,   i
In an in vitro setting, the Vmax and Km are calculated. Then hepatic clearance is estimated by embedding the CLint, H into Equation (12).

2.1.3. Hepatic Clearance Model

Liver is one of the key organs for drug clearance via metabolism and/or excretion through the bile acid. For most drugs, the elimination process in PKs involves hepatic metabolism. Alteration of liver blood flow, synthesis of albumin, and/or enzyme activity could occur by liver impairment, concomitant drug use, environmental factors, and so on [36,37]. Therefore, predicting drug behavior in the liver facilitates the analysis of hepatic drug elimination in virtual scenarios [38].
In the field of PKs, there are four representative hepatic clearance models (Table 1).

Well-Stirred Model

The well-stirred model is a widely applied model, in which the liver is viewed as a single, well-mixed compartment with a fixed drug concentration. This model is expressed in simple equations.
CLH is described by Equation (5):
CLH = QH· ERH
where QH is the hepatic blood flow (20.7 mL/min/kg in humans), and ERH is the hepatic extraction ratio. Since ER is dependent on QH, CLH is not directly proportional to QH. Typically ER decreases with increasing QH [32]. Additionally, hepatic availability (FH) is calculated by the following equation using ERH:
F H = 1 ER H = Q H Q H + f p · CL int , H
For the drugs with high ERH, equations of CLH, ERH, and FH are simplified as the following equations:
CL H Q H
ER H CL int , H · f p CL int , H · f p 1
F H Q H f p · CL int , H
For the drugs with low ERH, the equations of CLH, ERH, and FH are to be simplified to the following equations:
CL H CL int , H
ER H CL int , H · f p Q H
F H Q H Q H 1

Parallel-Tube Model

The parallel-tube model describes the liver as a set of tubes representing a sinusoid where the elimination occurs in hepatocytes. Drug concentration within the liver (i.e., sinusoids and hepatocytes) exponentially decreases in the direction of the hepatic vein [39].
In this model, FH is expressed by the following equation:
F H = 1 ER H = e CL int , H Q H
When ERH and QH are known, the CLint,H is estimated by this model. Taking the natural logarithm of the Equation (30):
ln 1 ER H = CL int , H Q H
CL int , H = Q H × ln 1 ER H = Q H × ln F H
Both well-stirred and parallel-tube models assume that drug permeability is not a rate-limiting step in drug elimination [40]. However, recently, an extended clearance model has been developed in which permeability is one of the important factors affecting the CLH [41,42].
In many cases, the well-stirred model is the choice of method for the estimation of CLorg. However, in certain situations, the estimation of CLH differs between the two models. Pang and Rowland have shown these differences [43,44,45]. In their studies, using lidocaine with an ER of 0.99 or higher, a liver perfusion experiment was conducted in mice. Its metabolite profile is well described by the well-stirred model. The major differences between these two models are FH based on changes of QH and oral bioavailability (Fpo). When a drug with high ERH (e.g., lidocaine) is administered via per oral (PO) route, its Fpo is expressed by the following equation:
F PO = F H = 1 ER H = e CL int , H Q H
Based on the well-stirred and parallel-tube model, the Equation (33) could be transformed into Equations (34) and (35), respectively:
F PO Q H f p · CL int , H
F PO e f p · CL int , H Q H
As shown in these equations, FPO is associated with QH. In a well-stirred model, FPO shows a linear relationship with QH. However, in the parallel-tube model, FPO changes exponentially with QH. By comparing the observed values with predicted values using these two models, the investigator can select the model that better explains the organ clearance. However, under practical experimental settings, it is hard to determine the model with a good fit prior to an investigation. Therefore, unless there is obvious evidence, most investigators use the well-stirred model based on the principle that models should be as simple as possible, but not simpler [40,46].

Distributed Model and Dispersion Model

It is obvious that the liver is neither a well-stirred compartment nor a series of identical tubes [47]. There have been efforts to explain hepatic clearance as more physiologically relevant by using a dispersion model [48,49] or a distributed model [50,51]. The distributed model describes the liver as a series of parallel tubes with different geometrical properties. In this model, ε2 is an estimated parameter used to express variance for each sinusoid in the whole liver [52]. In the distributed model, the mixing of blood in the sinusoids is incorporated into flow rates and path length. The degree of mixing is defined by the dispersion number DN which is estimated in this model. When DN → ∞ or DN → zero, the dispersion model is collapsed in the well-stirred model and the parallel tube model, respectively. The variable ‘a’ in the dispersion model is equal to (1+4RNDN)1/2, where the efficiency number of RN is equal to fp·CLint,H/QH.
Other models presented by scholars include the series-compartment model [53] and transit-time model [54,55,56,57]. However, the IVIVE mainly uses the four models described above.

3. Prediction of Human Clearance Using IVIVE Method
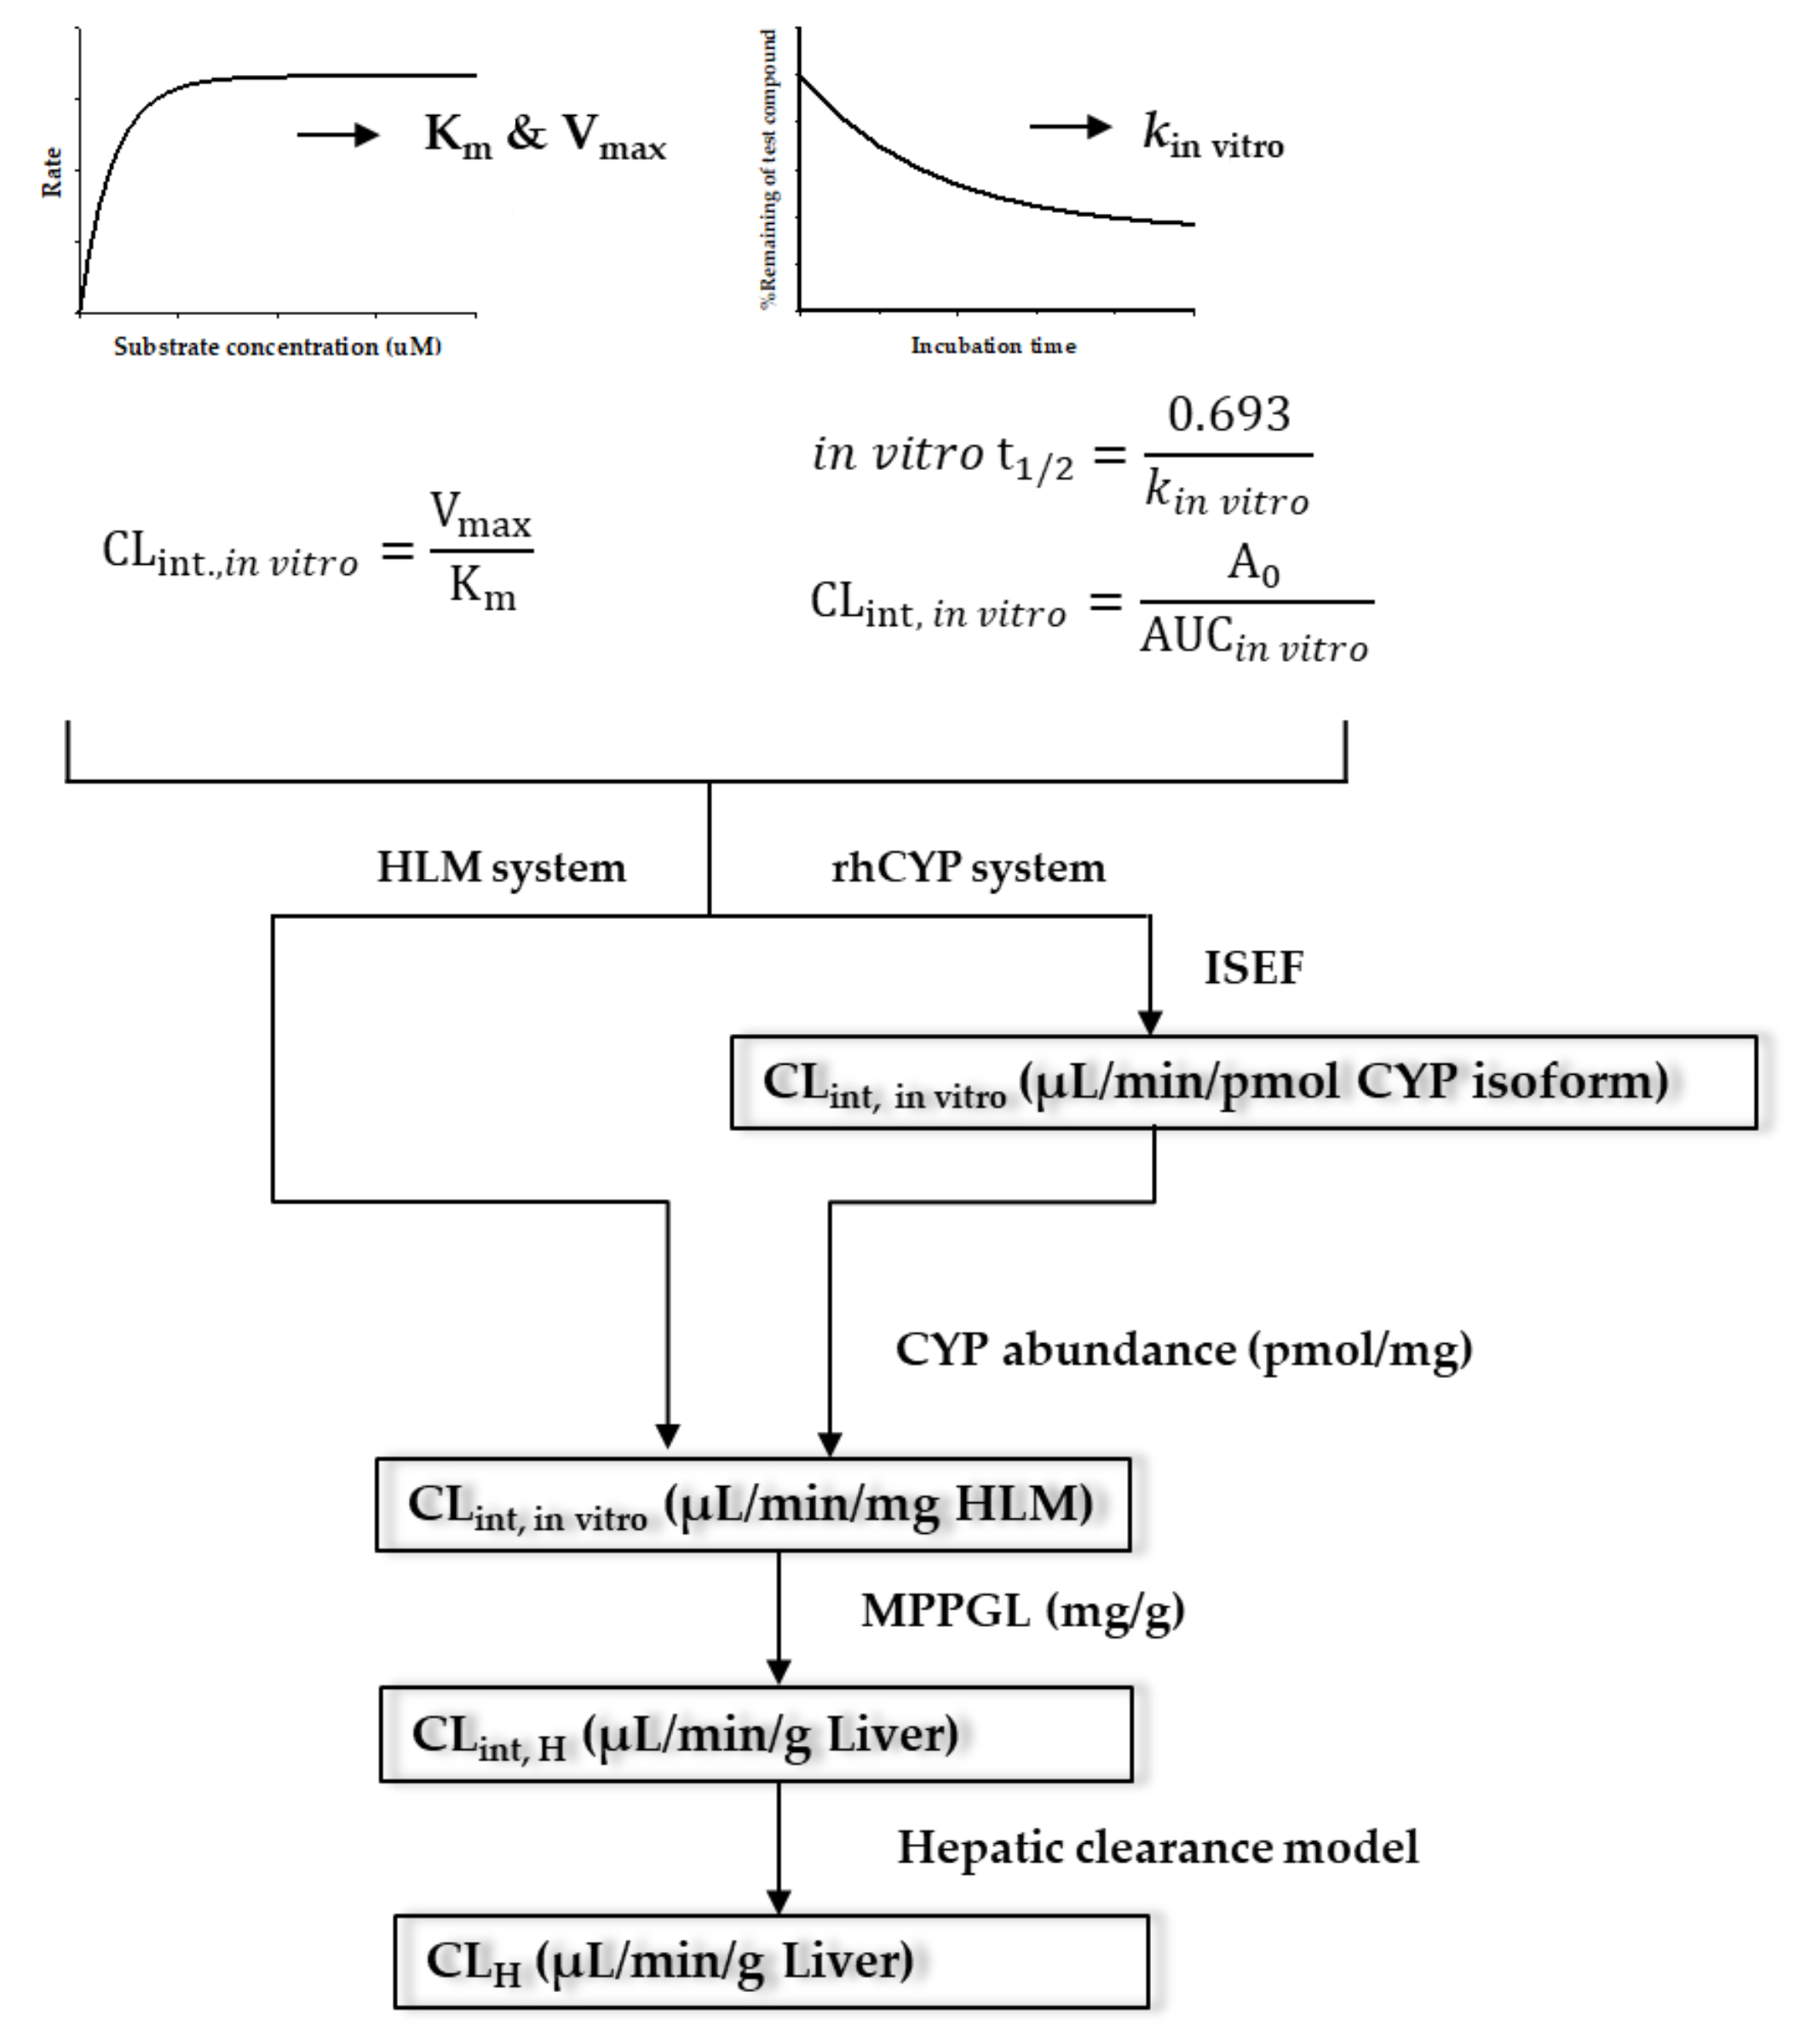
3.1. IVIVE

The purpose of IVIVE is to perform quantitative extrapolation of in vitro data to predict human parameters. A reliable extrapolation method to predict hepatic metabolic clearance utilizes in vitro kinetic data and mathematical equations [58]. The general approach of IVIVE using human liver microsomes (HLM) or recombinant human cytochrome P450 (CYP) system (rhCYP) is presented in Figure 2. Using these systems, metabolite production or substrate depletion are used to calculate the in vitro metabolic kinetic parameters (i.e., Km, Vmax, and kin vitro). The IVIVE method has been improved since its introduction by Rane et al. [59]. Scale-up of in vitro data to in vivo is performed by analyzing the correlation between in vitro and in vivo data or applying physiological correction factors. Many investigators have tried to improve the accuracy of prediction (Table 2).

3.1.1. Empirical IVIVE Model

Scaling factors have been used to predict in vivo clearance from in vitro data. Correction factors are key components in this method. Various physiological or empirical values have been suggested in this approach. Appropriate scaling factors have been developed to improve the predictability of the IVIVE model. A direct physiological scaling factor was incorporated to predict CLH using in vitro hepatocytes and rat microsomes data by Houston [60]. In that study, the basic principal and process of IVIVE were presented. The physiological scaling factor was investigated. Results indicated that this simple scaling factor yielded adequate evidence supporting IVIVE.
Another empirical analysis was performed by Lavé et al. [61], who used human hepatocytes as an in vitro system to predict human ERH. A scaling factor in Equation (41), shown in Table 2, was estimated using non-linear iterative least squares, which is not a fixed value. The predicted ERH,pred and intrinsic in vitro clearance (CLint, in vitro) had a good relationship. In this method, no protein binding was considered, resulting in overestimation of ERH,pred values of highly bound drugs. Nevertheless, the PK parameters of a few highly bound drugs, such as bosentan and lorazepam, were estimated with good agreement. The authors suggested that such discrepancy was attributed to the differences between the relative binding rate of the drug in the plasma and in hepatocytes, and/or its relative [61]. However, the overall predictability of human PK parameter was improved by applying a precise scaling factor, which plays a key role in the IVIVE method.
As shown in these results of Houston [46] and Lavé et al. [47], appropriate scaling factors are important in the IVIVE model to improve the predictability. Protein binding also has a critical impact on the prediction of in vivo PK parameters. The effect of binding properties on the prediction of CL has being investigated in other studies.

3.1.2. Correction Factor of IVIVE Model

Protein Binding Factor

Obach [62] has reported the prediction method of human intrinsic hepatic clearance (CLint, H, human) using the in vitro half-life (t1/2) to incorporat non-specific binding factors to microsomes (fu,mic) and/or the fp. Twenty-nine drugs were classified according to their chemical property (i.e., basic, neutral, and acidic compounds). Generally, the basic compounds tend to have a large extent of binding. Results showed that human CL of neutral and basic compounds was adequately predicted with or without binding factors. However, in case of acid compounds, excluding binding factors, human CL values were predicted with a high degree of error.
In practice, in the absence of prior PKs and/or ADME knowledge of a compound of interest, one cannot easily decide whether or not to consider protein binding when predicting human PK parameters. Therefore, the projection of human CL considering both binding factors (i.e., in vitro microsomes binding and the fraction unbound in plasma) is a strategy to decrease significant risks of over/under estimation of human CL while expanding the predictability.
The effect of microsomal protein binding on the prediction of CLint was also investigated by Austin et al. [63]. In their work, rat liver microsomes were used as an in vitro system. Their results showed that the CLint was dependent on microsomal concentration. However, this relationship can be ignored when fu,mic is considered. The authors also found that fu,mic was correlated with lipophilicity. Based on these results, the authors formulated an equation for the calculation of fu,mic based on the physicochemical properties of drugs. Equation (36) can be used to calculate fu,mic as follows:
f u , mic = 1 C × 10 0.56 log   P / D 1.41 + 1
where C denotes the microsomal protein concentration (mg/mL) and log P/D refers to logP of a basic compound (pKa > 7.4) or logD7.4 of acidic compound (pKa < 7.4), where logD7.4 stands for the partition coefficient between octanol-0.02 M phosphate buffer (pH 7.4 at 20 °C). The logP is equal to the logD7.4 for compounds designated as neutral and the logP is also calculated using the following equation:
logP = logD 7.4 + log 1 + 10 7.4 A + BpK a
where A = 1 and B = −1 for an acidic compound, and A = −1 and B = 1 for a basic compound [64].
Howgate et al. [65] revealed that most of the fu,mic values are high enough to be ignored in the prediction of clearance. However, the few compounds with high microsomal binding should be considered to accurately predict the in vivo clearance. Therefore, when basic knowledge of the compound of interest is lacking in the early stage of drug discovery and development process, incorporating fu,mic is a preferable way to predict in vivo situations.

Animal Scaling Factor

Naritomi et al. [66] recommended the IVIVE method of the animal scaling factor, which is defined as CLint, in vivo divided by CLint, in vitro to improve the human CLint, in vivo. This scaling factor is similar across species, since it depends on the compound itself. When the animal scaling factor in a rat or a dog was not considered, the average fold error increased (from an average two-fold to four-fold error). These results indicate that the scaling factor of each drug is conserved across an inter-species system. However, an animal scaling factor is difficult to use in the absence of adequate information for various species.

3.1.3. Inter-Individual Variability (IIV) in the IVIVE Method

The prediction of human CLH by IVIVE is generally limited by IIV, most likely due to drug metabolizing enzymes [74]. Several studies have reported the substantial differences in CYP expression and significant differences in the activity of different CYP isoforms in HLM [68,75,76]. The potential variation in the abundance of protein expression in relevant organs can be incorporated into IVIVE [77].
The microsomal protein per gram of liver (MPPGL) value can be used as a scaling factor to calculate CLint, in vivo from CLint, in vitro. Generally, a value of 45 mg/g liver [60] originally obtained from rat data, or 52.5 mg/g based on hepatocyte data reported in the literature via back calculation, is commonly used as MPPGL. Since the pharmacogenetic data of laboratory animal models are less than those of humans because of their genetics and environment, the variation in MPPGL of humans may be greater than that of rats [78].

Microsomal Protein Content and CYP Abundance

Since a maximum limit for microsomal CL may exist [59], drugs with high CL tend to have under-predicted CLint, in vivo if data are derived from microsomal protein [51]. Carliel et al. [67] have investigated diazepam as a model drug with high clearance. Its CLint, in vivo is 160 mL/min/SRW, where SRW refers to standard rat weight of 250 g. Microsomal content was adjusted by treating phenobarbital and dexamethasone as CYP inducing agents. The scaling factor calculated from Equation (49) was used to estimate CLint, in vivo. The results showed a good agreement with observed in vivo clearance. Although a CLint, in vitro obtained from dexamethasone-treated microsomes provided an accurate estimate of 77% of the observed CLint, in vivo, the limitation similar to that of Houston [60] persisted. The relationship between CLint, in vitro and CLint, in vivo was investigated empirically rather than mechanistically. Nonetheless, this study suggested that variation in CYP content affects the prediction of in vivo clearance. It provides evidence supporting the incorporation of CYP content as a covariate affecting the IIV in the IVIVE model.
Correction factors of both microsomal protein content and CYP abundances have been included in the IVIVE method using the fu,mic factor by Howgate et al. [65]. Underestimation of the parameter is a general issue in the IVIVE method. Inclusion of the microsomal protein content and CYP abundances that affect the IIV did not show the trend of underestimation.

Microsomal Protein per Gram of Liver (MPPGL)

MPPGL is a key value for the scaling of CLint, in vitro to CLint, in vivo using liver microsomes data or the rhCYP system as shown in Figure 2. It is a value with varying degrees of IIV. However, investigators have been using fixed values either due to the lack of information or empirically.
Barter et al. [78] have reported MPPGL variability via meta-analysis and have investigated potential covariates affecting MPPGL [79]. In their studies, the authors reported an inverse correlation between age and MPPGL. The MPPGL values range from 40 mg/g and 31 mg/g for those in their 30s and 60s, respectively. The authors also provided the following equation to calculate age-related values of MPPGL from birth to adult:
MPPGL   mg / g = 10 ( 1.407 + 0.0158 × age 0.00038 × age 2 + 0.0000024 × age 3
The results provide key information to project PK parameters to humans, especially prior to clinical trials. Healthy subjects constitute the typical population for a clinical pharmacology study during the early phase of drug development, whereas real world patients are very disparate. Estimation of the PK parameters of special populations (e.g., pediatric or geriatric patients) is one of the challenging tasks in clinical trials. Of course, various factors that affect PKs in a special population have been studied. These results provide meaningful insight suggesting that non-clinical data may be considered for the design of clinical trials representing special populations.

Inter-System Extrapolation Factor (ISEF)

The use of a recombinant system represents an alternative in vitro method instead of human liver samples, for prediction of in vivo metabolic clearance. Iwatsubo et al. [68] have suggested the use of CYP450 isoform content in the recombinant method and proposed a P450 content correction factor. Since the levels of CYP450 reductase and cytochrome b5 differ from those of human livers (lower, in most case) in a recombinant system, the authors have proposed an additional correction factor, expressed in Equation (51). The authors have concluded that the prediction of in vivo CL using recombinant system is possible if metabolic activity is corrected for the CYP isozyme content both in rhCYP and per gram liver in vivo.
ISEF, which is a dimensionless value based on the activity of CYP isoform and its contents, has been defined by Proctor et al. [70]. It is used to direct scale data from a rhCYP system to an HLM environment for evaluation of differences in intrinsic activity (per unit CYP) and IIV by incorporating CYP abundance as shown in Equations (52) to (56). Population approached IVIVE could be performed by combining the variance in physiological parameters (such as liver blood flow and liver weight) and the variance in scaling parameters (such as MPPGL and ISEF).
Nakajima et al. [69] have suggested a modified version of the relative activity factor (RAF) using CLint, in vitro to correct a flaw in the original RAF, which was calculated with Vmax alone while the Km value was ignored. In their study, RAF represents the ratio of CL used to predict clearance of azelastine. It best reflects observed N-demethylation CL in HLM.
Chen et al. [80] have experimentally determined the ISEF of six CYP isoforms and investigated their utility in early phases of drug discovery and development. Venkatakrishnam et al. [81] have also investigated the role of CYP1A2, CYP2B6, CYP2C19, CYP3A, and CYP2D6 in a lymphoblastic cell line and suggested the incorporation of bridging factors between rhCYP and liver microsomes, such as RAF and abundance of CYP isoform in microsomes.

3.1.4. Additional Correction Factors

In the conventional IVIVE method, the prediction of in vivo CL using in vitro metabolic data has been performed with good agreement. However, this method could not be used for drugs with high binding rate to plasma and/or blood protein, low CL, or high interaction with transporters. To overcome these limitations, recently, investigators have tried to develop new IVIVE methods using physiologically-based and mechanistic approaches which are presented below in detail.

FI

Only unbound and unionized forms of drugs have access to hepatocytes, which are the sites of metabolism. In the conventional IVIVE model, protein binding is a key factor contributing to the accuracy of CL prediction. Berezhkovskiy [71] has developed a modified equation to predict CLH based on differences in intra- and extra-cellular pH of the unbound drug fraction using FI as presented in Equations (57) to (60). These equations yielded higher values (up to 6.3-fold) of CLH for a basic compound (FI > 1) for strong diprotic bases, but lower values (up to 6.3-fold) of CLH for an acidic compound (FI < 1) for strong diprotic acids. The author suggests that the modified equation with FI improved the issue of both under- and over-estimation commonly encountered in IVIVE. Therefore, for basic compounds, the modified equation could improve the prediction of CLH. For acidic drugs, the conventional IVIVE equation tends to overestimate the CLH. However, this modified equation also improves the prediction of CLH for acidic compounds. Especially, the ionization factor significantly influences the calculation of CLH for drugs with a low extraction ratio since CLH is directly proportional to FI in this case.

Effective Fraction Unbound in Plasma

Calculation of drug concentration in the site where metabolism occurs is important in IVIVE methodology since only free-form drugs penetrate the cellular membrane to reach the metabolic enzyme. Ionic interactions between extracellular binding proteins and the hepatocyte surface provide higher cellular exposure for the unbound drugs than without consideration of the interactions [82].
Poulin et al. [72,83,84] have developed a mechanistic IVIVE model based on two additional factors including pH differences between extracellular and intracellular water in liver, and protein-facilitated uptake induced by potential ionic interactions between protein-albumin bound drug complex and cell surface. This mechanistic IVIVE model overcomes the prediction of human CL for drugs with low CLint and high binding affinity for proteins commonly encountered when predicting human CL from in vitro data. Equations suggested by Poulin presented in Equations (61) to (62), incorporate the new correction factor of unbound fraction in the liver.

3.1.5. Physiologically-Based IVIVE Model

Despite several attempts to accurately predict drug concentrations in the liver where metabolism takes place, the comparative analysis from Hallifax and Houston [85] reported fewer differences in accuracy for the prediction in vivo CL, calculated by Berezhkovskiy and Poulin, using conventional methods. Furthermore, the authors have underscored the need to develop a model that reflects additional physiological factors and mechanistic elucidation to overcome the limitations of existing methods.
In the disposition process, transporters and enzymes play a key role by interacting with each other [86]. Conventionally, IVIVE methods are focused on a single pathway of drug metabolism. However, a drug introduced into the body is cleared via the ADME pathways, which involves numerous enzymes and transporters.
Wu et al. [87] have suggested a Biopharmaceutics Drug Disposition Classification System (BDDCS), which is modified by the Biopharmaceutics Classification System based on routes of drug elimination and the effect of efflux and absorptive transporters. Their study revealed that highly permeable compounds are highly metabolized whereas less permeable compounds tend to be eliminated via renal and/or biliary excretion in intact form.
A novel IVIVE method was developed to predict hepatic organ clearance via physiology-based modeling [42,73] as shown in Equations (63) to (64). This new method reflects additional physiologically relevant information (namely hepatic uptake, metabolism, biliary excretion, and sinusoidal efflux) compared with the conventional method. The proposed method was used to predict rat hepatic clearance of 13 compounds with various physicochemical and PK characteristics. In these studies, the hepatic clearance of valsartan (class 2 compound based on BDDCS) was underestimated with the highest fold-error of 3.95. The rate-limiting steps of class 2 compounds include metabolism and biliary excretion. Although this method incorporates both biliary excretion and metabolism in a typical single parameter prediction, underestimated cases such as valsartan prevailed probably due to its high plasma protein binding (97%) feature. However, since plasma protein binding is considered in the model, the error might have occurred due to unknown non-hepatic elimination.
Although these novel IVIVE methods provide precise prediction and detailed information of CL, additional in vitro data are required compared with the conventional single parameter prediction. Furthermore, in the early phases of drug discovery and development, it may be difficult to apply high-throughput screening, which is an advantage under in vitro experiment settings. However, this novel IVIVE method represents a very useful tool for the evaluation of optimized candidates prior to clinical trials.
An extended clearance model (ECM) based on hepatobiliary clearance has been reviewed by Camenisch et al. [41]. The same group proposed a new IVIVE method for the prediction of total clearance for accurate prediction of relative elimination contribution. Two mathematical Equations (66) and (67) depict the relationship between PSinf and fnH; and PSinf,pas and fnmet. In vitro data (i.e., hepatic uptake data) based on suspensions of human hepatocytes fnH and fnmet can be calculated using the equations.
Along with estimated fractional parameters, total clearance can be presented as the sum of parallel connected organ clearances assuming the absence of extra-hepatic and/or renal clearance. This practical method facilitates the determination of the mechanism of elimination pathway using only in vitro data.

4. Application of AS for the Prediction of Human PK Parameters

4.1. Concept of AS

Allometry is the study of the relationship between size and physiological parameter. It is the study of the usual variation in measurable characteristics of anatomy and physiology as a function of overall body size [88]. The allometric equation is generally expressed as a power function based on the following equation [20]:
Y = aW b
In Equation (73), the Y and X represent quantitatively measurable variables, a denotes constant of appropriate unit, and b is a power exponent. In the PKs, Y is a parameter of interest and B is a physiological parameter, and W is weight. In general, a is drug dependent and b is parameter-type dependent, which are approximately 0.75 for CL and chemical-specific factors associated with metabolism (e.g., Vmax), 1 for volume of organs and blood flows, and 0.25 for physiological times [18,88]. AS assumes that mammals share similar anatomical, biochemical, and physiological features [16,21].

4.2. Prediction of Clearance by AS

There have been various attempts to predict human clearance. Mathematical equations are presented in Table 3. Since simple AS is one of the simplest methods for prediction of human PK parameter, it is widely used for scale-up of prediction from non-clinical PK data to humans. Although it is simple and useful by nature, simple AS has not been entirely successful for the prediction of human clearance. To overcome this limitation, various groups have reported new methods of AS.

4.2.1. Two-Term Method

Boxenbaum and Fertig [17] have developed the two-term method. In their work, the intrinsic clearance of antipyrine was predicted using a two-term allometric equation including brain weight (BW) and weight (W) based on Equation (77). The equation was in good agreement with the relationship between antipyrine intrinsic clearance and physiological variables, BW and W. However, in their article, only a single drug, antipyrine, was tested. Further investigation revealed that this two-term equation was limited to general conditions.

4.2.2. Rule of Exponent

Mahmood and Balian [6,89,101,102,103,104,105,106] have contributed to numerous works on AS. In their studies, they compared the CL value of antiepileptic drugs using four different allometric equations: a simple AS in Equation (74), the product of CL and MPL in Equation (75), the Boxenbaum’s two-term power function in Equation (77), and the product of CL and BW in Equation (76), a novel equation developed by Mahmood and Balian.
It is well known that the simple AS adequately predicts the CL of a drug, which is mainly cleared by renal excretion. However, under general circumstances, simple AS was not adequate to predict CL. When Boxenbaum’s two-term method was used to predict the CL of antiepileptic drugs, the prediction failed. When MLP and brain weight were incorporated in simple AS, the predicted values showed good agreement with the observation values [89].
Mahmood and Balian extended their studies to another work [105] by applying three of four AS methods (except for the two-term power method) to drugs with various physiochemical and PK properties.
Moreover, the ROE, established by Mahmood and Balian [105], provides a guide for the selection of appropriate AS methods for the prediction of drug clearance. The choice of method depends on the exponent determined by simple AS. If the exponent lies between 0.55 to 0.7, the simple AS method is reasonable. If the exponent lies between 0.71 to 1.0, clearance can be predicted reasonably well using CL product MLP method. If the exponent is larger than 1.0, clearance can be predicted using CL product BW method [105]. Mahmood [103] also tested the ROE to predict oral clearance by the same approach. Results showed that the ROE also predicted oral clearance.
Some researchers have expressed concerns about AS since correction factors such as MLP and BW have no clear biological rationale [107]. The fact that three or more species are needed for a reliable prediction of CL [108] is time consuming and costly in the drug development process. However, considering that various experiments are conducted during the drug discovery and development process, at least two animals in an in vivo study are necessary for the non-clinical study [109].
The ROE method could be applied to predict a human CL for biliary excreted drugs. Correction factors are derived based on bile flow with normalization by body weight and liver weights. After the appropriate method is selected by ROE, the CL in a given species is divided by the calculated bile flow correction factor and scaled. The predictability of human CL is significantly improved using the bile flow correction factor [110].

4.2.3. One or Two Species Method

A few studies have reported AS using only one or two species [90,94,95]. As presented in Equations (80) to (85), these empirically determined equations provide valuable information about predicted human CL. Results using these methods are in good agreement. Especially, considering the limited available data in the early phase of drug discovery and development process, these methods are useful tools for the prediction of human CL and provide evidences for go or no-go decision-making.

4.2.4. Liver Blood Flow

Liver blood flow is used as a correction factor in AS. Liver blood flow is used to predict human CL using Equation (86). It has been suggested that the simple liver blood flow-based scaling is the best method and that monkey liver blood flow (MLBF) is superior to predict human CL from rats, dogs, and monkeys’ CL data [96].
The advantage of this method is clear in that it only needs a single species to scale up from animal data. In addition, the MLBF method is particularly applicable to drugs that are not readily metabolized and/or renally excreted when administered intravenously [101]. However, Mahmood [101] has raised an issue about the MLBF method reported by Nagilla and Ward [96]. Mahmood [101] claimed that the reported MLBF method had statistical flaws and that the dataset used in their work [96] should be clarified. Furthermore, the bile flow used in the study did not match with the bile flow rate reported by Davies and Morris [35] which they cited. Furthermore, the MLBF method assumes that data from rats, dogs, and monkeys are always available. However, this is not true. In addition, this method is based on only three species.

4.2.5. Incorporation of in Vitro Data

Lave et al. [93] have investigated in vitro data with AS to predict hepatic clearance for 10 drugs that are extensively metabolized. They determined the rate of metabolism in various animal species via in vitro experiments, including human liver microsomes and hepatocytes. The authors concluded that correcting clearance with in vitro metabolic rates significantly improved the prediction of human CL compared with direct scaling or correction with BW.
Although this in vitro correction method provided a rationale based on physiological factors, Mahmood [102] demonstrated that MLP corrected AS produced the same results. However, this in vitro correction method showed a clear disadvantage in that in vitro CL from several species must be determined in the MLP correct AS method, which is time consuming and costly [22].

4.2.6. Protein Binding

Theoretically, only unbound drugs can be distributed to the hepatocytes where the metabolism occurs and/or kidney excretes. Since the protein binding properties of a drug vary between species [111], disposition of the drug may be variable in different species. Chiou et al. [112] have reported the effect of protein binding on prediction of human clearance in AS for 15 extensively metabolized drugs. In their work, consideration of protein binding to correct inter-species differences in AS tended to improve the prediction of human clearance. Although it is theoretically feasible to use AS with unbound clearance (CLu = CL/fu) based on protein binding, in practice, fu does not significantly improve its predictability [22], [113].
Mahmood [104] has investigated the role of protein binding in the prediction of CL using 20 randomly selected drugs. Furthermore, Mahmood [6] has compared total CL and CLu and found that for drugs excreted renally or via extensive metabolism, CLu could not be predicted any better than total CL.

4.2.7. QSAR Approach

Wajima et al. [98,99] have tried to predict human CL based on physicochemical properties of drugs. In their method, human CL was predicted using descriptors including MW, cLogP, and Ha. Observed rat and dog data were incorporated into their analysis. Their method facilitated prediction of human clearance.

4.2.8. Fraction Unbound Intercept Correction Method (FCIM)

FCIM was developed by Tang et al. [97] for prediction of human CL. In this method, water-octanol partition coefficient and the ratio of fp between rats and human (Rfu) are considered. The authors concluded that the new method significantly improved the prediction, even better than ROE. Furthermore, this method improved the prediction of vertical allometry.
However, when Mahmood [106] performed comparative analysis using ROE and FCIM for drugs with various PK properties (i.e., extensively metabolized, renally excreted and/or secreted and biliary excreted), the results showed that both methods facilitated the prediction of human clearance. In some cases, one of these two methods could be more suitable for predictions. However, the author expressed concern about FCIM since it uses a fixed exponent of 0.77 and a constant of 33.35 while exponents of AS are dependent on the species used in the scaling. Furthermore, FCIM is not suitable for renally secreted and biliary excreted drugs. Despite such concerns, when both methods are considered, it is possible to predict CL in a wide range of drugs.

4.2.9. Multiexponential Allometric Scaling (MA)

Goteti et al. [92] have developed a new method for animal scale up using MA. In this method, the human CL is estimated by the equation below:
CL = aW b + cW d
where a and b represent coefficient and exponent obtained from simple AS, respectively, and c and d are coefficient and slope from MA, respectively.
The slope of MA (i.e., the value of d in Equation (90)) is determined by plotting blood flow rate, organ volume, and organ weights of liver and kidney in non-clinical species against W. As a result, the slopes of liver and kidney were found very similar. The value of d is fixed as 0.9. The coefficient of c is the function of the coefficient of a from AS. The final MA equation is derived as shown in Equation (78).
The MA method can successfully predict human clearance. Their results indicate that monkey is an important species for scaling. When the exponent of simple AS was greater than 0.7, MA showed better prediction of human CL than the simple AS method.

4.3. Prediction of Volume of Distribution by AS

4.3.1. Volume of Distribution in PKs

There are three types of volume of distribution (Vd) and generally estimated in PKs.
  • Volume of distribution of central compartment (Vc).
  • Volume of distribution at steady state (Vss)
  • Volume of distribution by area (Varea), also known as Vβ
Vc is used as a correlation factor for the concentration and number of drugs in the body by the following equation:
X = V c × C
where X and C refer to the amount of drugs in the body and concentration in the blood, respectively. Of these three types of volume of distribution, Vc is generally predicted from animal data. Its predictability is better than the others [114].
The following equations show that Vd is clearly different from the actual tissue volume where drugs are distributed in the body:
X = V bl · C + i = 1 n V i · C i = V bl · C + i = 1 n V i · K i · C = V bl + i = 1 n V i · K i · C = V d · C
where Vbl is the volume of blood, Vi is the volume of organ, Ci is the concentration in the organ, and Ki is the partition coefficient (Ki = Ci/C). In this equation, the greater the tendency to distribute to tissues from blood (i.e., the greater Ki), the greater is the Vd.

4.3.2. Prediction of Vd

Various methods have been developed to predict Vd, and the equations are presented in Table 4. In general, Vd is well correlated with body weight, indicating that the exponent of Vd is around 1 (usually between 0.8 and 1.1) [115]. Furthermore, for the prediction of Vd, the two species in AS are acceptable compared to the use of three or more species. In the study of Mahmood and Balian [108], the average exponents using the simple AS for the prediction of Vd are 0.89 and 0.90 in case of 3 and 2 species, respectively.
The effect of protein binding on the prediction of Vd by AS has been investigated. As mentioned above, it is well known that protein binding properties vary between species. Furthermore, only unbound drugs penetrate blood vessels and biological membranes. For a drug with low binding affinity to plasma and tissue protein or drugs that are only distributed in the extracellular space, they can be scaled since total body water and extracellular water shows inverse correlation with animal size in AS [116].
Sawada et al. [117] have reported that considering the unbound fraction in the prediction of Vd may increase the accuracy of prediction results than the volume against unbound fraction in the plasma. In another study of Sawada et al. [118], the authors investigated the prediction of disposition of beta-lactam antibiotics and reported large differences in free volume of distribution between species. However, additional work revealed no advantage in consideration of the unbound fraction when Sawada et al.’s work was re-evaluated by adding six more drugs from the study of Mahmood [115].

4.3.3. Prediction of Elimination Half-Life by AS

Elimination half-life (t1/2) is one of the most important PK parameter determining the dosage regimen and drugability. Predicted CL cannot estimate the t1/2 since the Vd and CL are required for the estimation of t1/2 as presented by the equation:
t 1 / 2 = 0.693 V d CL
Because of the hybrid nature of the t1/2, this parameter has been poorly estimated by AS [89,114]. Instead of direct scaling of t1/2, Mahmood [89] has suggested the calculation of t1/2 as a secondary parameter using Equation (98). Another approach for prediction of human t1/2 is based on the mean residence time (MRT) [114]. The MRT represents the average staying time of the drug in a body organ or compartment as the molecules diffuses in and out [28] and the parameter is estimated by the following equation:
MRT = V ss CL
where CL is calculated by the Equation (1). Since Vss is the summation of the volume of the central compartment (Vc) and peripheral compartment (Vp) in a two-compartment PK model, MRT can also be expressed with the equation below combined with Equation (2) [28]:
MRT = V c + V p k · V c
Mahmood [114] investigated the prediction of MRT by AS. Results showed good agreement. Therefore, the t1/2 was predicted using the predicted MRT by following equation:
t 1 / 2 = MRT 1.44

5. Prediction of Absorption Related PK Parameters

Absorption rate constant (ka) is generally expressed by first or zero order constant. It could be estimated from various PK models. However, ka is originally an apparent parameter that can be best estimated through first-order loss of drug from the gastrointestinal tract, not through first-order appearance of drug in the plasma [52].
AS was applied to predict turn-over parameters. Turn-over rate refers to the amount that a compound is secreted or synthesized per unit time [52]. Therefore, in general, neither is ka scaled from animal data, nor is the affinity parameter (i.e., Km) in Michaelis-Menten equation applied by body weight scaling. [88]. Although AS equation for scaling the first order kinetic parameter (i.e., k) has been suggested by Kenyon [88] as shown in Equation (102) in Table 5, further evaluation is required.
Various empirical relationships of effective permeability (Peff) with physicochemical properties or Caco2 in vitro data have been reported. They are shown in Table 5. The ka was estimated with the predicted Peff combined with Equation (112). Another way to predict ka is to use the mean value of absorption parameters from animal data. Liu et al. [123] have reported a method for human PK projection of imigliptin using IVIVE, AS, and PK/PD modeling. In their study, the absorption parameter was applied as the mean value in non-clinical animal models such as rats, dogs, and monkeys.
Equations for predicting the fraction of absorption (Fa) have been reported by a few investigators. In Equation (115), Fa is predicted by a mechanism-based model using equilibrium solution for ka. Other relationships between Fa and Peff are presented in Equation (116). The empirical equation could be used for prediction of Fa using in vitro permeability data.

6. Conclusions

Investigating the CL pathway is a significantly important issue in drug development. Drug CL parameters have an impact on the determination of dosing regimens for both normal and special populations, such as pediatric, elderly, and patients with renal or hepatic impairment, drug–drug interactions, and so on.
Prediction of PK parameters from non-clinical studies is essential in the drug discovery and development process. Over the last five decades, numerous translational approaches have been developed to predict human PK parameters. Both IVIVE and AS methods provide insight based on non-clinical studies for decision-making in the drug discovery and development process.
In the overall prediction of total clearance, AS represents a powerful method for the use of non-clinical data from single or multiple species. However, it is difficult to determine the variation in transporters and/or enzyme expression, affinity, and specificity with AS.
The proposed ECM model combined with the prediction of contribution could represent a breakthrough in AS and conventional IVIVE methodology.
Integration of the in vitro data and in vivo animal data is recommended for accurate prediction of specific ADME processes in humans [7] and recently, the combined methods were applied to a drug development process [123,131]. Since the choice of method depends on data availability and each method has advantages and disadvantages, the designing of an overall non-clinical study to generate appropriate data for scaling is one of the key steps in the practice of investigation.
Despite its uncertainty, ongoing refinement of IVIVE and AS methods will increase the accuracy of predictability and increase our understanding of the underlying rationale into mechanisms of extrapolation from in vitro or in vivo to human.

Author Contributions

G.-W.C. wrote this manuscript, Y.-B.L. contributed to the editing and review, and H.-Y.C. supervised this work.

Funding

This research received no external funding.

Acknowledgments

This work was supported by the National Research Foundation of Korea (NRF), grant funded by the Korean government (MSIT) (No. 2018049021). Also, this work was supported by the Ministry of Food and Drug Safety (17162MFDS117).

Conflicts of Interest

The authors declare no conflict of interest.

Abbreviations

ADMEabsorption, distribution, metabolism, excretion
ASallometric scaling
AUC0-infarea under the concentration-time curve from zero to infinity
BDDCSbiopharmaceutics drug disposition classification system
BWbrain weight
CBdrug concentration in blood
CLclearance
CLHhepatic clearance
CLintintrinsic clearance
CLint, Hhepatic intrinsic clearance
CLint,H, human human hepatic intrinsic clearance
CLint,H, predpredicted hepatic intrinsic clearance
CLint,in vitroin vitro intrinsic clearance
CLint,met intrinsic metabolic clearance
CLint,sec intrinsic secretory clearance
CLmetmetabolic clearance
cLogPpartition coefficient
clogPcalculated logP
CLorgorgan clearance
CPdrug concentration in plasma
CR concentration in VR
CRBCdrug concentration in red blood cells
Cuunbound drug concentration at distribution equilibrium
DMPKdrug metabolism and pharmacokinetic
DNdispersion number
ECMextended clearance model
ERextraction ratio
ERHhepatic extraction ratio
ERH, obsobserved hepatic extraction ratio
ERH, predpredicted hepatic extraction ratio
Ffraction of absorption
f IW i unbound fraction in the intracellular water of ionized compound
f IW n unbound fraction in the intracellular water of neutral compound
f p i unbound fraction in the plasma of ionized compound
f p n unbound fraction in the plasma of neutral compound
Fafraction of absorption
fbunbound fraction in blood
FCIMfraction unbound intercept correction method
FHhepatic availability
FIionization factor
fnHfractional contribution of hepatic elimination
fnmet fractional contribution of metabolic elimination
fnsecfractional contribution of biliary elimination
fpunbound fraction in plasma
FPOoral bioavailability
fu, micnon-specific binding factor to microsomes
fu,liverunbound fraction into the liver
Hanumber of hydrogen-bond acceptors
HBDnumber of hydrogen-bond donor
Hcthematocrit
HLMhuman liver microsomes
IIVinter-individual variability
ISEFinter-system extrapolation factor
ISTDinternal standard
IVIVEin vitro-in vivo extrapolation
IWintracellular water
kaabsorption rate constant
ka,eq equilibrium solution for ka
ki the rate constant of intestinal transit
KmMichaelis constant
Llength of perfusion segment
MAmultiexponential allometric scaling
MLBFmonkey liver blood flow
MLPmaximum life-span potential
MPPGLmicrosomal protein per gram of liver
MPRmicrosomal protein recovery
MRTmean residence time
MW molecular weight
NCAnon-compartmental analysis
Peffeffective permeability
PKpharmacokinetic
PLRplasma to whole liver concentration ratio
Pmdrug permeability across intestinal mucosa
PSApolar surface area
PSbilebiliary clearance
PSefflux, totalapparent sinusoidal total efflux clearance from the intracellular side of hepatocytes back into blood
PSinf, act sinusoidal efflux from hepatocytes back into blood
PSuptake,totaltotal apparent uptake clearance
QHhepatic liver flow
QSARquantitative structure activity relationship
Rradius of human jejunum
RAFrelative activity factor
RB/Pblood to plasma ratio
RE/I ratio of distributed albumin in the extravascular space to that in the intravascular space
Rfuunbound fraction in plasma ratio between rats and humans
rhCYPrecombinant human CYP system
RNefficiency number
ROErule of exponent
Sabsorptive surface area
t1/2half-life
Vvolume of distribution
Varea, Vβvolume of distribution by area
Vcvolume of distribution of central compartment
VE extracellular space volume minus the plasma volume
Vmaxmaximal rate of the reaction
Vmetmetabolic rate
Vplasmaplasma volume
VRphysical volume into which the drug distributes minus the extracellular space
Vssvolume of distribution at steady state
Wbody weight
ε2 variance for each sinusoid in the whole liver

References

  1. Prentis, R.A.; Lis, Y.; Walker, S.R. Pharmaceutical innovation by the seven UK-owned pharmaceutical companies (1964–1985). Br. J. Clin. Pharm. 1988, 25, 387–396. [Google Scholar] [CrossRef]
  2. Alavijeh, M.S.; Palmer, A.M. The pivotal role of drug metabolism and pharmacokinetics in the discovery and development of new medicines. Curr. Opin. Investig. Drugs 2004, 5, 755–763. [Google Scholar]
  3. Harrison, R.K. Phase II and phase III failures: 2013–2015. Nat. Rev. Drug Discov. 2016, 15, 817–818. [Google Scholar] [CrossRef] [PubMed]
  4. Kola, I.; Landis, J. Can the pharmaceutical industry reduce attrition rates? Nat. Rev. Drug Discov. 2004, 3, 711–715. [Google Scholar] [CrossRef]
  5. Wang, J.; Urban, L. The impact of early ADME profiling on drug discovery and development strategy. Drug Discov. World 2004, 5, 73–86. [Google Scholar]
  6. Mahmood, I.; Balian, J.D. The pharmacokinetic principles behind scaling from preclinical results to phase I protocols. Clin. Pharm. 1999, 36, 1–11. [Google Scholar] [CrossRef] [PubMed]
  7. Lin, J.H. Applications and limitations of interspecies scaling and in vitro extrapolation in pharmacokinetics. Drug Metab. Dispos. 1998, 26, 1202–1212. [Google Scholar]
  8. Riede, J.; Poller, B.; Umehara, K.; Huwyler, J.; Camenisch, G. New IVIVE method for the prediction of total human clearance and relative elimination pathway contributions from in vitro hepatocyte and microsome data. Eur. J. Pharm. Sci. 2016, 86, 96–102. [Google Scholar] [CrossRef] [PubMed]
  9. Li, J.; Wu, J.; Bao, X.; Honea, N.; Xie, Y.; Kim, S.; Sparreboom, A.; Sanai, N. Quantitative and Mechanistic Understanding of AZD1775 Penetration across Human Blood-Brain Barrier in Glioblastoma Patients Using an IVIVE-PBPK Modeling Approach. Clin. Cancer Res. Off. J. Am. Assoc. Cancer Res. 2017, 23, 7454–7466. [Google Scholar] [CrossRef] [PubMed]
  10. Zou, P.; Liu, X.; Wong, S.; Feng, M.R.; Liederer, B.M. Comparison of in vitro-in vivo extrapolation of biliary clearance using an empirical scaling factor versus transport-based scaling factors in sandwich-cultured rat hepatocytes. J. Pharm. Sci. 2013, 102, 2837–2850. [Google Scholar] [CrossRef] [PubMed]
  11. Knights, K.M.; Spencer, S.M.; Fallon, J.K.; Chau, N.; Smith, P.C.; Miners, J.O. Scaling factors for the in vitro-in vivo extrapolation (IV-IVE) of renal drug and xenobiotic glucuronidation clearance. Br. J. Clin. Pharm. 2016, 81, 1153–1164. [Google Scholar] [CrossRef]
  12. Scotcher, D.; Jones, C.; Posada, M.; Rostami-Hodjegan, A.; Galetin, A. Key to Opening Kidney for in Vitro-In Vivo Extrapolation Entrance in Health and Disease: Part I: In Vitro Systems and Physiological Data. AAPS J. 2016, 18, 1067–1081. [Google Scholar] [CrossRef] [PubMed]
  13. Scotcher, D.; Billington, S.; Brown, J.; Jones, C.R.; Brown, C.D.; Rostami-Hodjegan, A.; Galetin, A. Microsomal and Cytosolic Scaling Factors in Dog and Human Kidney Cortex and Application for In Vitro-In Vivo Extrapolation of Renal Metabolic Clearance. Drug Metab. Dispos. 2017, 45, 556–568. [Google Scholar] [CrossRef] [PubMed]
  14. Nishimuta, H.; Houston, J.B.; Galetin, A. Hepatic, intestinal, renal, and plasma hydrolysis of prodrugs in human, cynomolgus monkey, dog, and rat: Implications for in vitro-in vivo extrapolation of clearance of prodrugs. Drug Metab. Dispos. 2014, 42, 1522–1531. [Google Scholar] [CrossRef]
  15. Campbell, D.B. Can allometric interspecies scaling be used to predict human kinetics? Drug Inf. J. 1994, 28, 235–245. [Google Scholar] [CrossRef]
  16. Temerin, L.A. The ecological implications of body size. By R.H. Peters. New York: Cambridge University Press. 1983. xii + 329 pp., figures, tables, appendices, references, index. $29-95 (cloth). Am. J. Phys. Anthropol. 1985, 66, 340–342. [Google Scholar] [CrossRef]
  17. Boxenbaum, H.; Fertig, J.B. Scaling of antipyrine intrinsic clearance of unbound drug in 15 mammalian species. Eur. J. Drug Metab. Pharm. 1984, 9, 177–183. [Google Scholar] [CrossRef]
  18. Boxenbaum, H. Interspecies Scaling, Allometry, Physiological Time, and the Ground Plan of Pharmacokinetics. J. Pharm. Biopharm. 1982, 10, 201–227. [Google Scholar] [CrossRef]
  19. Boxenbaum, H. Interspecies variation in liver weight, hepatic blood flow, and antipyrine intrinsic clearance: Extrapolation of data to benzodiazepines and phenytoin. J. Pharm. Biopharm. 1981, 8, 165–176. [Google Scholar] [CrossRef]
  20. Dedrick, R.L. Animal scale-up. J. Pharm. Biopharm. 1973, 1, 435–461. [Google Scholar] [CrossRef]
  21. Adolph, E.F. Quantitative Relations in the Physiological Constitutions of Mammals. Science 1949, 109, 579–585. [Google Scholar] [CrossRef] [PubMed]
  22. Huang, Q.; Riviere, J.E. The application of allometric scaling principles to predict pharmacokinetic parameters across species. Expert Opin. Drug Metab. Toxicol. 2014, 10, 1241–1253. [Google Scholar] [CrossRef] [PubMed]
  23. Andrade, E.L.; Bento, A.F.; Cavalli, J.; Oliveira, S.K.; Schwanke, R.C.; Siqueira, J.M.; Freitas, C.S.; Marcon, R.; Calixto, J.B. Non-clinical studies in the process of new drug development—Part II: Good laboratory practice, metabolism, pharmacokinetics, safety and dose translation to clinical studies. Braz. J. Med. Biol. Res. 2016, 49, e5646. [Google Scholar] [CrossRef] [PubMed]
  24. Guidance for Industry: In Vitro Metabolism- and Transporter-Mediated Drug-Drug Interaction Studies; U.S. Department of Health and Human Services, Food and Drug Administration (FDA), Center for Drug Evaluation and Research (CDER): Rockville, MD, USA, 2017.
  25. Estimating the Maximum Safe Starting Dose in Initial Clinical Trials for Therapeutics in Adult Healthy Volunteers; U.S. Department of Health and Human Services, Food and Drug Administration (FDA), Center for Drug Evaluation and Research (CDER): Rockville, MD, USA, 2005.
  26. Ings, R.M. Interspecies scaling and comparisons in drug development and toxicokinetics. Xenobiotica 1990, 20, 1201–1231. [Google Scholar] [CrossRef] [PubMed]
  27. Zuegge, J.; Schneider, G.; Coassolo, P.; Lave, T. Prediction of hepatic metabolic clearance: Comparison and assessment of prediction models. Clin. Pharm. 2001, 40, 553–563. [Google Scholar] [CrossRef] [PubMed]
  28. Shargel, L.; Andrew, B.C.; Wu-Pong, S. Applied Biopharmaceutics & Pharmacokinetics, 7th ed.; Appleton & Lange Reviews/McGraw-Hill, Medical Pub. Division: New York, NY, USA, 2016. [Google Scholar]
  29. Pang, K.S.; Weiss, M.; Macheras, P. Advanced pharmacokinetic models based on organ clearance, circulatory, and fractal concepts. AAPS J. 2007, 9, E268–E283. [Google Scholar] [CrossRef] [PubMed]
  30. Mehvar, R. Interdependency of pharmacokinetic parameters: A chicken-and-egg problem? Not! J. Pharm. Pharm. Sci. 2006, 9, 113–118. [Google Scholar] [PubMed]
  31. Sirianni, G.L.; Pang, K.S. Organ Clearance Concepts: New Perspectives on Old Principles. J. Pharm. Biopharm. 1997, 25, 449–470. [Google Scholar] [CrossRef]
  32. Keiding, S.; Andreasen, P.B. Hepatic clearance measurements and pharmacokinetics. Pharmacology 1979, 19, 105–110. [Google Scholar] [CrossRef] [PubMed]
  33. Benet, L.Z.; Zia-Amirhosseini, P. Basic principles of pharmacokinetics. Toxicol. Pathol. 1995, 23, 115–123. [Google Scholar] [CrossRef]
  34. Rowland, M.; Benet, L.Z.; Graham, G.G. Clearance concepts in pharmacokinetics. J. Pharm. Biopharm. 1973, 1, 123–136. [Google Scholar] [CrossRef]
  35. Davies, B.; Morris, T. Physiological parameters in laboratory animals and humans. Pharm. Res. 1993, 10, 1093–1095. [Google Scholar] [CrossRef] [PubMed]
  36. Rodighiero, V. Effects of liver disease on pharmacokinetics. An update. Clin. Pharm. 1999, 37, 399–431. [Google Scholar] [CrossRef]
  37. Breimer, D.D. Pharmacokinetics in liver disease. Pharm. Weekbl. Sci. 1987, 9, 79–84. [Google Scholar] [CrossRef]
  38. Kim, T.H.; Shin, S.; Shin, B.S. Model-based drug development: Application of modeling and simulation in drug development. J. Pharm. Investig. 2017, 48, 431–441. [Google Scholar] [CrossRef]
  39. Rowland, M. Physiologic pharmacokinetic models and interanimal species scaling. Pharmacol. Ther. 1985, 29, 49–68. [Google Scholar] [CrossRef]
  40. Mehvar, R. Clearance Concepts: Fundamentals and Application to Pharmacokinetic Behavior of Drugs. J. Pharm. Pharm. Sci. 2018, 21, 88s–102s. [Google Scholar] [CrossRef]
  41. Camenisch, G.; Riede, J.; Kunze, A.; Huwyler, J.; Poller, B.; Umehara, K. The extended clearance model and its use for the interpretation of hepatobiliary elimination data. ADMET DMPK 2015, 3, 1–14. [Google Scholar] [CrossRef]
  42. Camenisch, G.; Umehara, K.-I. Predicting human hepatic clearance from in vitro drug metabolism and transport data: A scientific and pharmaceutical perspective for assessing drug-drug interactions. Biopharm. Drug Dispos. 2012, 33, 179–194. [Google Scholar] [CrossRef]
  43. Pang, K.S.; Rowland, M. Hepatic Clearance of Drugs. II. Experimental Evidence for Acceptance of the “Well-Stirred” Model over the “Parallel Tube” Model Using Lidocaine in the Perfused Rat Liver in Situ Preparation. J. Pharm. Biopharm. 1977, 5, 655–680. [Google Scholar] [CrossRef]
  44. Pang, K.S.; Rowland, M. Hepatic clearance of drugs. III. Additional experimental evidence supporting the “wellstirred” model, using metabolite (MEGX) generated from lidocaine under varying hepatic blood flow rates and linear conditions in the perfused rat liverin situ preparation. J. Pharm. Biopharm. 1977, 5, 681–699. [Google Scholar] [CrossRef]
  45. Pang, K.S.; Rowland, M. Hepatic clearance of drugs. I. Theoretical considerations of a “well-stirred” model and a “parallel tube” model. Influence of hepatic blood flow, plasma and blood cell binding, and the hepatocellular enzymatic activity on hepatic drug clearance. J. Pharm. Biopharm. 1977, 5, 625–653. [Google Scholar] [CrossRef]
  46. Forker, E.L.; Luxon, B.A. Lumpers vs. distributers. Hepatology 1985, 5, 1236–1237. [Google Scholar] [CrossRef] [PubMed]
  47. Forker, E.L.; Luxon, B.A. Albumin binding and hepatic uptake: The importance of model selection. J. Pharm. Sci. 1983, 72, 1232–1233. [Google Scholar] [CrossRef] [PubMed]
  48. Roberts, M.S.; Rowland, M. A dispersion model of hepatic elimination: 2. Steady-state considerations-influence of hepatic blood flow, binding within blood, and hepatocellular enzyme activity. J. Pharm. Biopharm. 1986, 14, 261–288. [Google Scholar] [CrossRef]
  49. Roberts, M.S.; Rowland, M. A dispersion model of hepatic elimination: 1. Formulation of the model and bolus considerations. J. Pharm. Biopharm. 1986, 14, 227–260. [Google Scholar] [CrossRef]
  50. Sawada, Y.; Sugiyama, Y.; Miyamoto, Y.; Iga, T.; Hanano, M. Hepatic drug clearance model: Comparison among the distributed, parallel-tube and well-stirred models. Chem. Pharm. Bull. 1985, 33, 319–326. [Google Scholar] [CrossRef]
  51. Bass, L.; Robinson, P.; Bracken, A.J. Hepatic elimination of flowing substrates: The distributed model. J. Biol. 1978, 72, 161–184. [Google Scholar] [CrossRef]
  52. Weiner, J.G.D. Pharmacokinetic and Pharmacodynamic Data Analysis: Concepts and Applications, 5th ed.; Swedish Pharmaceutical Press: Stockholm, Sweden, 2016. [Google Scholar]
  53. Gray, M.; Tam, Y. The series-compartment model for hepatic elimination. Drug Metab. Dispos. 1987, 15, 27–31. [Google Scholar]
  54. Goresky, C.A. Initial distribution and rate of uptake of sulfobromophthalein in the liver. Am. J. Physiol. 1964, 207, 13–26. [Google Scholar] [CrossRef]
  55. Goresky, C.A.; Bach, G.G.; Nadeau, B.E. Red cell carriage of label: Its limiting effect on the exchange of materials in the liver. Circ. Res. 1975, 36, 328–351. [Google Scholar] [CrossRef] [PubMed]
  56. Geng, W.P.; Schwab, A.J.; Goresky, C.A.; Pang, K.S. Carrier-mediated uptake and excretion of bromosulfophthalein-glutathione in perfused rat liver: A multiple indicator dilution study. Hepatology 1995, 22, 1188–1207. [Google Scholar] [CrossRef] [PubMed]
  57. Weiss, M.; Roberts, M.S. Tissue distribution kinetics as determinant of transit time dispersion of drugs in organs: Application of a stochastic model to the rat hindlimb. J. Pharm. Biopharm. 1996, 24, 173–196. [Google Scholar] [CrossRef]
  58. Lave, T.; Coassolo, P.; Reigner, B. Prediction of hepatic metabolic clearance based on interspecies allometric scaling techniques and in vitro-in vivo correlations. Clin. Pharm. 1999, 36, 211–231. [Google Scholar]
  59. Rane, A.; Wilkinson, G.; Shand, D. Prediction of hepatic extraction ratio from in vitro measurement of intrinsic clearance. J. Pharm. Exp. 1977, 200, 420–424. [Google Scholar]
  60. Houston, J.B. Utility of in vitro drug metabolism data in predicting in vivo metabolic clearance. Biochem. Pharm. 1994, 47, 1469–1479. [Google Scholar] [CrossRef]
  61. Lavé, T.H.; Dupin, S.; Schmitt, C.; Valles, B.; Ubeaud, G.; Chou, R.C.; Jaeck, D.; Coassolo, P. The Use of Human Hepatocytes to Select Compounds Based on Their Expected Hepatic Extraction Ratios in Humans. Pharm. Res. 1997, 14, 152–155. [Google Scholar] [CrossRef]
  62. Obach, R.S. Prediction of human clearance of twenty-nine drugs from hepatic microsomal intrinsic clearance data: An examination of in vitro half-life approach and nonspecific binding to microsomes. Drug Metab. Dispos. 1999, 27, 1350–1359. [Google Scholar]
  63. Austin, R.P. The Influence of Nonspecific Microsomal Binding on Apparent Intrinsic Clearance, and Its Prediction from Physicochemical Properties. Drug Metab. Dispos. 2002, 30, 1497–1503. [Google Scholar] [CrossRef] [PubMed]
  64. Taylor, P. Comprehensive Medicinal Chemistry; Hansch, C., Sammes, P.G., Taylor, J.B., Eds.; Pergamon: New York, NY, USA, 1990; Volume 4. [Google Scholar]
  65. Howgate, E.M.; Rowland Yeo, K.; Proctor, N.J.; Tucker, G.T.; Rostami-Hodjegan, A. Prediction of in vivo drug clearance from in vitro data. I: Impact of inter-individual variability. Xenobiotica 2006, 36, 473–497. [Google Scholar] [CrossRef]
  66. Naritomi, Y.; Terashita, S.; Kimura, S.; Suzuki, A.; Kagayama, A.; Sugiyama, Y. Prediction of Human Hepatic Clearance from in Vivo Animal Experiments and in Vitro Metabolic Studies with Liver Microsomes from Animals and Humans. Drug Metab. Dispos. 2001, 29, 1316–1324. [Google Scholar]
  67. Carlile, D.J.; Zomorodi, K.; Houston, J.B. Scaling factors to relate drug metabolic clearance in hepatic microsome, isolated hepatocytes, and the intact liver. Drug Metab. Dispos. 1997, 25, 903–911. [Google Scholar] [PubMed]
  68. Iwatsubo, T.; Hirota, N.; Ooie, T.; Suzuki, H.; Shimada, N.; Chiba, K.; Ishizaki, T.; Green, C.E.; Tyson, C.A.; Sugiyama, Y. Prediction of in Viva Drug Metabolism in the Human Liver from in Vitro Metabolism Data. Pharmacol. Ther. 1997, 73, 147–171. [Google Scholar] [CrossRef]
  69. Nakajima, M.; Nakamura, S.; Tokudome, S.; Shimada, N.; Yamazaki, H.; Yokoi, T. Azelastine N-demethylation by cytochrome P-450 (CYP)3A4, CYP2D6, and CYP1A2 in human liver microsomes: Evaluation of approach to predict the contribution of multiple CYPs. Drug Metab. Dispos. 1999, 27, 1381–1391. [Google Scholar]
  70. Proctor, N.J.; Tucker, G.T.; Rostami-Hodjegan, A. Predicting drug clearance from recombinantly expressed CYPs: Intersystem extrapolation factors. Xenobiotica 2004, 34, 151–178. [Google Scholar] [CrossRef]
  71. Berezhkovskiy, L.M. The Corrected Traditional Equations for Calculation of Hepatic Clearance that Account for the Difference in Drug Ionization in Extracellular and Intracellular Tissue Water and the Corresponding Corrected PBPK Equation. J. Pharm. Sci. 2010, 100, 1167–1183. [Google Scholar] [CrossRef]
  72. Poulin, P.; Kenny, J.R.; Hop, C.E.; Haddad, S. In vitro-in vivo extrapolation of clearance: Modeling hepatic metabolic clearance of highly bound drugs and comparative assessment with existing calculation methods. J. Pharm. Sci. 2012, 101, 838–851. [Google Scholar] [CrossRef] [PubMed]
  73. Umehara, K.-I.; Camenisch, G. Novel in Vitro-In Vivo Extrapolation (IVIVE) Method to Predict Hepatic Organ Clearance in Rat. Pharm. Res. 2011, 29, 603–617. [Google Scholar] [CrossRef] [PubMed]
  74. Roots, I.; Gerloff, T.; Meisel, C.; Kirchheiner, J.; Goldammer, M.; Kaiser, R.; Laschinski, G.; Brockmöller, J.; Cascorbi, I.; Kleeberg, U.; et al. Pharmacogenetics-Based New Therapeutic Concepts. Drug Metab. Rev. 2004, 36, 617–638. [Google Scholar] [CrossRef] [PubMed]
  75. Achour, B.; Barber, J.; Rostami-Hodjegan, A. Expression of hepatic drug-metabolizing cytochrome p450 enzymes and their intercorrelations: A meta-analysis. Drug Metab. Dispos. 2014, 42, 1349–1356. [Google Scholar] [CrossRef] [PubMed]
  76. Snawder, J.E.; Lipscomb, J.C. Interindividual variance of cytochrome P450 forms in human hepatic microsomes: Correlation of individual forms with xenobiotic metabolism and implications in risk assessment. Regul. Toxicol. Pharm. 2000, 32, 200–209. [Google Scholar] [CrossRef] [PubMed]
  77. Rostami-Hodjegan, A.; Tucker, G.T. Simulation and prediction of in vivo drug metabolism in human populations from in vitro data. Nat. Rev. Drug Discov. 2007, 6, 140–148. [Google Scholar] [CrossRef] [PubMed]
  78. Barter, Z.E.; Bayliss, M.K.; Beaune, P.H.; Boobis, A.R.; Carlile, D.J.; Edwards, R.J.; Brian Houston, J.; Lake, B.G.; Lipscomb, J.C.; Pelkonen, O.R.; et al. Scaling Factors for the Extrapolation of in Vivo Metabolic Drug Clearance from In Vitro Data: Reaching a Consensus on Values of Human Micro-somal Protein and Hepatocellularity Per Gram of Liver. Curr. Drug Metab. 2007, 8, 33–45. [Google Scholar] [CrossRef] [PubMed]
  79. Barter, Z.E.; Chowdry, J.E.; Harlow, J.R.; Snawder, J.E.; Lipscomb, J.C.; Rostami-Hodjegan, A. Covariation of human microsomal protein per gram of liver with age: Absence of influence of operator and sample storage may justify interlaboratory data pooling. Drug Metab. Dispos. 2008, 36, 2405–2409. [Google Scholar] [CrossRef] [PubMed]
  80. Chen, Y.; Liu, L.; Nguyen, K.; Fretland, A.J. Utility of intersystem extrapolation factors in early reaction phenotyping and the quantitative extrapolation of human liver microsomal intrinsic clearance using recombinant cytochromes P450. Drug Metab. Dispos. 2011, 39, 373–382. [Google Scholar] [CrossRef] [PubMed]
  81. Venkatakrishnan, K.; von Moltke, L.L.; Court, M.H.; Harmatz, J.S.; Crespi, C.L.; Greenblatt, D.J. Comparison between Cytochrome P450 (CYP) Content and Relative Activity Approaches to Scaling from cDNA-Expressed CYPs to Human Liver Microsomes: Ratios of Accessory Proteins as Sources of Discrepancies between the Approaches. Drug Metab. Dispos. 2000, 28, 1493–1504. [Google Scholar]
  82. Burczynski, F.J.; Wang, G.Q.; Elmadhoun, B.; She, Y.M.; Roberts, M.S.; Standing, K.G. Hepatocyte [3H]-palmitate uptake: Effect of albumin surface charge modification. Can. J. Physiol. Pharm. 2001, 79, 868–875. [Google Scholar] [CrossRef]
  83. Poulin, P.; Haddad, S. Toward a new paradigm for the efficient in vitro-in vivo extrapolation of metabolic clearance in humans from hepatocyte data. J. Pharm. Sci. 2013, 102, 3239–3251. [Google Scholar] [CrossRef] [PubMed]
  84. Poulin, P.; Hop, C.E.; Ho, Q.; Halladay, J.S.; Haddad, S.; Kenny, J.R. Comparative assessment of In Vitro-In Vivo extrapolation methods used for predicting hepatic metabolic clearance of drugs. J. Pharm. Sci. 2012, 101, 4308–4326. [Google Scholar] [CrossRef]
  85. Hallifax, D.; Houston, J.B. Evaluation of hepatic clearance prediction using in vitro data: Emphasis on fraction unbound in plasma and drug ionisation using a database of 107 drugs. J. Pharm. Sci. 2012, 101, 2645–2652. [Google Scholar] [CrossRef]
  86. Shitara, Y.; Sato, H.; Sugiyama, Y. Evaluation of drug-drug interaction in the hepatobiliary and renal transport of drugs. Annu. Rev. Pharm. Toxicol. 2005, 45, 689–723. [Google Scholar] [CrossRef] [PubMed]
  87. Wu, C.-Y.; Benet, L.Z. Predicting Drug Disposition via Application of BCS: Transport/Absorption/Elimination Interplay and Development of a Biopharmaceutics Drug Disposition Classification System. Pharm. Res. 2005, 22, 11–23. [Google Scholar] [CrossRef] [PubMed]
  88. Kenyon, E.M. Computational Toxicology: Methods in Molecular Biology; Humana Press: Totowa, NJ, USA, 2012; Volume 1, pp. 501–520. [Google Scholar]
  89. Mahmood, I.; Balian, J.D. Interspecies scaling: Predicting pharmacokinetic parameters of antiepileptic drugs in humans from animals with special emphasis on clearance. J. Pharm. Sci. 1996, 85, 411–414. [Google Scholar] [CrossRef] [PubMed]
  90. Tang, H.; Hussain, A.; Leal, M.; Mayersohn, M.; Fluhler, E. Interspecies prediction of human drug clearance based on scaling data from one or two animal species. Drug Metab. Dispos. 2007, 35, 1886–1893. [Google Scholar] [CrossRef] [PubMed]
  91. Boxenbaum, H. Interspecies pharmacokinetic scaling and the evolutionary-comparative paradigm. Drug Metab. Rev. 1984, 15, 1071–1121. [Google Scholar] [CrossRef] [PubMed]
  92. Goteti, K.; Brassil, P.J.; Good, S.S.; Garner, C.E. Estimation of human drug clearance using multiexponential techniques. J. Clin. Pharm. 2008, 48, 1226–1236. [Google Scholar] [CrossRef]
  93. Lave, T.; Dupin, S.; Schmitt, C.; Chou, R.C.; Jaeck, D.; Coassolo, P. Integration of in vitro data into allometric scaling to predict hepatic metabolic clearance in man: Application to 10 extensively metabolized drugs. J. Pharm. Sci. 1997, 86, 584–590. [Google Scholar] [CrossRef]
  94. Hosea, N.A.; Collard, W.T.; Cole, S.; Maurer, T.S.; Fang, R.X.; Jones, H.; Kakar, S.M.; Nakai, Y.; Smith, B.J.; Webster, R.; et al. Prediction of human pharmacokinetics from preclinical information: Comparative accuracy of quantitative prediction approaches. J. Clin. Pharm. 2009, 49, 513–533. [Google Scholar] [CrossRef]
  95. Ito, K.; Houston, J.B. Prediction of Human Drug Clearance from in Vitro and Preclinical Data Using Physiologically Based and Empirical Approaches. Pharm. Res. 2005, 22, 103–112. [Google Scholar] [CrossRef]
  96. Nagilla, R.; Ward, K.W. A comprehensive analysis of the role of correction factors in the allometric predictivity of clearance from rat, dog, and monkey to humans. J. Pharm. Sci. 2004, 93, 2522–2534. [Google Scholar] [CrossRef]
  97. Tang, H.; Mayersohn, M. A novel model for prediction of human drug clearance by allometric scaling. Drug Metab. Dispos. 2005, 33, 1297–1303. [Google Scholar] [CrossRef] [PubMed]
  98. Wajima, T.; Fukumura, K.; Yano, Y.; Oguma, T. Prediction of human clearance from animal data and molecular structural parameters using multivariate regression analysis. J. Pharm. Sci. 2002, 91, 2489–2499. [Google Scholar] [CrossRef] [PubMed]
  99. Wajima, T.; Fukumura, K.; Yano, Y.; Oguma, T. Prediction of human pharmacokinetics from animal data and molecular structural parameters using multivariate regression analysis: Oral clearance. J. Pharm. Sci. 2003, 92, 2427–2440. [Google Scholar] [CrossRef] [PubMed]
  100. Sacher, G.A. Relation of lifespan to brain weight and body weight in mammals. In CIBA Foundation Colloquia on Ageing, Volume 5: The Lifespan of Animals; Little, Brown and Company: Boston, MA, USA, 1959; pp. 115–133. [Google Scholar]
  101. Mahmood, I. The correction factors do help in improving the prediction of human clearance from animal data. J. Pharm. Sci. 2005, 94, 940–945. [Google Scholar] [CrossRef] [PubMed]
  102. Mahmood, I. Prediction of Clearance in Humans from In Vitro Human Liver Microsomes and Allometric Scaling. A Comparative Study of the Two Approaches. Drug Metab. Drug Interact. 2002, 19, 49–64. [Google Scholar] [CrossRef]
  103. Mahmood, I. Interspecies scaling: Predicting oral clearance in humans. Am. J. Ther. 2002, 9, 35–42. [Google Scholar] [CrossRef] [PubMed]
  104. Mahmood, I. Interspecies scaling: Role of protein binding in the prediction of clearance from animals to humans. J. Clin. Pharm. 2000, 40 Pt 2, 1439–1446. [Google Scholar]
  105. Mahmood, I.; Balian, J.D. Interspecies scaling: Predicting clearance of drugs in humans. Three different approaches. Xenobiotica 1996, 26, 887–895. [Google Scholar] [CrossRef]
  106. Mahmood, I. Prediction of human drug clearance from animal data: Application of the rule of exponents and ‘fu Corrected Intercept Method’ (FCIM). J. Pharm. Sci. 2006, 95, 1810–1821. [Google Scholar] [CrossRef]
  107. Shiran, M.R.; Proctor, N.J.; Howgate, E.M.; Rowland-Yeo, K.; Tucker, G.T.; Rostami-Hodjegan, A. Prediction of metabolic drug clearance in humans: In vitro-in vivo extrapolation vs allometric scaling. Xenobiotica 2006, 36, 567–580. [Google Scholar] [CrossRef]
  108. Mahmood, I.; Balian, J.D. Interspecies scaling: A comparative study for the prediction of clearance and volume using two or more than two species. Life Sci. 1996, 59, 579–585. [Google Scholar] [CrossRef]
  109. Guidance for Industry: M3(R2) Nonclinical Safety Studies for the Conduct of Human Clinical Trials and Marketing Authorization for Pharmaceuticals; U.S. Department of Health and Human Services, Food and Drug Administration (FDA), Center for Drug Evaluation and Research (CDER): Rockville, MD, USA, 2010.
  110. Mahmood, I.; Sahajwalla, C. Interspecies scaling of biliary excreted drugs. J. Pharm. Sci. 2002, 91, 1908–1914. [Google Scholar] [CrossRef]
  111. Callan, W.; Sunderman, F., Jr. Species variations in binding of 63 NI (II) by serum albumin. Res. Commun. Mol. Pathol. Pharm. 1973, 5, 459. [Google Scholar]
  112. Chiou, W.L.; Hsu, F.H. Correlation of Unbound Plasma Clearances of Fifteen Extensively Metabolized Drugs Between Humans and Rats. Pharm. Res. 1988, 05, 668–672. [Google Scholar] [CrossRef]
  113. Ring, B.J.; Chien, J.Y.; Adkison, K.K.; Jones, H.M.; Rowland, M.; Jones, R.D.; Yates, J.W.; Ku, M.S.; Gibson, C.R.; He, H.; et al. PhRMA CPCDC initiative on predictive models of human pharmacokinetics, part 3: Comparative assessement of prediction methods of human clearance. J. Pharm. Sci. 2011, 100, 4090–4110. [Google Scholar] [CrossRef] [PubMed]
  114. Mahmood, I. Interspecies Scaling: Predicting Volumes, Mean Residence Time and Elimination Half-life.* Some Suggestions. J. Pharm. Pharm. 1998, 50, 493–499. [Google Scholar] [CrossRef]
  115. Mahmood, I. Application of allometric principles for the prediction of pharmacokinetics in human and veterinary drug development. Adv. Drug Deliv. Rev. 2007, 59, 1177–1192. [Google Scholar] [CrossRef] [PubMed]
  116. Berry, L.M.; Li, C.; Zhao, Z. Species differences in distribution and prediction of human V(ss) from preclinical data. Drug Metab. Dispos. 2011, 39, 2103–2116. [Google Scholar] [CrossRef]
  117. Sawada, Y.; Hanano, M.; Sugiyama, Y.; Iga, T. Prediction of the disposition of nine weakly acidic and six weakly basic drugs in humans from pharmacokinetic parameters in rats. J. Pharm. Biopharm. 1985, 13, 477–492. [Google Scholar] [CrossRef]
  118. Sawada, Y.; Hanano, M.; Sugiyama, Y.; Iga, T. Prediction of the disposition ofβ-lactam antibiotics in humans from pharmacokinetic parameters in animals. J. Pharm. Biopharm. 1984, 12, 241–261. [Google Scholar] [CrossRef]
  119. Oie, S.; Tozer, T.N. Effect of altered plasma protein binding on apparent volume of distribution. J. Pharm. Sci. 1979, 68, 1203–1205. [Google Scholar] [CrossRef] [PubMed]
  120. Obach, R.S.; Baxter, J.G.; Liston, T.E.; Silber, B.M.; Jones, B.C.; Macintyre, F.; Rance, D.J.; Wastall, P. The Prediction of Human Pharmacokinetic Parameters from Preclinical and In Vitro Metabolism Data. J. Pharm. Exp. 1997, 283, 46–58. [Google Scholar]
  121. Bachmann, K.; Pardoe, D.; White, D. Scaling basic toxicokinetic parameters from rat to man. Environ. Health Perspect. 1996, 104, 400–407. [Google Scholar] [CrossRef]
  122. Wajima, T.; Fukumura, K.; Yano, Y.; Oguma, T. Prediction of human pharmacokinetics from animal data and molecular structural parameters using multivariate regression analysis: Volume of distribution at steady state. J. Pharm. Pharm. 2003, 55, 939–949. [Google Scholar] [CrossRef] [PubMed]
  123. Liu, D.; Ma, X.; Liu, Y.; Zhou, H.; Shi, C.; Wu, F.; Jiang, J.; Hu, P. Quantitative prediction of human pharmacokinetics and pharmacodynamics of imigliptin, a novel DPP-4 inhibitor, using allometric scaling, IVIVE and PK/PD modeling methods. Eur. J. Pharm. Sci. 2016, 89, 73–82. [Google Scholar] [CrossRef]
  124. Winiwarter, S.; Bonham, N.M.; Ax, F.; Hallberg, A.; Lennernas, H.; Karlen, A. Correlation of human jejunal permeability (in vivo) of drugs with experimentally and theoretically derived parameters. A multivariate data analysis approach. J. Med. Chem. 1998, 41, 4939–4949. [Google Scholar] [CrossRef]
  125. Sun, D.; Lennernas, H.; Welage, L.S.; Barnett, J.L.; Landowski, C.P.; Foster, D.; Fleisher, D.; Lee, K.D.; Amidon, G.L. Comparison of human duodenum and Caco-2 gene expression profiles for 12,000 gene sequences tags and correlation with permeability of 26 drugs. Pharm. Res. 2002, 19, 1400–1416. [Google Scholar] [CrossRef] [PubMed]
  126. Sinko, P.J.; Leesman, G.D.; Amidon, G.L. Predicting Fraction Dose Absorbed in Humans Using a Macroscopic Mass Balance Approach. Pharm. Res. 1991, 8, 979–988. [Google Scholar] [CrossRef]
  127. Usansky, H.H.; Sinko, P.J. Estimating human drug oral absorption kinetics from Caco-2 permeability using an absorption-disposition model: Model development and evaluation and derivation of analytical solutions for k(a) and F(a). J. Pharm. Exp. 2005, 314, 391–399. [Google Scholar] [CrossRef]
  128. Yu, L.X.; Amidon, G.L. A compartmental absorption and transit model for estimating oral drug absorption. Int. J. Pharm. 1999, 186, 119–125. [Google Scholar] [CrossRef]
  129. Lennernäs, H.; Ahrenstedt, Ö.; Hällgren, R.; Knutson, L.; Ryde, M.; Paalzow, L.K. Regional Jejunal Perfusion, a New in Vivo Approach to Study Oral Drug Absorption in Man. Pharm. Res. 1992, 9, 1243–1251. [Google Scholar] [CrossRef] [PubMed]
  130. Yu, L.X.; Crison, J.R.; Amidon, G.L. Compartmental transit and dispersion model analysis of small intestinal transit flow in humans. Int. J. Pharm. 1996, 140, 111–118. [Google Scholar] [CrossRef]
  131. Mukkavilli, R.; Pinjari, J.; Patel, B.; Sengottuvelan, S.; Mondal, S.; Gadekar, A.; Verma, M.; Patel, J.; Pothuri, L.; Chandrashekar, G.; et al. In vitro metabolism, disposition, preclinical pharmacokinetics and prediction of human pharmacokinetics of DNDI-VL-2098, a potential oral treatment for Visceral Leishmaniasis. Eur. J. Pharm. Sci. 2014, 65, 147–155. [Google Scholar] [CrossRef] [PubMed]
Figure 1. The perfusion model including one reservoir and one clearing organ. In this model, Q refers to the rate of perfusate or blood flow. Cin is the drug concentration in the artery entering the reservoir and clearing organ. Cout denotes the drug concentration in veins leaving the clearing organ and entering the reservoir, which is a non-clearing organ. VE and VR indicate the volume of clearing organ and reservoir, respectively. The elimination process is followed by first-order kinetics and its elimination constant is represented by kel. CE is the drug concentration in the clearing organ.
Pharmaceutics 11 00168 g001
Figure 2. The scheme of the overall in vitro-in vivo extrapolation (IVIVE) process using human liver microsomes or recombinant human cytochrome P450 (CYP) system. MPPGL refers to the microsomal protein per gram of liver.
Pharmaceutics 11 00168 g002
Table 1. Four hepatic clearance models.
ModelScheme 1CLH 2ERH
Well-stirred Pharmaceutics 11 00168 i001 Q H · CL int , H · f p Q H + CL int , H · f p CL int , H · f p Q H + CL int , H · f p
Parallel tube Pharmaceutics 11 00168 i002 Q H · 1 e f p · CL int , H Q H 1 e f p · CL int , H Q H
Distributed Pharmaceutics 11 00168 i003 Q H · 1 e f p · CL int , H   Q H + 1 2 · ε 2 f p · CL int ,   H Q H 2 1 e f p · CL int , H Q H + 1 2 · ε 2 f p · CL int , H Q H 2
Dispersion Pharmaceutics 11 00168 i004 Q H · 1 4 a 1 + a 2 · e a 1 2 D N 1 a 2 · e a + 1 2 D N 1 4 a 1 + a 2 · e a 1 2 D N 1 a 2 · e a + 1 2 D N
1 Dotted line indicates the concentration–distance profile within liver. 2 Where QH is hepatic liver flow expressed as a unit of mL/min/kg.
Table 2. Mathematical equations of the IVIVE approach for prediction of clearance from in vitro data.
Equation Comment *Ref.
CL int , i n   v i t r o = V max K m = rate   of   metabolism C E (38)Basic principle of IVIVE was suggested
Provide the 4 stages for the IVIVE
[60]
CL H , i n   v i v o = Q H · f b · CL int , i n   v i v o Q H + f b · CL int , in   vivo   or   CL int = CL H f b 1 E (39)
CL int . i n   v i t r o = Initial   amount   in   the   incubation AUC i n   v i t r o (40)Empirically the scaling factor (SF) was estimated as the value of 8.9
Predicted ERH and observed ERH are ERH, pred and ERH, obs, respectively
Provide criteria for the classification of the drugs into: low extraction, ERH < 0.3; intermediate, 0.3 < ERH < 0.7; high extraction, ERH > 0.7
[61]
ER H , pred = SF · CL int , i n   v i t r o Q H + SF · CL int , i n   v i t r o (41)
ER H , obs = CL Q H (42)
CL int , H , human = 0.693 i n   v i t r o   t 1 / 2 · mL   incubation mg   microsomes · 45   mg   microsomes g   liver · 20   mg   liver kg   body   weight (43)Investigation of the effect of the protein binding into the plasma and microsomes
The ISTD refers to the internal standard
[62]
f u , mic = drug ISTD peak   height   ratio   in   buffer   sample 2 · drug ISTD peak   height   ratio   in   microsome   sample (44)
CL int , H , pred . = CL int , i n   v i t r o · animal   scaling   factor (45)Animal scaling factor was incorporated into IVIVE[66]
Animal   Scaling   factor = CL int , H , i n   v i v o CL int , i n   v i t r o (46)
f u , mic = unchanged   compound   concentration   in   buffer unchanged   compound   concentration   in   microsome (47)
CL int , i n   v i v o , pred = CL int , i n   v i t r o · MPR = V max K M · MPR (48)Microsomal protein recovery (MPR) ratio was incorporated in IVIVE
RB/P refers to blood to plasma ratio
[67]
MPR   mg   protein / g   liver = Liver   homogenate   CYP   content   nmol / g   liver Microsomal   CYP   content   nmol / mg   protein (49)
CL int . i n   v i v o , obs = CL f p · R B / P (50)
P 450   content   correcting   factor = P 450   isozyme   content / g   liver P 450   isozyme   content / mg   protein (51)CYP abundance was incorporated in IVIVE[68]
RAF = V max HML V max rhCYP (52)Relative activity factor (RAF) introduced for scaling rhCYP data to HLM
Modified RAF taking into account of Km
[69,70]
RAF = CL int HML CL int rhCYP (53)
CL int = [ j = 1 n i = 1 n V max rhCYP j i × RAF ij V max K m rhCYP j i ] × MPPGL × Liver   weight (54)
ISEF = V max ji HML V max i rhCYP j × CYP j abundance   HLM (55)Inter-system extrapolation factor (ISEF) is introduced for scaling rhCYP data to HLM[69]
CL int = [ j = 1 n i 1 n V max i rhCYP j × CYP j   abundance K m rhCYP j i ] × MPPGL × Liver   weight (56)
CL H = R B / P · Q H · CL int , liver , human · f p · F I R B / P · Q H + CL int , liver , human · f p · F I (57)The ionization factor is incorporated into the IVIVE
FI is an ionization factor
Subscript letter IW denotes intracellular water
Upper letter i and n indicate compounds of ionized and neutral forms, respectively
[71]
F I = f p n f IW n = 1 f p i 1 f IW i (58)
f acid i = A AH 0 = 1 1 + 10 p K a pH (59)
f base i = BH + B 0 = 1 1 + 10 pH p K a (60)
CL H = Q H · CL int , liver , human · f u , liver / f u , mic Q H + CL int , liver , human · f u , liver / f u , mic (61)The unbound fraction into the liver (fu,liver) is incorporated into the IVIVE
Plasma to whole liver concentration ratio (PLR) = 13.3
[72]
f u , liver = PLR · f u , p , app 1 + PLR 1 · f u , p , app (62)
CL int , liver , i n v i t r o = PS uptake , total · CL met + PS bile CL met + PS efflux , total + PS bile (63)Physiologically-based IVIVE model
Total apparent uptake clearance (PSuptake,total) consists of saturable and/or non-saturable processes
CLmet and PSbile refer to metabolic and biliary clearance, respectively
Apparent sinusoidal total efflux clearance from the intracellular side of hepatocytes back into blood (PSefflux, total) consists of saturable and/or non-saturable processes
[73]
CL H = Q H · CL int , liver , i n v i t r o · f p Q H + CL int , liver , i n   v i t r o · f p (64)
fn H = fn sec + fn met (65)Provide the method for the prediction of total clearance and relative elimination contributions
The fnH, fnsec, and fnmet refers to a fractional contribution of hepatic, biliary, and metabolic elimination to overall clearance
PSinf, act and PSinf, pas refer to the sinusoidal active and passive influx clearance, respectively
Sinusoidal efflux from hepatocytes back into blood (PSeff) is assumed to occur via passive diffusion, therefore PSeff = PSinf,pas
CLint,sec and CLint,met refer to intrinsic secretory and metabolic clearance, respectively
PSinf equals to the sum of PSinf,act and PSinf,pas which are determined by suspension of pooled human hepatocytes (unit: mL/min/kg)
[8]
fn H = 1 e 0.01741 PS inf (66)
fn met = 1 e 0.01521 PS inf , pas (67)
CL renal = CL total CL H (68)
CL total = CL H fn H (69)
CL int , i n   v i t r o = PS inf , act + PS inf , pas · CL int , sec + CL int , met PS eff , total + CL int , sec + CL int , met (70)
CL H = Q H · CL int , i n   v i t r o · f p Q H + CL int , i n   v i t r o · f p (71)
* Each comment corresponds to all the equations within each major section of the table defined by horizontal lines.
Table 3. Methods for prediction of clearance (CL) using allometric scaling (AS).
MethodEquationComments *Ref.
Simple AS CL = a W b (74)Select a proper equation by the rule of exponent (ROE)
W and BW represent body and brain weight, respectively
-
AS with MLP 1 CL · MLP = a W b (75)-
AS with BW CL · BW = a W b (76)[89]
Rule of exponentIf the exponent is 0.55 to 0.7,
then use the simple AS, Equation (74)
[90]
If the exponent is 0.71 to 1,
then use the MLP, Equation (75)
If the exponent is more than 1,
then use the BW, Equation (76)
Two-term method CL = θ W a · BW b (77)θ is a constant, which is determined by multiple regression analysis[91]
Multiexponential CL human = aW b + 1 3 2 b 1 1 2 b aW 0.9 (78)The unit of CL is mL/min[92]
Normalized AS CL animal CL int , human CL int , animal = a W b (79)CLint refers the unbound CLint in microsomes or hepatocytes in species and humans[93]
One species AS CL human = CL animal · W human W animal b (80)The exponent b is a constant 0.75, which is physiologically relevant value
(e.g., blood flow, filtration, etc.)
[94,95]
One species AS CL pred = 0.152 · CL rat · W human W rat (81)Predict the CL of bound drug[90]
CL pred = 0.41 · CL dog · W human W dog (82)
CL pred = 0.407 · CL monkey · W human W monkey (83)
Two species AS CL pred = a rat dog · W human 0.628 (84)Predict the CL of bound drug
CL pred = a rat monkey · W human 0.650 (85)
Hepatic liver method CL pred = CL animal · Q H , human Q H , animal (86) [96]
FCIM 2 CL = 33.35 × a Rf u 0.77 (87)Rfu is the fu ratio between rats and humans and a is the coefficient form AS
The unit of CL is mL/min
[97]
QSAR 3 LogCL pred = 0.433 · log ( CL rat ) + 1.0 · log ( CL dog ) 0.00627 · MW + 0.189 · Ha 0.00111 · log ( CL dog ) · MW + 0.0000144 · MW 2 0.0004 · MW · Ha 0.707 (88)The unit of observed and predicted CL value is mL/min/kg[98]
LogCL po , pred = 0.5927 + 0.7386 log CL po , rat + 0.5040 log CL po , dog + 0.06014 clogP 0.1862 log CL po , dog × clogP + 0.02893 MW × clogP + 0.02893 MW × clogP + 0.02551 log CL po , rat × log CL po , rat clogP 0.03029 log CL po , rat × log CL po , dog × Ha 0.03051 log CL po , rat × MW × clogP + 0.08461 log CL po , dog × log CL po , dog × log CL po , dog 0.2510 log CL po , dog × log ( CL po , dog ) × MW + 0.06061 log CL po , dog × log CL po , dog × Ha + 0.04607 log CL po , dog × clogP × clogP 0.003596 clogP × clogP × Ha + 0.0005963 clogP × Ha × Ha (89)The unit of observed and predicted oral CL value is mL/min/kg[99]
* Each comment corresponds to all the equations within each major section of the table defined by horizontal lines. 1 The maximum life-span potential (MLP) is calculated by the equation MPL (years) = 185.4BW0.636W−0.225 [100]. 2 Fraction unbound intercept correction method. 3 Quantitative structure activity relationship (QSAR) consist of physicochemical properties, such as molecular weight (MW), partition coefficient (cLogP), and number of hydrogen-bound acceptors (Ha).
Table 4. Methods for prediction of volume of distribution (Vd).
MethodEquationComment *Ref.
Simple AS V = a W b (93)The prediction of Vd is well predicted equally with using two species in AS [108]
Average fraction unbound in tissue 1 V = V Plasma 1 + R E / I + f u · V P V E V p V R · f u α R (94)It is useful to analyze and predict an alteration in apparent Vd then identify the cause of alteration.
It is particularly useful for drugs with low Vd (<15 L or 0.2 L/kg)
[119]
Proportionality V human ,   pred = V animal · f u ,   human f u ,   animal (95)It is assumed that the volume of distribution at a steady state of free drug is identical between species[120]
One species AS V human ,   pred = 0.35 V rat 0.91 (96)Statistical modeling is applied in this model[121]
QSAR log Vd ss , human = 0.1859 · log Vd ss ,   rat × log Vd ss ,   rat 0.3887 · log Vd ss ,   rat × log MW + 0.3089 · log Vd ss , dog × log MW + 0.003306 · log MW × c log P + 1.71 (97)Vdss, human (mL/kg) is predicted by QSAR modeling with quadratic term descriptors[122]
* Each comment corresponds to all the equations within each major section of the table defined by horizontal lines. 1 Where Vd is apparent volume of distribution, Vplasma is plasma volume, VE is extracellular space minus the plasma, VR is physical volume into which the drug distributes minus the extracellular space, fu is the fraction unbound in plasma, and RE/I is the ratio of distributed albumin in the extravascular space to that in the intravascular space. It is 1.4. αR equals to Cu/CR where Cu is unbound drug concentration at distribution equilibrium and CR is concentration in VR.
Table 5. Methods for prediction of absorption parameters.
MethodEquationComments *Ref.
AS k a = animal   k a × ( W human W animal ) 0.25 (102)The unit of ka is h in time−1[88]
QSAR1 logP eff = 2.883 0.01 PSA + 0.192 logD 5.5 0.239 HBD (103)The choice of model for prediction depends on the availability of descriptor data
Effective permeability in 10−4 cm/s
[124]
logP eff = 2.546 0.011 PSA 0.278 HBD (104)
logP eff = 3.067 + 0.162 clogP 0.01 PSA 0.235 HBD (105)
Use of Caco2 data 2 P eff , human = 0.4926 log P eff , Caco 2 0.1454   at   pH = 7.4 (106)All tested drugs[125]
P eff , human = 0.6532 log P eff , Caco 2 0.3036   at   pH = 6.5 (107)
P eff , human = 0.6836 log P eff , Caco 2 0.5579   at   pH = 7.4 (108)Only passively diffused drugs
P eff , human = 0.7254 log P eff , Caco 2 0.5441   at   pH = 6.5 (109)
P eff , human = 0.4898 log P eff , Caco 2 + 0.3311   at   pH = 7.4 (110)Only carrier-mediated drugs
P eff , human = 0.542 log P eff , Caco 2 + 0.06   at   pH = 6.5 (111)
Sinko et al. 5 k a = 2 P eff R (112)The absorption rate constant is proportional to the Peff[126]
Mechanism based modeling 3 F a , pred = 0.884 F a , exp + 7.47 (113)Fa is expressed as percent unit
The equation is the result of the correlation between Fa,pred and Fa,exp
[127]
k a , eq = P m S V c (114)ka,eq is expressed as the unit of min−1
ka,eq is a key determinant for Fa and can be used as PK modeling
F a = k a , eq k i + k a , eq (115)
Compartmental absorption and transit model 4 F a = 1 1 + 0.54 P eff 7 (116)Fa is expressed as the fractional value.[128]
* Each comment corresponds to all the equations within each major section of the table defined by horizontal lines. 1 In this equation, passive intestinal absorption in humans was predicted. Abbreviations are: Peff, effective permeability; PSA, polar surface area; logD5.5, octanol/water distribution coefficient at pH 5.5; HBD, number of hydrogen bond donors; clogP, calculated logP value. 2, 5 Peff is calculated by the equation of Peff = Q(1-Cout/Cin)/2πRL, where Peff is effective permeability, Q is perfusion rate (mL/min), Cout and Cin are outlet and inlet drug concentration, respectively, R is the radius of human jejunum (1.75 cm) [129], and L is the length of perfusion segment (10 cm). Caco2 permeability and human effective permeability are expressed with values of ×10−6 cm/s and ×10−4 cm/s, respectively. 3 ka,eq is the equilibrium solution for ka, Pm is drug permeability across intestinal mucosa (×10−6 cm/s), S is the absorptive surface area which is set at 200 m2, Vc is the volume of distribution in well-perfused organs, ki is the rate constant of intestinal transit, which is set to be 5.025 × 10⁻³ min−1 as an inverse value of the average transit time [130] in human small intestine (approximately 199 min). 4, 5 Peff is human effective permeability in cm/h.

