Tuning the Transdermal Delivery of Hydroquinone upon Formulation with Novel Permeation Enhancers

 , ,
, ,  , and
, and
Abstract
:
1. Introduction
2. Materials and Methods
2.1. Materials
2.2. Preparation of HQ Formulations (F1–F4)
2.3. Physicochemical Characterisation of HQ Formulations
2.4. Physicochemical Stability Studies
2.5. In Vitro Permeation Studies Using Strat-M® Membranes
2.6. In Vitro Permeation Studies using Healthy Mouse Skin
2.7. Quantification of Drug Amount Trapped in Mouse Skin after In Vitro Permeability Assay
2.8. HPLC Quantification for HQ and pBQ
2.9. Mechanistic Release Models
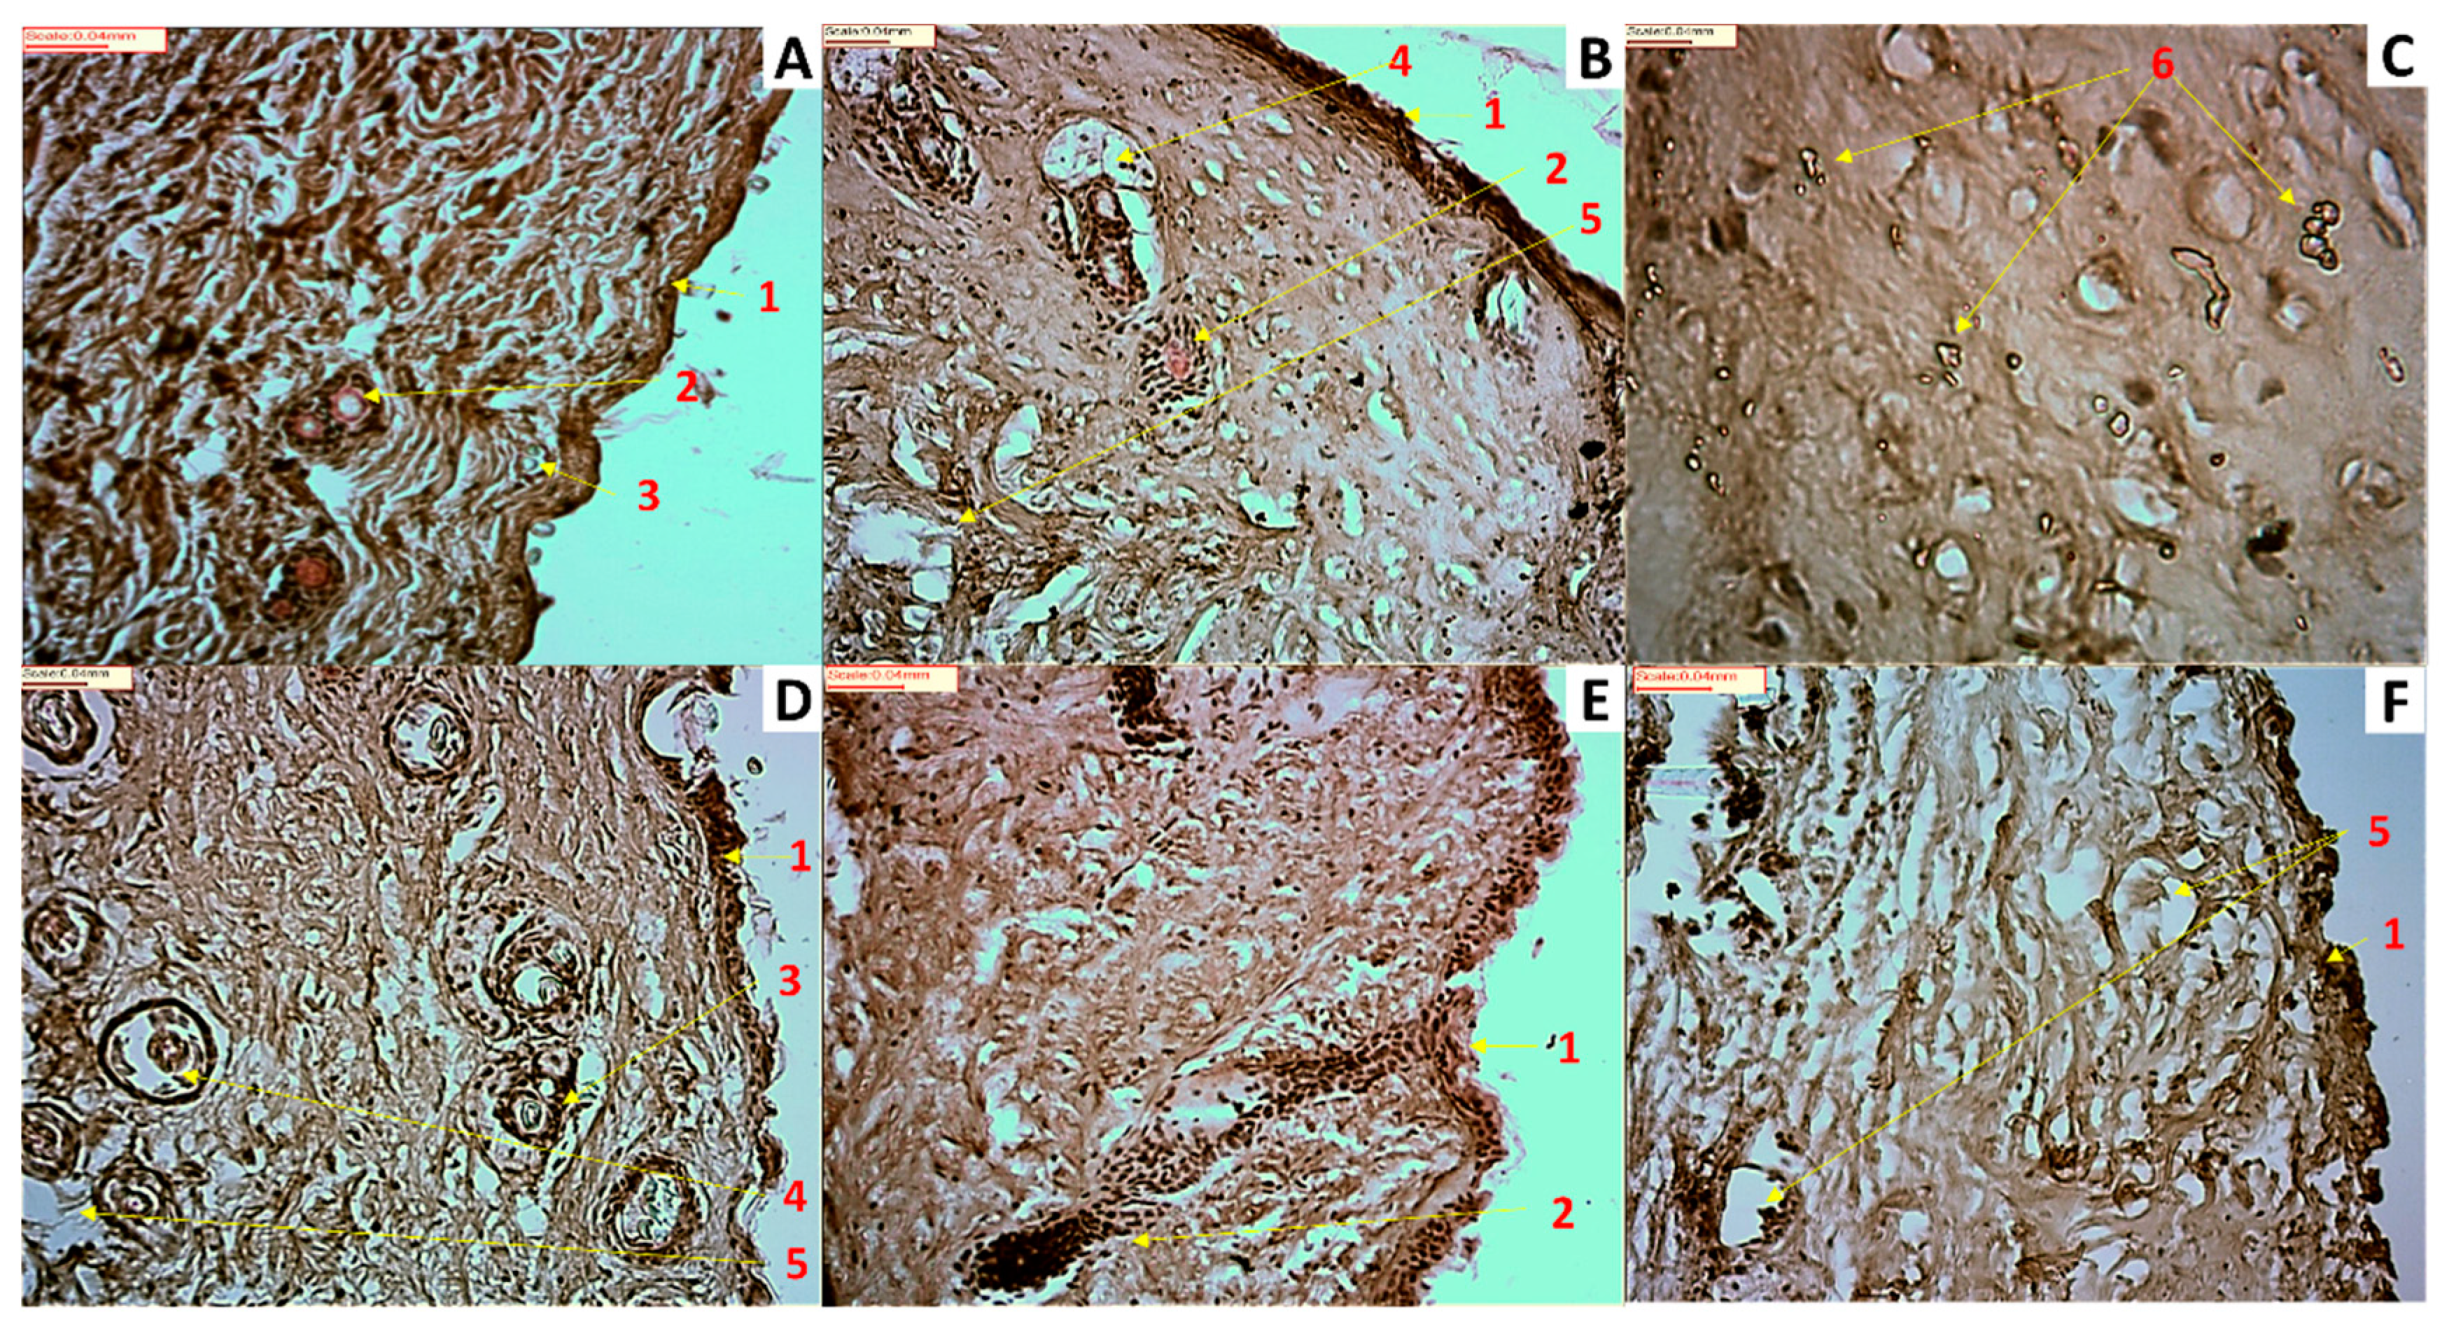
2.10. Skin Histological Analysis after Exposure to HQ Formulations
2.11. Statistical Analysis
3. Results and Discussion
3.1. Characterisation of HQ Formulations
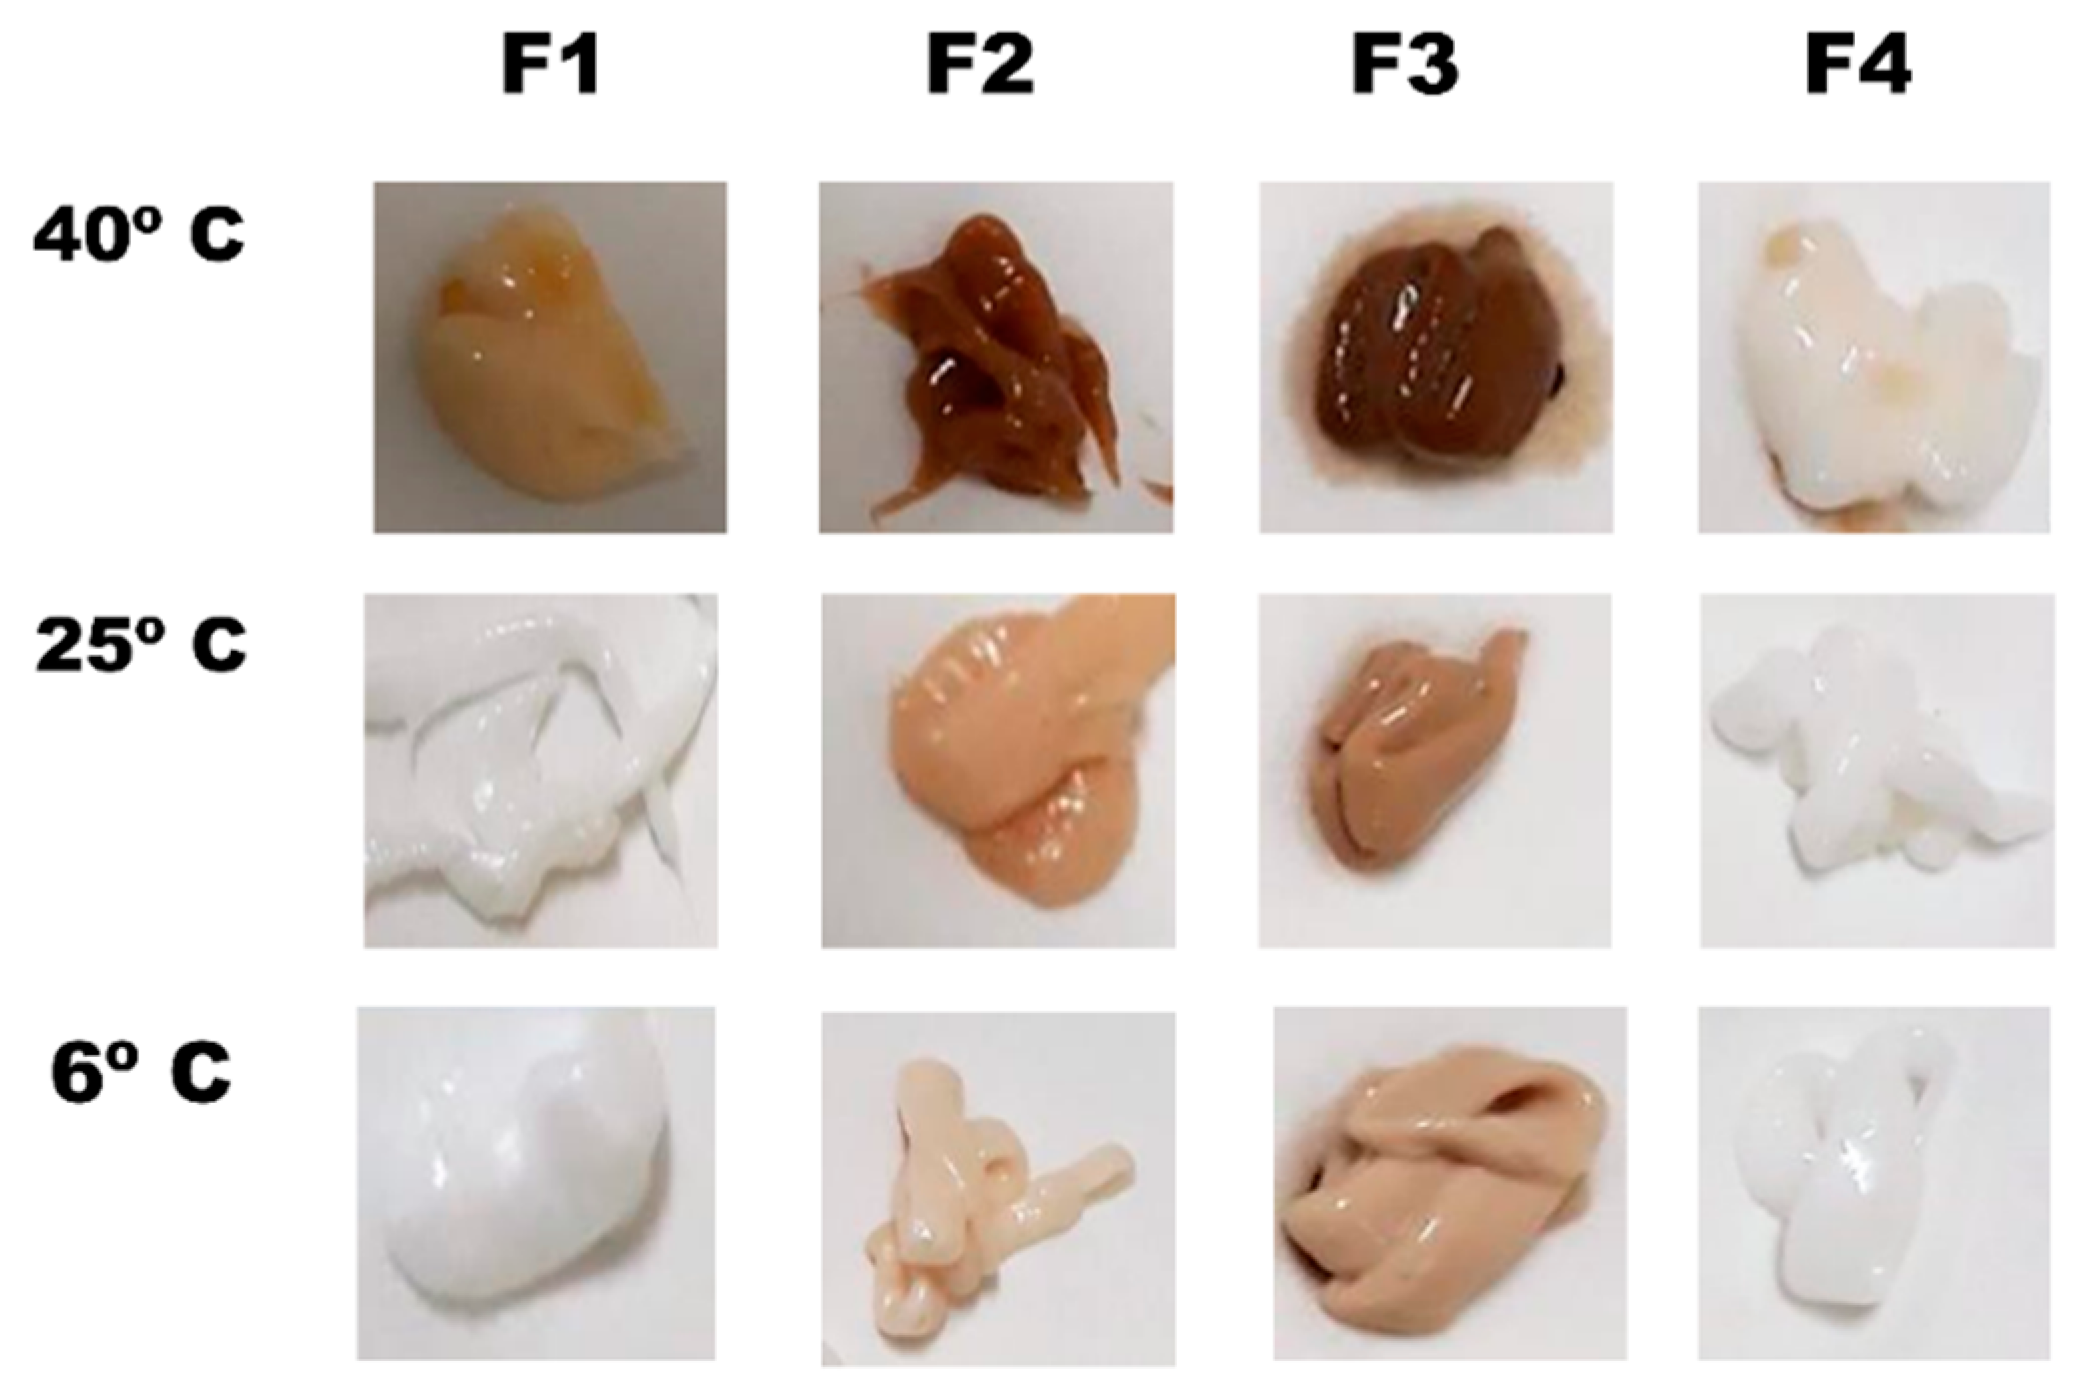
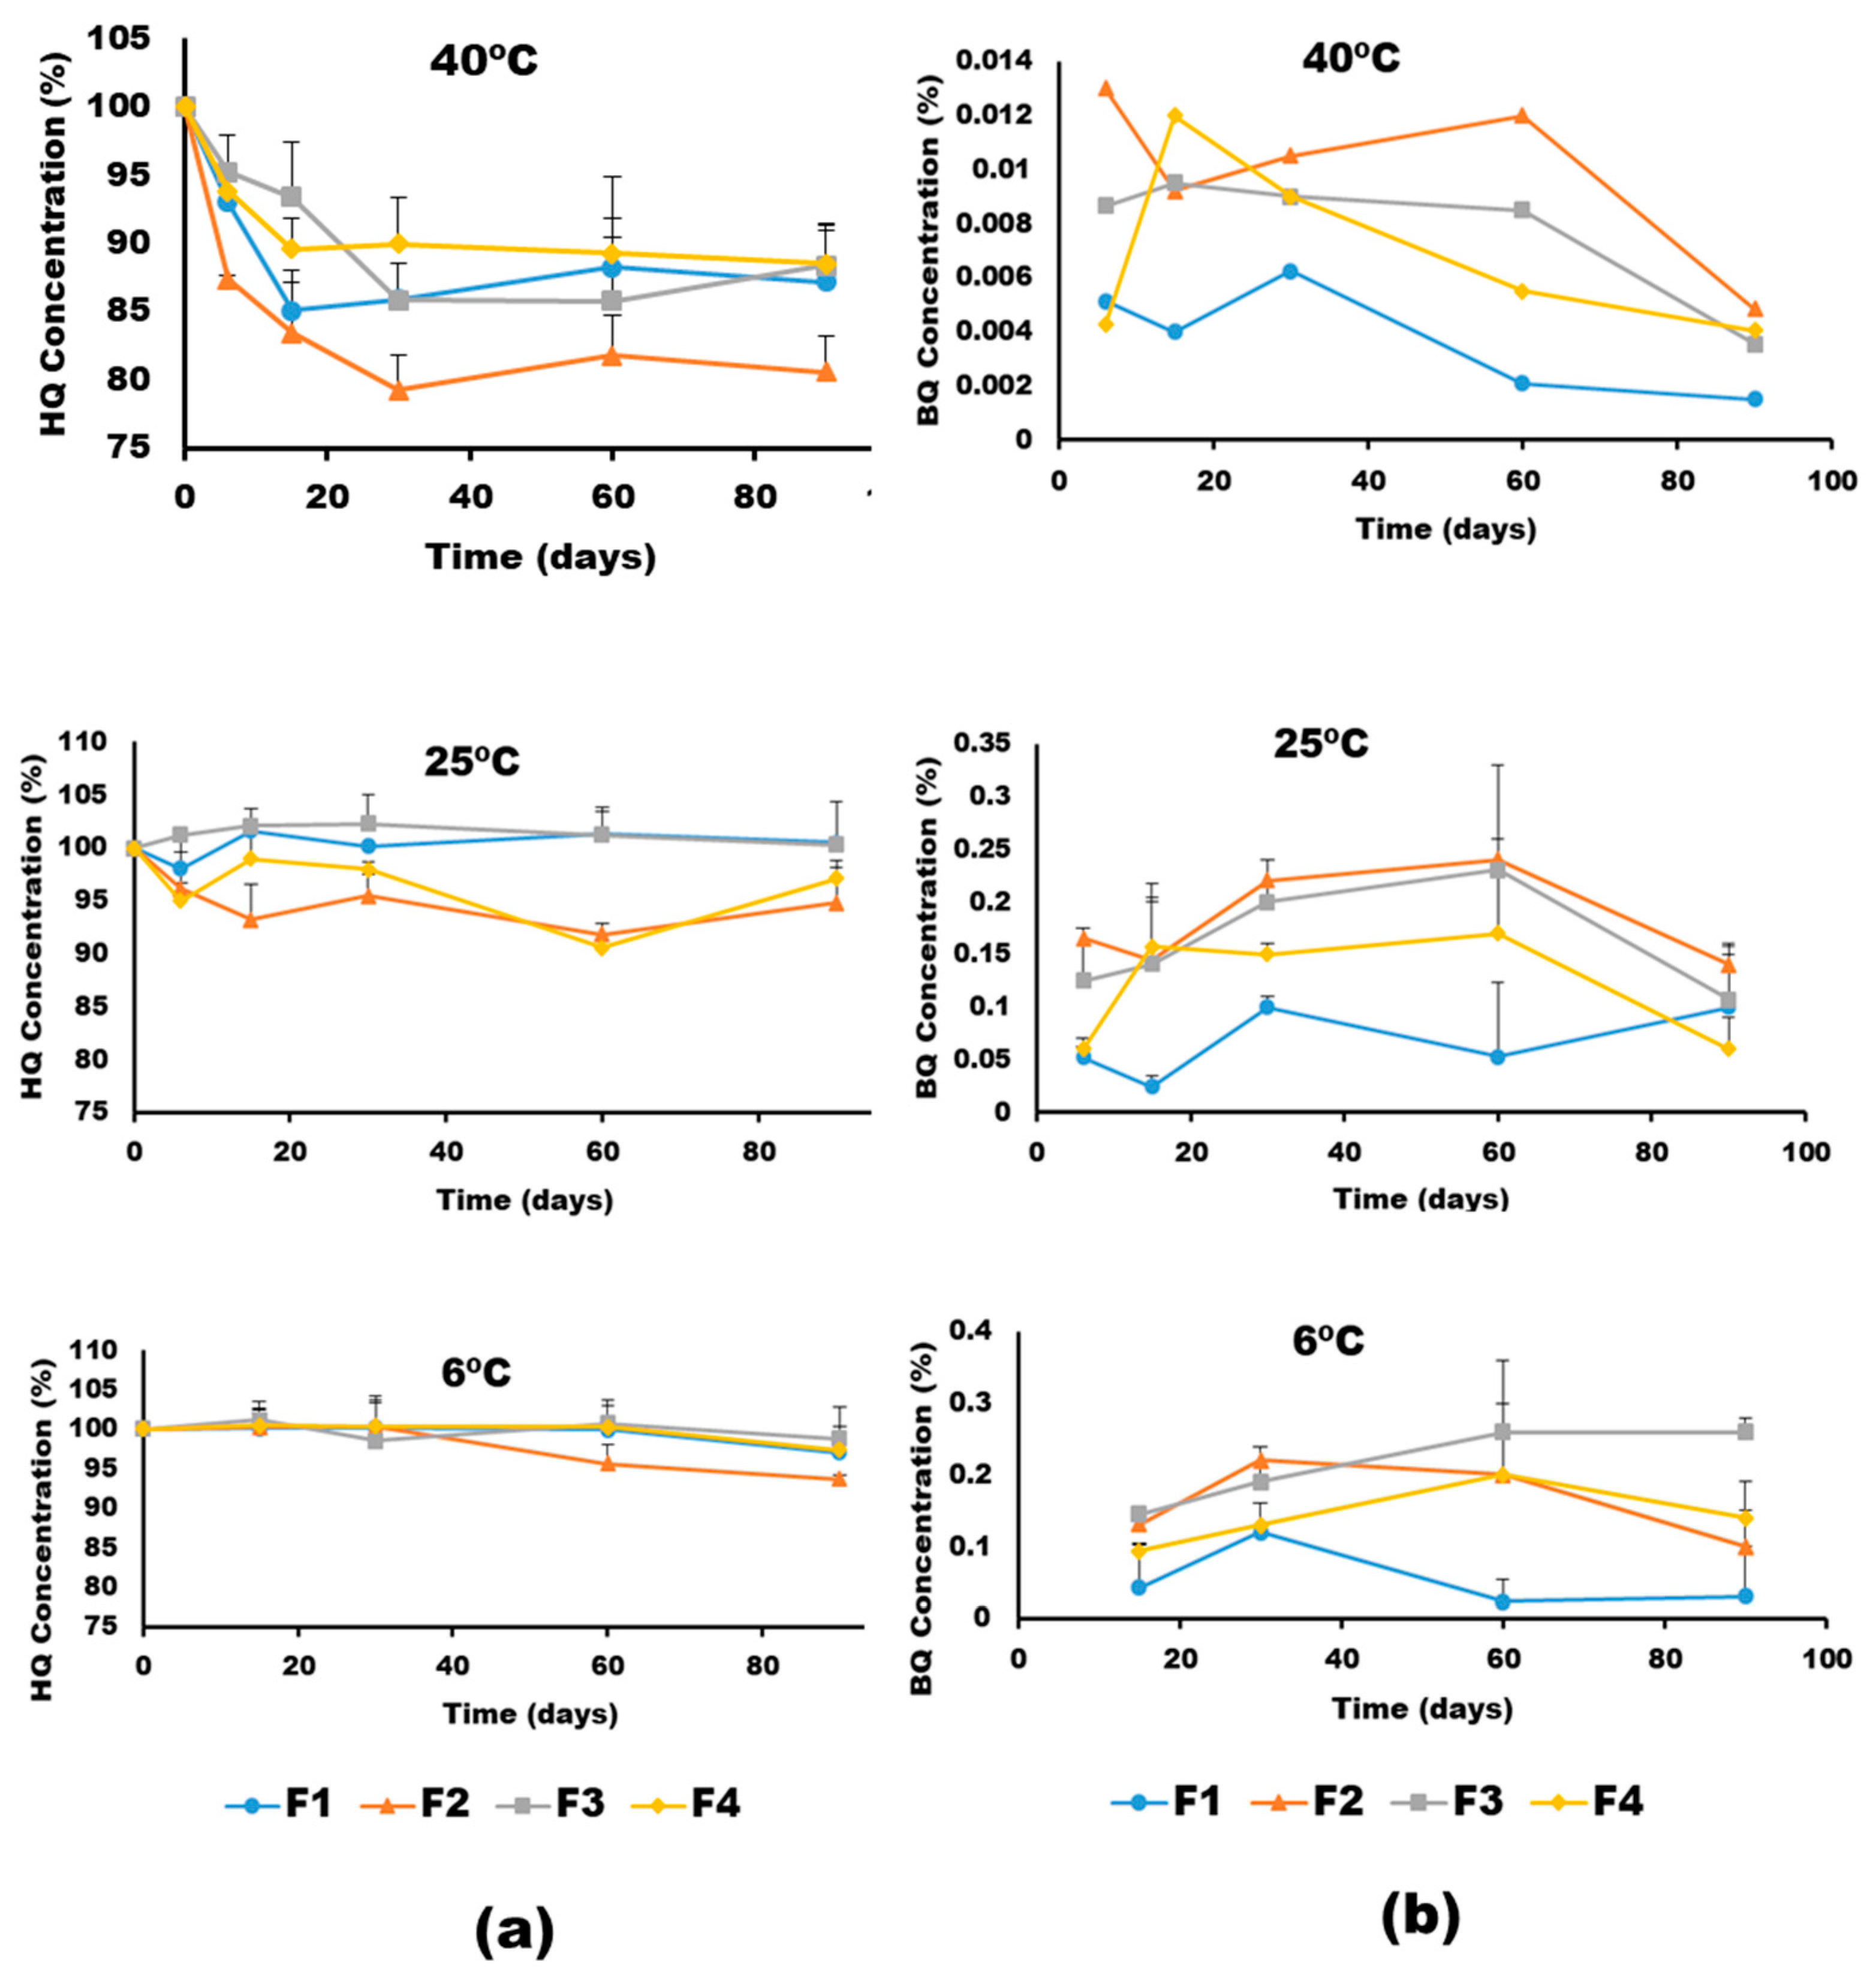
3.2. Physical and Chemical Stability
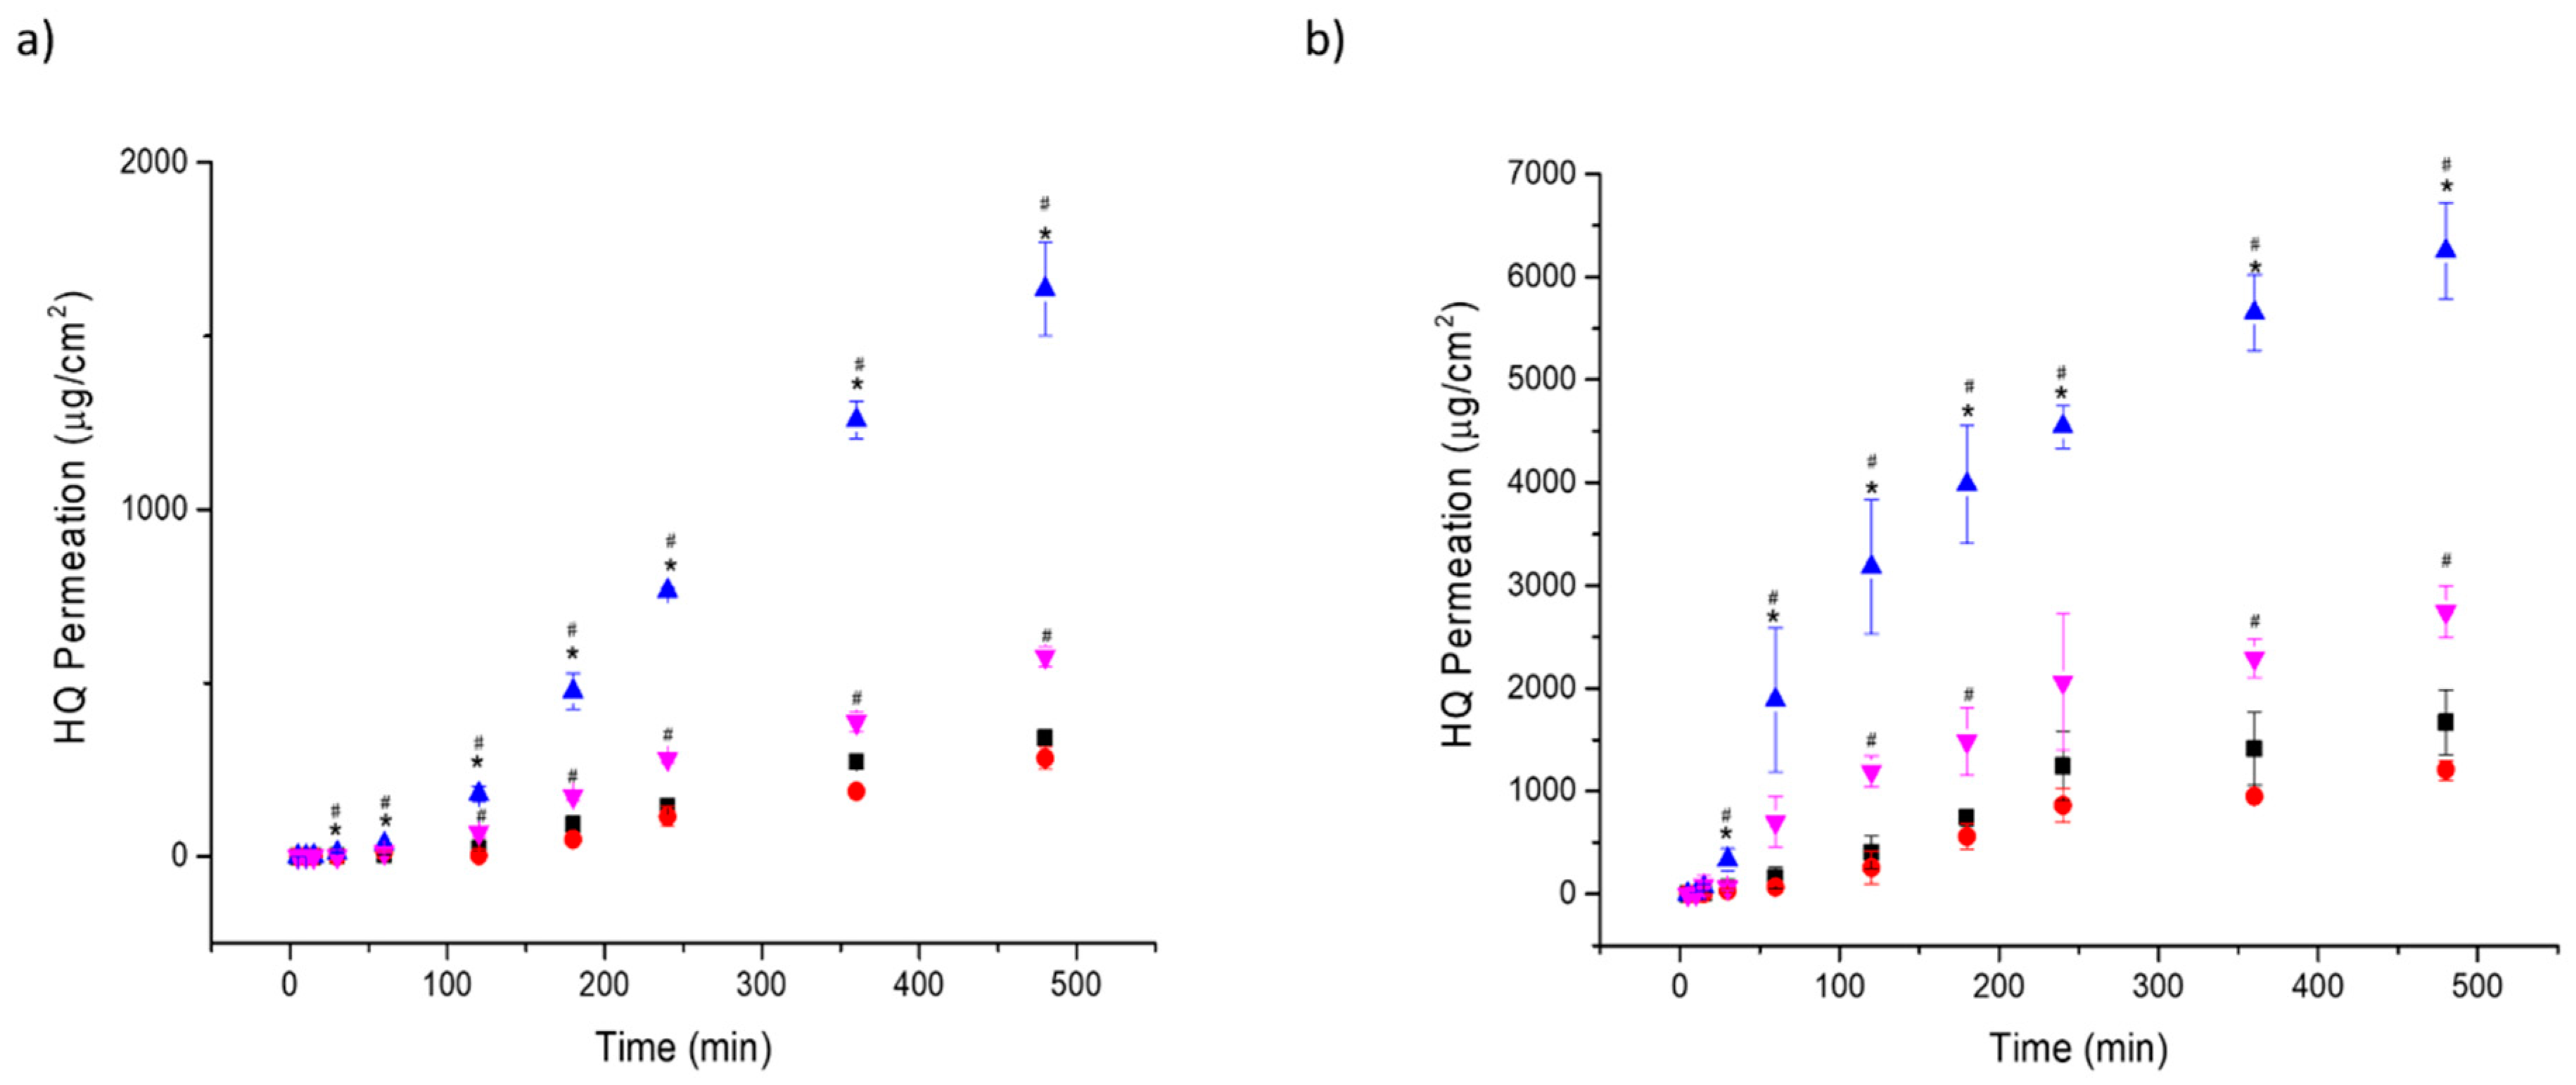
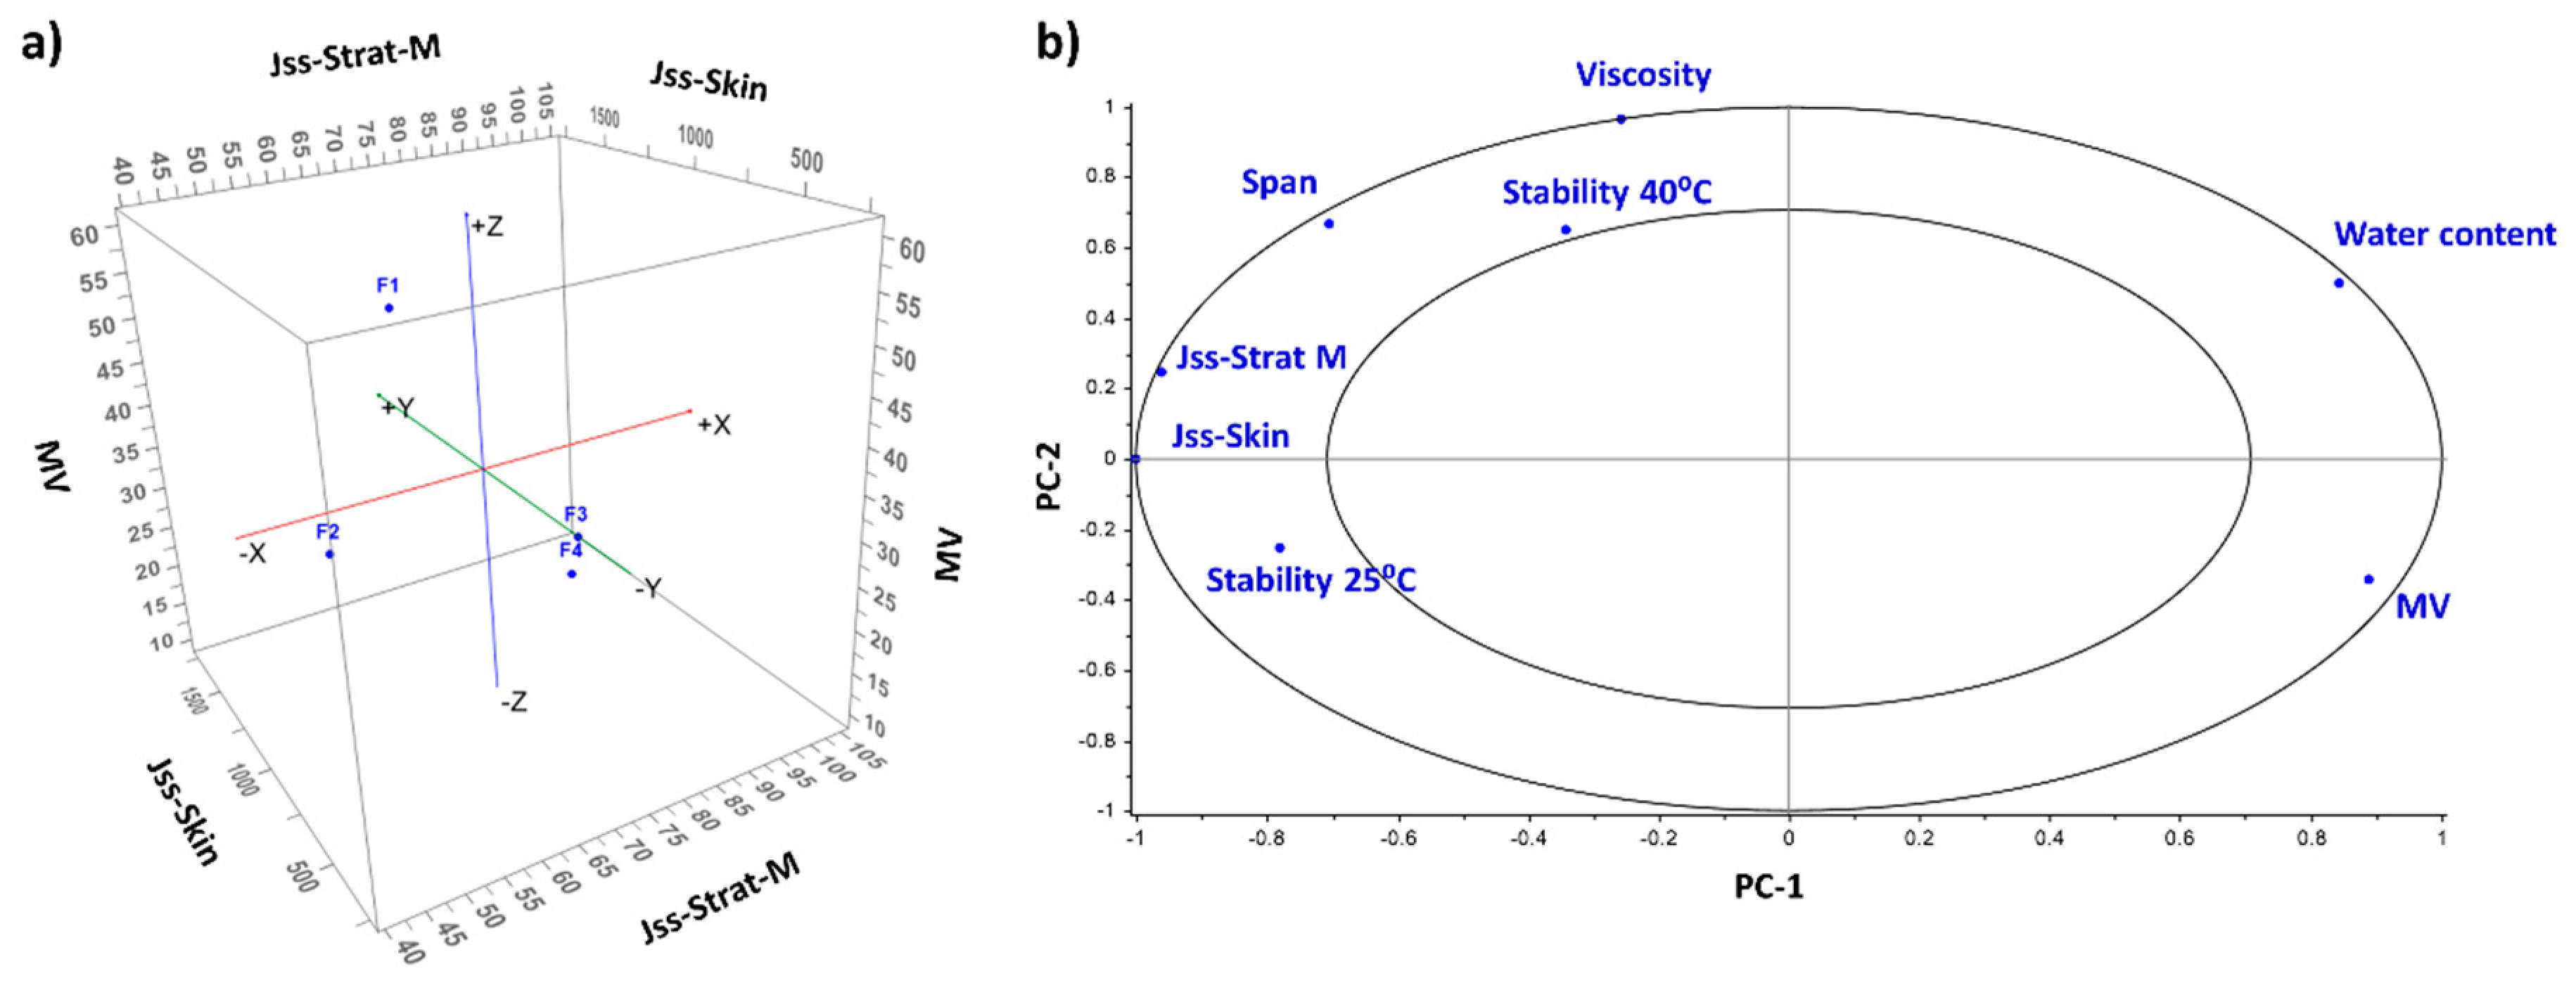
3.3. In Vitro Permeation Studies and Histological Analysis
4. Conclusions
Supplementary Materials
Author Contributions
Funding
Acknowledgments
Conflicts of Interest
References
- Tehranchinia, Z.; Saghi, B.; Rahimi, H. Evaluation of Therapeutic Efficacy and Safety of Tranexamic Acid Local Infiltration in Combination with Topical 4% Hydroquinone Cream Compared to Topical 4% Hydroquinone Cream Alone in Patients with Melasma: A Split-Face Study. Dermatol. Res. Pract. 2018, 2018, 8350317. [Google Scholar] [CrossRef] [PubMed]
- Smiles, K.A.; Dong, K.K.; Canning, M.T.; Grimson, R.; Walfield, A.M.; Yarosh, D.B. A hydroquinone formulation with increased stability and decreased potential for irritation. J. Cosmet. Dermatol. 2007, 6, 83–88. [Google Scholar] [CrossRef] [PubMed]
- Ghanbarzadeh, S.; Hariri, R.; Kouhsoltani, M.; Shokri, J.; Javadzadeh, Y.; Hamishehkar, H. Enhanced stability and dermal delivery of hydroquinone using solid lipid nanoparticles. Colloids Surf. B Biointerfaces 2015, 136, 1004–1010. [Google Scholar] [CrossRef] [PubMed]
- Matsubayashi, T.; Sakaeda, T.; Kita, T.; Kurimoto, Y.; Nakamura, T.; Nishiguchi, K.; Fujita, T.; Kamiyama, F.; Yamamoto, A.; Okumura, K. Intradermal concentration of hydroquinone after application of hydroquinone ointments is higher than its cytotoxic concentration. Biol. Pharm. Bull. 2003, 26, 1365–1367. [Google Scholar] [CrossRef] [PubMed]
- Matsubayashi, T.; Sakaeda, T.; Kita, T.; Nakamura, T.; Kakumoto, M.; Funasaka, Y.; Ichihashi, M.; Fujita, T.; Kamiyama, F.; Yamamoto, A.; et al. Effects of various storage conditions and alterations of antioxidant contents on chromatic aberration of hydroquinone ointment. Biol. Pharm. Bull. 2003, 26, 120–122. [Google Scholar] [CrossRef]
- Matsubayashi, T.; Sakaeda, T.; Kita, T.; Nara, M.; Funasaka, Y.; Ichihashi, M.; Fujita, T.; Kamiyama, F.; Yamamoto, A.; Nordlund, J.J.; et al. Pharmaceutical and clinical assessment of hydroquinone ointment prepared by extemporaneous nonsterile compounding. Biol. Pharm. Bull. 2002, 25, 92–96. [Google Scholar] [CrossRef] [PubMed]
- Fox, L.T.; Gerber, M.; Plessis, J.; Hamman, J.H. Transdermal drug delivery enhancement by compounds of natural origin. Molecules 2011, 16, 10507–10540. [Google Scholar] [CrossRef]
- Williams, A.C.; Barry, B.W. Penetration enhancers. Adv. Drug Deliv. Rev. 2004, 56, 603–618. [Google Scholar] [CrossRef]
- Lane, M.E. Skin penetration enhancers. Int. J. Pharm. 2013, 447, 12–21. [Google Scholar] [CrossRef] [PubMed]
- Topping, D.C.; Bernard, L.G.; O‘Donoghue, J.L.; English, J.C. Hydroquinone: Acute and subchronic toxicity studies with emphasis on neurobehavioral and nephrotoxic effects. Food Chem. Toxicol. Int. J. Publ. Br. Ind. Biol. Res. Assoc. 2007, 45, 70–78. [Google Scholar] [CrossRef]
- Bahadar, H.; Maqbool, F.; Mostafalou, S.; Baeeri, M.; Gholami, M.; Ghafour-Boroujerdi, E.; Abdollahi, M. The molecular mechanisms of liver and islets of Langerhans toxicity by benzene and its metabolite hydroquinone in vivo and in vitro. Toxicol. Mech. Methods 2015, 25, 628–636. [Google Scholar] [CrossRef] [PubMed]
- Beeler Base Composition. Available online: http://www.acofarma.com/idb/descarga/3/fb9f57912c87f3d1.pdf (accessed on 1 November 2018).
- Otto, A.; Wiechers, J.W.; Kelly, C.L.; Hadgraft, J.; du Plessis, J. Effect of penetration modifiers on the dermal and transdermal delivery of drugs and cosmetic active ingredients. Skin Pharmacol. Physiol. 2008, 21, 326–334. [Google Scholar] [CrossRef] [PubMed]
- Nourivan Data Sheet. Available online: https://es.fagron.com/es/novedades/nourivantm-antiox (accessed on 1 November 2018).
- Wortzman, M.S.; Gordon, P.J.; Gans, E.H.; Patel, B.G. Process for Stabilizing Hydroquinone. European Patent EP2047846 (A2), 15 April 2009. [Google Scholar]
- Rolon, M.; Serrano, D.R.; Lalatsa, A.; de Pablo, E.; Torrado, J.J.; Ballesteros, M.P.; Healy, A.M.; Vega, C.; Coronel, C.; Bolas-Fernandez, F.; et al. Engineering Oral and Parenteral Amorphous Amphotericin B Formulations against Experimental Trypanosoma cruzi Infections. Mol. Pharm. 2017, 14, 1095–1106. [Google Scholar] [CrossRef] [PubMed]
- Ruiz, H.K.; Serrano, D.R.; Dea-Ayuela, M.A.; Bilbao-Ramos, P.E.; Bolas-Fernandez, F.; Torrado, J.J.; Molero, G. New amphotericin B-gamma cyclodextrin formulation for topical use with synergistic activity against diverse fungal species and Leishmania spp. Int. J. Pharm. 2014, 473, 148–157. [Google Scholar] [CrossRef] [PubMed]
- Lalatsa, A.; Emeriewen, K.; Protopsalti, V.; Skelton, G.; Saleh, G.M. Developing transcutaneous nanoenabled anaesthetics for eyelid surgery. Br. J. Ophthalmol. 2016, 100, 871–876. [Google Scholar] [CrossRef]
- Kaur, L.; Singh, K.; Paul, S.; Singh, S.; Singh, S.; Jain, S.K. A Mechanistic Study to Determine the Structural Similarities Between Artificial Membrane Strat-M and Biological Membranes and Its Application to Carry Out Skin Permeation Study of Amphotericin B Nanoformulations. AAPS PharmSciTech 2018. [Google Scholar] [CrossRef]
- Serrano, D.R.; O’Connell, P.; Paluch, K.J.; Walsh, D.; Healy, A.M. Cocrystal habit engineering to improve drug dissolution and alter derived powder properties. J. Pharm. Pharm. 2016, 68, 665–677. [Google Scholar] [CrossRef]
- Lao, L.L.; Peppas, N.A.; Boey, F.Y.; Venkatraman, S.S. Modeling of drug release from bulk-degrading polymers. Int. J. Pharm. 2011, 418, 28–41. [Google Scholar] [CrossRef]
- Zhang, Y.; Huo, M.; Zhou, J.; Zou, A.; Li, W.; Yao, C.; Xie, S. DDSolver: An add-in program for modeling and comparison of drug dissolution profiles. AAPS J. 2010, 12, 263–271. [Google Scholar] [CrossRef]
- IHC World. H&E Staining Method and Protocol-Harris: IHC World-Life Science Products and Services. Available online: http://www.ihcworld.com/_protocols/special_stains/HE_Harris.htm (accessed on 3 May 2018).
- Alonso, T.R.; Gagol, A.; Scherer, M.; Matji, A.; Torrado-Santiago, S.; Serrano, D.R.; Garcia-Arieta, A.; Torrado, J.J. A multivariate investigation into the relationship between pharmaceutical characteristics and patient preferences of bioequivalent ibuprofen tablets. Patient Prefer. Adherence 2018, 12, 1927–1935. [Google Scholar] [CrossRef]
- Otsubo, Y.; Prud’homme, R.K. Flow behavior ofoil-in-water emulsions. J. Rheol. 1993, 37, 561. [Google Scholar] [CrossRef]
- Anderson, G.; Scott, M. Determination of product shelf life and activation energy for five drugs of abuse. Clin. Chem. 1991, 37, 398–402. [Google Scholar]
- p-Benzoquinone Toxicity. Available online: https://www.cdc.gov/niosh/ipcsneng/neng0779.html (accessed on 10 December 2018).
- Hydroquinone Drug Bank Database. Available online: https://www.drugbank.ca/drugs/DB09526 (accessed on 1 November 2018).
- Uchida, T.; Kadhum, W.R.; Kanai, S.; Todo, H.; Oshizaka, T.; Sugibayashi, K. Prediction of skin permeation by chemical compounds using the artificial membrane, Strat-M. Eur. J. Pharm. Sci. 2015, 67, 113–118. [Google Scholar] [CrossRef] [PubMed]
- Cojocaru, V.; Emil, A.; Hinescu, L.G.; Ionescu, M.; Comercu, C.; Poștoarcă, A.G.; Cinteza, L.O. Formulation and evaluation of in vitro release kinetics of Na3CADTPA decorporation agent embedded in micoremulsion-based gel formulation for topical delivery. Farmacia 2015, 63, 656–664. [Google Scholar]
- Menczel, E.M. Delipidization of the cutaneous permeability barrier and percutaneous penetration. In Percutaneous Penetration Enhancer; Smith, E.W., Ed.; CRS Press: Boca Raton, FL, USA, 1995; pp. 383–392. [Google Scholar]
- Elshafeey, A.H.; Hamza, Y.E.; Amin, S.Y.; Zia, H. In vitro transdermal permeation of fenoterol hydrobromide. J. Adv. Res. 2012, 3, 125–132. [Google Scholar] [CrossRef]
- Fleckman, P.; Dale, B.A.; Holbrook, K.A. Profilaggrin, a high-molecular-weight precursor of filaggrin in human epidermis and cultured keratinocytes. J. Investig. Dermatol. 1985, 85, 507–512. [Google Scholar] [CrossRef]
- Peira, E.; Trotta, M.; Carlotti, M.E.; Gallarate, M.; Chirio, D. Elastic positively-charged liposomes for topical administration of acyclovir. J. Drug Deliv. Sci. Technol. 2007, 17, 321–324. [Google Scholar] [CrossRef]
- Dale, B.A.; Ling, S.Y. Evidence of a precursor form of stratum corneum basic protein in rat epidermis. Biochemistry 1979, 18, 3539–3546. [Google Scholar] [CrossRef] [PubMed]
- Hadgraft, J.; Lane, M.E. Drug crystallization—Implications for topical and transdermal delivery. Expert Opin. Drug Deliv. 2016, 13, 817–830. [Google Scholar] [CrossRef] [PubMed]
- Wester, R.C.; Melendres, J.; Hui, X.; Cox, R.; Serranzana, S.; Zhai, H.; Quan, D.; Maibach, H.I. Human in vivo and in vitro hydroquinone topical bioavailability, metabolism, and disposition. J. Toxicol. Environ. Health Part A 1998, 54, 301–317. [Google Scholar] [PubMed]
- National Toxicology Program. NTP Toxicology and Carcinogenesis Studies of Hydroquinone (CAS No. 123-31-9) in F344/N Rats and B6C3F1 Mice (Gavage Studies). Natl. Toxicol. Program. Tech. Rep. Ser. 1989, 366, 1–248. [Google Scholar]
- Shibata, M.A.; Hirose, M.; Tanaka, H.; Asakawa, E.; Shirai, T.; Ito, N. Induction of renal cell tumors in rats and mice, and enhancement of hepatocellular tumor development in mice after long-term hydroquinone treatment. Jpn. J. Cancer Res. 1991, 82, 1211–1219. [Google Scholar] [CrossRef] [PubMed]
- CIR. Amended Safety Assessment of Hydroquinone as Used in Cosmetics. Available online: http://online.personalcarecouncil.org/ctfa-static/online/lists/cirpdfs/FR647.pdf (accessed on 2 November 2014).
- Matsumoto, M.; Todo, H.; Akiyama, T.; Hirata-Koizumi, M.; Sugibayashi, K.; Ikarashi, Y.; Ono, A.; Hirose, A.; Yokoyama, K. Risk assessment of skin lightening cosmetics containing hydroquinone. Regul. Toxicol. Pharm. 2016, 81, 128–135. [Google Scholar] [CrossRef] [PubMed]


| Formulation | HQ (%) | PG (%) | Vit. C (%) | Vit E (%) | DMI (%) | Beeler’s Base (%) | Olive Oil Base * (%) | Nourivan® (%) | pH |
|---|---|---|---|---|---|---|---|---|---|
| F1 | 5 | 5 | 1.25 | 1.25 | - | 87.5 | - | - | 3.6 |
| F2 | 5 | - | - | - | 15 | 80 | - | - | 3.7 |
| F3 | 5 | - | - | - | 15 | - | 80 | - | 3.6 |
| F4 | 5 | - | - | - | 15 | - | - | 80 | 3.2 |
| Parameters | F1 | F2 | F3 | F4 |
|---|---|---|---|---|
| MV (µm) | 61.8 | 44.9 | 8.3 | 26.0 |
| MN (µm) | 12.1 | 15.2 | 1.0 | 0.9 |
| MA (µm) | 38.4 | 32.9 | 3.0 | 7.3 |
| Span | 1.9 | 1.4 | 3.2 | 3.5 |
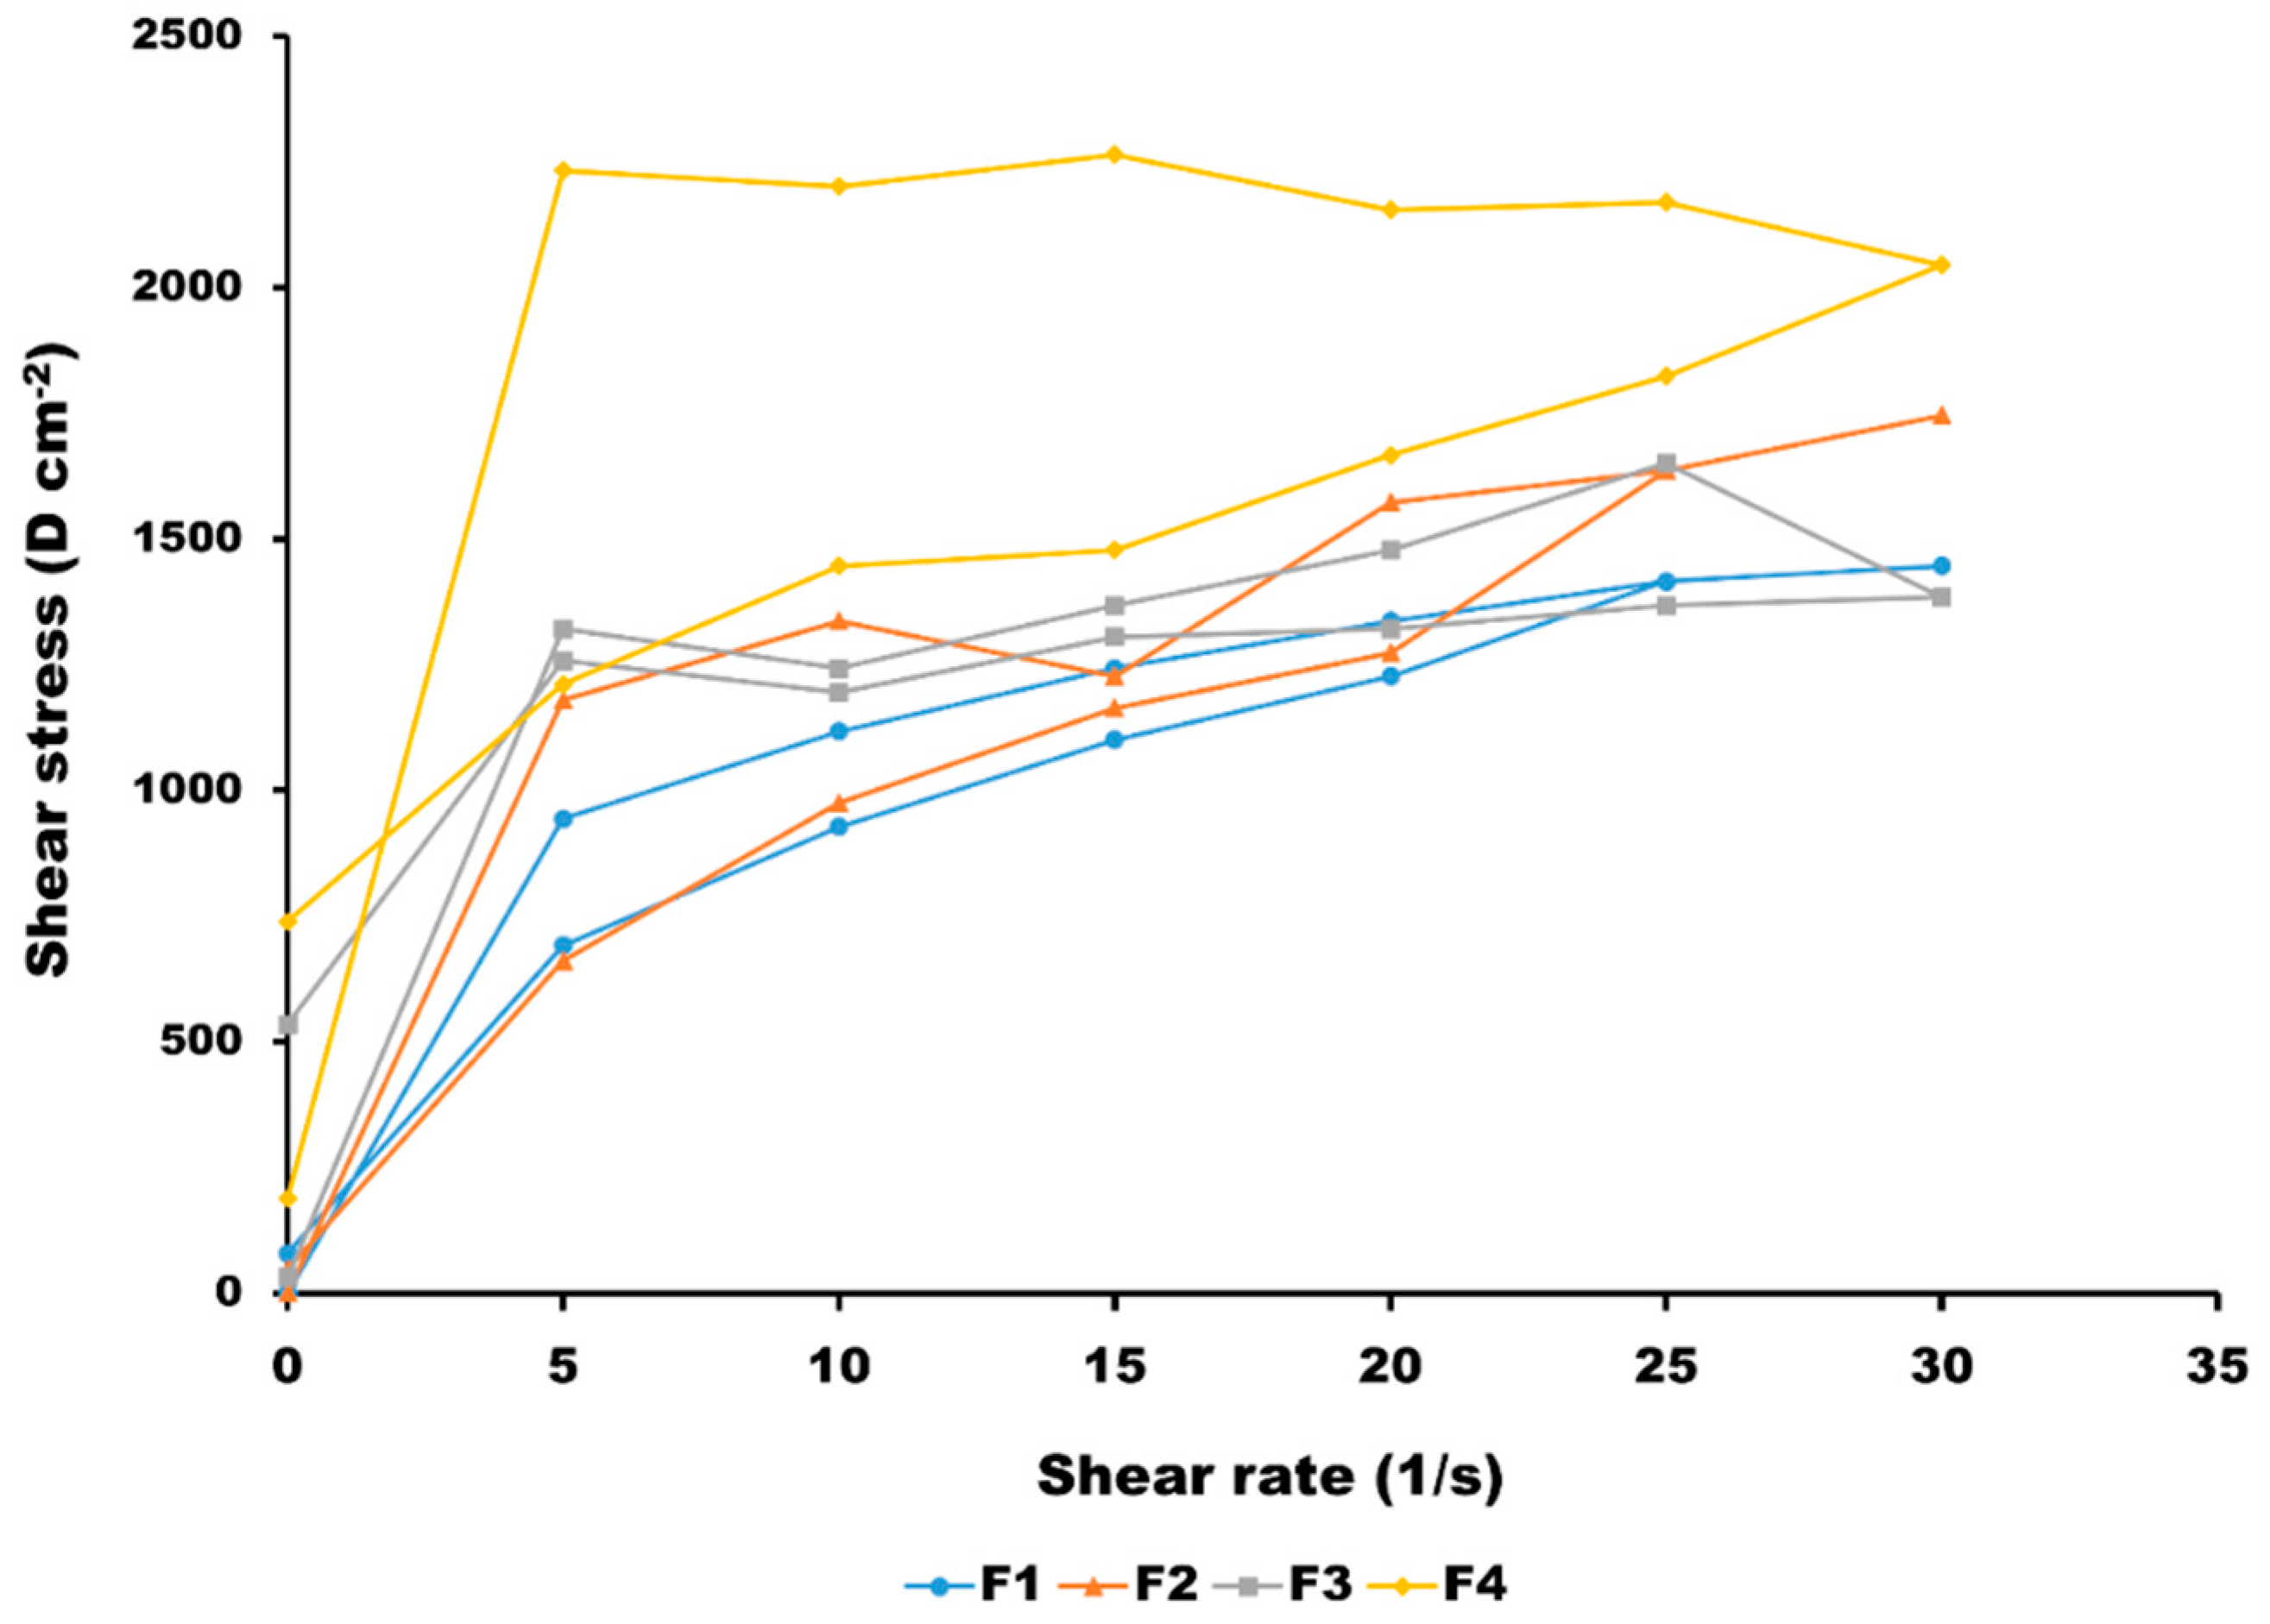
| Viscosity (Pa·s) | 88.8 | 99.0 | 113.2 | 156.6 |
| Apparent water content (%) | 60.4 | 54.8 | 16.8 | 69.8 |
| T (°C) | F1 | F2 | F3 | F4 |
|---|---|---|---|---|
| 40 | 0.0107 | 0.0115 | 0.0048 | 0.0072 |
| 25 | 0.0033 | 0.0046 | 0.0006 | 0.005 |
| 6 | 0.001 | 0.0011 | 0.0002 | 0.001 |
| F | Membrane | Jss (µg/cm2/h) | Lag time (h) | P (cm/h) × 102 | D (cm2/h) × 103 | ER | Amount of HQ in the Skin (mg/g) |
|---|---|---|---|---|---|---|---|
| F1 | S.M. | 49.3 ± 2.4 | 0.95 ± 0.06 | 0.49 ± 0.02 | 0.54 ± 0.03 | - | NA |
| F2 | S.M. | 39.3 ± 3.9 | 1.18 ± 0.09 | 0.39 ± 0.03 | 0.43 ± 0.04 | 0.8 ± 0.1 | NA |
| F3 | S.M. | 106.3 ± 6.5 | 0.47 ± 0.08 | 1.06 ± 0.08 | 1.17 ± 0.09 | 2.2 ± 0.2 | NA |
| F4 | S.M. | 78.1 ± 3.3 | 0.79 ± 0.07 | 0.78 ± 0.03 | 0.85 ± 0.03 | 1.6 ± 0.1 | NA |
| F1 | M.S. | 309.9 ± 66.3 | 0.35 ± 0.08 | 3.09 ± 0.66 | 4.31 ± 0.92 | - | 3.58 ± 1.21 |
| F2 | M.S. | 221.5 ± 43.1 | 0.42 ± 0.08 | 2.21 ± 0.42 | 3.10 ± 0.06 | 0.7 ± 0.1 | 2.50 ± 1.43 |
| F3 | M.S. | 1754.1 ± 184.9 | 0.12 ± 0.06 | 17.5 ± 1.82 | 24.5 ± 2.58 | 5.7 ± 0.6 | 1.36 ± 0.84 |
| F4 | M.S. | 700.5 ± 213.0 | 0.12 ± 0.03 | 7.00 ± 0.21 | 9.81 ± 0.25 | 2.3 ± 0.7 | 1.57 ± 0.78 |
| F | Membrane | Zero Order | First Order | Higuchi | Hixson–Crowell | Korsmeyer–Peppas |
|---|---|---|---|---|---|---|
| F1 | S.M. | 0.9851 | 0.9846 | 0.9299 | 0.9848 | 0.9919 |
| F2 | S.M. | 0.9735 | 0.9728 | 0.9047 | 0.9731 | 0.9923 |
| F3 | S.M. | 0.9919 | 0.9901 | 0.9448 | 0.9908 | 0.9951 |
| F4 | S.M. | 0.9923 | 0.9918 | 0.9474 | 0.9919 | 0.9950 |
| F1 | M.S. | 0.9797 | 0.9833 | 0.9767 | 0.9822 | 0.9835 |
| F2 | M.S. | 0.9801 | 0.9822 | 0.9723 | 0.9815 | 0.9821 |
| F3 | M.S. | 0.9517 | 0.9852 | 0.9917 | 0.9774 | 0.9837 |
| F4 | M.S. | 0.9653 | 0.9760 | 0.9920 | 0.9728 | 0.9863 |
© 2019 by the authors. Licensee MDPI, Basel, Switzerland. This article is an open access article distributed under the terms and conditions of the Creative Commons Attribution (CC BY) license (http://creativecommons.org/licenses/by/4.0/).
Share and Cite
Serrano, D.R.; Gordo, M.J.; Matji, A.; González, S.; Lalatsa, A.; Torrado, J.J. Tuning the Transdermal Delivery of Hydroquinone upon Formulation with Novel Permeation Enhancers. Pharmaceutics 2019, 11, 167. https://doi.org/10.3390/pharmaceutics11040167
Serrano DR, Gordo MJ, Matji A, González S, Lalatsa A, Torrado JJ. Tuning the Transdermal Delivery of Hydroquinone upon Formulation with Novel Permeation Enhancers. Pharmaceutics. 2019; 11(4):167. https://doi.org/10.3390/pharmaceutics11040167
Chicago/Turabian StyleSerrano, Dolores R., María José Gordo, Antonio Matji, Salvador González, Aikaterini Lalatsa, and Juan José Torrado. 2019. "Tuning the Transdermal Delivery of Hydroquinone upon Formulation with Novel Permeation Enhancers" Pharmaceutics 11, no. 4: 167. https://doi.org/10.3390/pharmaceutics11040167