Author Contributions
Conceptualization, Y.D. and A.A.K.; methodology, Y.D. and A.A.K.; software, A.A.K., S.A., J.M. and V.M.; validation, Y.D. and A.A.K.; formal analysis, Y.D. and A.A.K.; investigation, Y.D., A.A.K., J.M., S.A. and V.M.; resources, Y.D. and A.A.K.; writing—original draft preparation, Y.D., A.A.K., J.M., S.A. and V.M.; writing—review and editing, Y.D., A.A.K., J.M., S.A. and V.M.; supervision, A.A.K.; project administration, Y.D.
Figure 1.
3D response surface plots showing the effect of interactions (a) AB, (b) AC, (c) AD, (d) CD, (e) BD and (f) BC on the PS of NLCs. (A) Homogenization time, (B) solid lipid concentration, (C) liquid lipid concentration, (D) surfactant concentration.
Figure 1.
3D response surface plots showing the effect of interactions (a) AB, (b) AC, (c) AD, (d) CD, (e) BD and (f) BC on the PS of NLCs. (A) Homogenization time, (B) solid lipid concentration, (C) liquid lipid concentration, (D) surfactant concentration.
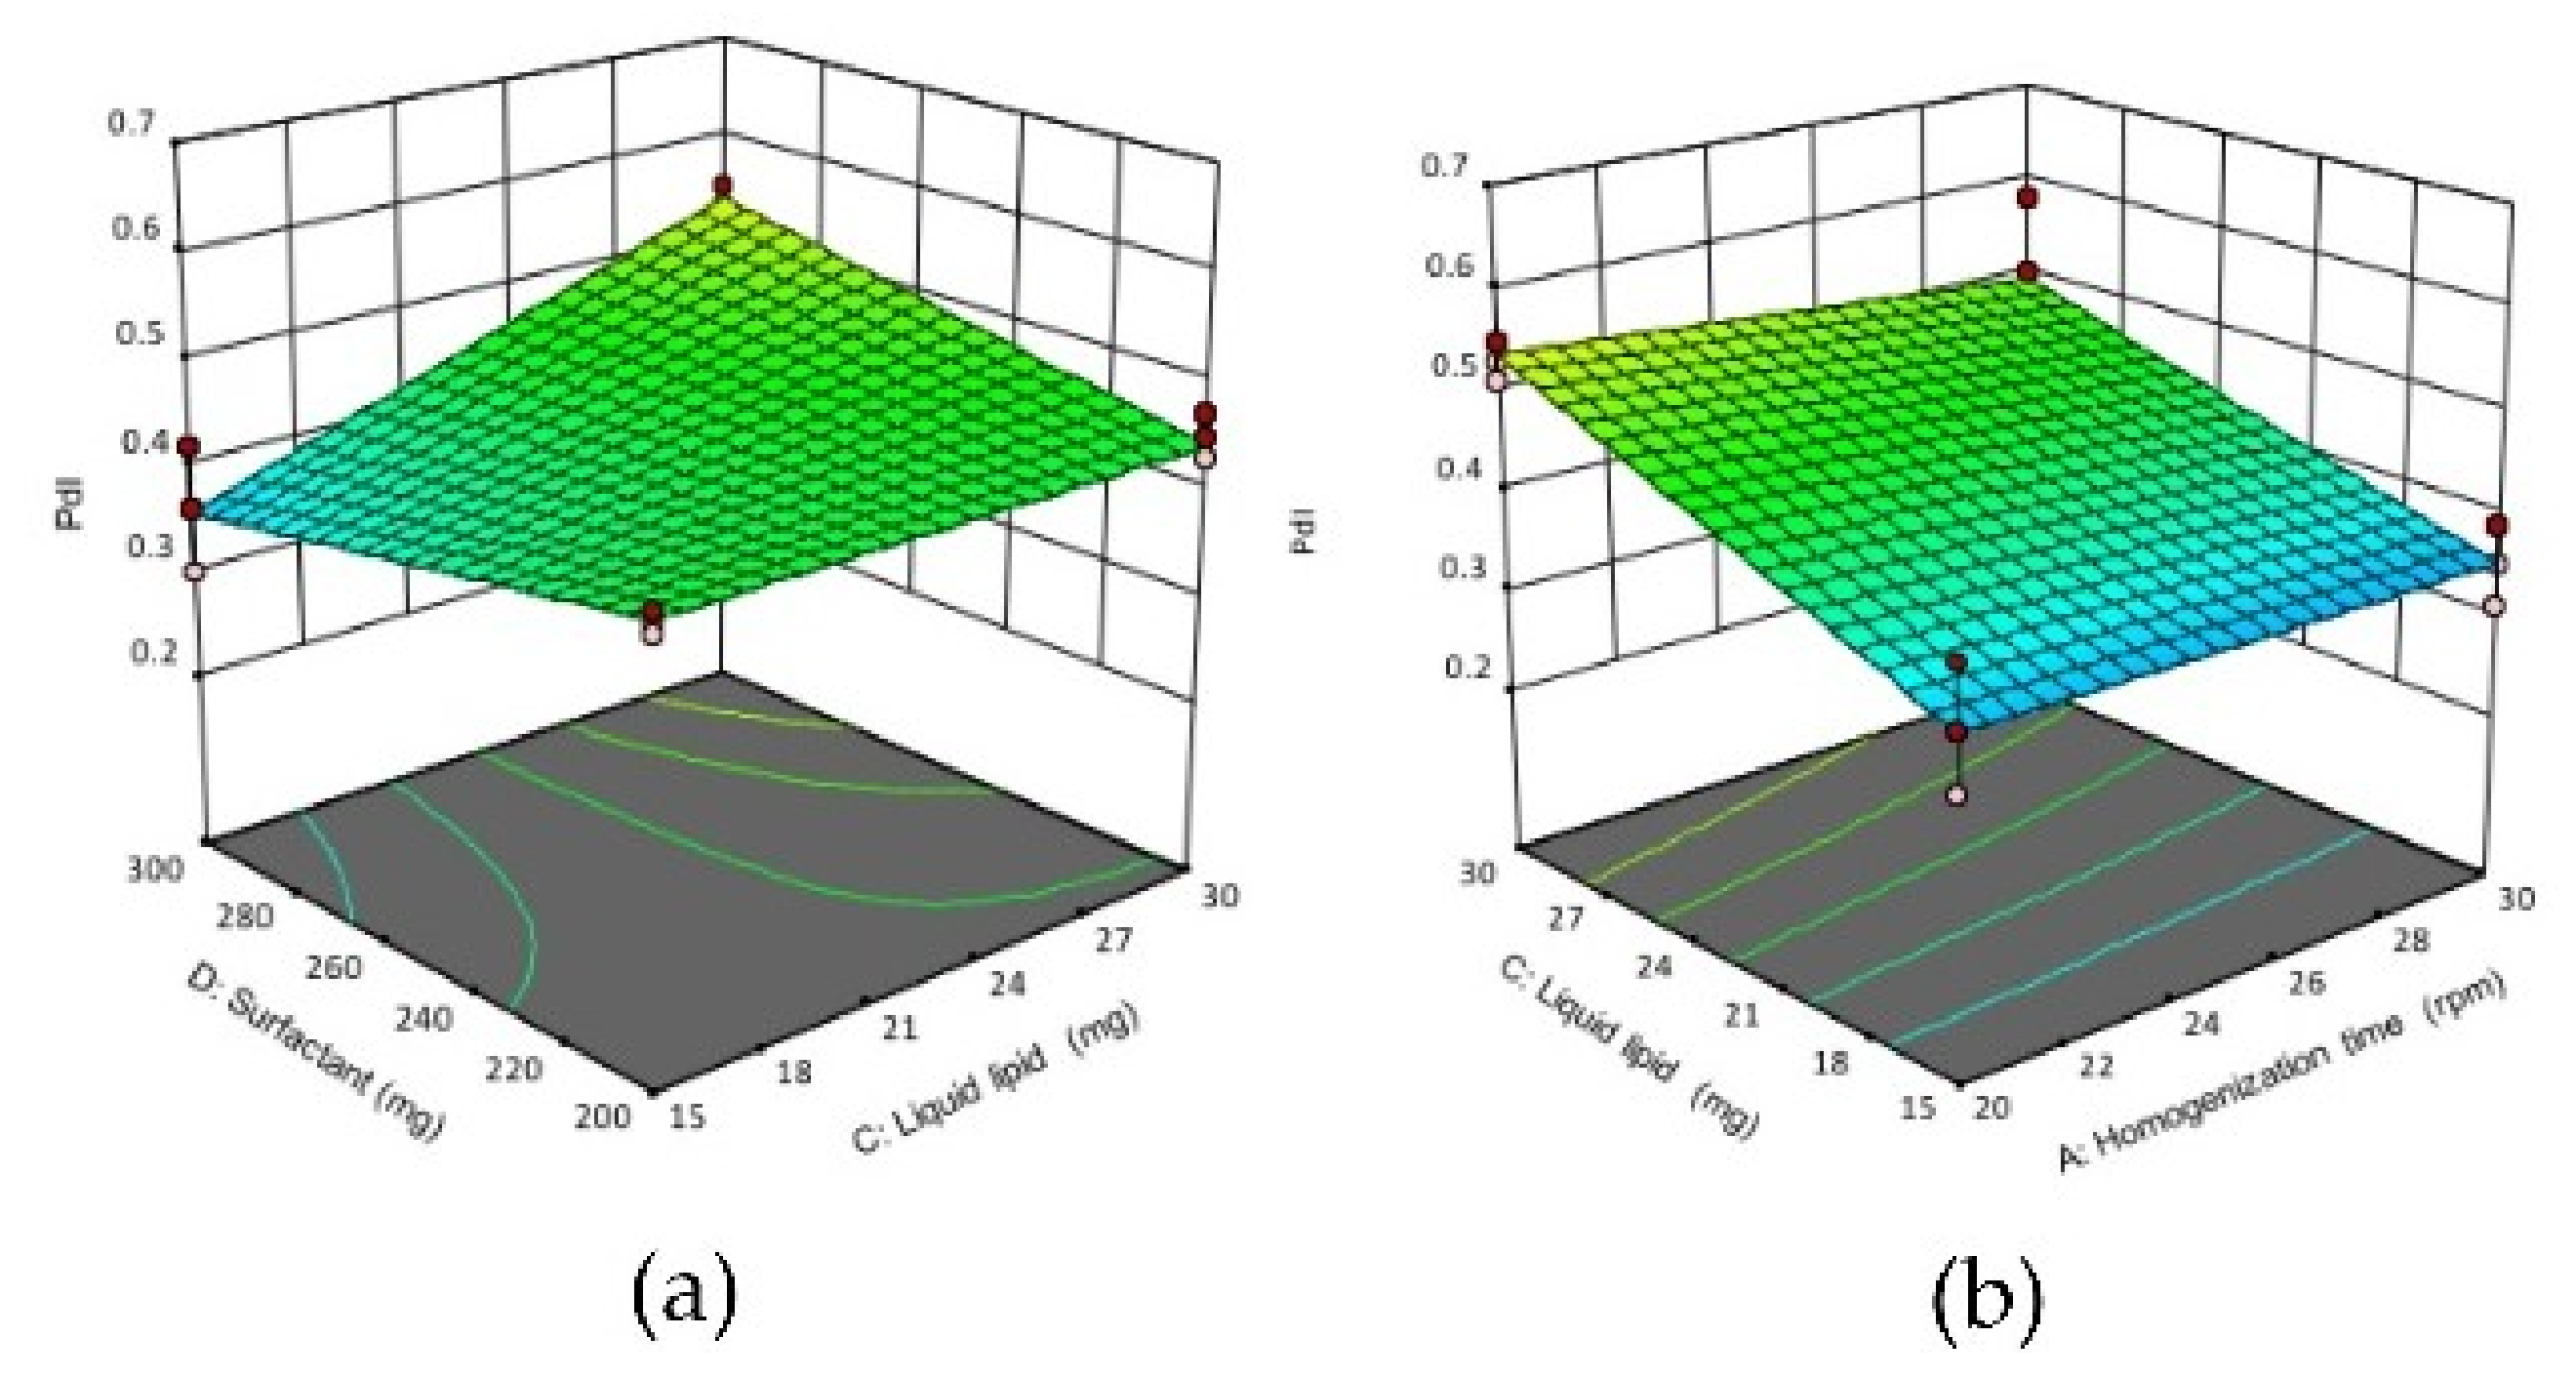
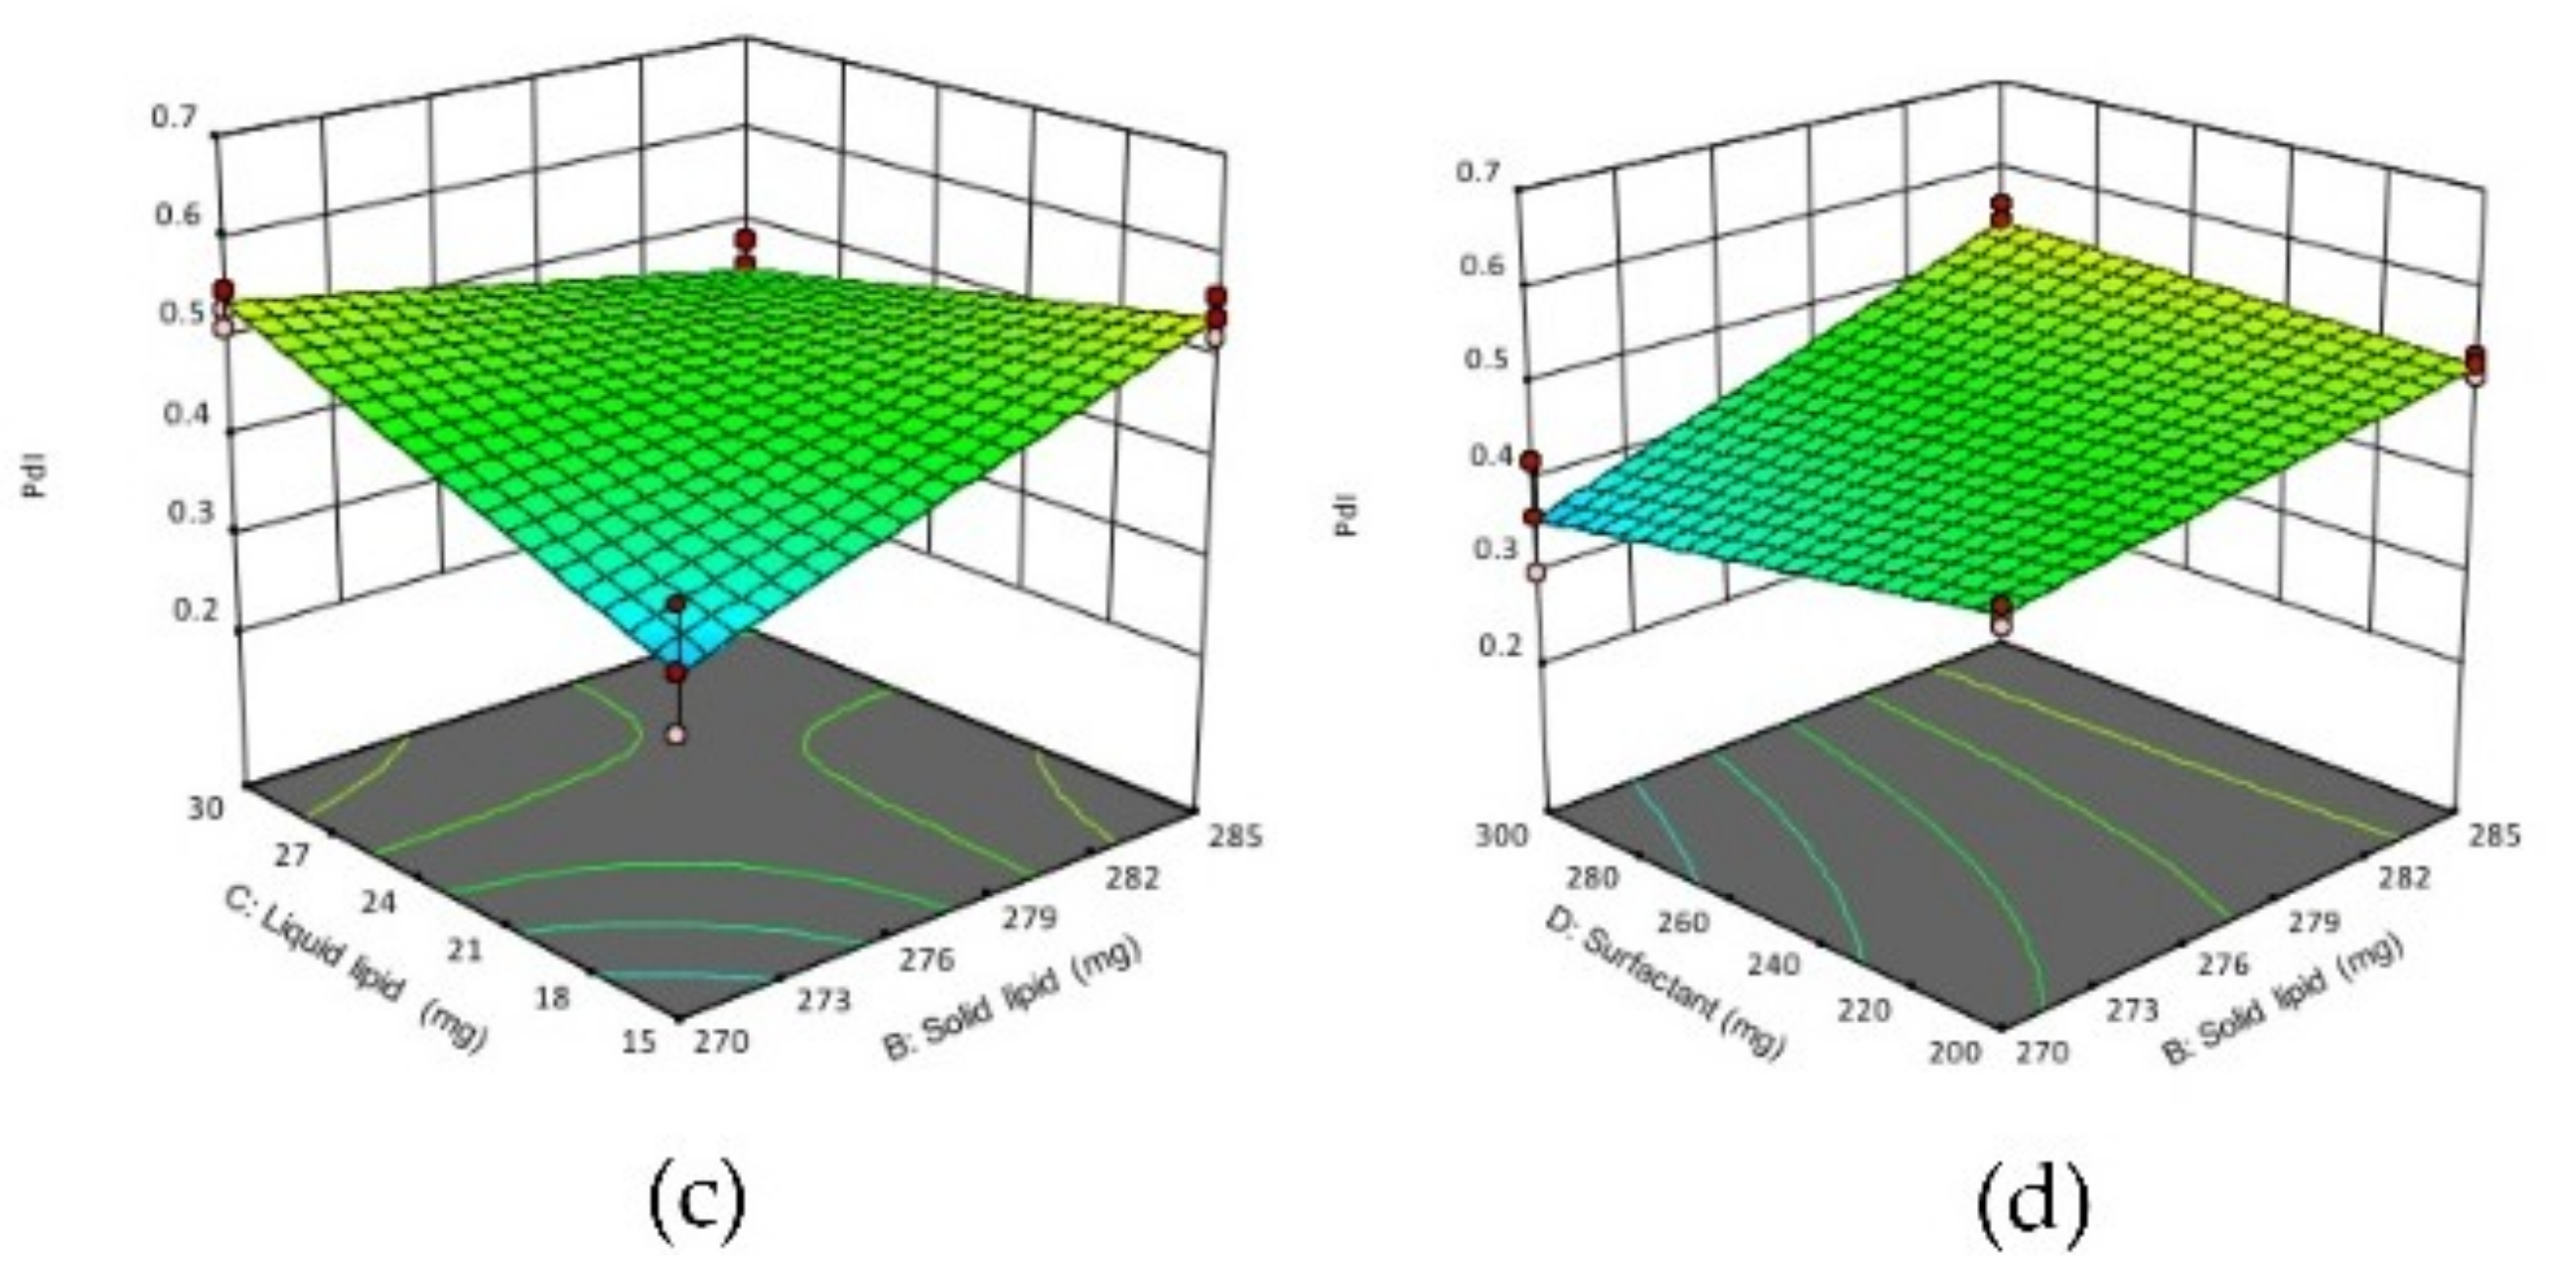
Figure 2.
3D response surface plots showing the effect of interactions between (a) CD, (b) AC (c) BC and (d) BD on the PdI of NLCs. (A) homogenization time, (B) solid lipid concentration, (C) liquid lipid concentration, (D) surfactant concentration.
Figure 2.
3D response surface plots showing the effect of interactions between (a) CD, (b) AC (c) BC and (d) BD on the PdI of NLCs. (A) homogenization time, (B) solid lipid concentration, (C) liquid lipid concentration, (D) surfactant concentration.
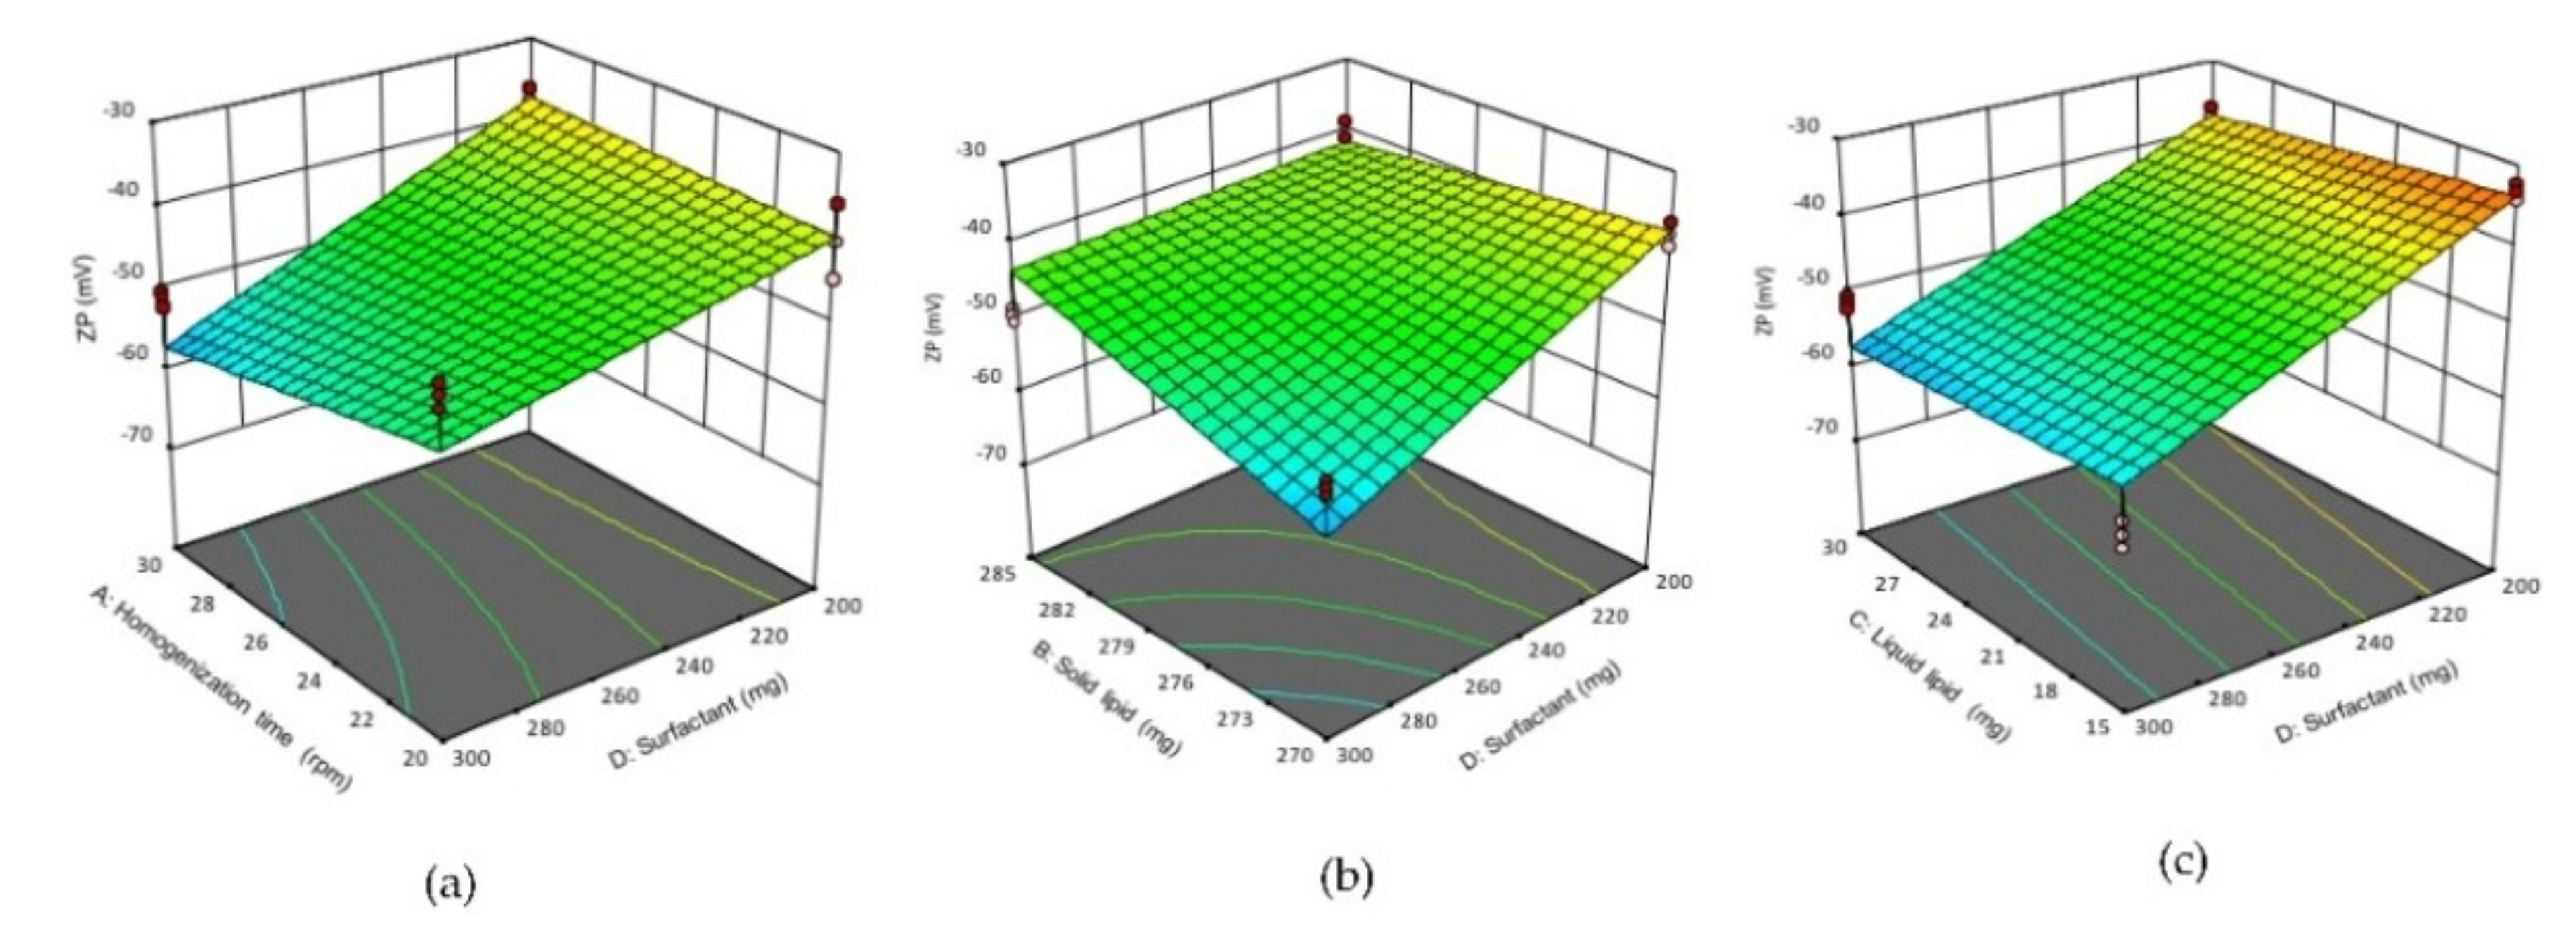
Figure 3.
3D response surface plots showing the effect of interactions (a) AD, (b) BD (c), DC on ZP of NLCs. (A) homogenization time, (B) solid lipid concentration, (C) liquid lipid concentration, (D) surfactant concentration.
Figure 3.
3D response surface plots showing the effect of interactions (a) AD, (b) BD (c), DC on ZP of NLCs. (A) homogenization time, (B) solid lipid concentration, (C) liquid lipid concentration, (D) surfactant concentration.
Figure 4.
Comparison of LPV release from LPV-NLC-4-Tres, LPV-NLC-7-Tres, LPV-NLC-8-Tres, and LPV -suspension for 12 h in (a) SGF (pH 1.2) and (b) SIF (pH 6.8) media. Mean ± S.D, n = 3.
Figure 4.
Comparison of LPV release from LPV-NLC-4-Tres, LPV-NLC-7-Tres, LPV-NLC-8-Tres, and LPV -suspension for 12 h in (a) SGF (pH 1.2) and (b) SIF (pH 6.8) media. Mean ± S.D, n = 3.
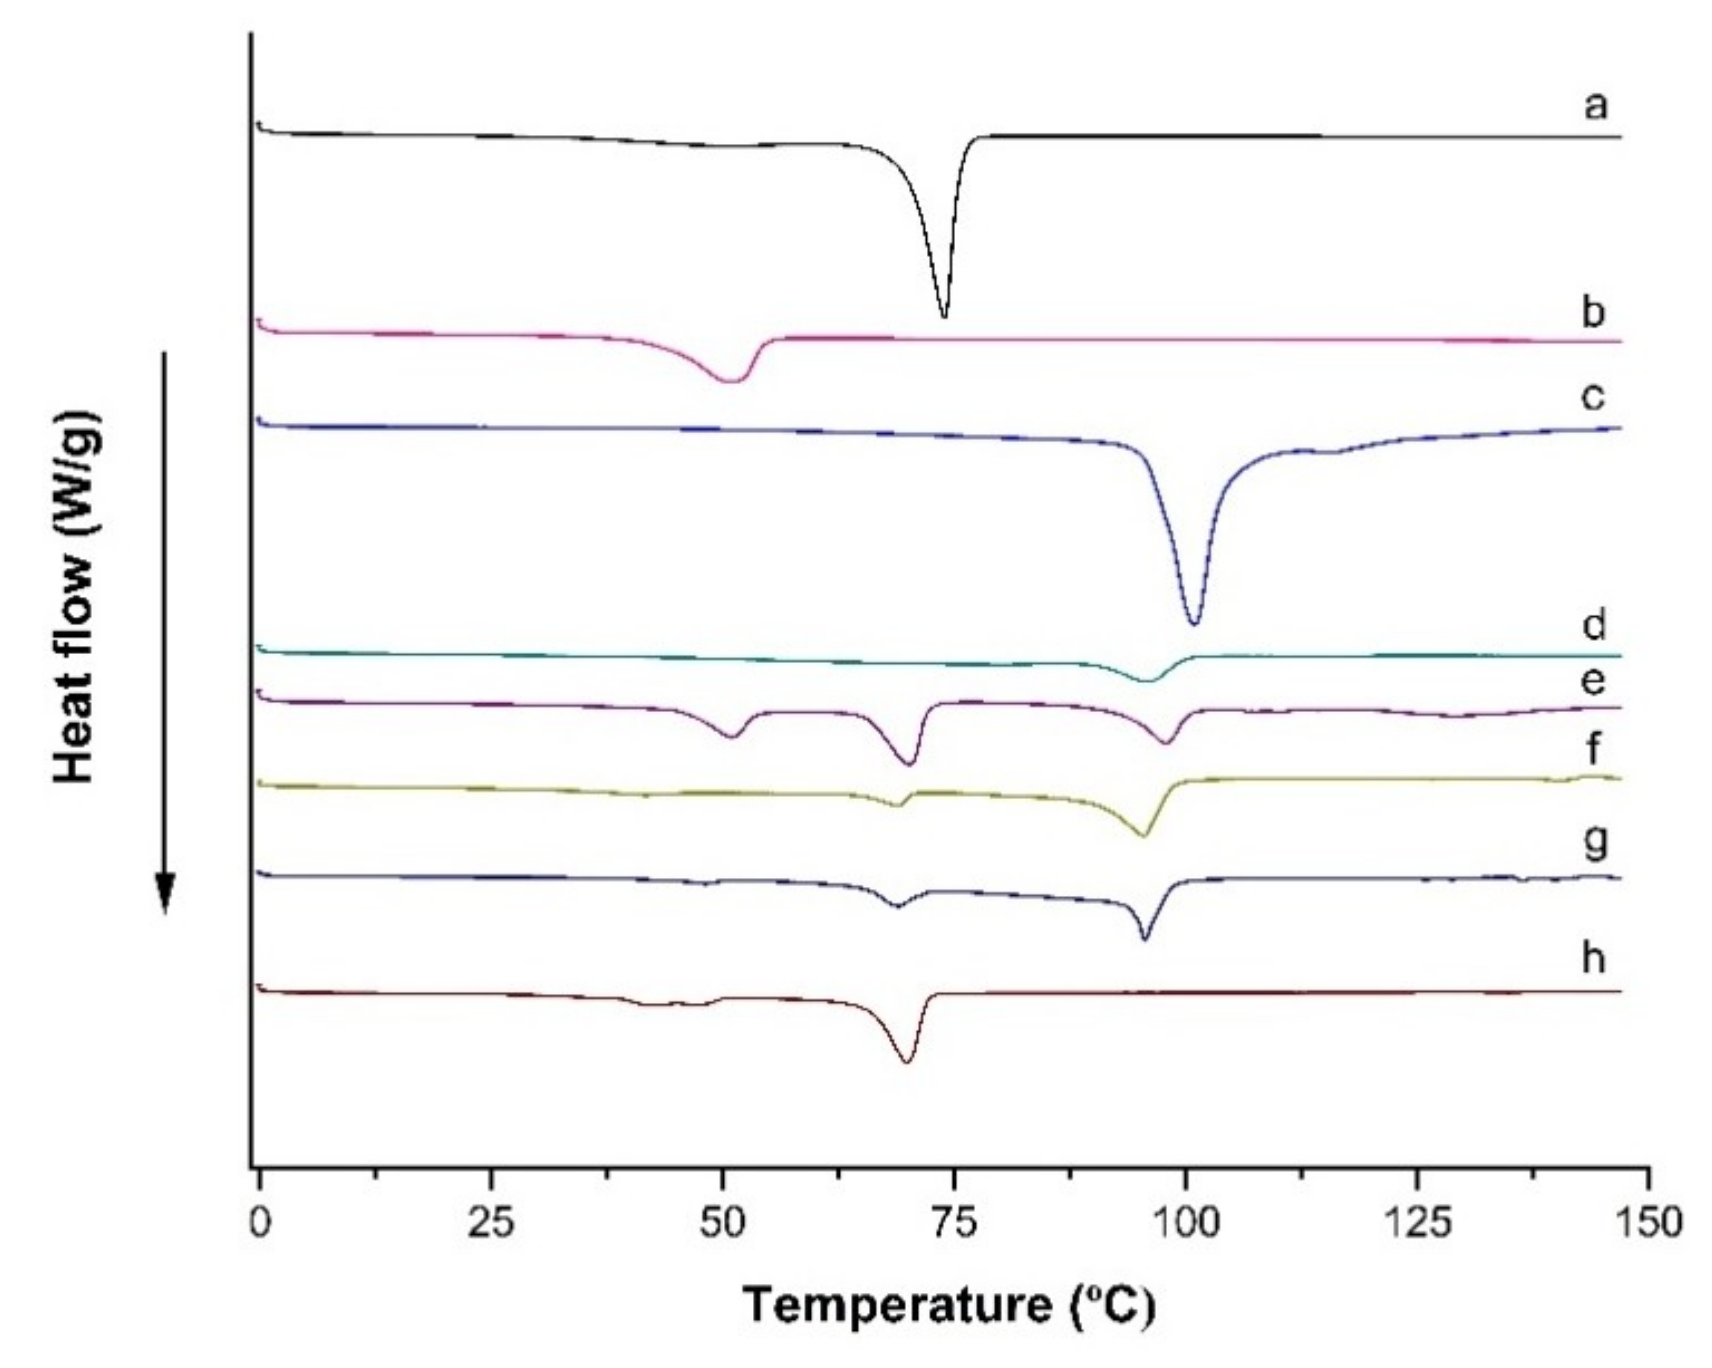
Figure 5.
DSC thermograms scanned from 0 to 150 °C at a rate of 10 °C/min for (a) Compritol 888 ATO®, (b) Poloxamer 188, (c) Trehalose, (d) LPV, (e) Physical mixture (i.e., Compritol 888 ATO®, Poloxamer 188, trehalose and LPV), (f) Blank formulation, (g) LPV-NLC-7-Tres formulation, and (h) LPV-NLC-7 formulation.
Figure 6.
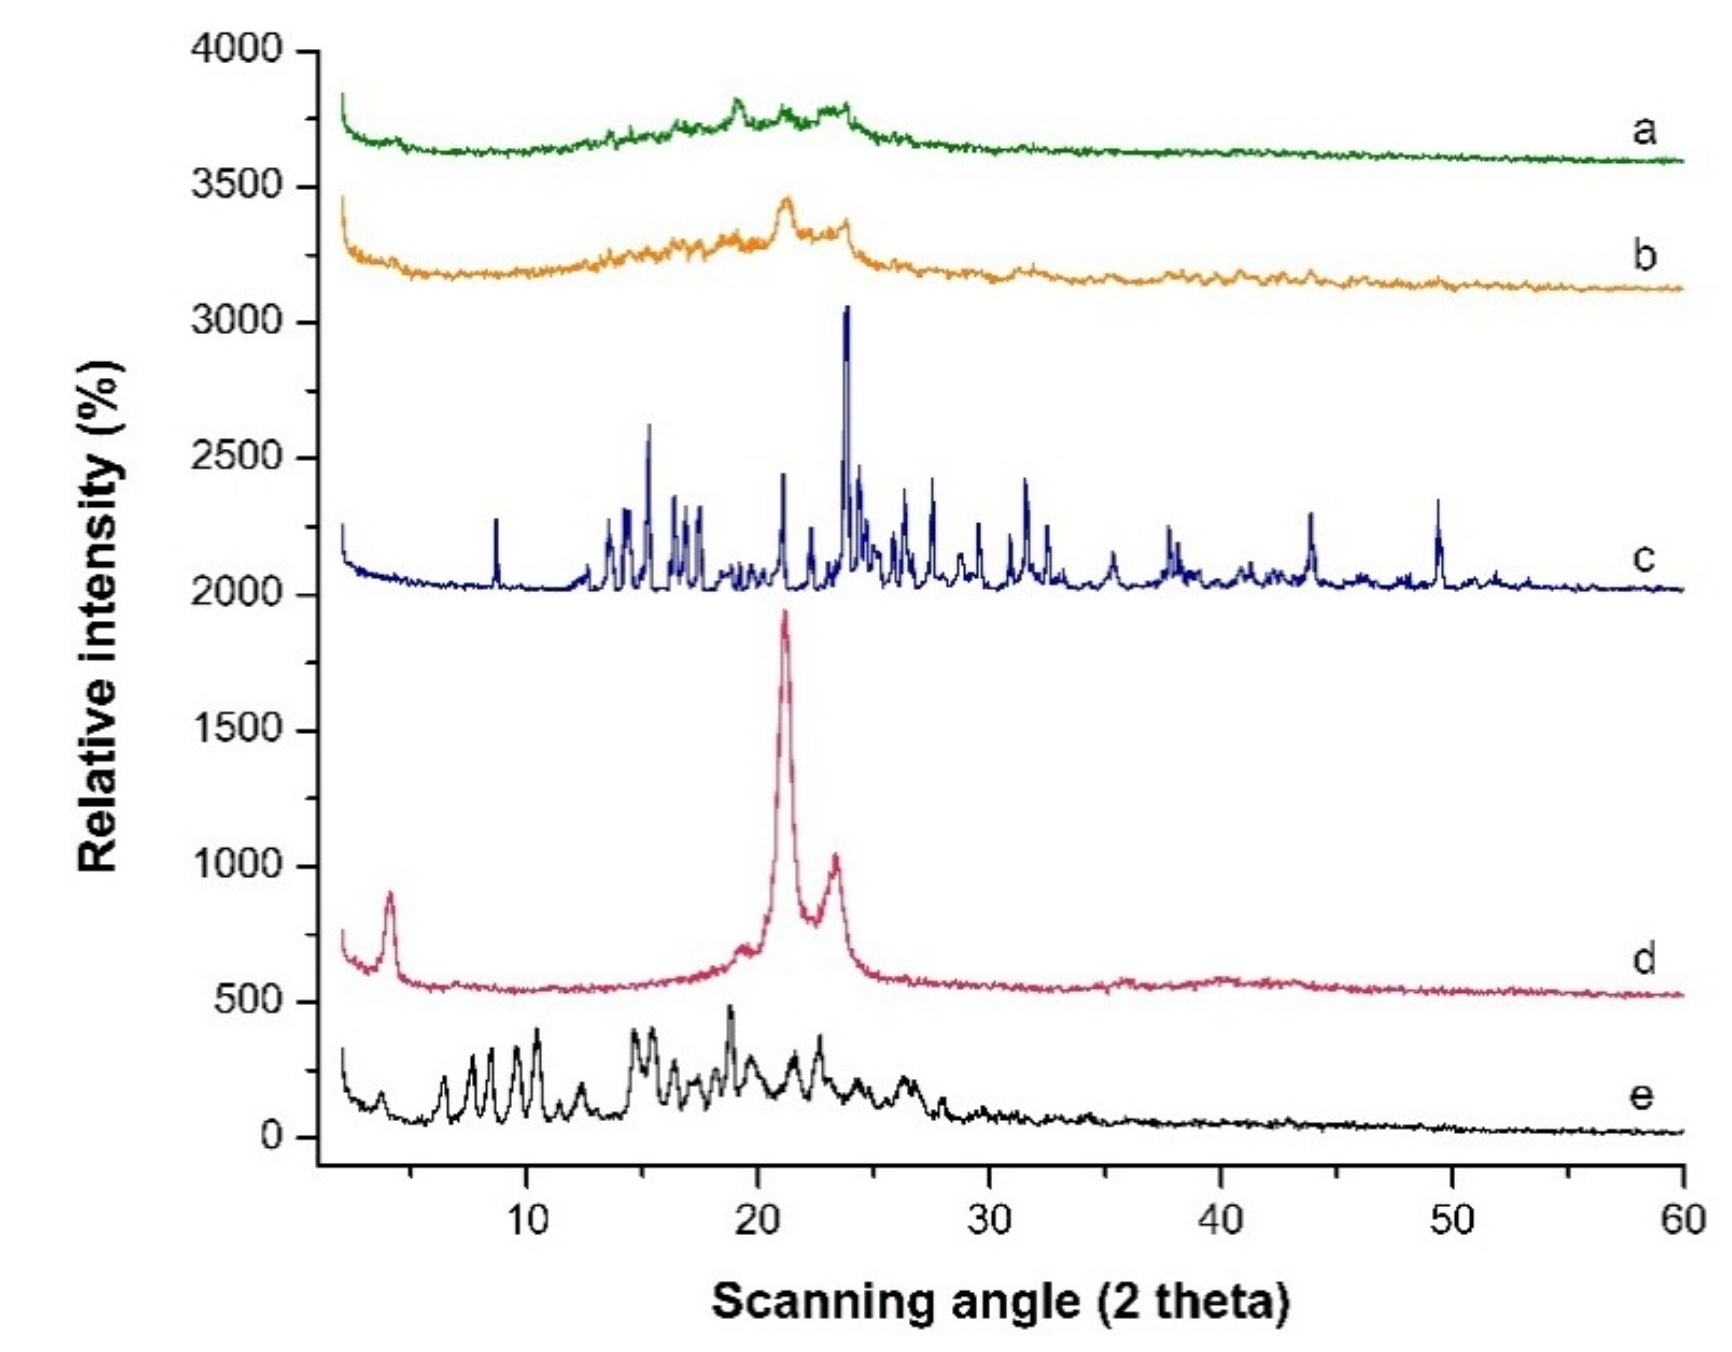
PXRD patterns scanned from 2° to 60° 2θ at a rate of 5 °C/min for (a) Freeze-dried LPV-NLC-7-Tres formulation, (b) Blank formulation, (c) Trehalose, (d) Compritol 888 ATO® and (e) LPV.
Figure 6.
PXRD patterns scanned from 2° to 60° 2θ at a rate of 5 °C/min for (a) Freeze-dried LPV-NLC-7-Tres formulation, (b) Blank formulation, (c) Trehalose, (d) Compritol 888 ATO® and (e) LPV.
Figure 7.
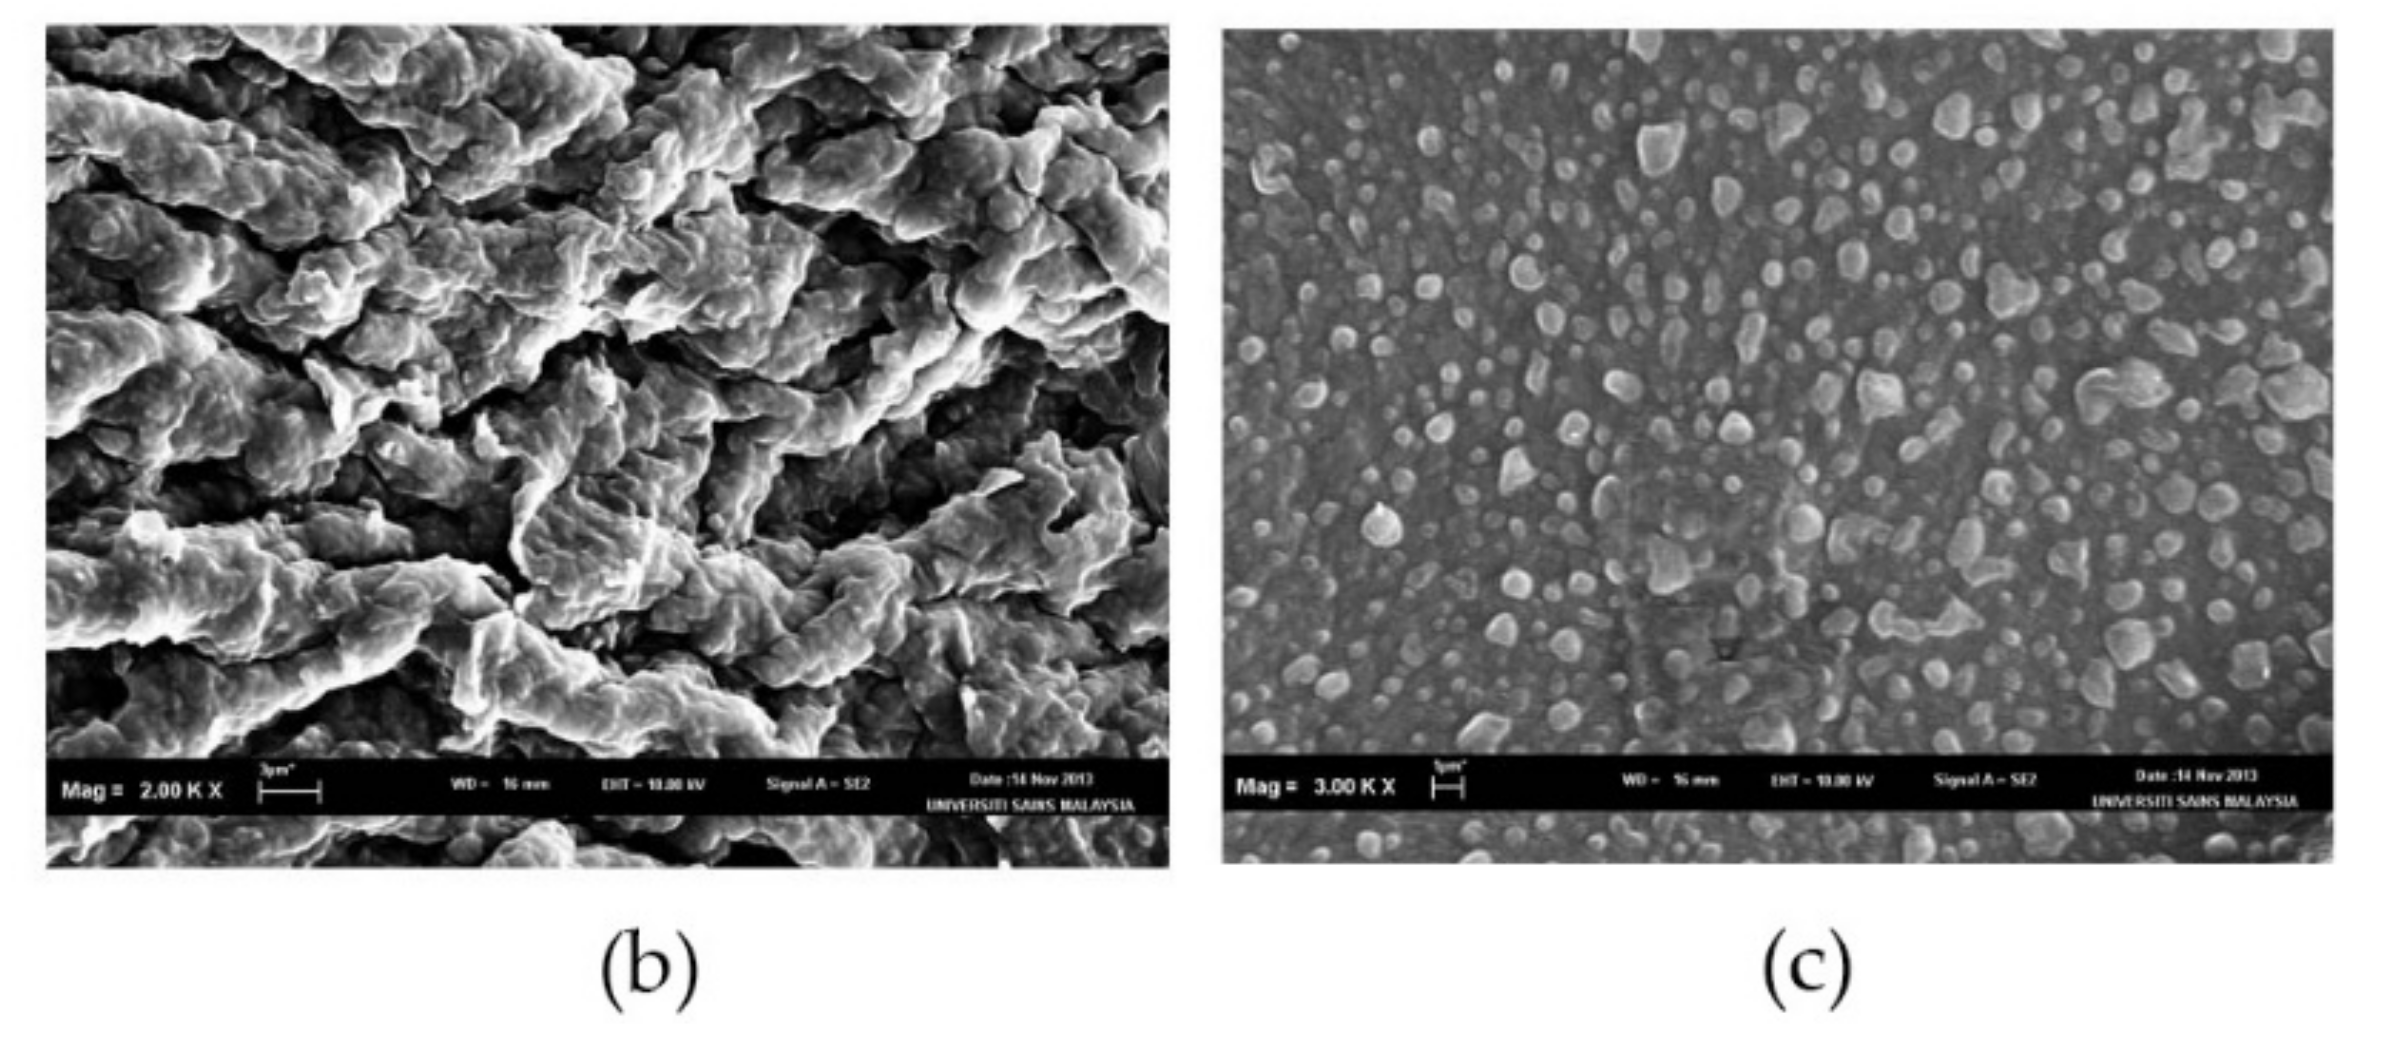
(a) TEM image of LPV-NLC-7 before freeze-drying; (b) SEM image of LPV-NLC-7 after freeze drying, and (c) SEM image of LPV-NLC-7-Tres after freeze drying.
Figure 7.
(a) TEM image of LPV-NLC-7 before freeze-drying; (b) SEM image of LPV-NLC-7 after freeze drying, and (c) SEM image of LPV-NLC-7-Tres after freeze drying.
Figure 8.
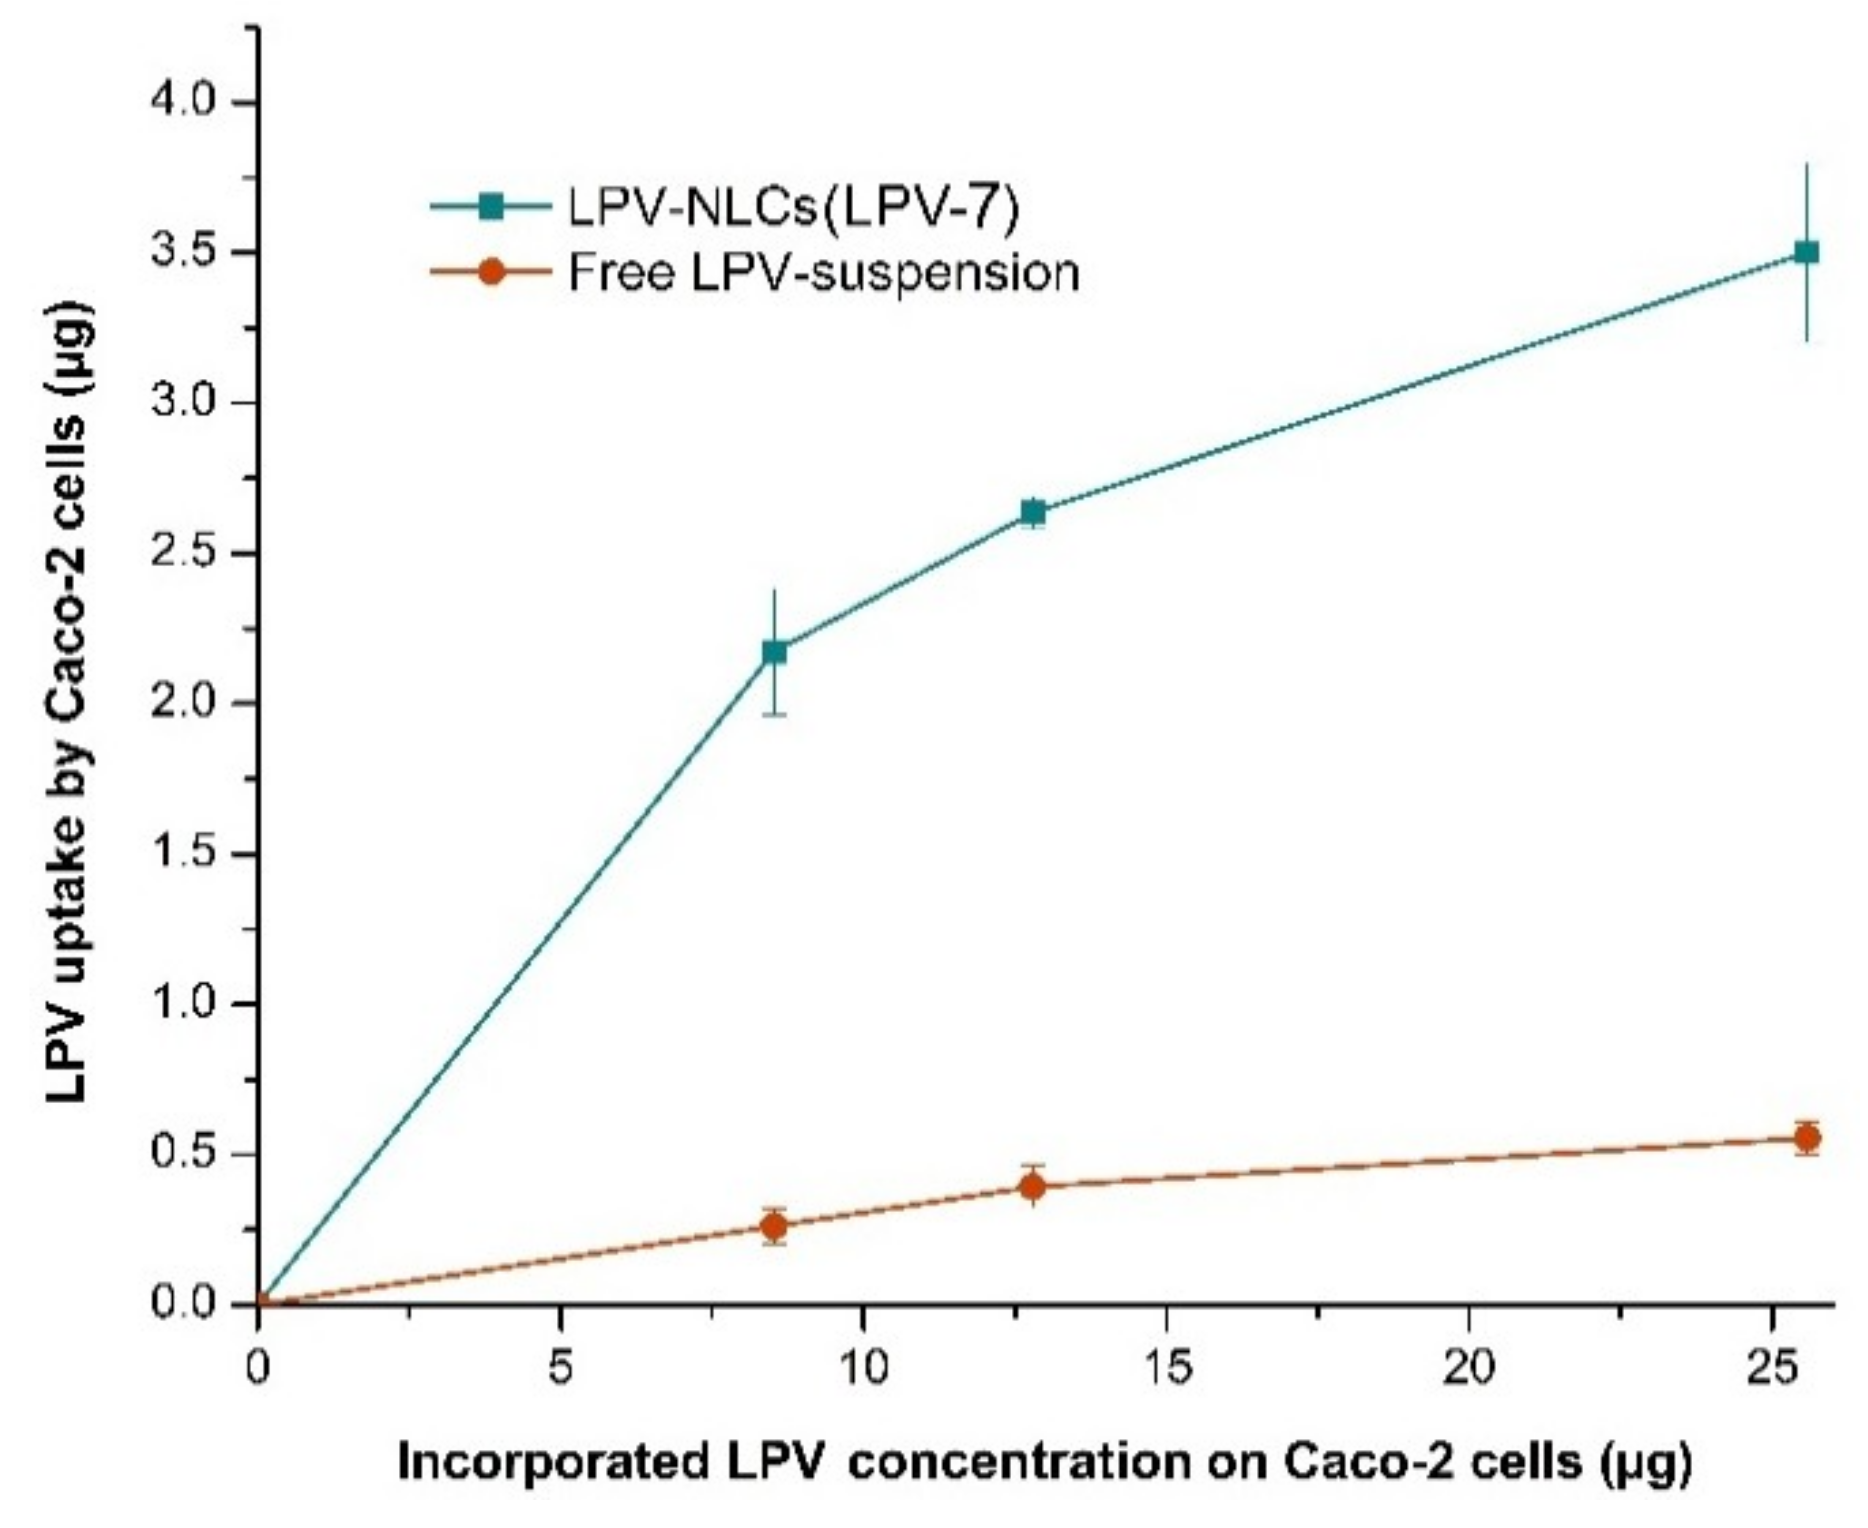
Comparison of LPV cellular uptake from LPV-NLC-7-Tres and LPV-suspension in Caco-2 cells. Mean ± SD, n = 3.
Figure 8.
Comparison of LPV cellular uptake from LPV-NLC-7-Tres and LPV-suspension in Caco-2 cells. Mean ± SD, n = 3.
Figure 9.
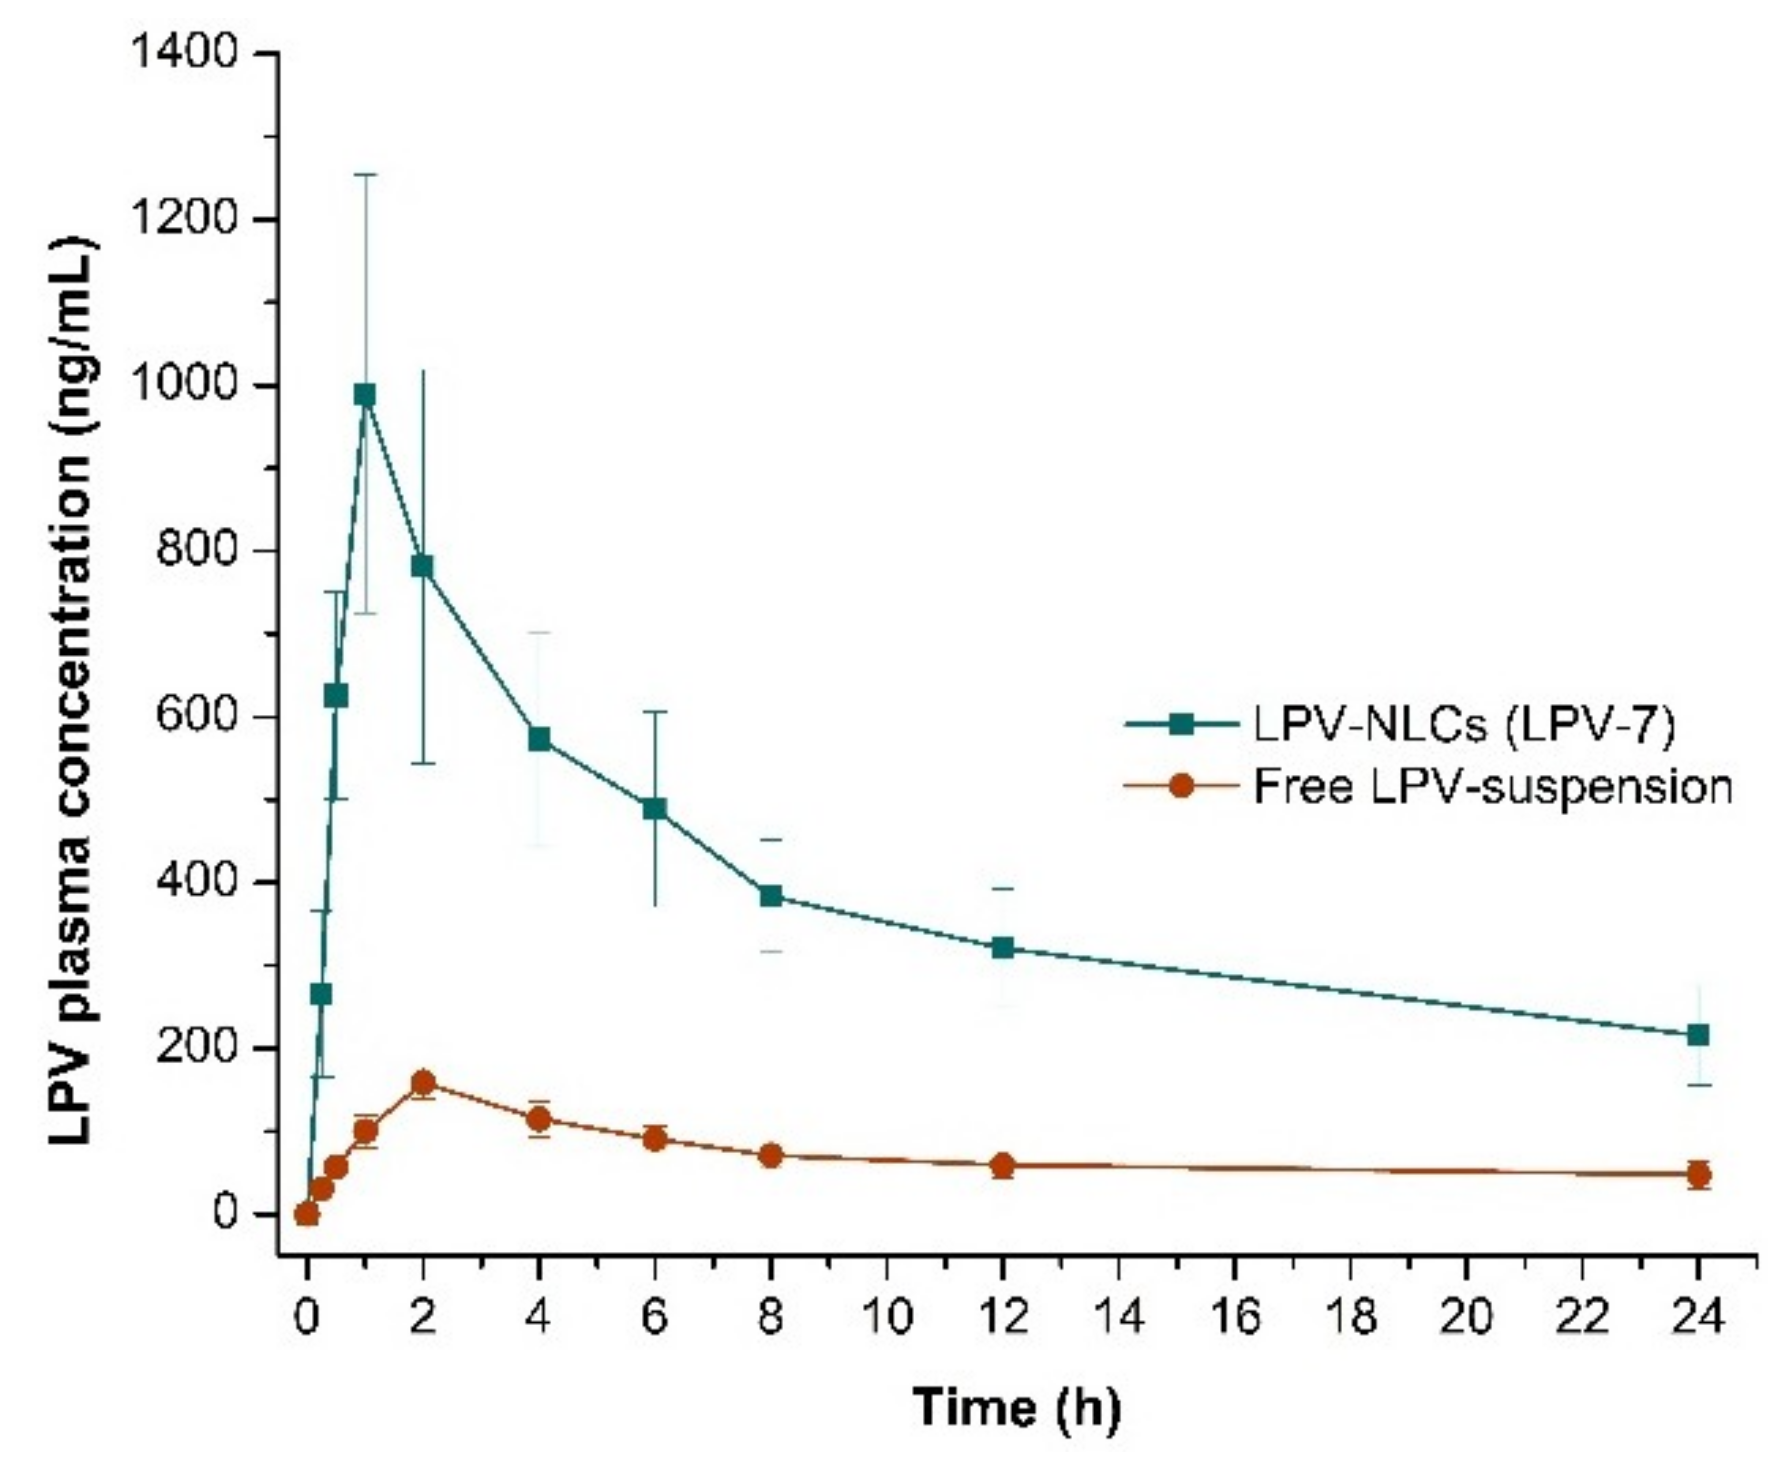
Comparison of LPV mean plasma concentration for 24 h following oral administration of LPV-NLC-7-Tres and LPV-suspension in rats. Mean ± S.D, n = 6.
Figure 9.
Comparison of LPV mean plasma concentration for 24 h following oral administration of LPV-NLC-7-Tres and LPV-suspension in rats. Mean ± S.D, n = 6.
Table 1.
Description of 24 full factorial design.
Table 1.
Description of 24 full factorial design.
| Factors (Independent Variables) | Low Level | High Level |
| A: Homogenization time | 20.00 min | 30.00 min |
| B: Solid lipid (compritol 888 ATO®) | 270.00 mg | 285.00 mg |
| C: Liquid lipid (oleic acid) | 15.00 mg | 30.00 mg |
| D: Surfactants (poloxamer 188: Tween® 80, 1:1) | 200.00 mg | 300.00 mg |
| Responses (Dependent Variables) | Constraints | |
| PS (nm) | Minimize | |
| PdI | Minimize | |
| ZP (mV) | Maximize | |
Table 2.
Optimization of independent variables and the responses of dependent variables.
Table 2.
Optimization of independent variables and the responses of dependent variables.
| Formula Code | Independent Variables | Dependent Variables Responses |
|---|
| (A) Homogenization Time (min) | (B) Solid lipid (mg) | (C) Liquid lipid (mg) | (D) Surfactant (mg) | PS (nm) | PdI | ZP (mV) |
|---|
| NLC-1 | 20 | 270 | 15 | 200 | 90.47 ± 2.55 | 0.44 ± 0.01 | −36.4 ± 0.65 |
| NLC-2 | 30 | 270 | 15 | 200 | 77.68 ± 2.29 | 0.44 ± 0.02 | −33.2 ± 0.91 |
| NLC-3 | 20 | 285 | 15 | 200 | 116.96 ± 4.09 | 0.52 ± 0.01 | −42.9 ± 1.66 |
| NLC-4 | 30 | 285 | 15 | 200 | 87.20 ± 1.79 | 0.42 ± 0.01 | −41.6 ± 2.92 |
| NLC-5 | 20 | 270 | 30 | 200 | 105.27 ± 11.29 | 0.45 ± 0.02 | −40.3 ± 4.36 |
| NLC-6 | 30 | 270 | 30 | 200 | 102.07 ± 32.26 | 0.39 ± 0.08 | −38.0 ± 1.50 |
| NLC-7 | 20 | 285 | 30 | 200 | 109.96 ± 5.81 | 0.44 ± 0.02 | −48.4 ± 1.19 |
| NLC-8 | 30 | 285 | 30 | 200 | 83.63 ± 6.55 | 0.47 ± 0.04 | −41.0 ± 2.35 |
| NLC-9 | 20 | 270 | 15 | 300 | 309.86 ± 56.24 | 0.36 ± 0.06 | −54.1 ± 4.36 |
| NLC-10 | 30 | 270 | 15 | 300 | 182.7 ± 62.66 | 0.35 ± 0.04 | −60.9 ± 1.64 |
| NLC-11 | 20 | 285 | 15 | 300 | 108.2 ± 7.90 | 0.54 ± 0.02 | −35.1 ± 1.01 |
| NLC-12 | 30 | 285 | 15 | 300 | 86.37 ± 4.49 | 0.44 ± 0.02 | −35.9 ± 5.68 |
| NLC-13 | 20 | 270 | 30 | 300 | 135.86 ± 8.15 | 0.53 ± 0.02 | −43.8 ± 1.46 |
| NLC-14 | 30 | 270 | 30 | 300 | 119.8 ± 4.97 | 0.50 ± 0.08 | −51.2 ± 0.86 |
| NLC-15 | 20 | 285 | 30 | 300 | 166 ± 7.37 | 0.45 ± 0.03 | −48.9 ± 4.37 |
| NLC-16 | 30 | 285 | 30 | 300 | 157.63 ± 32.16 | 0.46 ± 0.17 | −49.5 ± 0.94 |
Table 3.
Yield and entrapment efficiency of selected LPV-loaded NLCs formulations.
Table 3.
Yield and entrapment efficiency of selected LPV-loaded NLCs formulations.
| Formula Code | Drug Added (mg) | % Yield | % Encapsulation Efficiency |
|---|
| LPV-NLC-1 | 20 | 97.58 ± 0.56 | 70.7 ± 2.15 |
| LPV-NLC-4 | 20 | 97.16 ± 0.98 | 97 ± 1.25 |
| LPV-NLC-7 | 20 | 98.44 ± 1.23 | 92.6 ± 3.20 |
| LPV-NLC-8 | 20 | 96.27 ± 1.11 | 96.75 ± 4.11 |
| LPV-NLC-12 | 20 | 99.41 ± 0.68 | 81.1 ± 2.27 |
| LPV-NLC-14 | 20 | 98.75 ± 0.75 | 83.35 ± 1.98 |
| LPV-NLC-4 | 30 | 98.24 ± 0.44 | 95.66 ± 1.15 |
| LPV-NLC-7 | 30 | 96.46 ± 0.27 | 90.53 ± 0.70 |
| LPV-NLC-8 | 30 | 97.20 ± 0.30 | 92.23 ± 2.70 |
| LPV-NLC-4 | 35 | 97.22 ± 0.18 | 80.47 ± 1.64 |
| LPV-NLC-7 | 35 | 97.06 ± 0.28 | 80.35 ± 0.97 |
| LPV-NLC-8 | 35 | 96.62 ± 0.18 | 79.60 ± 2.07 |
Table 4.
Screening of cryoprotectants.
Table 4.
Screening of cryoprotectants.
| Cryoprotectants | Ratio (Lipid: Cryoprotectant) | Before Lyophilization | After Lyophilization |
|---|
| PS (nm) | PdI | PS (nm) | PdI |
|---|
| Mannitol | 1:2 | 99.5 ± 0.900 | 0.309 ± 0.047 | NM | 1 |
| 1:4 | 1799.9 ± 483.9 | 0.924 ± 0.132 |
| 1:6 | 1901 ± 305.1 | 1 |
| 1:8 | 1544.2 ± 205.2 | 1 |
| Sorbitol | 1:2 | NM | 1 |
| 1:4 | NM | 1 |
| 1:6 | NM | 1 |
| 1:8 | NM | 1 |
| Sucrose | 1:2 | 837.0 ± 186.1 | 0.537 ± 0.411 |
| 1:4 | 897.9 ± 72.5 | 0.913 ± 0.151 |
| 1:6 | 965.2 ± 196.7 | 1 |
| 1:8 | 1028.0 ± 125.9 | 1 |
| Trehalose | 1:2 | 744.2 ± 210.1 | 0.460 ± 0.300 |
| 1:4 | 383.7 ± 19.2 | 0.586 ± 0.370 |
| 1:6 | 463.1 ± 4.7 | 0.512 ± 0.215 |
| 1:8 | 478.4 ± 13.8 | 0.591 ± 0.030 |
Table 5.
Influence of cryoprotectant addition after homogenization process on PS, PdI, ZP and %EE.
Table 5.
Influence of cryoprotectant addition after homogenization process on PS, PdI, ZP and %EE.
| Formula Code | Ratio (Lipid: Trehalose) | PS (nm) | PdI | ZP (mV) | % EE |
|---|
| Before Freeze Drying |
| LPV-NLC-4 | 1:0 | 93.6 ± 0.4 | 0.307 ± 0.016 | −43.6 ± 1.45 | 96.87 ± 0.76 |
| LPV-NLC-7 | 1:0 | 104.3 ± 0.6 | 0.383 ± 0.012 | −48.2 ± 1.50 | 91.72 ± 0.68 |
| LPV-NLC-8 | 1:0 | 92.5 ± 0.6 | 0.315 ± 0.030 | −42.5 ± 1.50 | 93.72 ± 0.96 |
| After Freeze Drying |
| LPV-NLC-4 | 1:0 | NM | 1 | −42.5 ± 0.53 | 95.66 ± 1.15 |
| LPV-NLC-4-Tres | 1:1 | 606.4 ± 98.9 | 0.361 ± 0.428 | −42.7 ± 0.36 | 71.91 ± 3.03 |
| 1:2 | 472.3 ± 698.8 | 0.758 ± 0.210 | −43.3 ± 1.49 | 68.99 ± 1.86 |
| 1:4 | 399.4 ± 1.5 | 0.720 ± 0.062 | −42.3 ± 1.38 | 68.67 ± 0.60 |
| 1:6 | 487.5 ± 8.6 | 0.233 ± 0.112 | −41.6 ± 1.45 | 82.61 ± 1.80 |
| LPV-NLC-7 | 1:0 | NM | 0.603 ± 0.447 | −47.1 ± 1.00 | 90.53 ± 0.70 |
| LPV-NLC-7-Tres | 1:1 | 1381.1 ± 383.2 | 0.898 ± 0.176 | −45.4 ± 0.95 | 69.80 ± 1.87 |
| 1:2 | 859.8 ± 330.4 | 0.649 ± 0.501 | −46.6 ± 1.25 | 68.13 ± 1.4 |
| 1:4 | 402.9 ± 11.7 | 0.277 ± 0.052 | −48.2 ± 1.75 | 71.49 ± 2.14 |
| 1:6 | 445.0 ± 51.4 | 0.531 ± 0.152 | −46.3 ± 1.80 | 78.76 ± 1.60 |
| LPV-NLC-8 | 1:0 | NM | 1 | −41.4 ± 1.27 | 92.23 ± 2.70 |
| LPV-NLC-8-Tres | 1:1 | 472.0 ± 2.3 | 0.342 ± 0.199 | −41.3 ± 1.21 | 66.77 ± 3.70 |
| 1:2 | 398.6 ± 2.4 | 0.295 ± 0.143 | −42.7 ± 0.47 | 64.25 ± 1.95 |
| 1:4 | 386.5 ± 9.7 | 0.296 ± 0.026 | −42.5 ± 0.80 | 61.05 ± 1.86 |
| 1:6 | 425.4 ± 1.6 | 0.399 ± 0.059 | −40.6 ± 0.83 | 66.44 ± 1.94 |
Table 6.
Influence of cryoprotectant addition during homogenization process on PS, PdI, ZP and %EE.
Table 6.
Influence of cryoprotectant addition during homogenization process on PS, PdI, ZP and %EE.
| Formula Code | Ratio (Lipid: Trehalose) | After Freeze Drying |
|---|
| PS (nm) | PdI | ZP (mV) | % EE |
|---|
| LPV-NLC-4-Tres | 1:1 | 935.5 ± 1.50 | 0.468 ± 0.032 | −43.8 ± 2.96 | 79.12 ± 1.32 |
| 1:2 | 750.2 ± 1.20 | 1 | −41.5 ± 1.24 | 78.43 ± 3.21 |
| 1:4 | 337.5 ± 8.00 | 0.475 ± 0.145 | −41.7 ± 1.15 | 79.38 ± 5.93 |
| 1:6 | 920.4 ± 2.50 | 0.798 ± 0.211 | −42.6 ± 0.78 | 84.54 ± 1.17 |
| LPV-NLC-7-Tres | 1:1 | NM | 1 | −48.2 ± 0.95 | 80.32 ± 1.33 |
| 1:2 | 969.9 ± 1.90 | 1 | −47.3 ± 1.00 | 79.54 ± 3.24 |
| 1:4 | 286.8 ± 1.30 | 0.413 ± 0.017 | −48.6 ± 0.89 | 88.31 ± 2.04 |
| 1:6 | 775.5 ± 160.11 | 0.957 ± 1.21 | -46.6 ± 0.50 | 89.15 ± 4.33 |
| LPV-NLC-8-Tres | 1:1 | 1244.6 ± 536.36 | 1 | -42.2 ± 0.95 | 76.23 ± 2.67 |
| 1:2 | 1082.52 ± 483.93 | 1 | -41.6 ± 0.98 | 75.24 ± 3.28 |
| 1:4 | 335.8 ± 3.10 | 0.525 ± 0.037 | -40.6 ± 0.55 | 84.93 ± 1.62 |
| 1:6 | 870.42 ± 343.70 | 1 | -42.6 ± 1.45 | 77.43 ± 4.94 |
Table 7.
The stability of optimized LPV-NLCs-7-Tres formulation stored at 5 ± 3 °C, 25 ± 2 °C/60 ± 5% RH and 40 ± 2 °C/75 ± 5% RH (n = 3).
Table 7.
The stability of optimized LPV-NLCs-7-Tres formulation stored at 5 ± 3 °C, 25 ± 2 °C/60 ± 5% RH and 40 ± 2 °C/75 ± 5% RH (n = 3).
| Stability at 5 ± 3 °C |
| Parameters | 0 month | 1 month | 3 months | 6 months |
| PS (nm) | 255.8 ± 1.4 | 275.5 ± 5.7 | 286.5 ± 11.2 | 292.5 ± 9.8 |
| PdI | 0.531 ± 0.085 | 0.589 ± 0.115 | 0.543 ± 0.112 | 0.552 ± 0.112 |
| ZP (mV) | −48.50 ± 0.60 | −48.30 ± 1.51 | −47.10 ± 1.20 | −47.50 ± 2.75 |
| Drug content (%EE) | 100.06 ± 0.07 | 99.93 ± 0.66 | 98.91 ± 0.61 | 97.82 ± 0.62 |
| Stability at 25 ± 2 °C/60 ± 5% RH |
| Parameters | 0 month | 1 month | 3 months | 6 months |
| PS (nm) | 255.8 ± 1.4 | 800.6 ± 159.31 | NM | NM |
| PdI | 0.531 ± 0.085 | 1 | NM | NM |
| ZP (mV) | −48.50 ± 0.60 | −45.50 ± 1.63 | −47.50 ± 1.42 | −42.10 ± 2.66 |
| Drug content (%EE) | 100.06 ± 0.069 | 92.89 ± 1.008 | 88.93 ± 0.372 | 84.61 ± 0.715 |
| Stability at 40 ± 2 °C/75 ± 5% RH |
| Parameters | 0 month | 1 month | 3 months | 6 months |
| PS (nm) | 255.8 ± 1.4 | 933.93 ± 312.01 | NM | NM |
| PdI | 0.531 ± 0.085 | 1 | NM | NM |
| ZP (mV) | −48.50 ± 0.60 | −46.90 ± 1.77 | −45.60 ± 1.20 | −45.70 ± 3.65 |
| Drug content (%EE) | 100.06 ± 0.07 | 76.64 ± 0.62 | 71.32 ± 5.53 | 68.54 ± 11.74 |
Table 8.
Pharmacokinetic parameters of LPV-NLC-7-Tres and free LPV-suspension after oral administration.
Table 8.
Pharmacokinetic parameters of LPV-NLC-7-Tres and free LPV-suspension after oral administration.
| Formulation | Pharmacokinetic Parameters |
|---|
| AUC0-∞ ± SD (ng-h/mL) | Cmax ± SD (ng/mL) | Tmax ± SD (h) | t1/2 ± SD (h) | Ke ± SD (h−1) |
|---|
| LPV-NLC-7-Tres | 14635.1 ± 3847.5 | 990.1 ± 264.7 | 1 ± 0.00 | 16.5 ± 2.36 | 0.0421 ± 0.007 |
| Free LPV-suspension | 2094.5 ± 473.8 | 158.3 ± 18.5 | 2 ± 0.00 | 5.4 ± 0.904 | 0.121 ± 0.021 |

 ,
, 


