In Vitro and In Vivo Assessment of Metabolic Drug Interaction Potential of Dutasteride with Ketoconazole

 ,
,
Abstract
:1. Introduction
2. Materials and Methods
2.1. Materials
2.2. Spectrofluorometric Evaluation
2.3. Preparation of Calibration Standards and Quality Control Samples
2.4. Chromatographic Conditions
2.5. Bioanalytical Method Validation
2.6. In Vivo Pharmacokinetic Study in Rats
2.7. In Vitro Microsomal Metabolism, Protein Binding, and Blood Distribution Studies
2.8. Data Analysis
2.9. Statistical Analysis
3. Results
3.1. Method Development and Optimization
3.2. Selectivity, Linearity, Sensitivity, Precision, and Accuracy
3.3. Recovery, Matrix Effect, Dilution Integrity, and Stability
3.4. In Vivo Pharmacokinetic Drug Interaction Study in Rats
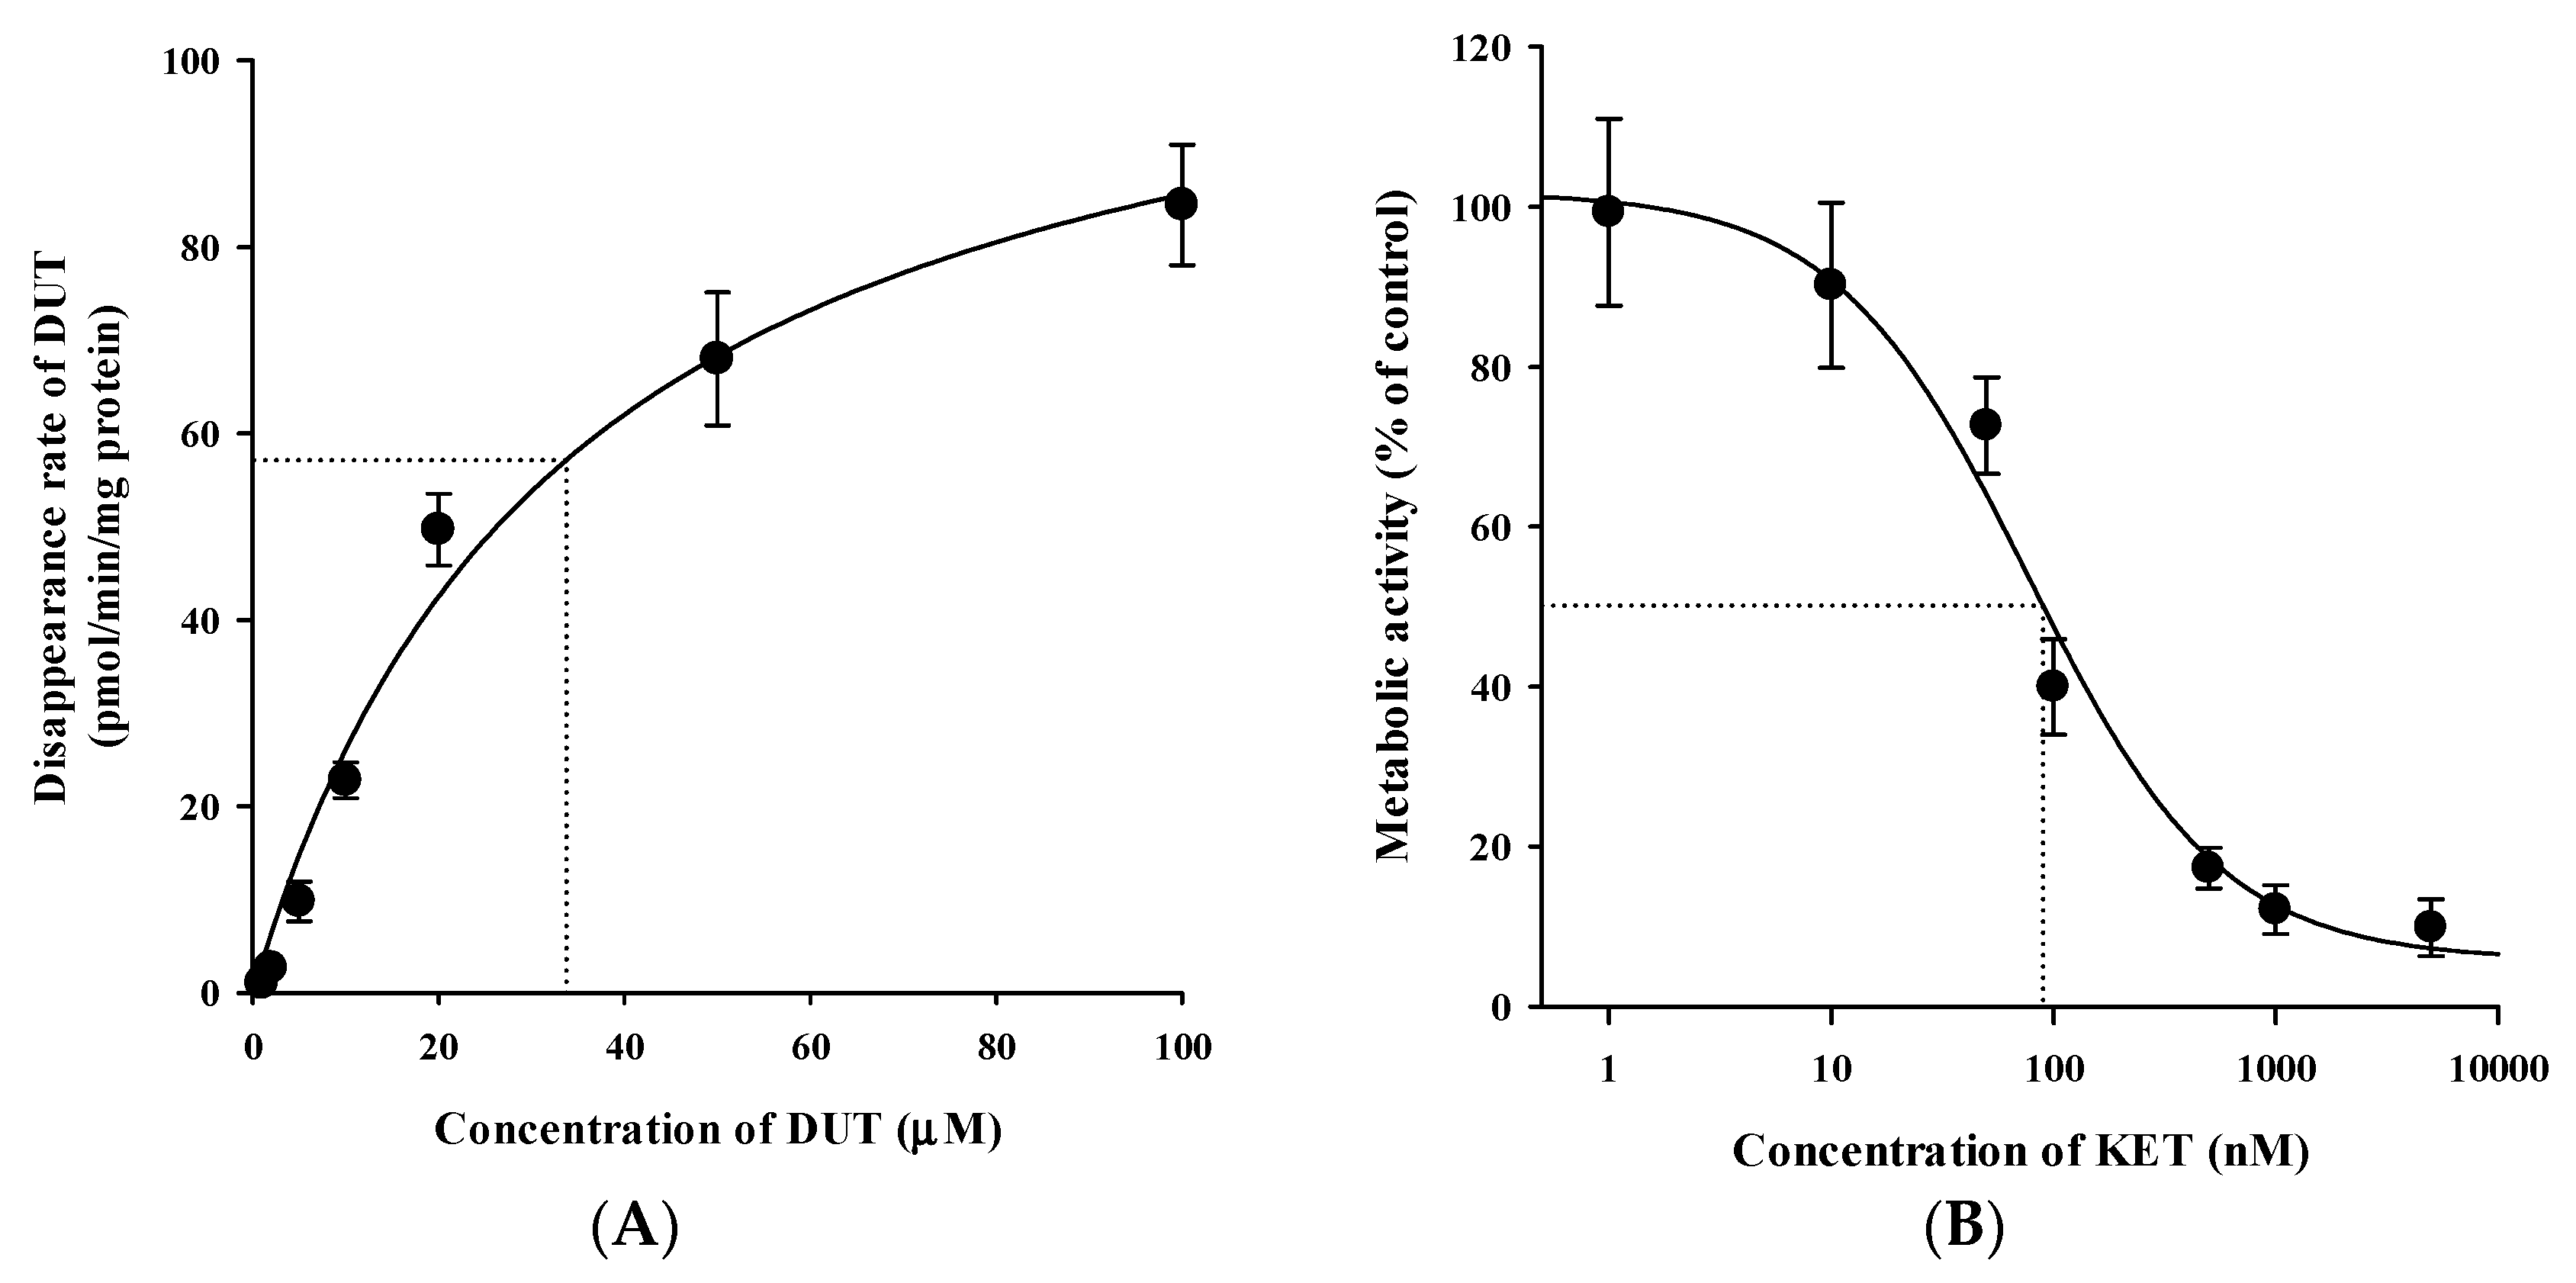
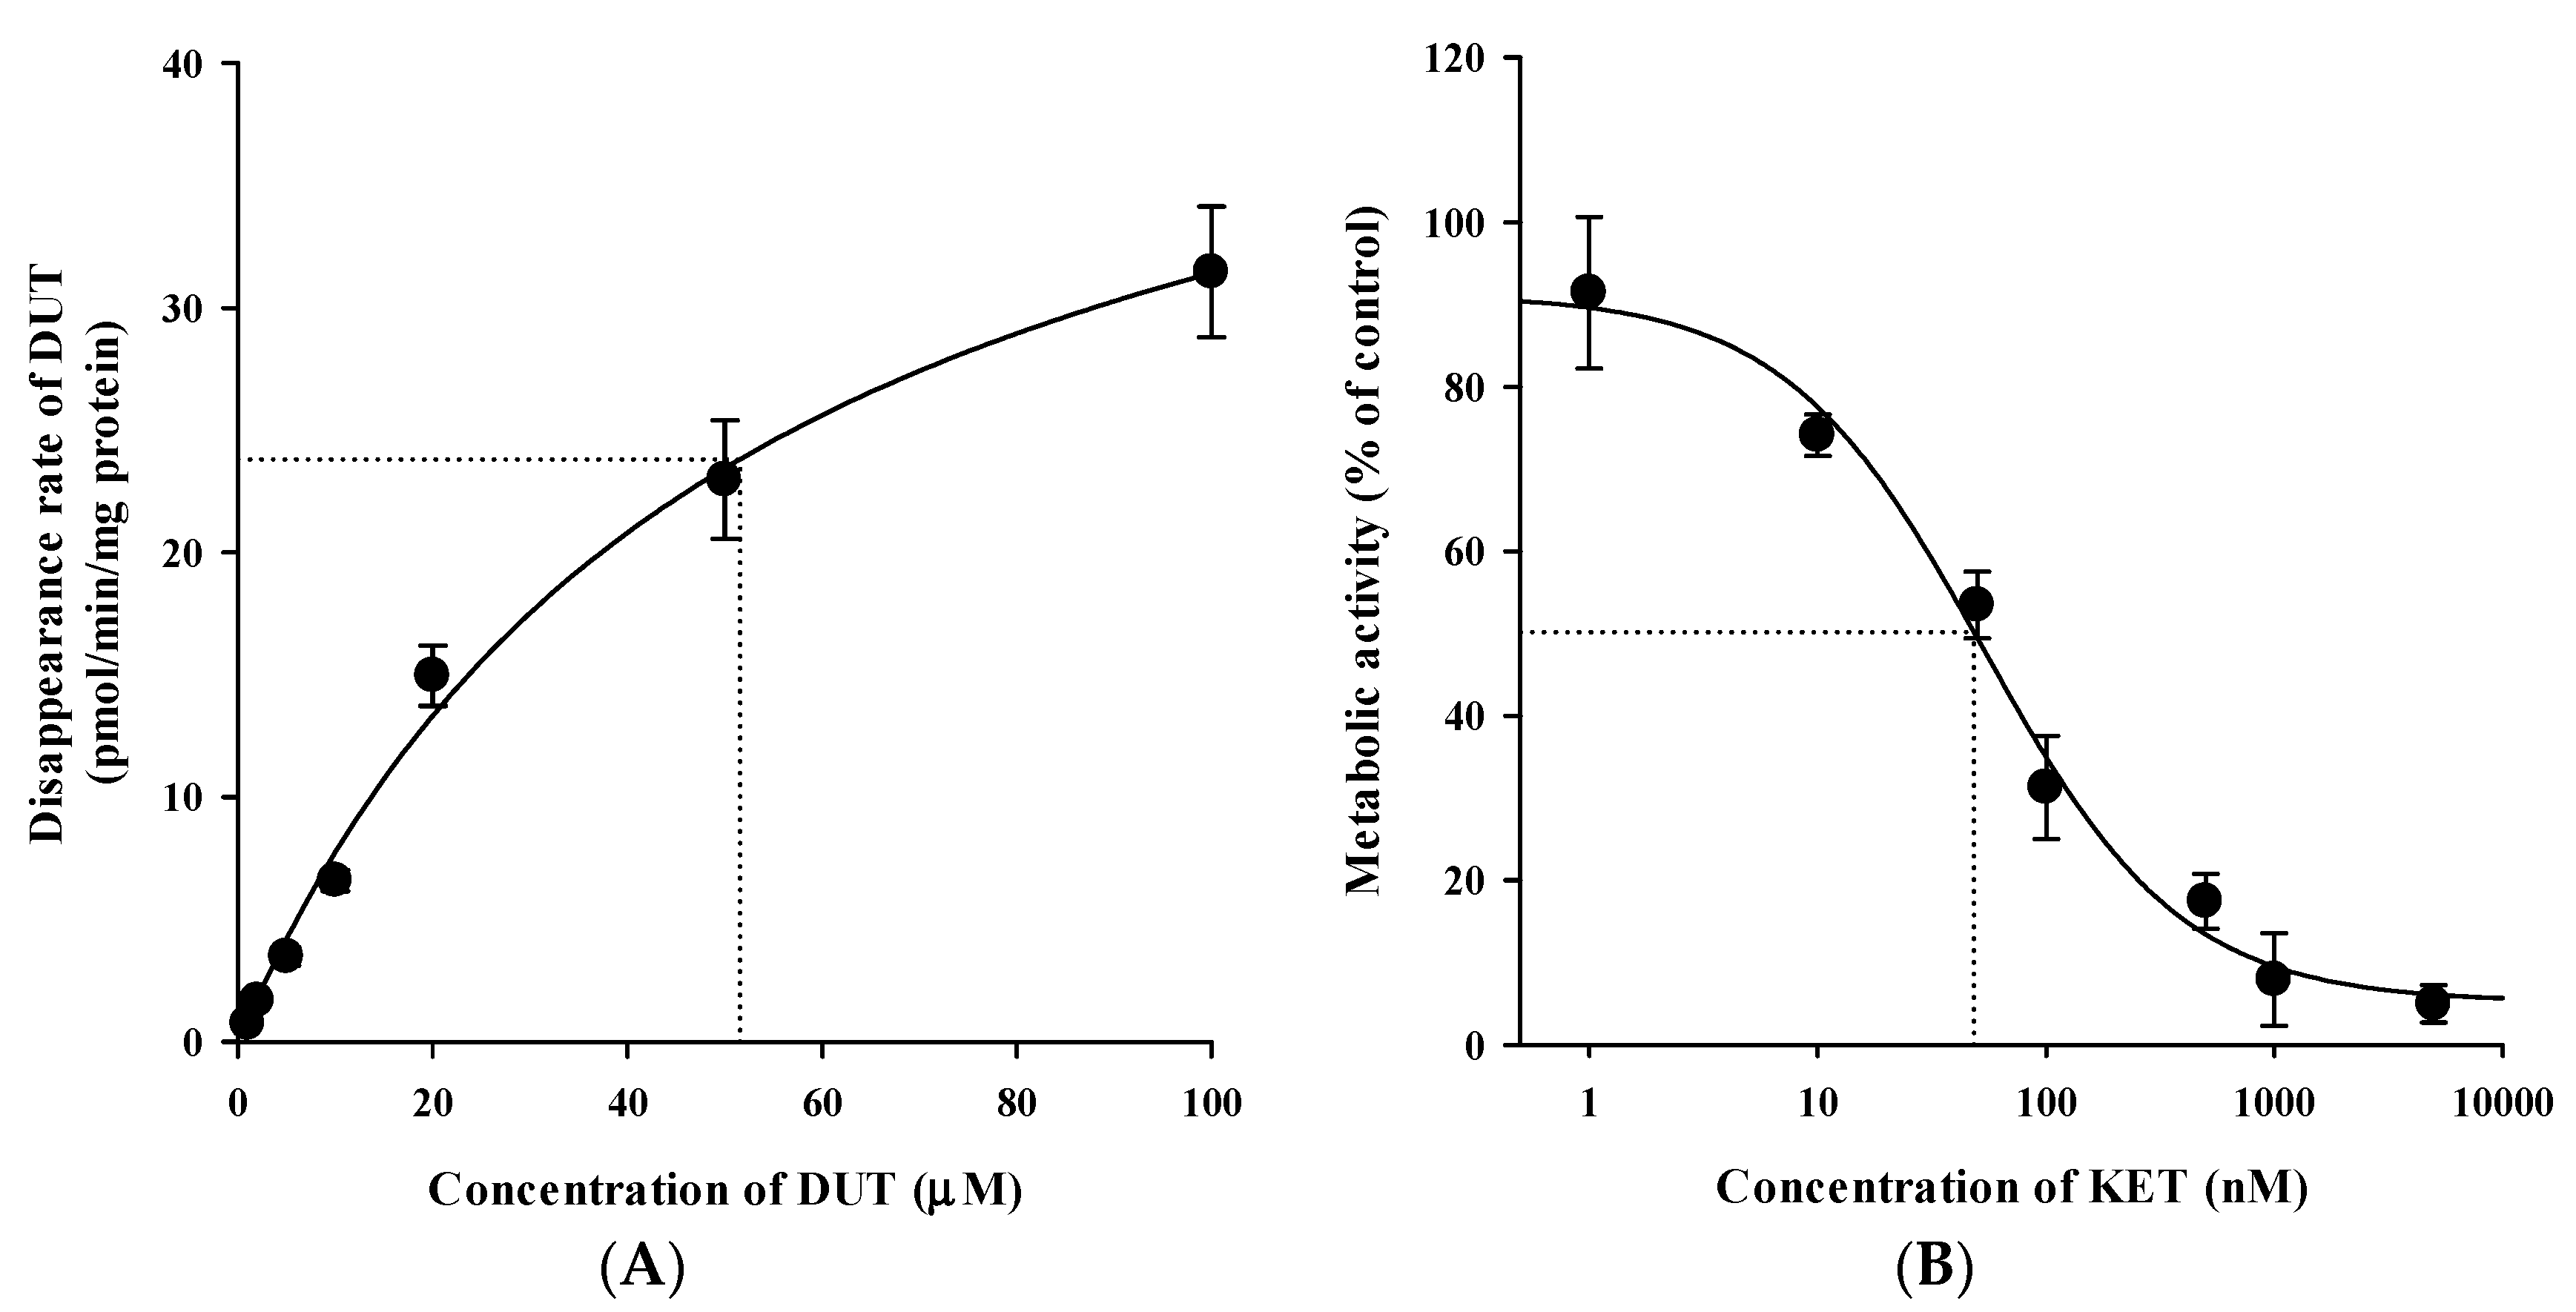
3.5. In Vitro Microsomal Metabolism, Protein Binding, and Blood Distribution Studies
4. Discussion
5. Conclusions
Supplementary Materials
Author Contributions
Funding
Conflicts of Interest
References
- Andriole, G.; Bruchovsky, N.; Chung, L.W.; Matsumoto, A.M.; Rittmaster, R.; Roehrborn, C.; Russell, D.; Tindall, D. Dihydrotestosterone and the prostate: The scientific rationale for 5α-reductase inhibitors in the treatment of benign prostatic hyperplasia. J. Urol. 2004, 172, 1399–1403. [Google Scholar] [CrossRef] [PubMed]
- Lepor, H. Pathophysiology, epidemiology, and natural history of benign prostatic hyperplasia. Rev. Urol. 2004, 6, S3–S10. [Google Scholar] [PubMed]
- Iehle, C.; Radvanyi, F.; Gil Diez de Medina, S.; Ouafik, L.H.; Gerard, H.; Chopin, D.; Raynaud, J.P.; Martin, P.M. Differences in steroid 5α-reductase iso-enzymes expression between normal and pathological human prostate tissue. J. Steroid Biochem. Mol. Biol. 1999, 68, 189–195. [Google Scholar] [CrossRef]
- Kaufman, K.D. Androgens and alopecia. Mol. Cell. Endocrinol. 2002, 198, 89–95. [Google Scholar] [CrossRef]
- Marks, L.S. 5α-reductase: History and clinical importance. Rev. Urol. 2004, 6, S11–S21. [Google Scholar]
- Keam, S.J.; Scott, L.J. Dutasteride: A review of its use in the management of prostate disorders. Drugs 2008, 68, 463–485. [Google Scholar] [CrossRef]
- Arif, T.; Dorjay, K.; Adil, M.; Sami, M. Dutasteride in androgenetic alopecia: An update. Curr. Clin. Pharmacol. 2017, 12, 31–35. [Google Scholar] [CrossRef]
- Marberger, M. Drug insight: 5α-reductase inhibitors for the treatment of benign prostatic hyperplasia. Nat. Clin. Pract. Urol. 2006, 3, 495–503. [Google Scholar] [CrossRef]
- Frye, S.V. Discovery and clinical development of dutasteride, a potent dual 5α-reductase inhibitor. Curr. Top. Med. Chem. 2006, 6, 405–421. [Google Scholar] [CrossRef]
- Kassem, M.G.; Ezzeldin, E.; Korashy, H.M.; Mostafa, G.A. High-performance liquid chromatographic method for the determination of dasatinib in rabbit plasma using fluorescence detection and its application to a pharmacokinetic study. J. Chromatogr. B 2013, 939, 73–79. [Google Scholar] [CrossRef]
- Han, D.G.; Yun, H.; Yoon, I.S. A novel high-performance liquid chromatographic method combined with fluorescence detection for determination of ertugliflozin in rat plasma: Assessment of pharmacokinetic drug interaction potential of ertugliflozin with mefenamic acid and ketoconazole. J. Chromatogr. B 2019, 1122, 49–57. [Google Scholar] [CrossRef]
- Farthing, C.A.; Farthing, D.E.; Koka, S.; Larus, T.; Fakhry, I.; Xi, L.; Kukreja, R.C.; Sica, D.; Gehr, T.W. A simple and sensitive HPLC fluorescence method for determination of tadalafil in mouse plasma. J. Chromatogr. B 2010, 878, 2891–2895. [Google Scholar] [CrossRef] [Green Version]
- Kim, K.T.; Lee, J.Y.; Park, J.H.; Kim, M.H.; Kim, J.S.; Shin, H.J.; Kang, N.; Cho, H.J.; Yoon, I.S.; Kim, D.D. Development of HPLC method for the determination of buspirone in rat plasma using fluorescence detection and its application to a pharmacokinetic study. Chem. Pharm. Bull. 2016, 64, 1582–1588. [Google Scholar] [CrossRef] [Green Version]
- Makaji, E.; Trambitas, C.S.; Shen, P.; Holloway, A.C.; Crankshaw, D.J. Effects of cytochrome P450 inhibitors on the biotransformation of fluorogenic substrates by adult male rat liver microsomes and cDNA-expressed rat cytochrome P450 isoforms. Toxicol. Sci. 2010, 113, 293–304. [Google Scholar] [CrossRef] [Green Version]
- Chughtai, B.; Forde, J.C.; Thomas, D.D.; Laor, L.; Hossack, T.; Woo, H.H.; Te, A.E.; Kaplan, S.A. Benign prostatic hyperplasia. Nat. Rev. Dis. Primers 2016, 2, 16031. [Google Scholar] [CrossRef] [Green Version]
- Bongomin, F.; Gago, S.; Oladele, R.O.; Denning, D.W. Global and Multi-National Prevalence of Fungal Diseases-Estimate Precision. J. Fungi 2017, 3, 57. [Google Scholar] [CrossRef]
- USA Food and Drug Administration. Guidance for Industry: Bioanalytical Method Validation. 2018. Available online: https://www.fda.gov/media/70858/download (accessed on 28 November 2019).
- Han, D.G.; Kwak, J.; Seo, S.W.; Kim, J.M.; Yoo, J.W.; Jung, Y.; Lee, Y.H.; Kim, M.S.; Jung, Y.S.; Yun, H.; et al. Pharmacokinetic evaluation of metabolic drug interactions between repaglinide and celecoxib by a bioanalytical HPLC method for their simultaneous determination with fluorescence detection. Pharmaceutics 2019, 11, 382. [Google Scholar] [CrossRef] [Green Version]
- Avery, B.A.; Pabbisetty, D.; Li, L.; Sharma, A.; Gundluru, M.K.; Chittiboyina, A.G.; Williamson, J.S.; Avery, M.A. A pharmacokinetic comparison of homodimer ARB-92 and heterodimer ARB-89: Novel, potent antimalarial candidates derived from 7β-hydroxyartemisinin. J. Pharm. Investig. 2018, 48, 585–593. [Google Scholar] [CrossRef]
- Maeng, H.J.; Doan, T.N.K.; Yoon, I.S. Differential regulation of intestinal and hepatic CYP3A by 1α,25-dihydroxyvitamin D3: Effects on in vivo oral absorption and disposition of buspirone in rats. Drug Dev. Res. 2019, 80, 333–342. [Google Scholar] [CrossRef]
- Cho, S.J.; Kim, S.B.; Cho, H.J.; Chong, S.; Chung, S.J.; Kang, I.M.; Lee, J.I.; Yoon, I.S.; Kim, D.D. Effects of nonalcoholic fatty liver disease on hepatic CYP2B1 and in vivo bupropion disposition in rats Fed a high-fat or methionine/choline-deficient diet. J. Agric. Food Chem. 2016, 64, 5598–5606. [Google Scholar] [CrossRef]
- Kim, S.B.; Kim, K.S.; Ryu, H.M.; Hong, S.H.; Kim, B.K.; Kim, D.D.; Park, J.W.; Yoon, I.S. Modulation of rat hepatic CYP1A and 2C activity by honokiol and magnolol: Differential effects on phenacetin and diclofenac pharmacokinetics in vivo. Molecules 2018, 23, 1470. [Google Scholar] [CrossRef] [PubMed] [Green Version]
- Kim, S.B.; Lee, T.; Lee, H.S.; Song, C.K.; Cho, H.J.; Kim, D.D.; Maeng, H.J.; Yoon, I.S. Development and validation of a highly sensitive LC-MS/MS method for the determination of acacetin in human plasma and its application to a protein binding study. Arch. Pharm. Res. 2016, 39, 213–220. [Google Scholar] [CrossRef] [PubMed]
- Kim, S.B.; Kim, K.S.; Ryu, H.M.; Yoon, I.S.; Cho, H.J.; Chung, S.J.; Chong, S.; Kim, D.D. Comparison of saline vs. blood replenishment after blood sampling in a rat pharmacokinetic study. J. Pharm. Investig. 2019, 49, 543–551. [Google Scholar] [CrossRef]
- Yoon, I.; Han, S.; Choi, Y.H.; Kang, H.E.; Cho, H.J.; Kim, J.S.; Shim, C.K.; Chung, S.J.; Chong, S.; Kim, D.D. Saturable sinusoidal uptake is rate-determining process in hepatic elimination of docetaxel in rats. Xenobiotica 2012, 42, 1110–1119. [Google Scholar] [CrossRef] [PubMed]
- Lee, J.Y.; Kim, S.B.; Chun, J.; Song, K.H.; Kim, Y.S.; Chung, S.J.; Cho, H.J.; Yoon, I.S.; Kim, D.D. High body clearance and low oral bioavailability of alantolactone, isolated from Inula helenium, in rats: Extensive hepatic metabolism and low stability in gastrointestinal fluids. Biopharm. Drug Dispos. 2016, 37, 156–167. [Google Scholar] [CrossRef]
- Kim, S.B.; Cho, H.J.; Kim, Y.S.; Kim, D.D.; Yoon, I.S. Modulation of cytochrome P450 activity by 18β-glycyrrhetic acid and its consequence on buspirone pharmacokinetics in rats. Phytother. Res. 2015, 29, 1188–1194. [Google Scholar] [CrossRef]
- Ku, J.H.; Shin, J.K.; Cho, M.C.; Myung, J.K.; Moon, K.C.; Paick, J.S. Effect of dutasteride on the expression of hypoxia-inducible factor-1α, vascular endothelial growth factor and microvessel density in rat and human prostate tissue. Scand. J. Urol. Nephrol. 2009, 43, 445–453. [Google Scholar] [CrossRef]
- Bortolato, M.; Frau, R.; Orru, M.; Bourov, Y.; Marrosu, F.; Mereu, G.; Devoto, P.; Gessa, G.L. Antipsychotic-like properties of 5-α-reductase inhibitors. Neuropsychopharmacology 2008, 33, 3146–3156. [Google Scholar] [CrossRef] [Green Version]
- Baek, I.H.; Ha, E.S.; Yoo, J.W.; Jung, Y.; Kim, M.S. Design of a gelatin microparticle-containing self-microemulsifying formulation for enhanced oral bioavailability of dutasteride. Drug Des. Dev. Ther. 2015, 9, 3231–3238. [Google Scholar]
- Bramson, H.N.; Hermann, D.; Batchelor, K.W.; Lee, F.W.; James, M.K.; Frye, S.V. Unique preclinical characteristics of GG745, a potent dual inhibitor of 5AR. J. Pharmacol. Exp. Ther. 1997, 282, 1496–1502. [Google Scholar]
- Watanabe, T.; Kusuhara, H.; Maeda, K.; Kanamaru, H.; Saito, Y.; Hu, Z.; Sugiyama, Y. Investigation of the rate-determining process in the hepatic elimination of HMG-CoA reductase inhibitors in rats and humans. Drug Metab. Dispos. 2010, 38, 215–222. [Google Scholar] [CrossRef]
- Musther, H.; Harwood, M.D.; Yang, J.; Turner, D.B.; Rostami-Hodjegan, A.; Jamei, M. The constraints, construction, and verification of a strain-specific physiologically based pharmacokinetic rat model. J. Pharm. Sci. 2017, 106, 2826–2838. [Google Scholar] [CrossRef] [Green Version]
- USA Food and Drug Administration. Guidance for Industry: In Vitro Metabolism and Transporter-Mediated Drug-Drug Interaction Studies. 2017. Available online: https://www.fda.gov/media/108130/download (accessed on 28 November 2019).
- USA Food and Drug Administration. Guidance for Industry: Clinical Drug Interaction Studies-Study Design, Data Analysis, and Clinical Implications. 2017. Available online: https://www. fda. gov/downloads/drugs/guidances/ucm292362. pdf (accessed on 28 November 2019).
- Cho, H.J.; Kim, J.E.; Kim, D.D.; Yoon, I.S. In Vitro-In Vivo extrapolation (IVIVE) for predicting human intestinal absorption and first-pass elimination of drugs: Principles and applications. Drug Dev. Ind. Pharm. 2014, 40, 989–998. [Google Scholar] [CrossRef] [PubMed]
- Marihart, S.; Harik, M.; Djavan, B. Dutasteride: A review of current data on a novel dual inhibitor of 5α reductase. Rev. Urol. 2005, 7, 203–210. [Google Scholar] [PubMed]


| Nominal Concentration (ng/mL) | Precision (%) | Accuracy (%) | ||
|---|---|---|---|---|
| Intra-Assay | Inter-Assay | Intra-Assay | Inter-Assay | |
| DUT | ||||
| LLOQ (10) | 1.67 | 5.83 | 108 | 104 |
| LQC (30) | 2.84 | 3.84 | 103 | 101 |
| MQC (150) | 1.27 | 2.43 | 101 | 100 |
| HQC (750) | 1.61 | 1.47 | 100 | 101 |
| H-DUT | ||||
| LLOQ (10) | 6.86 | 3.36 | 104 | 105 |
| LQC (30) | 6.48 | 3.91 | 99.0 | 97.2 |
| MQC (150) | 0.81 | 2.99 | 99.9 | 100 |
| HQC (750) | 1.00 | 1.42 | 102 | 100 |
| Nominal Concentration (ng/mL) | Recovery (%) | Matrix Effect (%) |
|---|---|---|
| DUT | ||
| LLOQ (10) | 93.5 ± 4.1 | 97.5 ± 2.1 |
| LQC (30) | 93.3 ± 3.5 | 95.1 ± 2.1 |
| MQC (150) | 93.7 ± 1.1 | 96.9 ± 2.8 |
| HQC (750) | 95.4 ± 1.3 | 97.8 ± 1.5 |
| H-DUT | ||
| LLOQ (10) | 93.2± 3.0 | 96.8 ± 3.1 |
| LQC (30) | 95.3 ± 4.2 | 94.0 ± 5.7 |
| MQC (150) | 96.6 ± 1.0 | 98.3 ± 2.1 |
| HQC (750) | 97.6 ± 1.8 | 100 ± 2 |
| IS (celecoxib, 400) | 96.8 ± 1.6 | 91.4 ± 0.3 |
| Nominal Concentration (ng/mL) | Bench-Top a | Autosampler b | Freeze‒Thaw c | Long-Term d |
|---|---|---|---|---|
| DUT | ||||
| LLOQ (10) | 108 ± 1 | 103 ± 8 | 99.3 ± 4.7 | 105 ± 5 |
| LQC (30) | 105 ± 6 | 103 ± 1 | 99.7 ± 2.7 | 102 ± 4 |
| MQC (150) | 103 ± 1 | 104 ± 2 | 106 ± 2 | 100 ± 1 |
| HQC (750) | 102 ± 0 | 102 ± 2 | 100 ± 0 | 105 ±1 |
| H-DUT | ||||
| LLOQ (10) | 102 ± 4 | 103 ± 4 | 101 ± 7 | 96.1 ± 4.7 |
| LQC (30) | 104 ± 9 | 97.1 ± 0.8 | 99.0 ± 2.3 | 95.1 ± 3.7 |
| MQC (150) | 99.0 ± 1.4 | 103 ± 4 | 103 ± 3 | 98.7 ± 1.5 |
| HQC (750) | 101 ± 0 | 104 ± 1 | 101 ± 1 | 106 ± 1 |
| Parameter | DUT alone | DUT with KET |
|---|---|---|
| DUT | ||
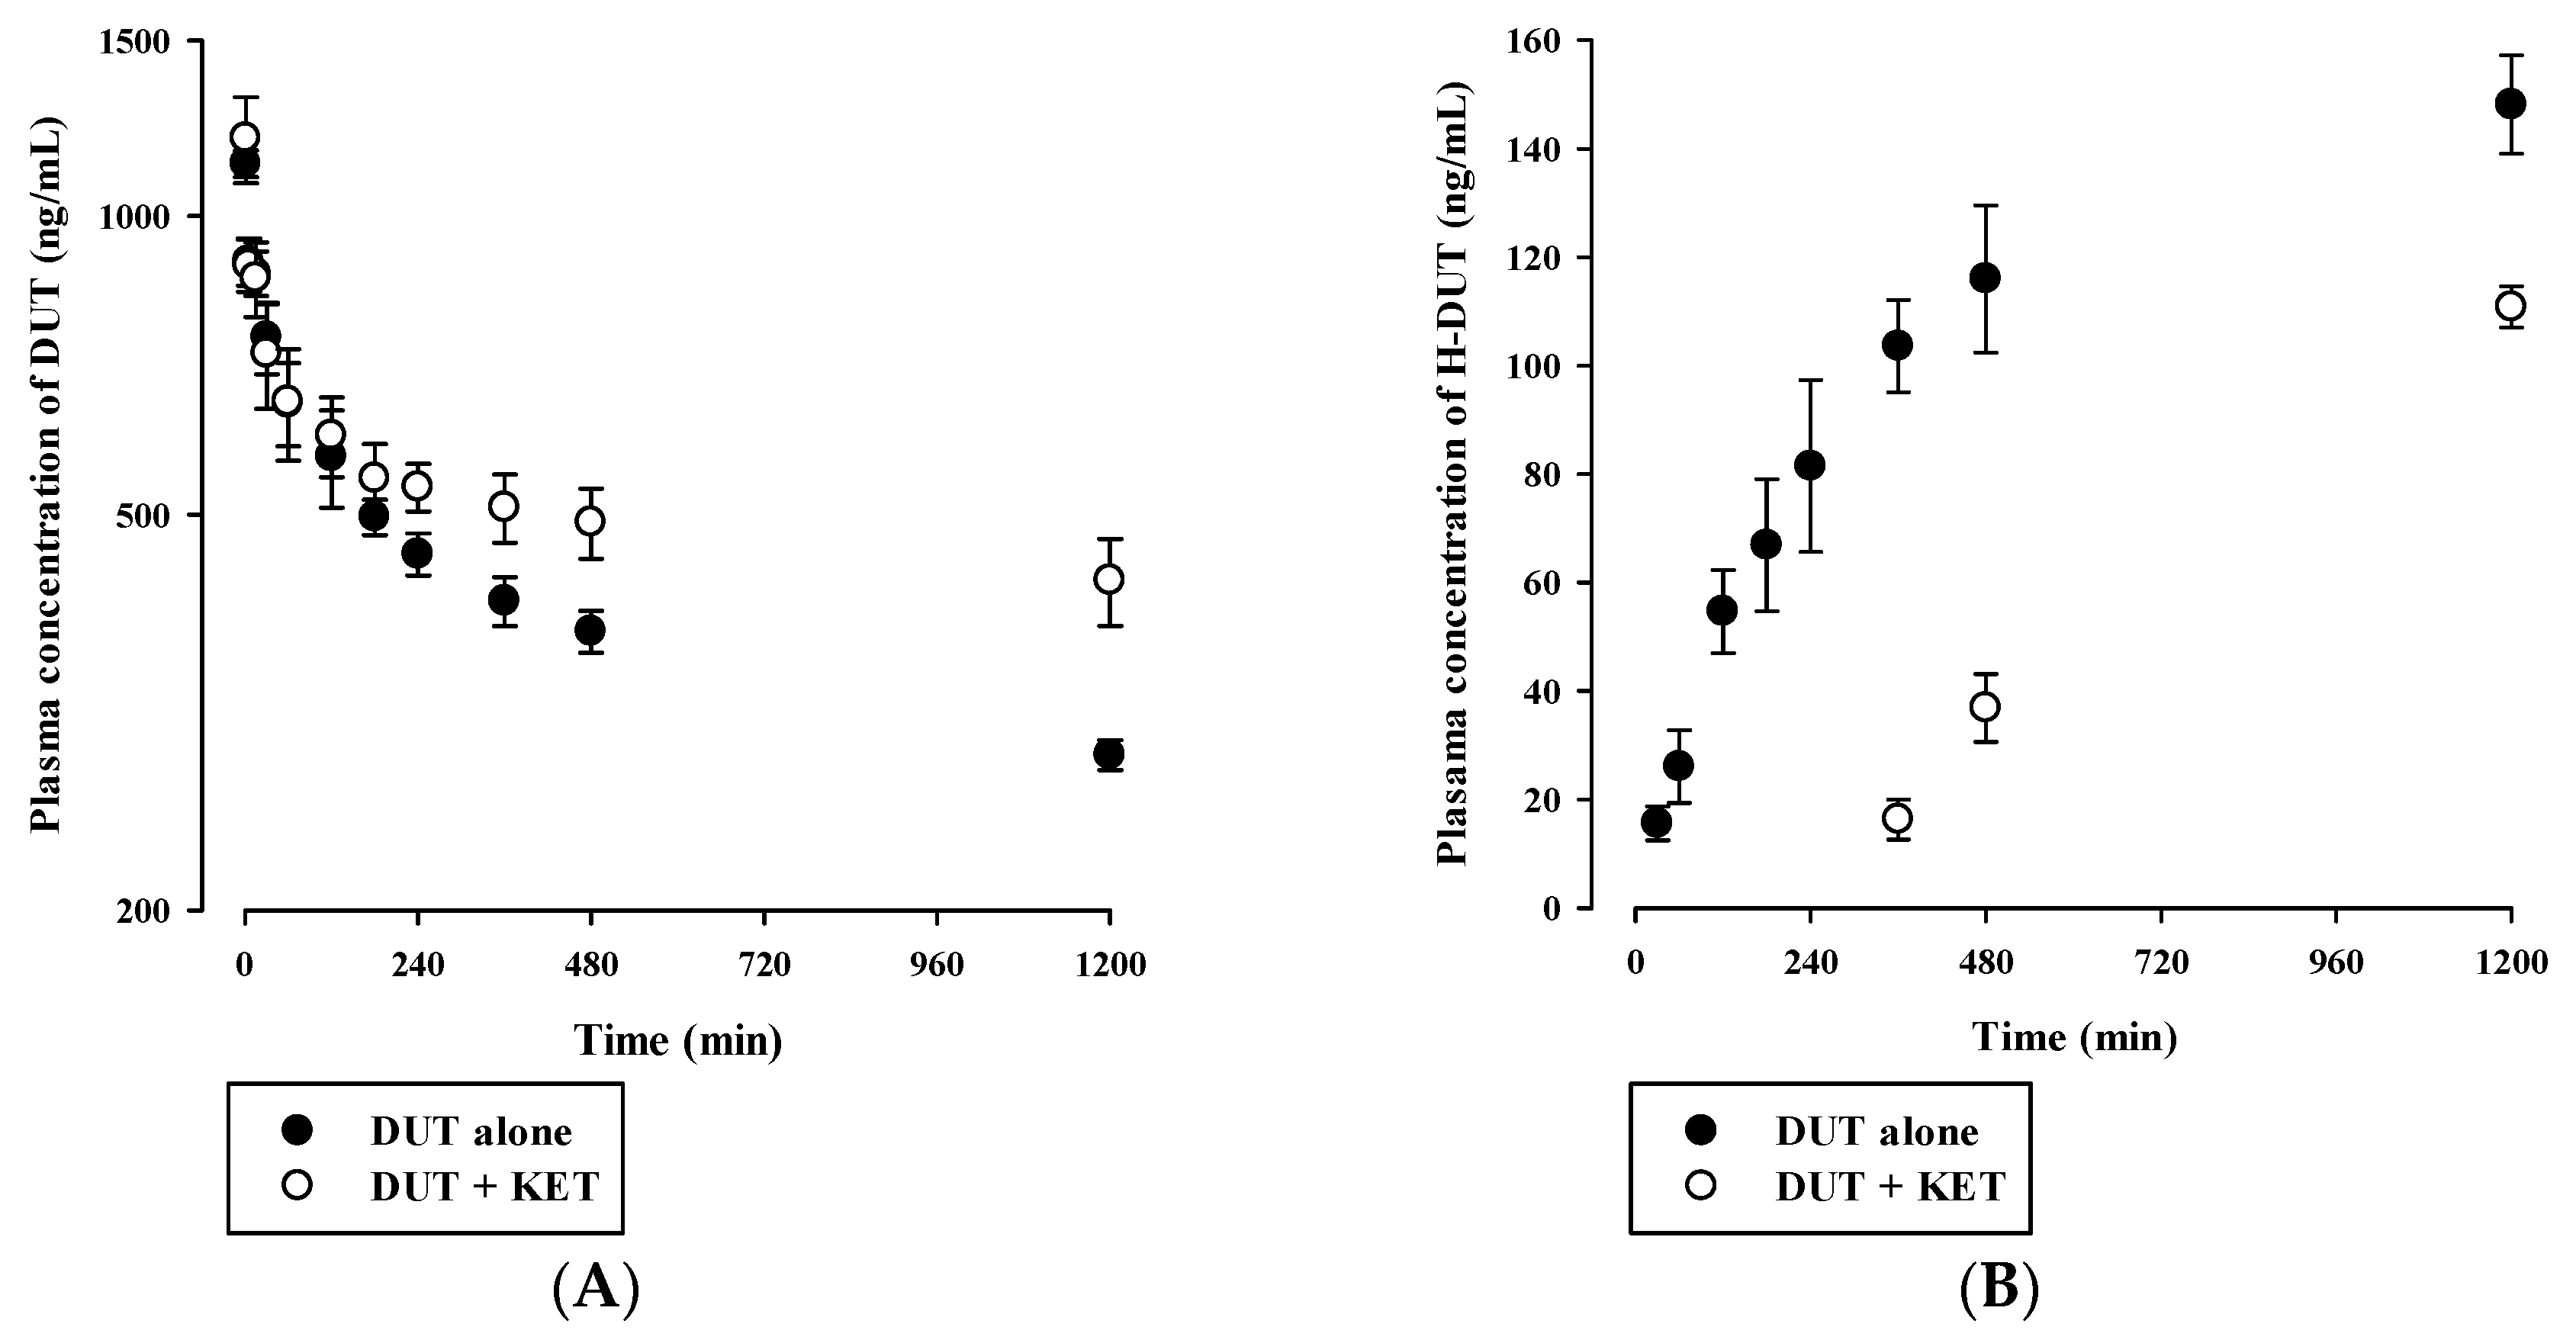
| AUCinf (μg·min/mL) | 1148 ± 81 | 2506 ± 384 * |
| t1/2 (min) | 1607 ± 196 | 3057 ± 359 * |
| CL (mL/min/kg) | 2.19 ± 0.16 | 1.02 ± 0.16 * |
| Vss (mL/kg) | 4900 ± 326 | 4405 ± 373 |
| H-DUT | ||
| AUClast (μg·min/mL) | 128 ± 15 | 64.0 ± 4.1 * |
| Cmax (ng/mL) | 141 ± 17 | 116 ± 4 * |
| AUCH-DUT/AUCDUT | 0.265 ± 0.031 | 0.107 ± 0.013 * |
| Parameter | DUT alone | DUT with KET |
|---|---|---|
| DUT | ||
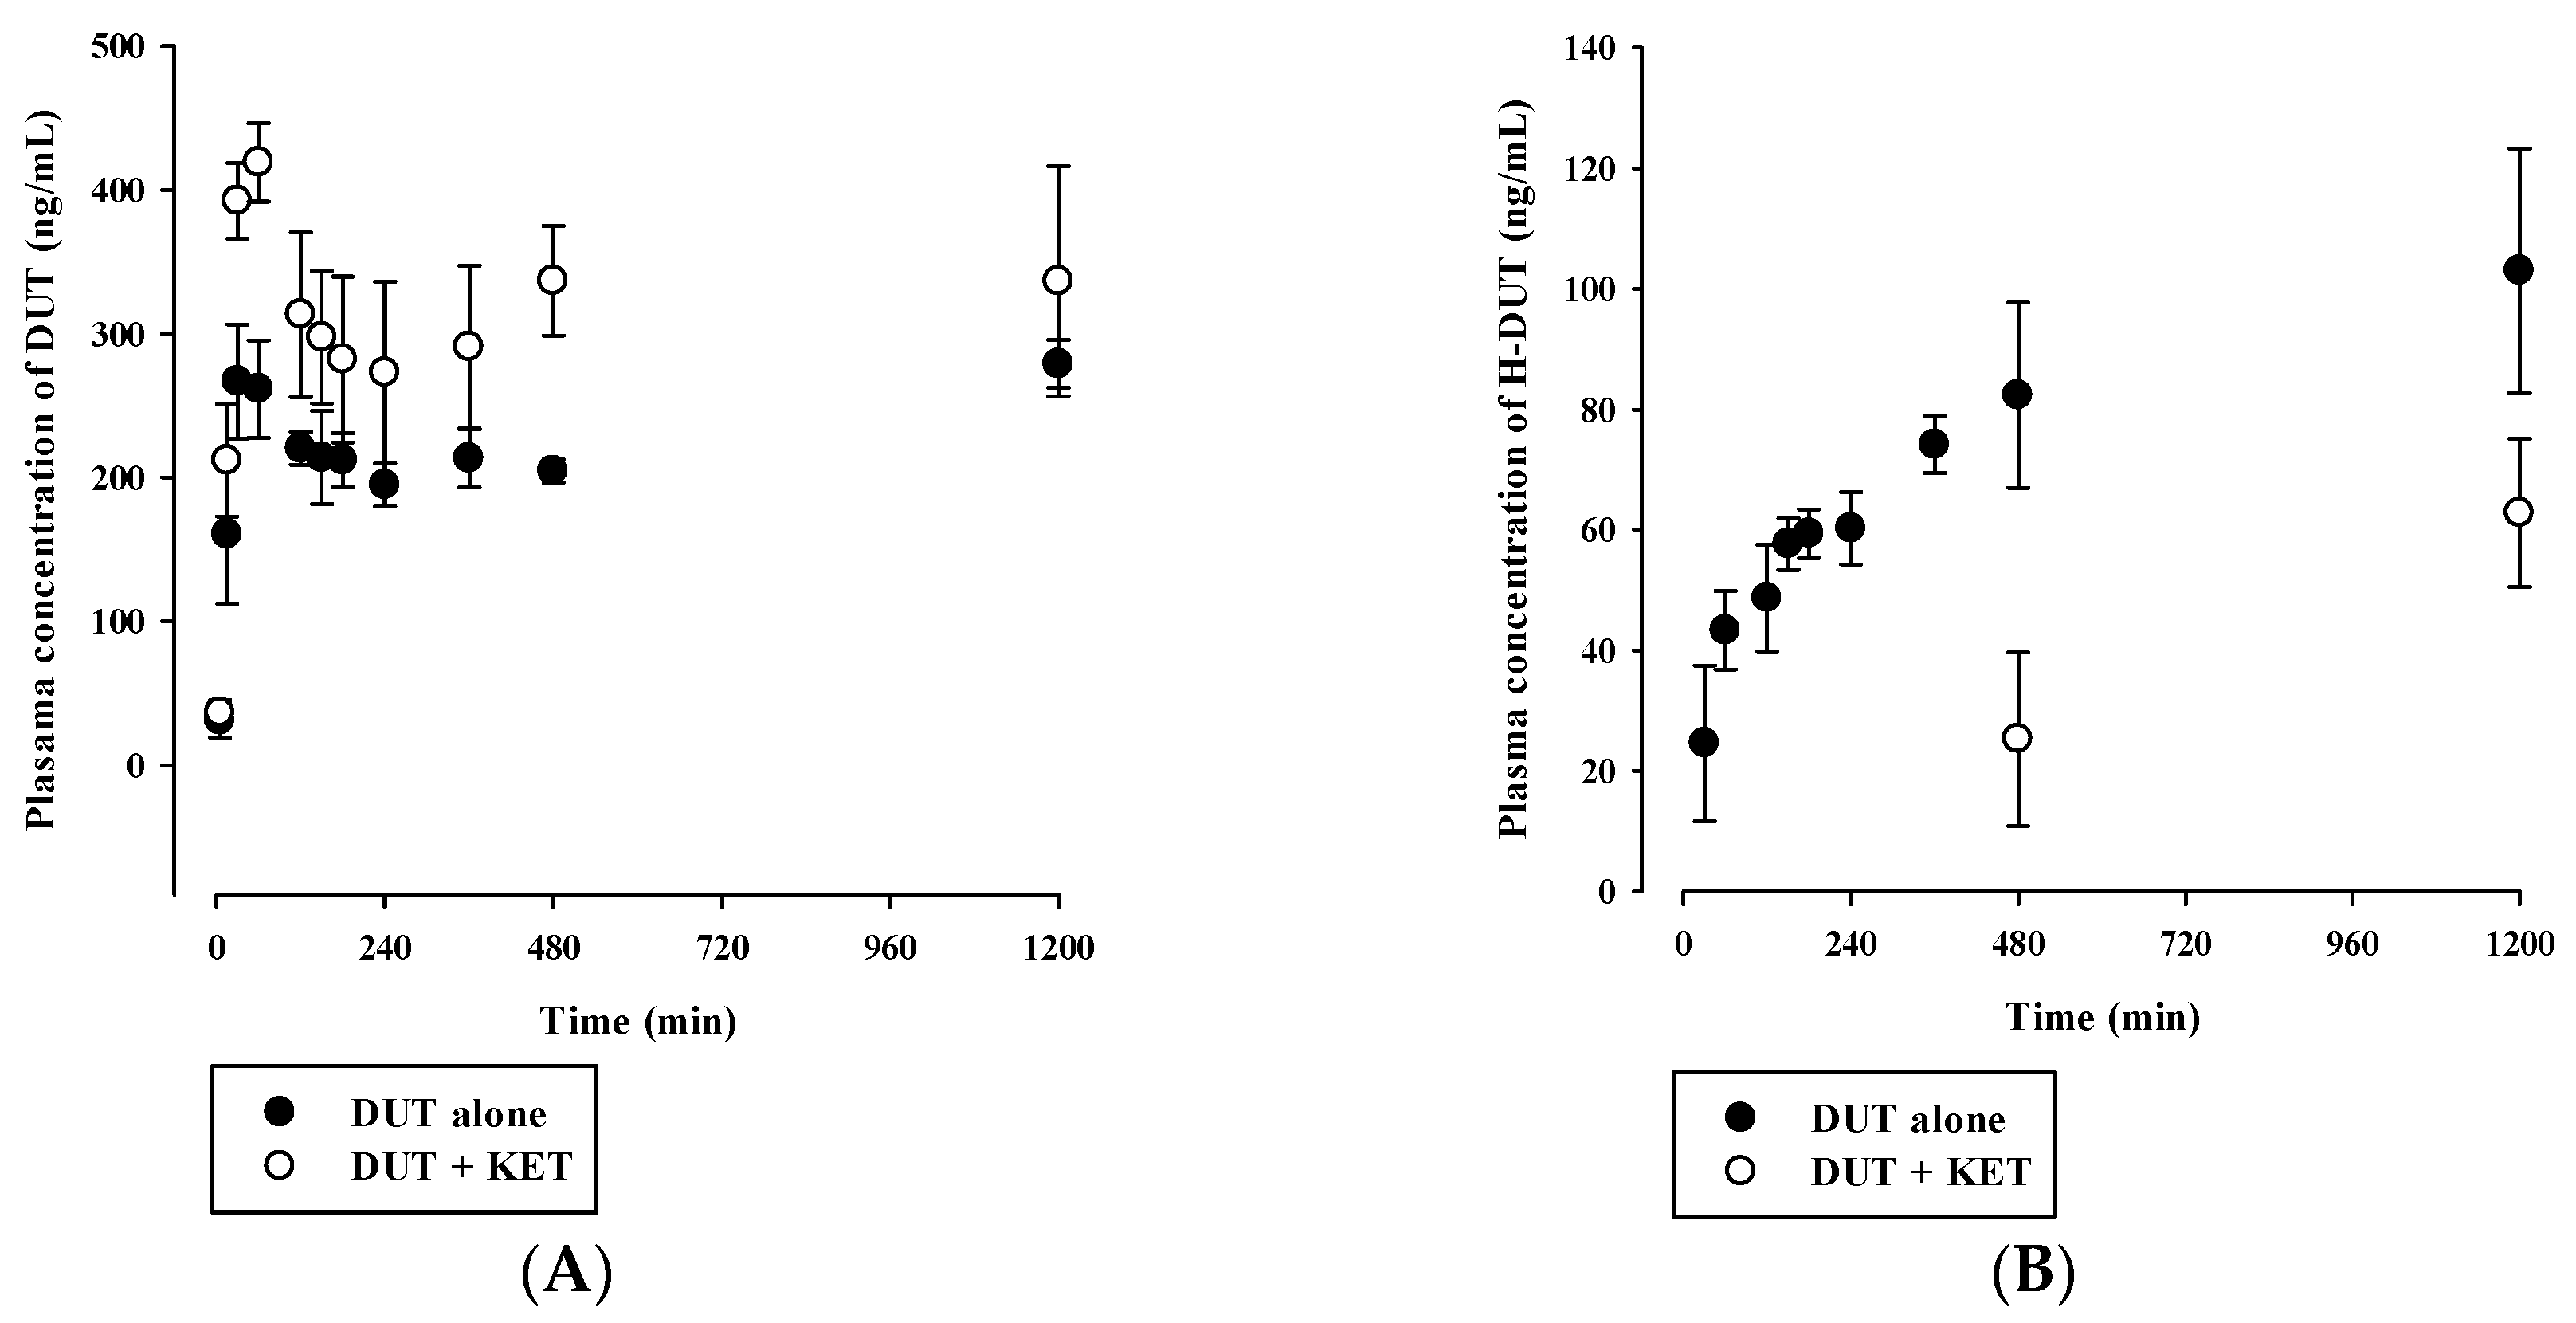
| AUClast (μg·min/mL) | 275 ± 9 | 388 ± 58 * |
| Cmax (ng/mL) | 289 ± 10 | 419 ± 27 * |
| Tmax (min) | 60 (30–1200) | 60 |
| H-DUT | ||
| AUClast (μg·min/mL) | 95.3 ± 14.2 | 37.8 ± 7.6 * |
| Cmax (ng/mL) | 103 ± 20 | 62.8 ± 12.3 * |
| AUCH-DUT/AUCDUT | 0.348 ± 0.061 | 0.0981 ± 0.0198 * |
© 2019 by the authors. Licensee MDPI, Basel, Switzerland. This article is an open access article distributed under the terms and conditions of the Creative Commons Attribution (CC BY) license (http://creativecommons.org/licenses/by/4.0/).
Share and Cite
Seo, S.-W.; Park, J.W.; Han, D.-G.; Kim, J.-M.; Kim, S.; Park, T.; Kang, K.-H.; Yang, M.H.; Yoon, I.-S. In Vitro and In Vivo Assessment of Metabolic Drug Interaction Potential of Dutasteride with Ketoconazole. Pharmaceutics 2019, 11, 673. https://doi.org/10.3390/pharmaceutics11120673
Seo S-W, Park JW, Han D-G, Kim J-M, Kim S, Park T, Kang K-H, Yang MH, Yoon I-S. In Vitro and In Vivo Assessment of Metabolic Drug Interaction Potential of Dutasteride with Ketoconazole. Pharmaceutics. 2019; 11(12):673. https://doi.org/10.3390/pharmaceutics11120673
Chicago/Turabian StyleSeo, Seong-Wook, Jin Woo Park, Dong-Gyun Han, Ji-Min Kim, Sanghyun Kim, Taeuk Park, Kyung-Hwa Kang, Min Hye Yang, and In-Soo Yoon. 2019. "In Vitro and In Vivo Assessment of Metabolic Drug Interaction Potential of Dutasteride with Ketoconazole" Pharmaceutics 11, no. 12: 673. https://doi.org/10.3390/pharmaceutics11120673