Additive Manufacturing of Personalized Pharmaceutical Dosage Forms via Stereolithography

 ,
,
Abstract
:
1. Introduction
2. Materials and Methods
2.1. Materials
2.2. Stereolithography
2.2.1. Preparation of Photopolymer Formulations
2.2.2. Stereolithographic Printing
2.3. Spectroscopic Analysis of Photoinitiator
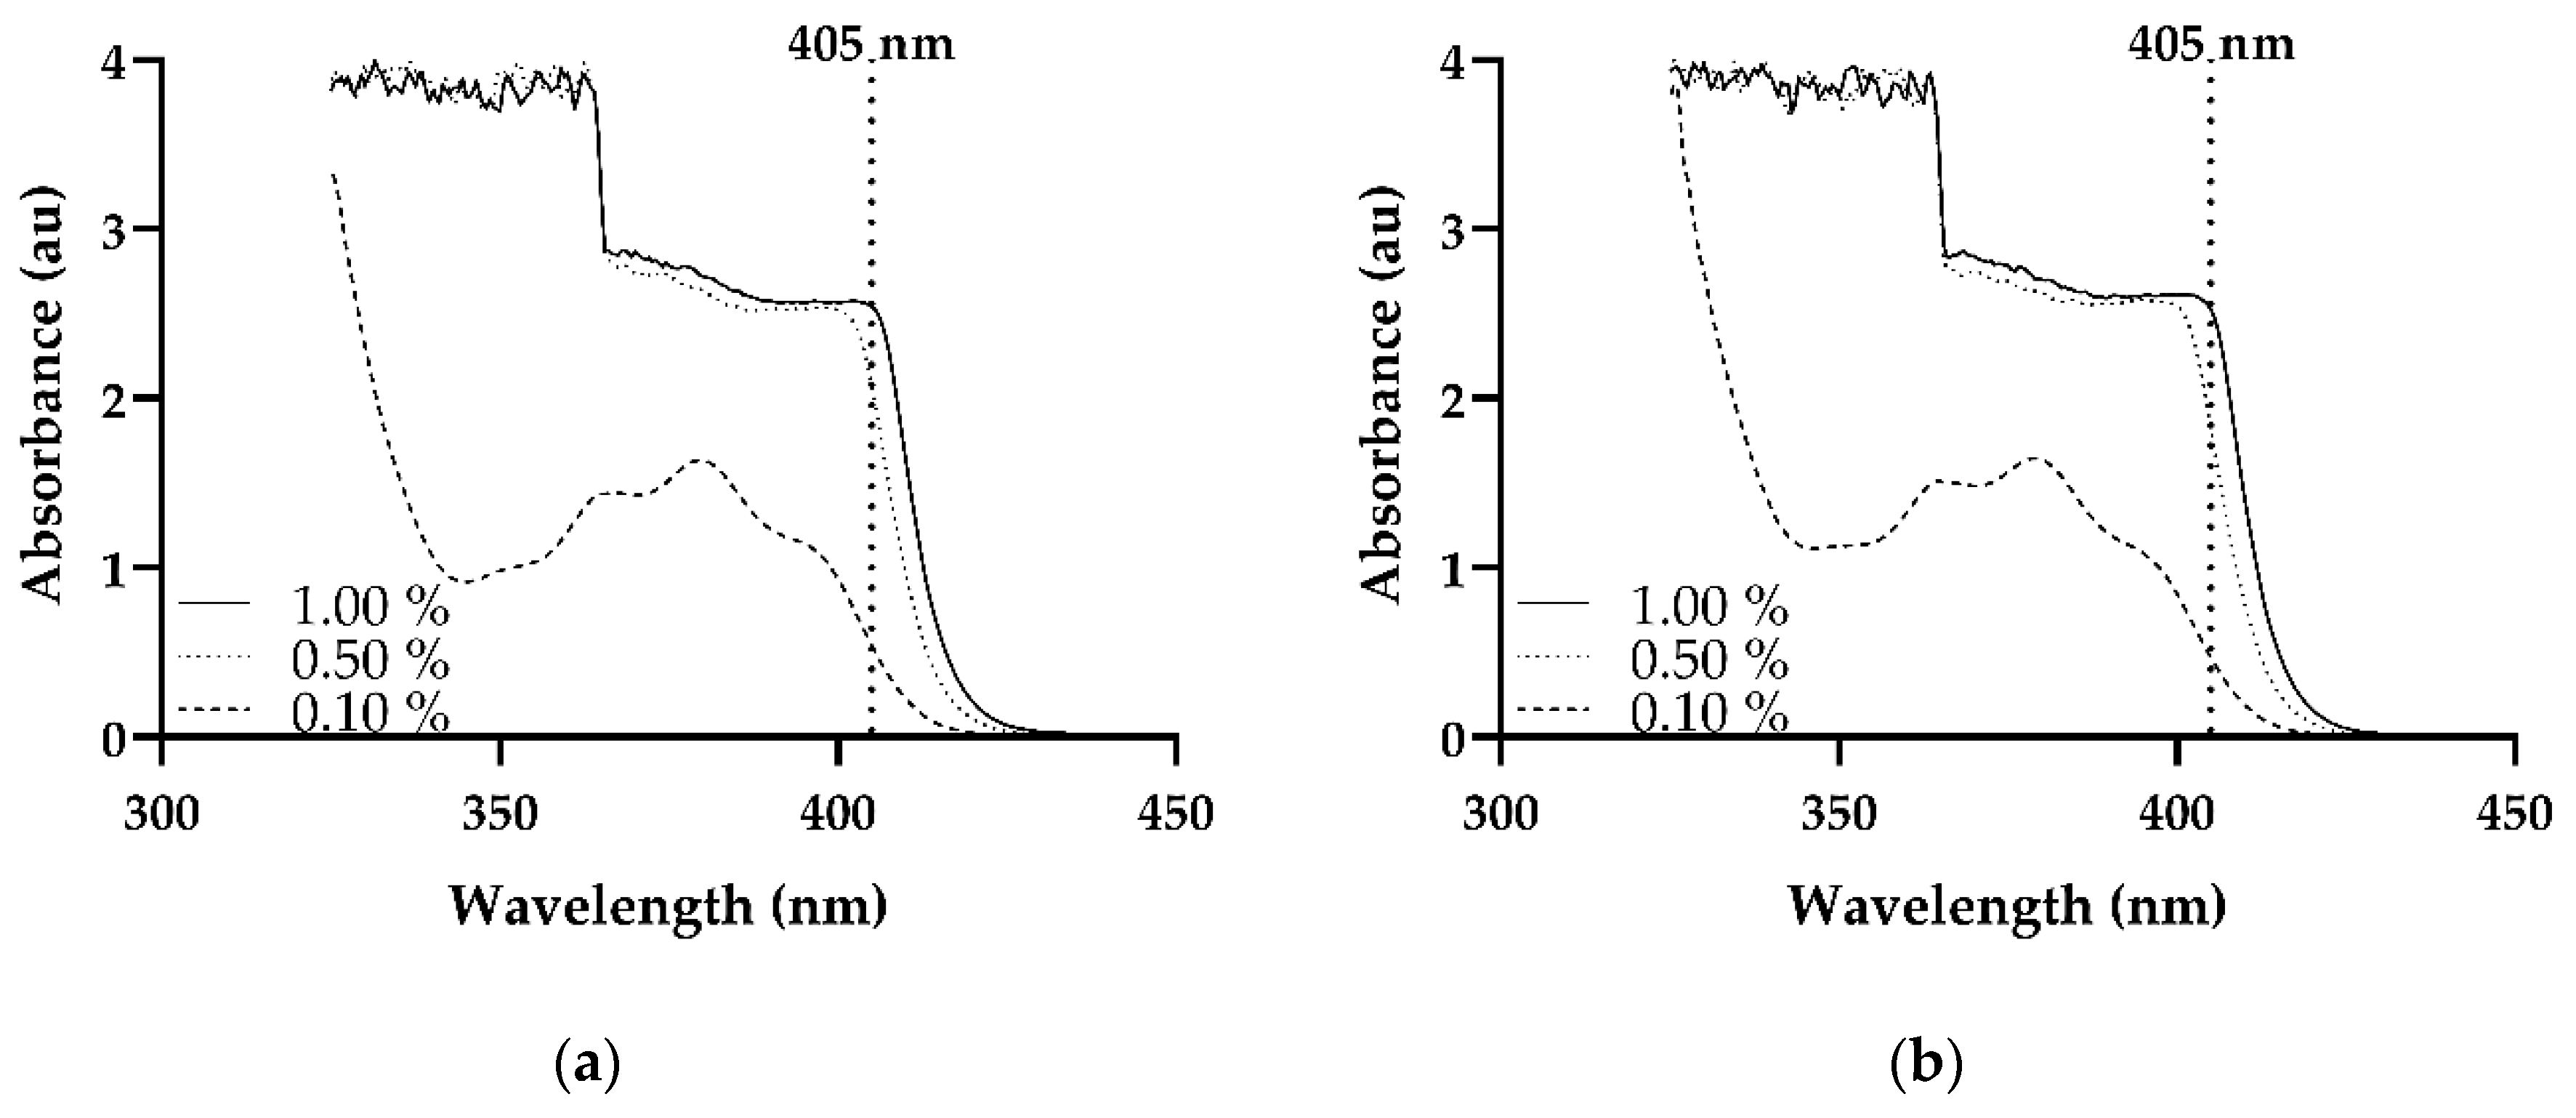
2.3.1. UV/Vis Spectrophotometry
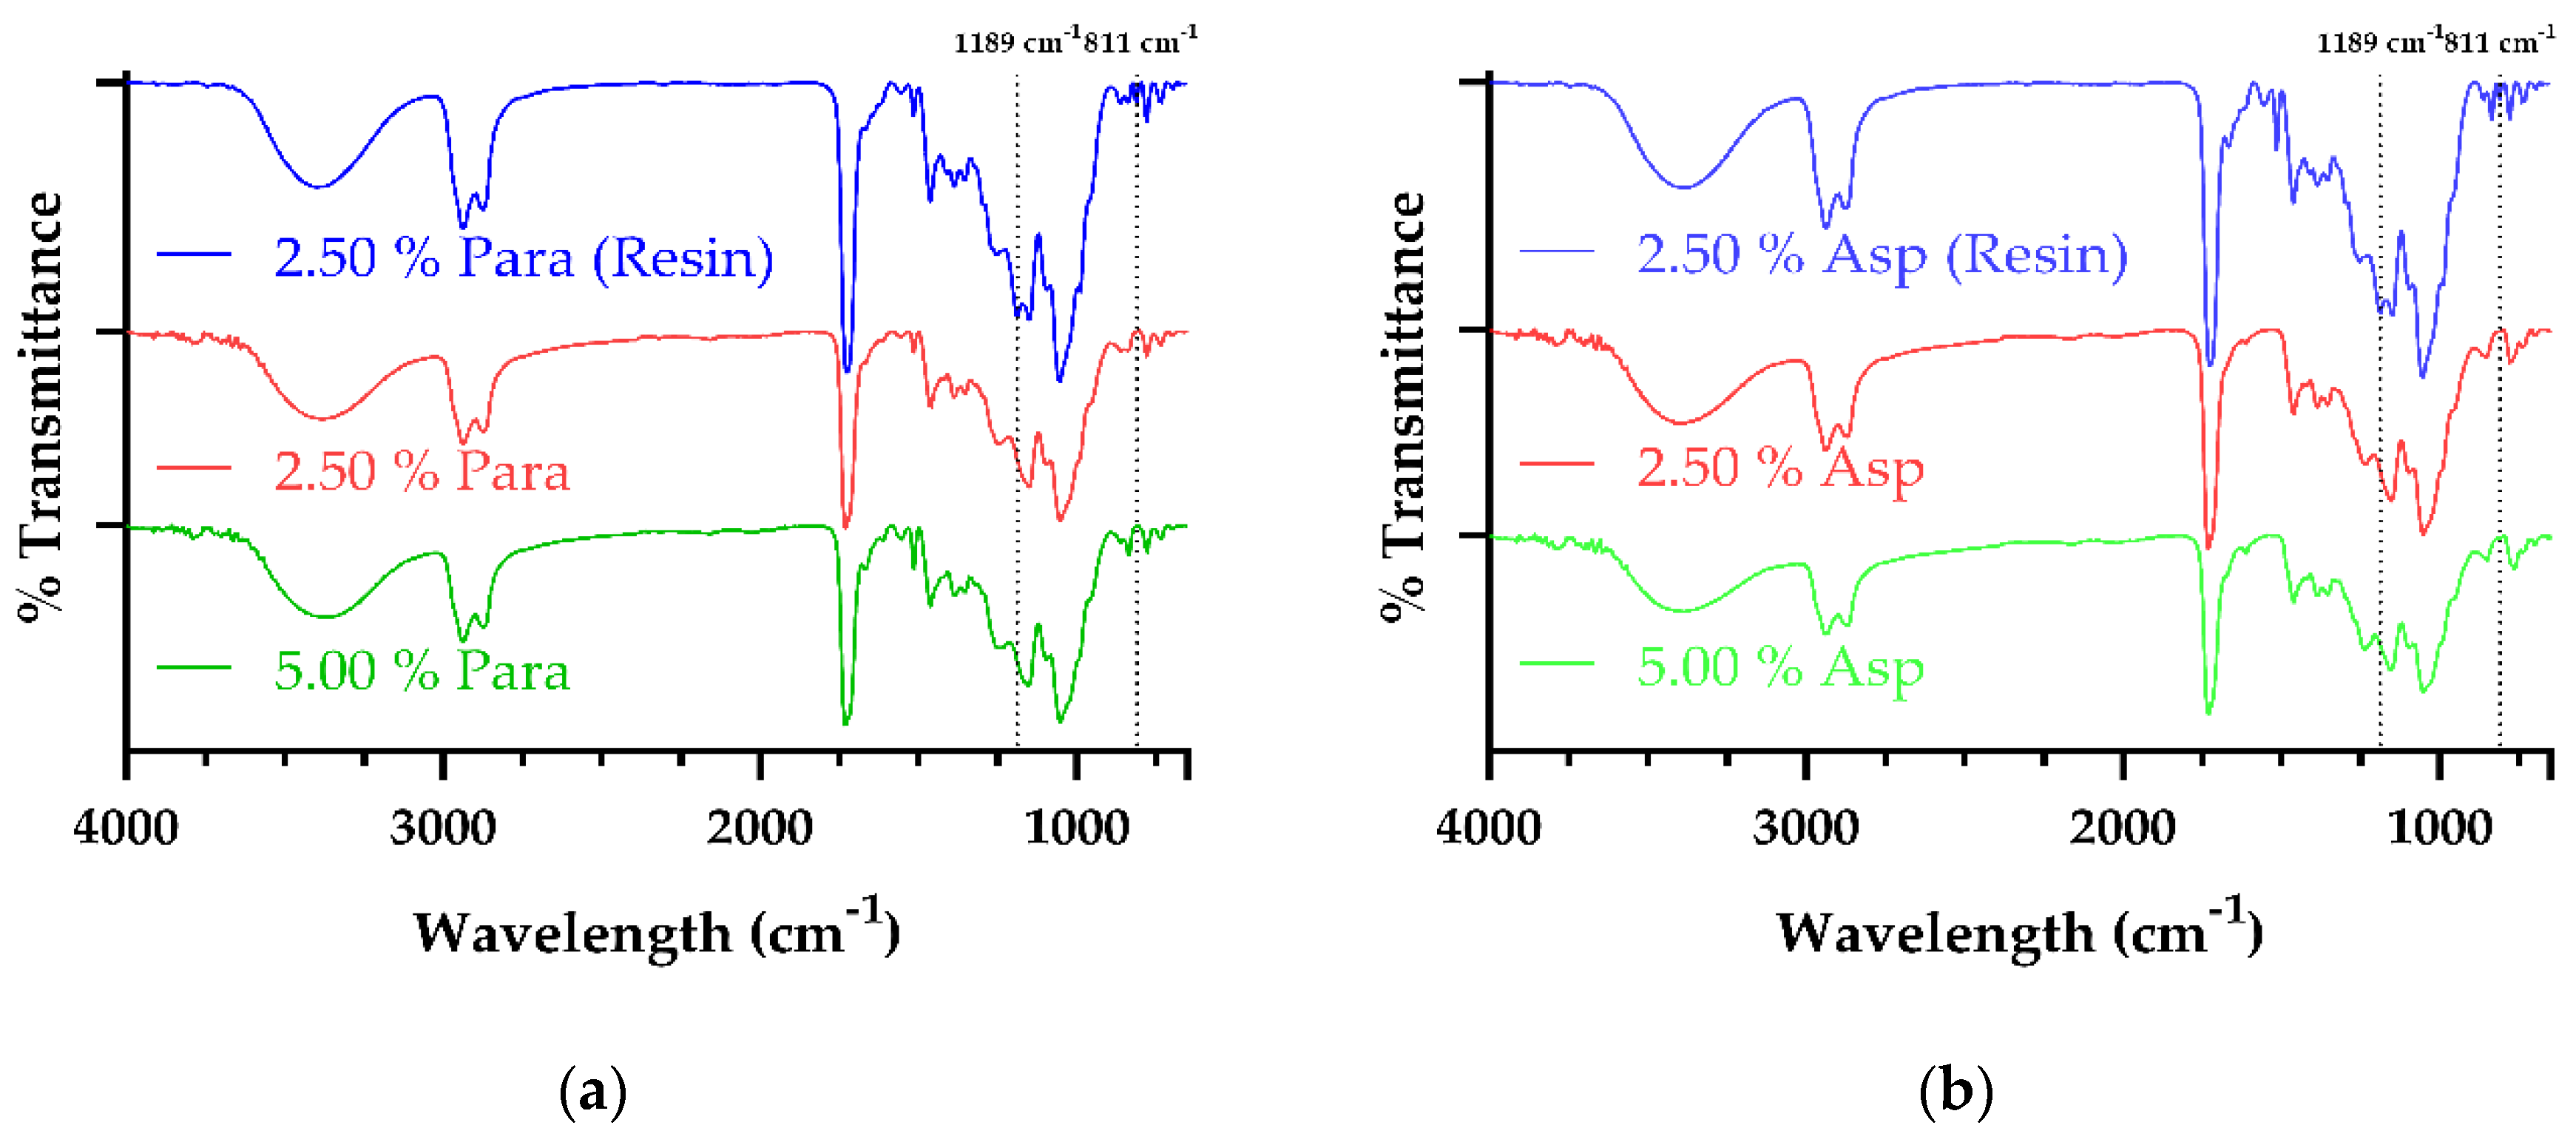
2.3.2. Fourier Transform Infrared Spectrometry
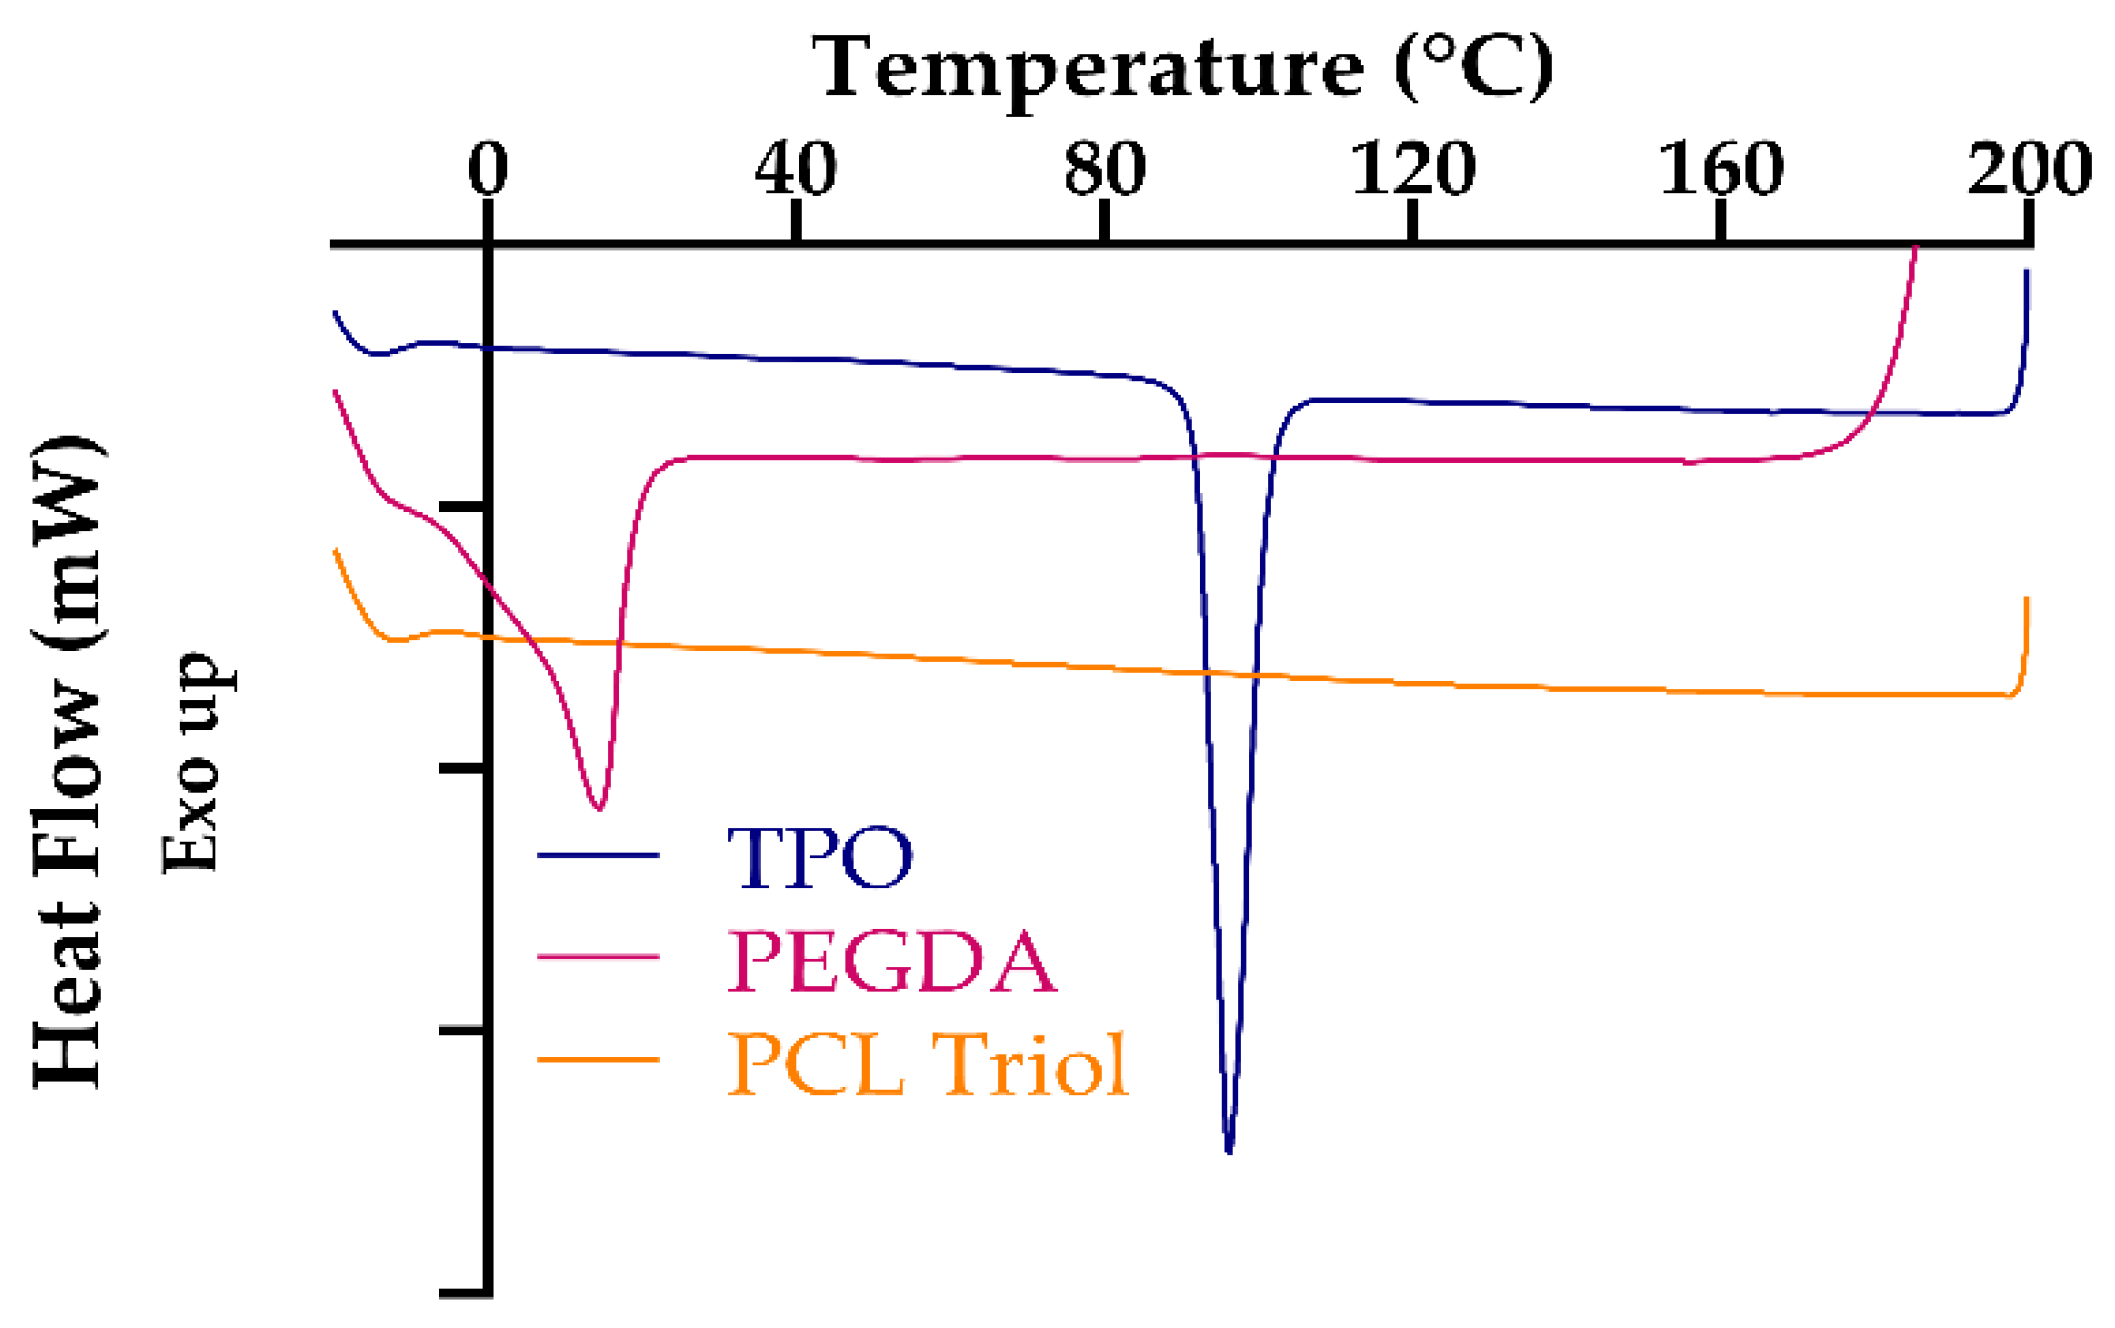
2.4. Thermal Characterization
2.5. Tablet Characterization
2.6. Dissolution Analysis
2.7. Scanning Electron Microscopy
2.8. Statistical Analysis
3. Results and Discussion
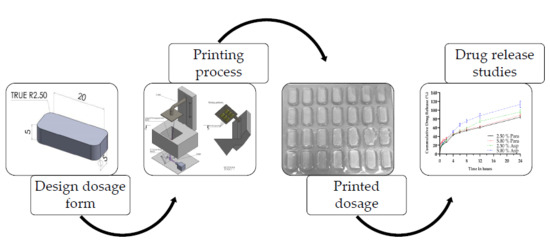
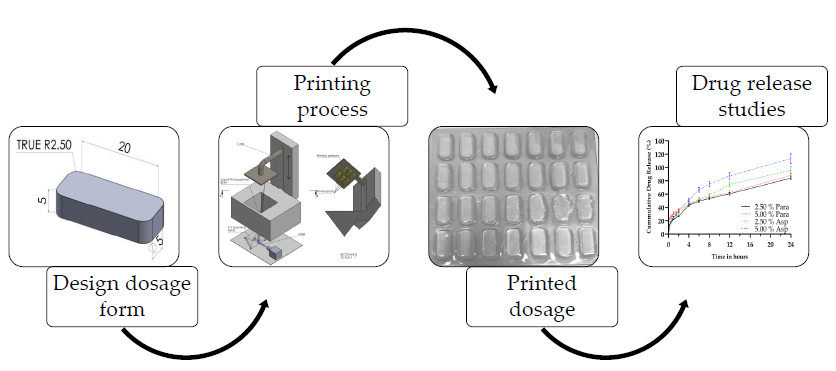
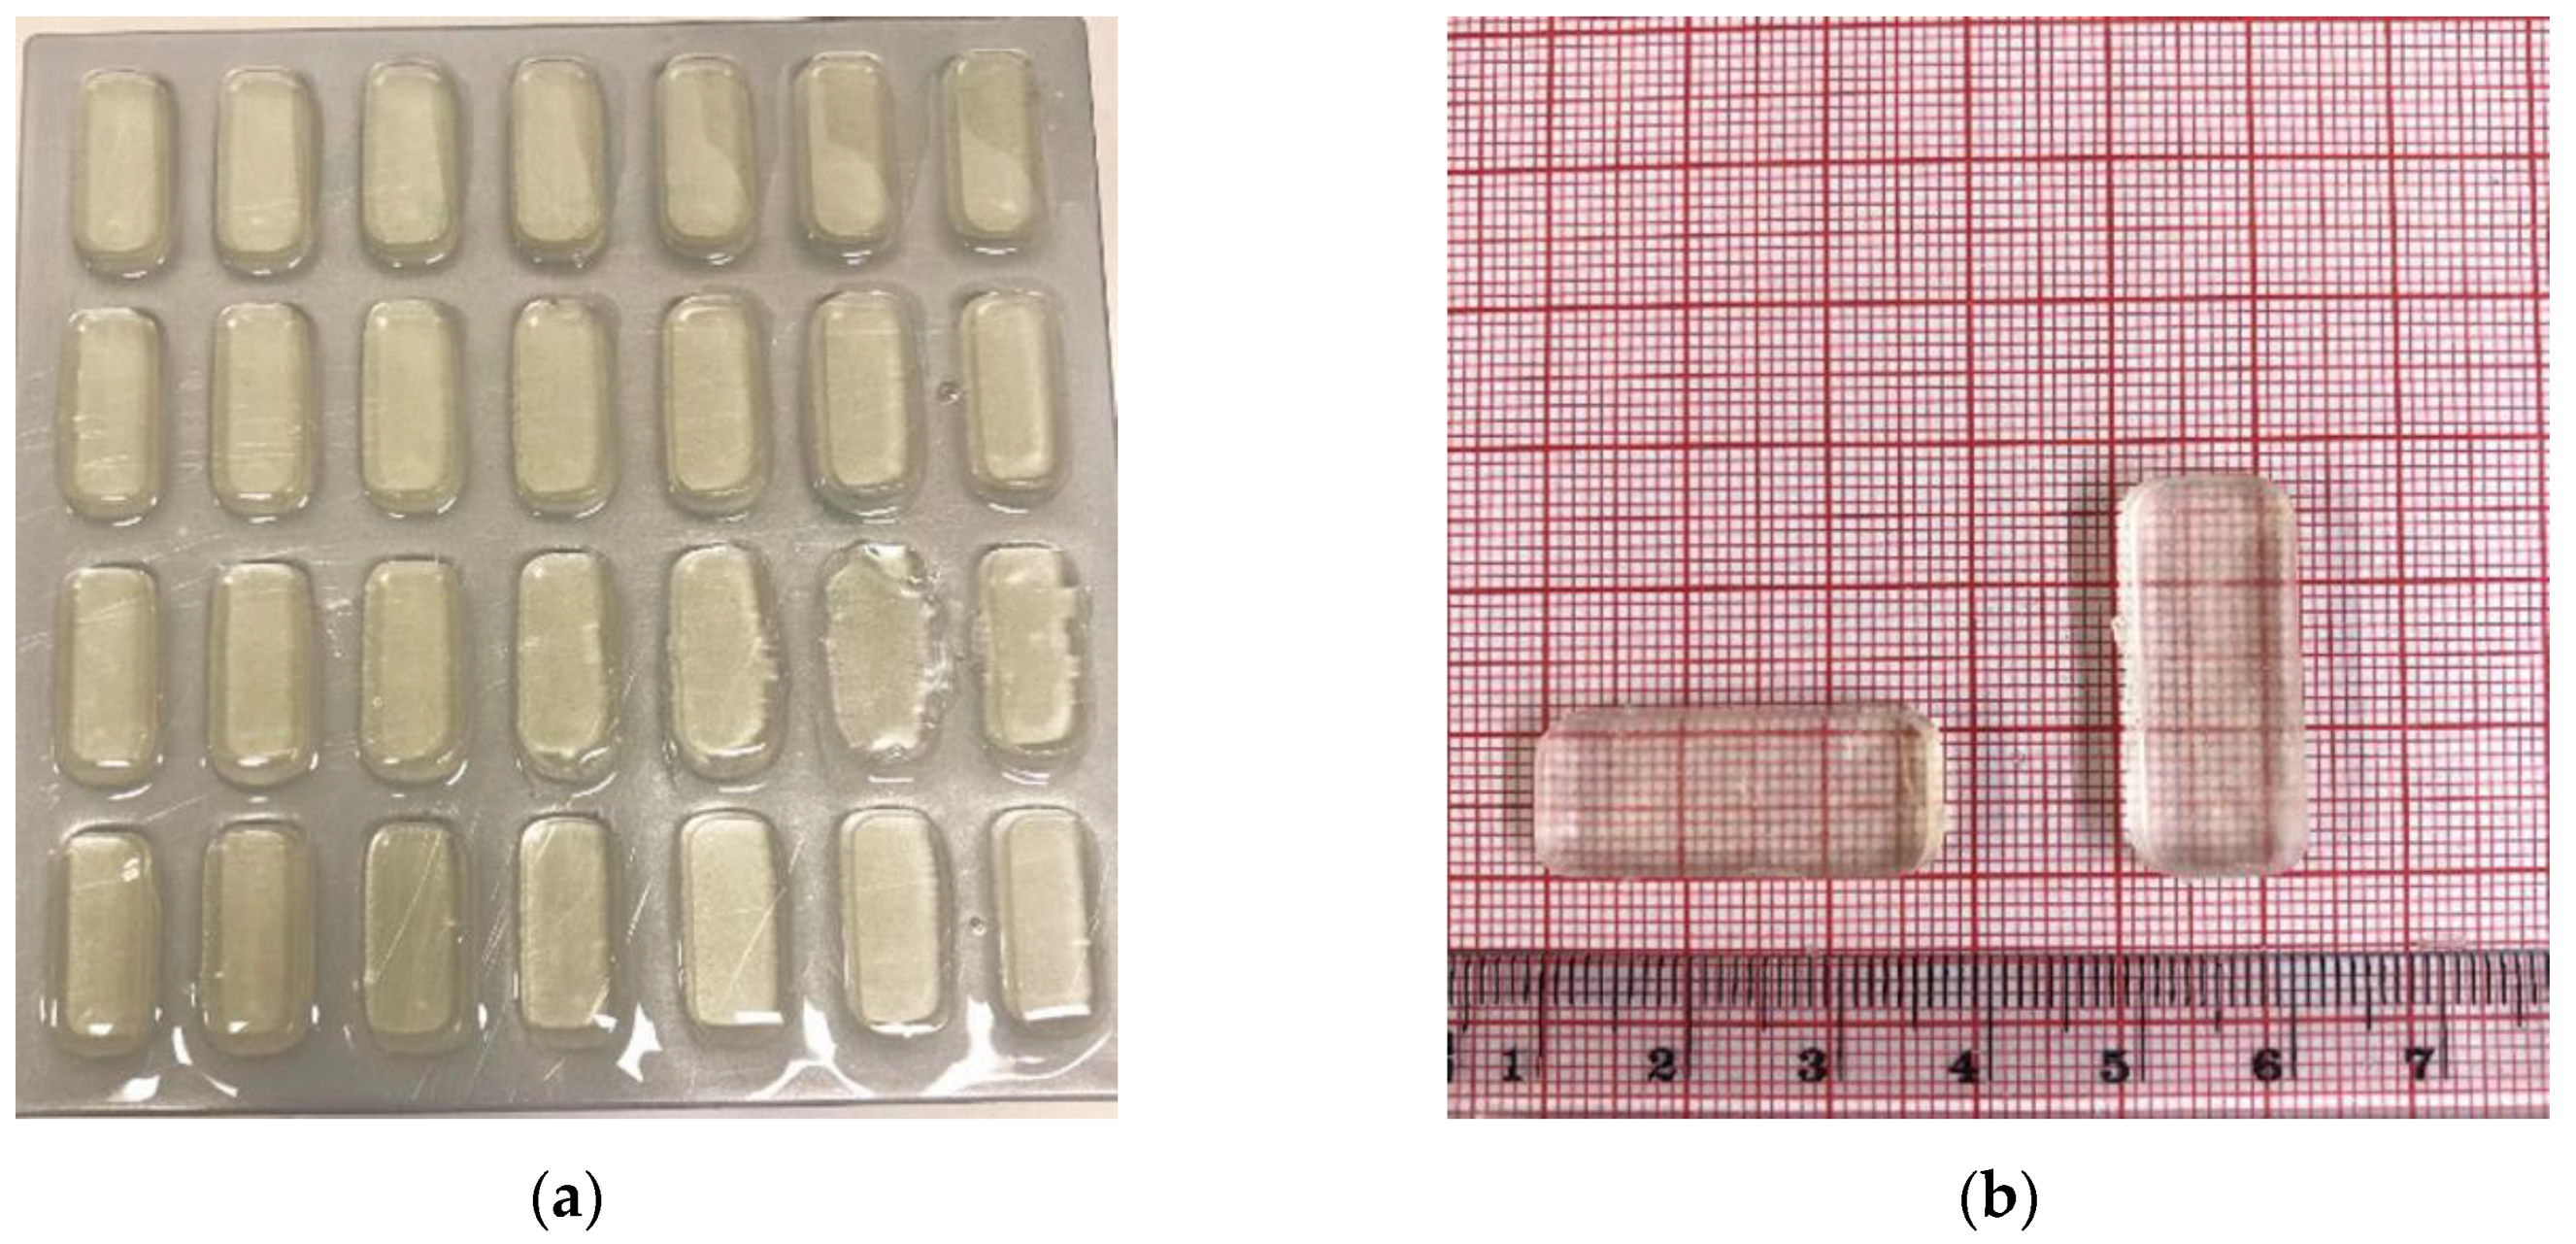
3.1. Stereolithographic Printing Process
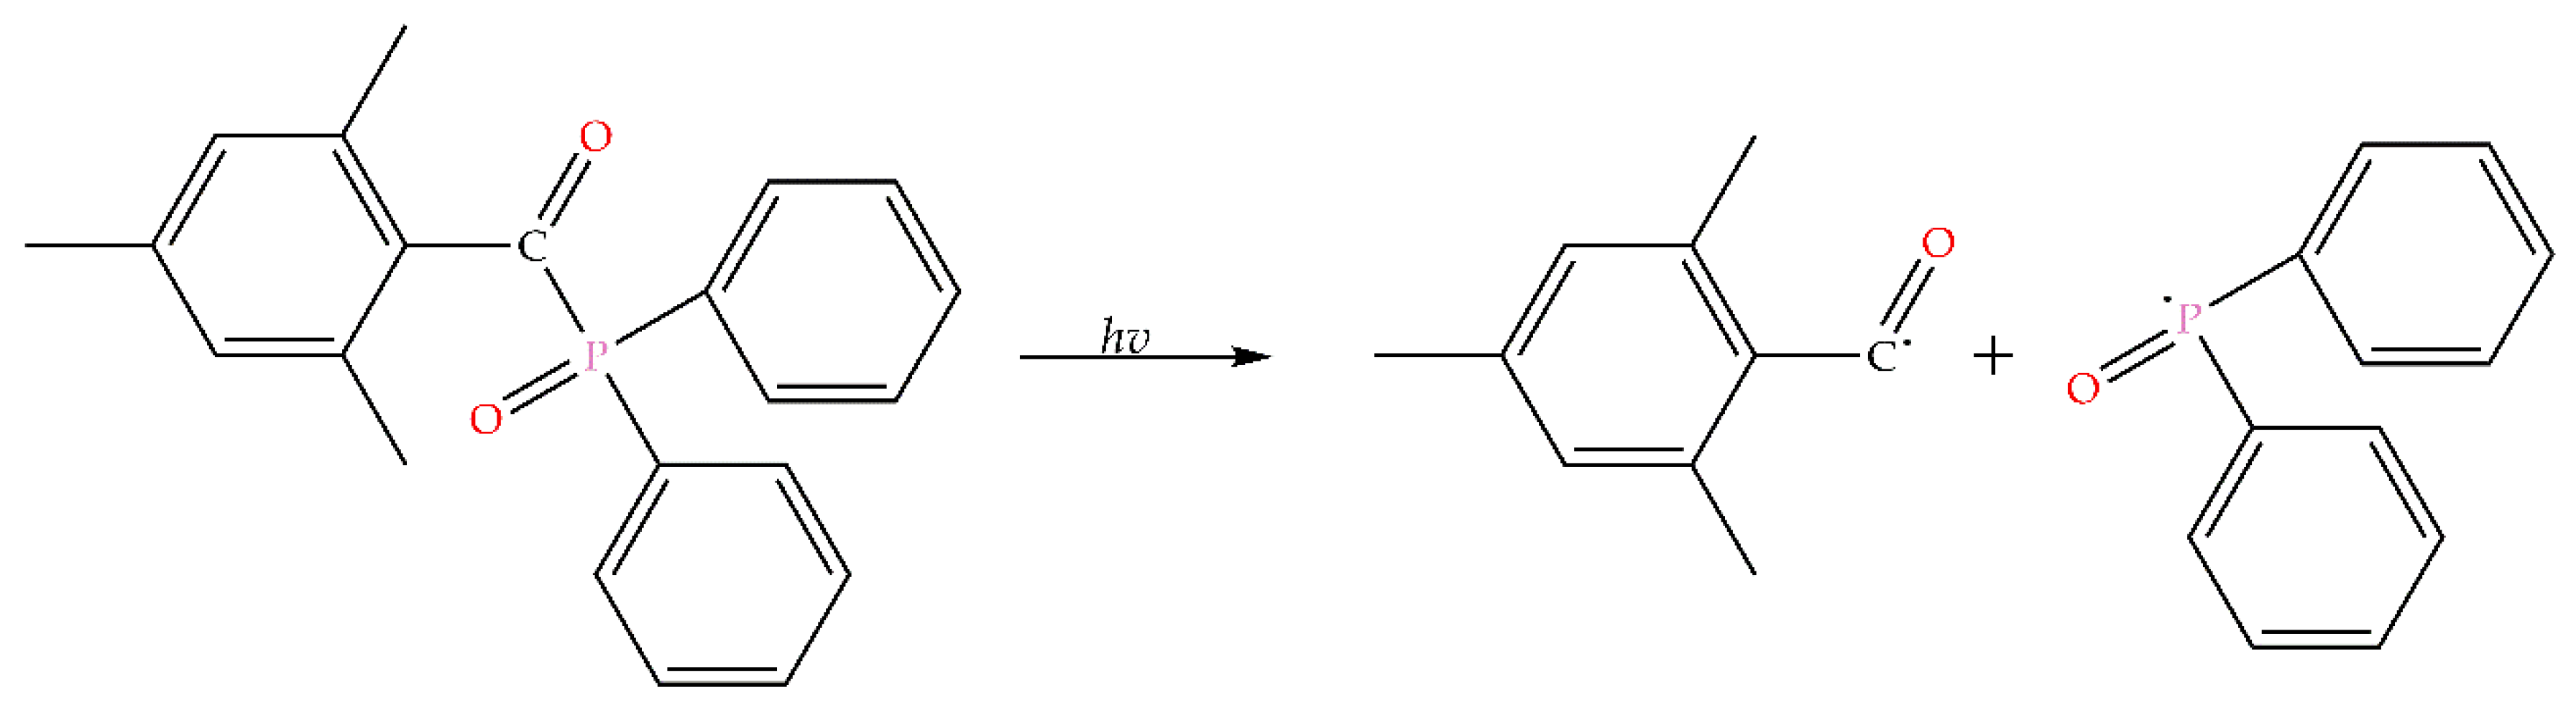
3.2. Spectroscopic Analysis of Photoinitiator
3.3. Fourier Transform Infrared Spectroscopy
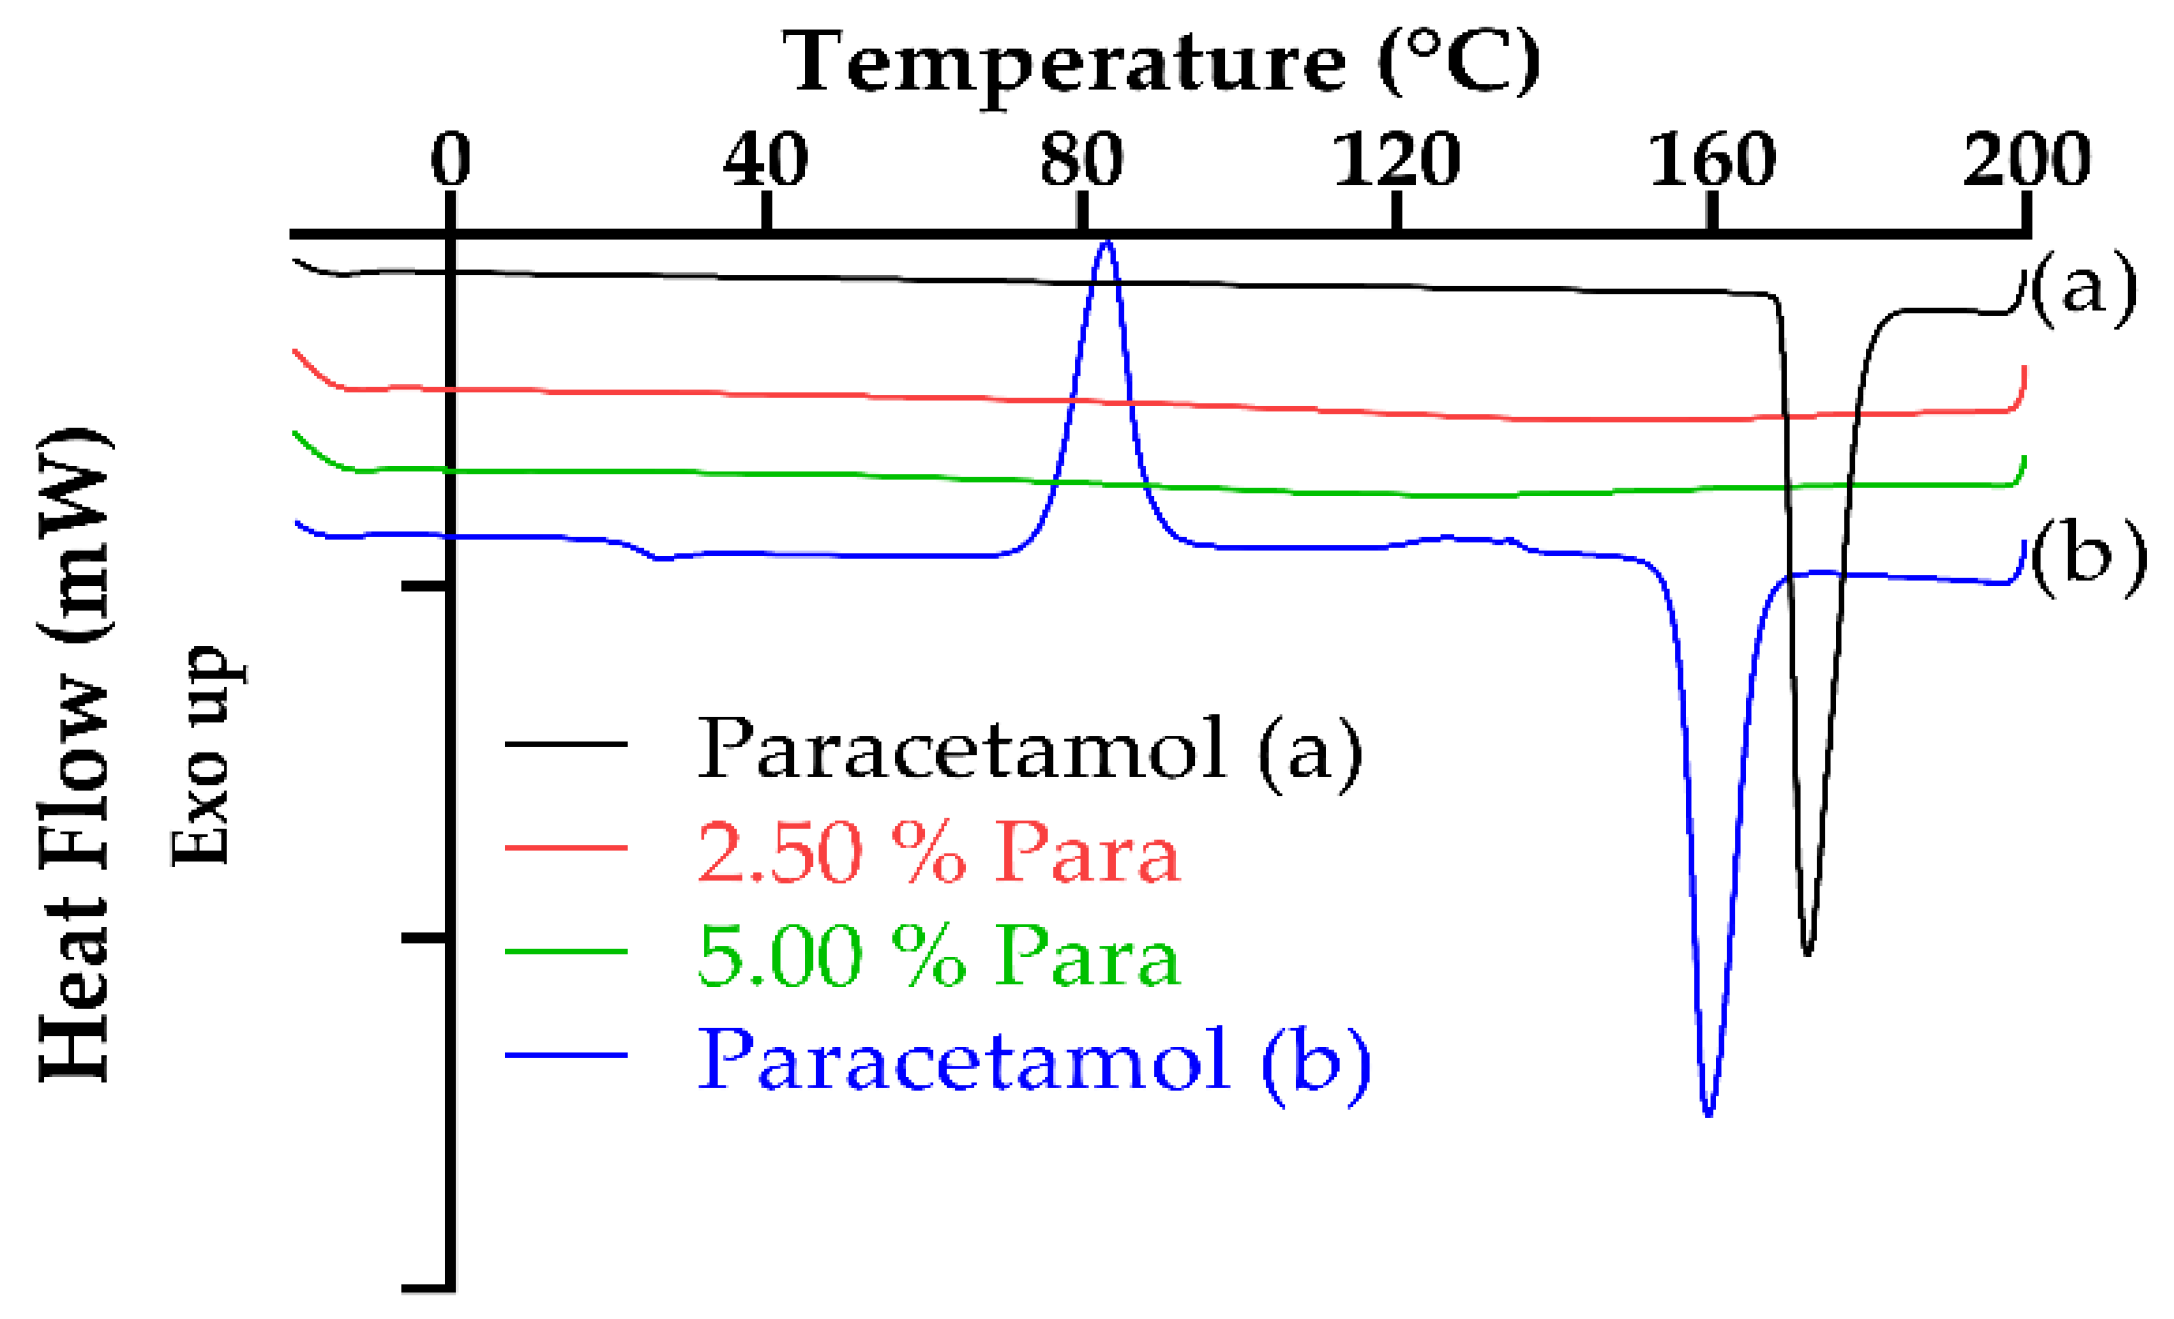
3.4. Thermal Characterization
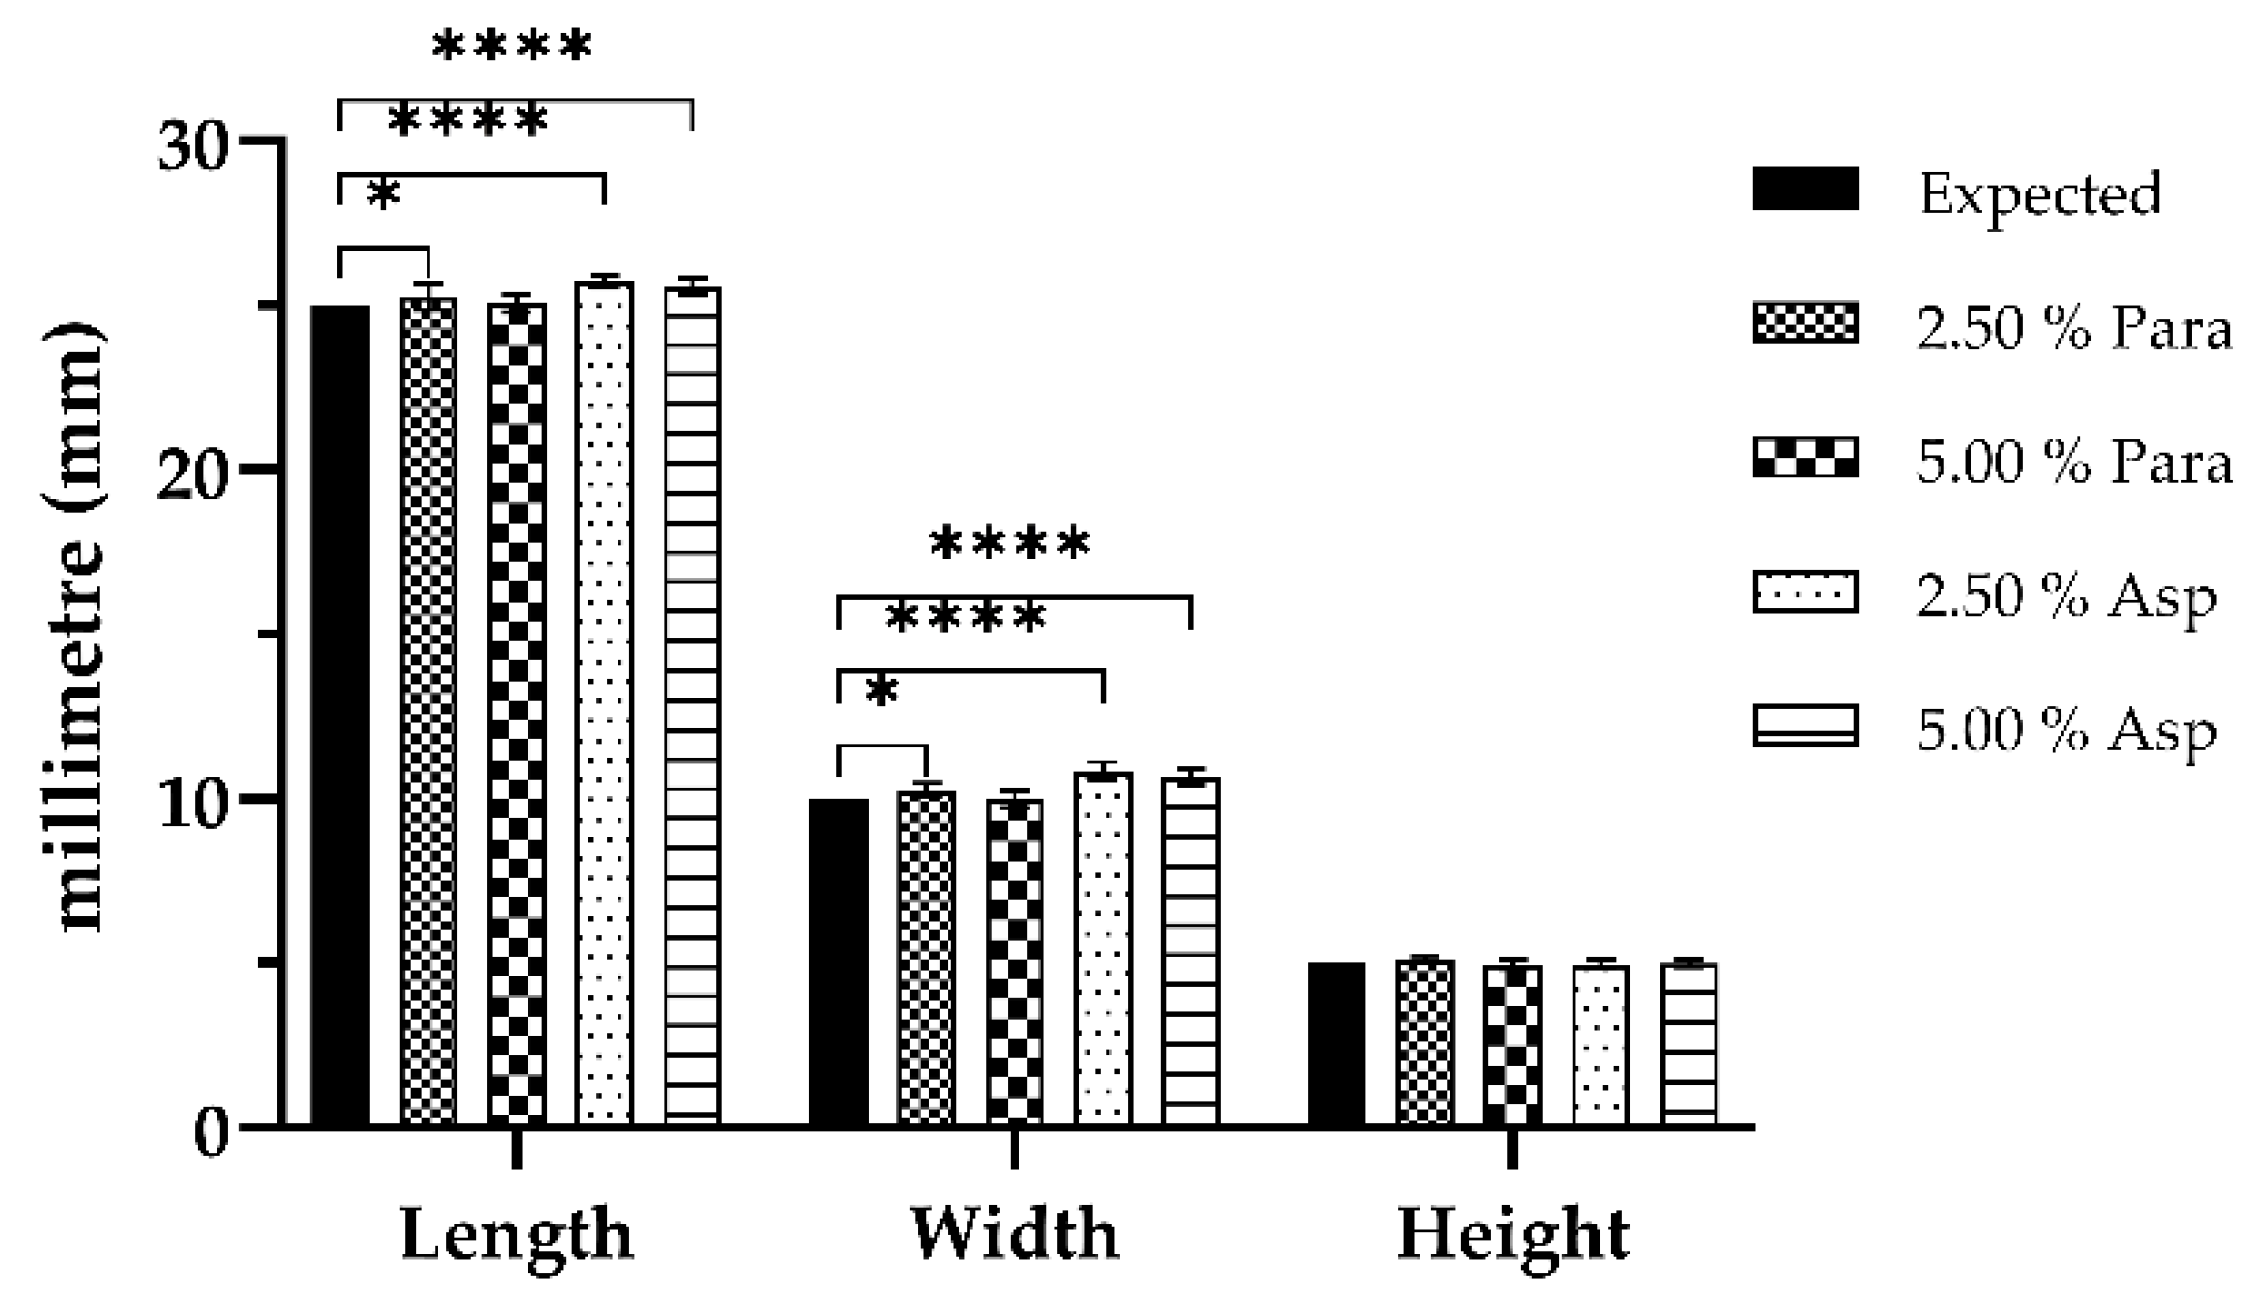
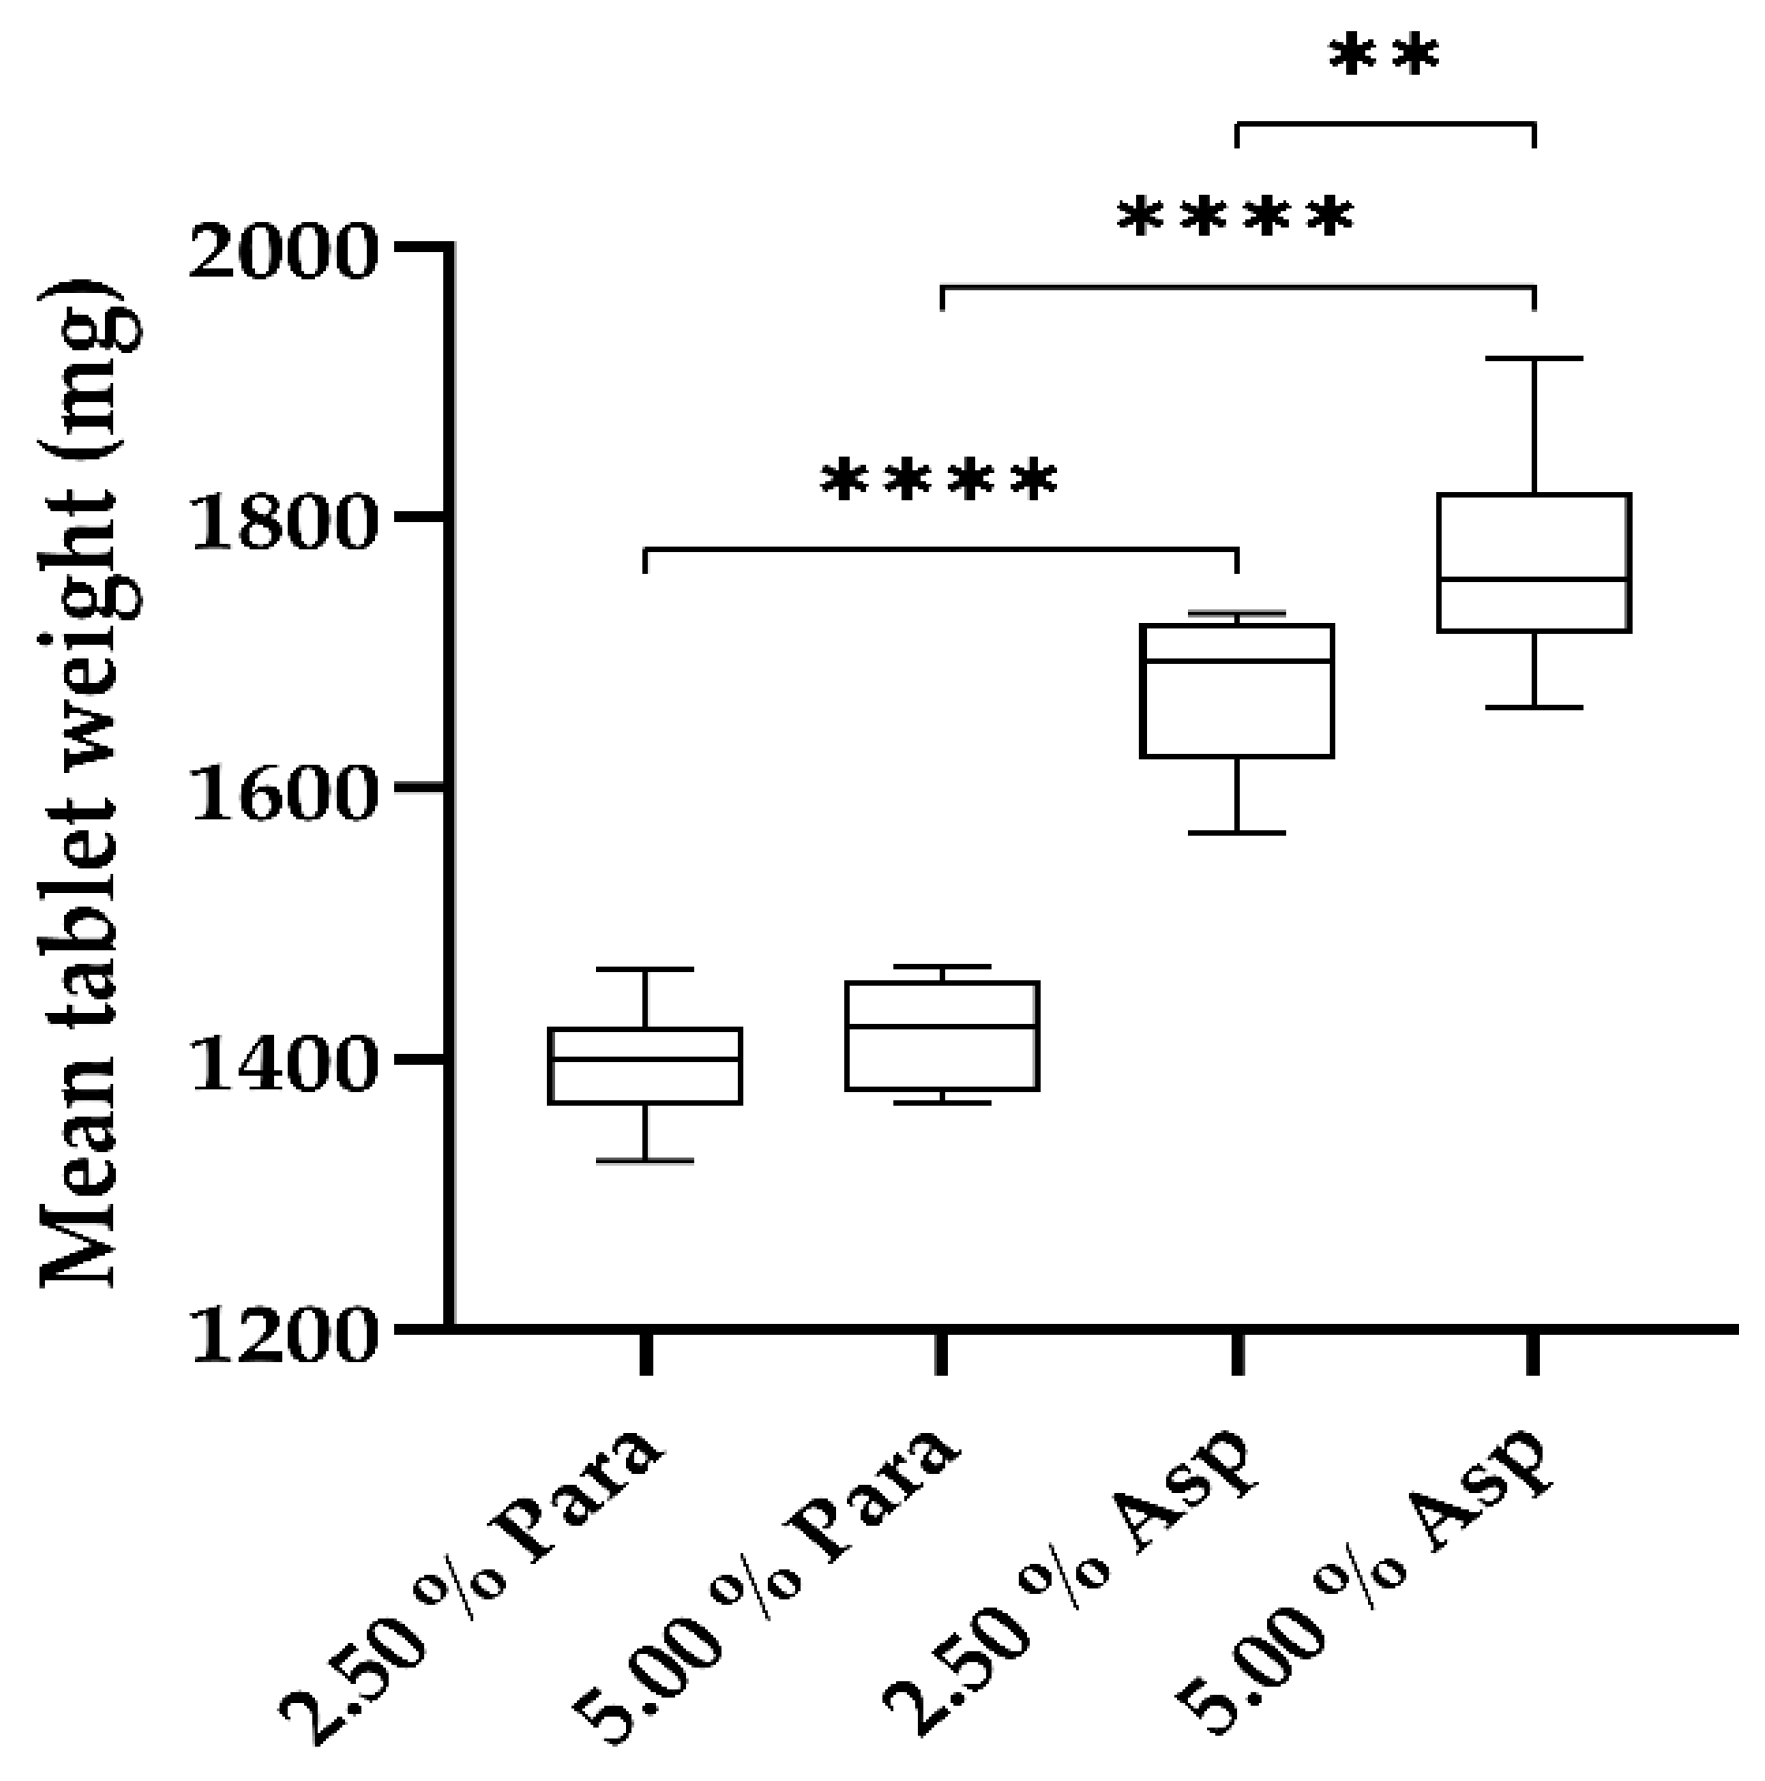
3.5. Tablet Characterization
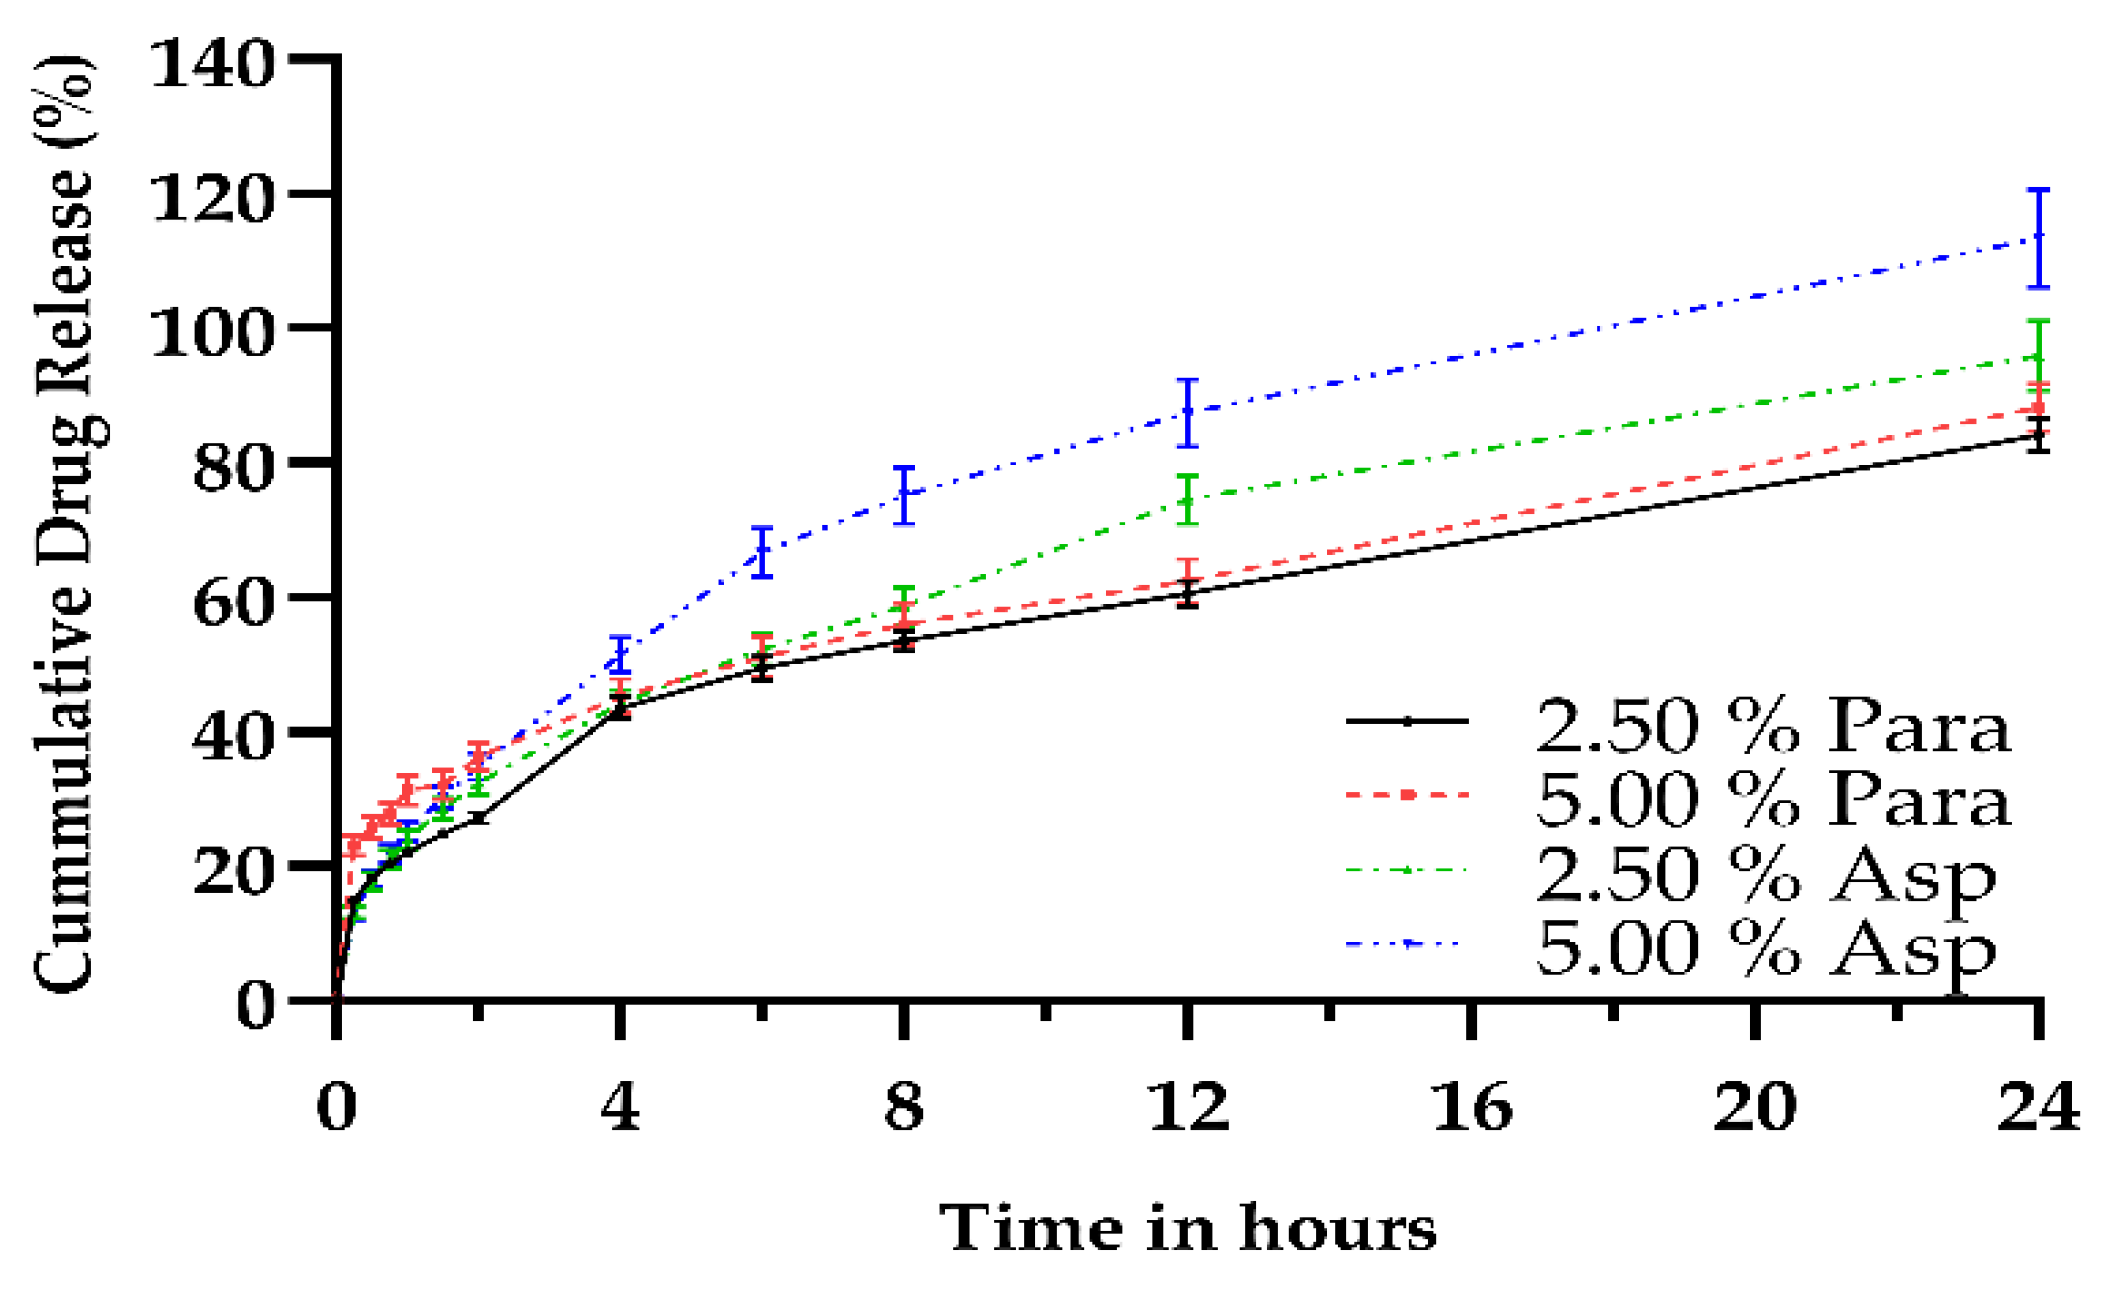
3.6. Dissolution Analysis
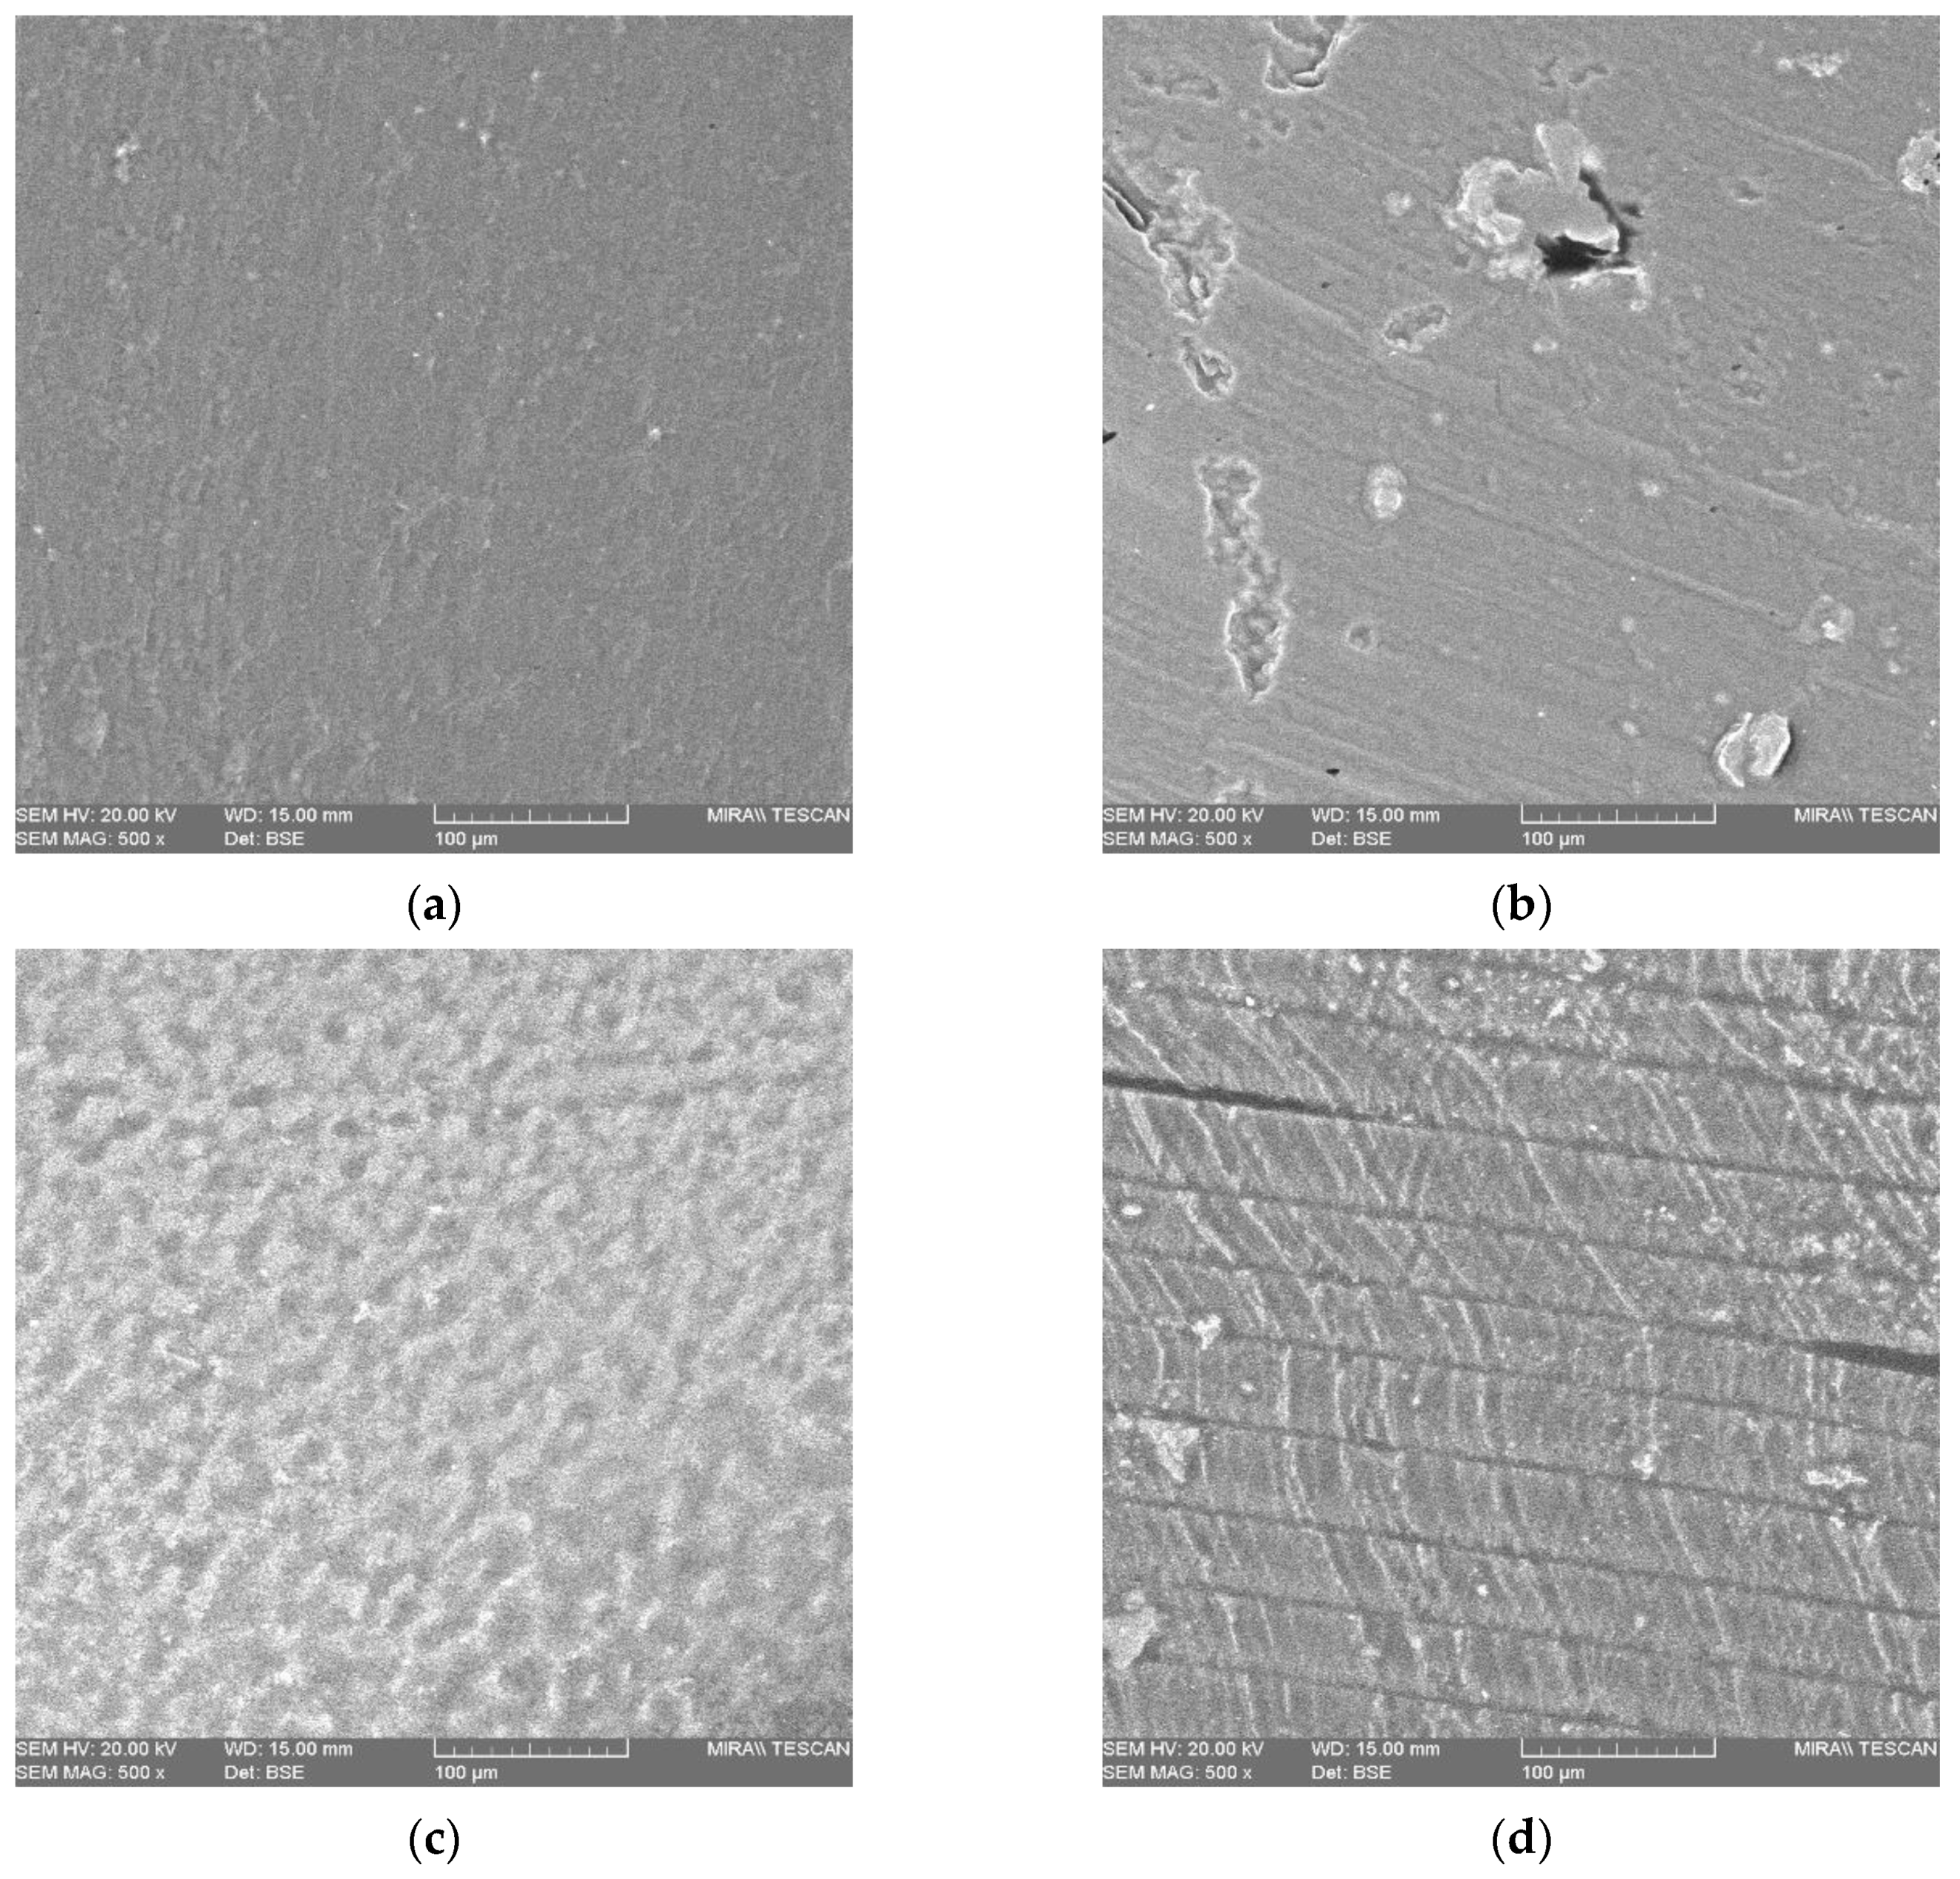
3.7. Scanning Electron Microscopy
4. Conclusions
Author Contributions
Funding
Conflicts of Interest
References
- Conner, B.P.; Manogharan, G.P.; Martof, A.N.; Rodomsky, L.M.; Rodomsky, C.M.; Jordan, D.C.; Limperos, J.W. Making sense of 3-D printing: Creating a map of additive manufacturing products and services. Addit. Manuf. 2014, 1–4, 64–76. [Google Scholar] [CrossRef]
- Gross, B.C.; Erkal, J.L.; Lockwood, S.Y.; Chen, C.; Spence, D.M. Evaluation of 3D Printing and Its Potential Impact on Biotechnology and the Chemical Sciences. Anal. Chem. 2014, 86, 3240–3253. [Google Scholar] [CrossRef] [PubMed]
- Prasad, L.K.; Smyth, H. 3D Printing technologies for drug delivery: A review. Drug Dev. Ind. Pharm. 2016, 42, 1019–1031. [Google Scholar] [CrossRef] [PubMed]
- Pollack, S.; Venkatesh, C.; Neff, M.; Healy, A.V.; Hu, G.; Fuenmayor, E.A.; Lyons, J.G.; Major, I.; Devine, D.M. Polymer-Based Additive Manufacturing: Historical Developments, Process Types and Material Considerations. In Polymer-Based Additive Manufacturing; Devine, D.M., Ed.; Springer International Publishing: Cham, Switzerland, 2019; pp. 1–22. [Google Scholar]
- Goyanes, A.; Robles Martinez, P.; Buanz, A.; Basit, A.W.; Gaisford, S. Effect of geometry on drug release from 3D printed tablets. Int. J. Pharm. 2015, 494, 657–663. [Google Scholar] [CrossRef]
- Martinez, P.R.; Goyanes, A.; Basit, A.W.; Gaisford, S. Influence of Geometry on the Drug Release Profiles of Stereolithographic (SLA) 3D-Printed Tablets. AAPS PharmSciTech 2018, 19, 3355–3361. [Google Scholar] [CrossRef]
- Fuenmayor, E.A.; Healy, A.V.; Dalton, M.; Major, I. Customised Interventions Utilising Additive Manufacturing. In Polymer-Based Additive Manufacturing; Devine, D.M., Ed.; Springer International Publishing: Cham, Switzerland, 2019; pp. 143–160. [Google Scholar]
- Fina, F.; Goyanes, A.; Gaisford, S.; Basit, A.W. Selective laser sintering (SLS) 3D printing of medicines. Int. J. Pharm. 2017, 529, 285–293. [Google Scholar] [CrossRef] [Green Version]
- Khaled, S.A.; Burley, J.C.; Alexander, M.R.; Yang, J.; Roberts, C.J. 3D printing of five-in-one dose combination polypill with defined immediate and sustained release profiles. J. Control. Release 2015, 217, 308–314. [Google Scholar] [CrossRef]
- Fina, F.; Madla, C.M.; Goyanes, A.; Zhang, J.; Gaisford, S.; Basit, A.W. Fabricating 3D printed orally disintegrating printlets using selective laser sintering. Int. J. Pharm. 2018, 541, 101–107. [Google Scholar] [CrossRef]
- Khaled, S.A.; Burley, J.C.; Alexander, M.R.; Yang, J.; Roberts, C.J. 3D printing of tablets containing multiple drugs with defined release profiles. Int. J. Pharm. 2015, 494, 643–650. [Google Scholar] [CrossRef]
- Fuenmayor, E.; Forde, M.; Healy, A.V.; Devine, D.M.; Lyons, J.G.; McConville, C.; Major, I. Comparison of fused-filament fabrication to direct compression and injection molding in the manufacture of oral tablets. Int. J. Pharm. 2019, 558, 328–340. [Google Scholar] [CrossRef] [Green Version]
- Goyanes, A.; Buanz, A.B.M.; Basit, A.W.; Gaisford, S. Fused-filament 3D printing (3DP) for fabrication of tablets. Int. J. Pharm. 2014, 476, 88–92. [Google Scholar] [CrossRef] [PubMed]
- Gioumouxouzis, C.I.; Katsamenis, O.L.; Bouropoulos, N.; Fatouros, D.G. 3D printed oral solid dosage forms containing hydrochlorothiazide for controlled drug delivery. J. Drug Deliv. Sci. Technol. 2017, 40, 164–171. [Google Scholar] [CrossRef] [Green Version]
- Khaled, S.A.; Burley, J.C.; Alexander, M.R.; Roberts, C.J.; Yang, J. Desktop 3D printing of controlled release pharmaceutical bilayer tablets. Int. J. Pharm. 2014, 461, 105–111. [Google Scholar] [CrossRef] [PubMed]
- Goyanes, A.; Wang, J.; Buanz, A.; Martínez-Pacheco, R.; Telford, R.; Gaisford, S.; Basit, A.W. 3D Printing of Medicines: Engineering Novel Oral Devices with Unique Design and Drug Release Characteristics. Mol. Pharm. 2015, 12, 4077–4084. [Google Scholar] [CrossRef] [Green Version]
- Norman, J.; Madurawe, R.D.; Moore, C.M.V.; Khan, M.A.; Khairuzzaman, A. A new chapter in pharmaceutical manufacturing: 3D-printed drug products. Adv. Drug Deliv. Rev. 2017, 108, 39–50. [Google Scholar] [CrossRef]
- Trenfield, S.J.; Awad, A.; Goyanes, A.; Gaisford, S.; Basit, A.W. 3D Printing Pharmaceuticals: Drug Development to Frontline Care. Trends Pharmacol. Sci. 2018, 1–12. [Google Scholar] [CrossRef]
- Verstraete, G.; Samaro, A.; Grymonpré, W.; Vanhoorne, V.; Van Snick, B.; Boone, M.N.; Hellemans, T.; Van Hoorebeke, L.; Remon, J.P.; Vervaet, C. 3D printing of high drug loaded dosage forms using thermoplastic polyurethanes. Int. J. Pharm. 2018, 536, 318–325. [Google Scholar] [CrossRef]
- Goyanes, A.; Det-Amornrat, U.; Wang, J.; Basit, A.W.; Gaisford, S. 3D scanning and 3D printing as innovative technologies for fabricating personalized topical drug delivery systems. J. Control. Release 2016, 234, 41–48. [Google Scholar] [CrossRef]
- Afsana; Jain, V.; Haider, N.; Jain, K. 3D Printing in Personalized Drug Delivery. Curr. Pharm. Des. 2019, 24, 5062–5071. [Google Scholar] [CrossRef]
- Martinez, P.R.; Goyanes, A.; Basit, A.W.; Gaisford, S. Fabrication of drug-loaded hydrogels with stereolithographic 3D printing. Int. J. Pharm. 2017, 532, 313–317. [Google Scholar] [CrossRef] [Green Version]
- Fuenmayor, E.; Forde, M.; Healy, A.; Devine, D.; Lyons, J.; McConville, C.; Major, I. Material Considerations for Fused-Filament Fabrication of Solid Dosage Forms. Pharmaceutics 2018, 10, 44. [Google Scholar] [CrossRef] [PubMed] [Green Version]
- Boetker, J.; Water, J.J.; Aho, J.; Arnfast, L.; Bohr, A.; Rantanen, J. Modifying release characteristics from 3D printed drug-eluting products. Eur. J. Pharm. Sci. 2016, 90, 47–52. [Google Scholar] [CrossRef]
- Goole, J.; Amighi, K. 3D printing in pharmaceutics: A new tool for designing customized drug delivery systems. Int. J. Pharm. 2016, 499, 376–394. [Google Scholar] [CrossRef] [PubMed]
- Zema, L.; Melocchi, A.; Maroni, A.; Gazzaniga, A. Three-Dimensional Printing of Medicinal Products and the Challenge of Personalized Therapy; Elsevier Inc.: Amsterdam, The Netherlands, 2017; Volume 106, ISBN 3902503246. [Google Scholar]
- Preis, M.; Öblom, H. 3D-Printed Drugs for Children—Are We Ready Yet? AAPS PharmSciTech 2017, 18, 303–308. [Google Scholar] [CrossRef] [PubMed]
- McDermott, S.; Walsh, J.E.; Howard, R.G. A novel application of UV-LEDs in the contact lens manufacturing process. In Proceedings of the Opto-Ireland 2005: Optical Sensing and Spectroscopy, Dublin, Ireland, 3 June 2005; Volume 5826, p. 119. [Google Scholar]
- Geever, T.; Killion, J.; Grehan, L.; Geever, L.M.; Chadwick, E.; Higginbotham, C. Effect of Photoinitiator Concentration on the Properties of Polyethylene Glycol Based Hydrogels for Potential Regenerative Medicine Applications. Adv. Environ. Biol. Adv. Environ. Biol 2014, 8, 7–17. [Google Scholar]
- Bernauer, U.; Chaudhry, Q.; Coenraads, P.; Degen, G.; Dusinska, M.; Gawkrodger, D.; Lilienblum, W.; Luch, A.; Nielsen, E.; Platzek, T.; et al. Scientific Committee on Consumer Safety Trimethylbenzoyl Diphenylphosphine Oxide (TPO); European Commission: Luxembourg, 2014. [Google Scholar]
- Ligon, S.C.; Liska, R.; Stampfl, J.; Gurr, M.; Mülhaupt, R. Polymers for 3D Printing and Customized Additive Manufacturing. Chem. Rev. 2017, 117, 10212–10290. [Google Scholar] [CrossRef] [Green Version]
- Meier, M.M.; Kanis, L.A.; de Lima, J.C.; Pires, A.T.N.; Soldi, V. Poly(caprolactone triol) as plasticizer agent for cellulose acetate films: Influence of the preparation procedure and plasticizer content on the physico-chemical properties. Polym. Adv. Technol. 2004, 15, 593–600. [Google Scholar] [CrossRef]
- Wessler, K.; Nishida, M.H.; Da Silva, J.; Pezzin, A.P.T.; Pezzin, S.H. Thermal properties and morphology of poly(3-hydroxybutyrate-co-3- hydroxyvalerate) with poly(caprolactone triol) mixtures. Macromol. Symp. 2006, 245–246, 161–165. [Google Scholar] [CrossRef]
- Kanis, L.A.; Soldi, V. Poly(ethylene-co-methyl acrylate)/poly(caprolactone) triol blends for drug delivery systems: Characterization and drug release. Quim. Nova 2012, 35, 297–300. [Google Scholar] [CrossRef] [Green Version]
- Li, Z.; Li, J. Control of hyperbranched structure of polycaprolactone/ poly(ethylene glycol) polyurethane block copolymers by glycerol and their hydrogels for potential cell delivery. J. Phys. Chem. B 2013, 117, 14763–14774. [Google Scholar] [CrossRef]
- Duarte, M.A.T.; de Rezende Duek, E.A.; Motta, A.C. In vitro degradation of poly (L-co-D,L lactic acid) containing PCL-T. Polímeros Ciência e Tecnol. 2014, 24, 1–8. [Google Scholar] [CrossRef] [Green Version]
- Meier, M.M.; Kanis, L.A.; Soldi, V. Characterization and drug-permeation profiles of microporous and dense cellulose acetate membranes: Influence of plasticizer and pore forming agent. Int. J. Pharm. 2004, 278, 99–110. [Google Scholar] [CrossRef] [PubMed]
- Elomaa, L.; Teixeira, S.; Hakala, R.; Korhonen, H.; Grijpma, D.W.; Seppälä, J.V. Preparation of poly(ε-caprolactone)-based tissue engineering scaffolds by stereolithography. Acta Biomater. 2011, 7, 3850–3856. [Google Scholar] [CrossRef] [PubMed]
- Chung, I.; Xie, D.; Puckett, A.D.; Mays, J.W. Syntheses and evaluation of biodegradable multifunctional polymer networks. Eur. Polym. J. 2003, 39, 1817–1822. [Google Scholar] [CrossRef]
- La Gatta, A.; De Rosa, A.; Laurienzo, P.; Malinconico, M.; De Rosa, M.; Schiraldi, C. A novel injectable poly(ε-caprolactone)/calcium sulfate system for bone regeneration: Synthesis and characterization. Macromol. Biosci. 2005, 5, 1108–1117. [Google Scholar] [CrossRef]
- Wang, J.; Goyanes, A.; Gaisford, S.; Basit, A.W. Stereolithographic (SLA) 3D Printing of Oral Modified-Release Dosage Forms. Int. J. Pharm. 2016, 503, 207–212. [Google Scholar] [CrossRef]
- Pivsa-Art, W.; Fujii, K.; Nomura, K.; Aso, Y.; Ohara, H.; Yamane, H. The effect of poly(ethylene glycol) as plasticizer in blends of poly(lactic acid) and poly(butylene succinate). J. Appl. Polym. Sci. 2016, 133, 1–10. [Google Scholar] [CrossRef]
- Li, D.; Jiang, Y.; Lv, S.; Liu, X.; Gu, J.; Chen, Q.; Zhang, Y. Preparation of plasticized poly (lactic acid) and its influence on the properties of composite materials. PLoS ONE 2018, 13, 1–15. [Google Scholar] [CrossRef] [Green Version]
- Serra, T.; Ortiz-Hernandez, M.; Engel, E.; Planell, J.A.; Navarro, M. Relevance of PEG in PLA-based blends for tissue engineering 3D-printed scaffolds. Mater. Sci. Eng. C 2014, 38, 55–62. [Google Scholar] [CrossRef]
- Kollamaram, G.; Croker, D.M.; Walker, G.M.; Goyanes, A.; Basit, A.W.; Gaisford, S. Low temperature fused deposition modeling (FDM) 3D printing of thermolabile drugs. Int. J. Pharm. 2018, 545, 144–152. [Google Scholar] [CrossRef] [Green Version]
- Melocchi, A.; Parietti, F.; Loreti, G.; Maroni, A.; Gazzaniga, A.; Zema, L. 3D printing by fused deposition modeling (FDM) of a swellable/erodible capsular device for oral pulsatile release of drugs. J. Drug Deliv. Sci. Technol. 2015, 30, 360–367. [Google Scholar] [CrossRef]
- Clark, E.A.; Alexander, M.R.; Irvine, D.J.; Roberts, C.J.; Wallace, M.J.; Sharpe, S.; Yoo, J.; Hague, R.J.M.; Tuck, C.J.; Wildman, R.D. 3D printing of tablets using inkjet with UV photoinitiation. Int. J. Pharm. 2017, 529, 523–530. [Google Scholar] [CrossRef]
- Morris, V.B.; Nimbalkar, S.; Younesi, M.; McClellan, P.; Akkus, O. Mechanical Properties, Cytocompatibility and Manufacturability of Chitosan:PEGDA Hybrid-Gel Scaffolds by Stereolithography. Ann. Biomed. Eng. 2017, 45, 1–11. [Google Scholar] [CrossRef]
- Killion, J.A.; Geever, L.M.; Devine, D.M.; Grehan, L.; Kennedy, J.E.; Higginbotham, C.L. Modulating the mechanical properties of photopolymerised polyethylene glycol–polypropylene glycol hydrogels for bone regeneration. J. Mater. Sci. 2012, 47, 6577–6585. [Google Scholar] [CrossRef]
- Killion, J.A.; Kehoe, S.; Geever, L.M.; Devine, D.M.; Sheehan, E.; Boyd, D.; Higginbotham, C.L. Hydrogel/bioactive glass composites for bone regeneration applications: Synthesis and characterisation. Mater. Sci. Eng. C 2013, 33, 4203–4212. [Google Scholar] [CrossRef]
- Browning, M.B.; Cereceres, S.N.; Luong, P.T.; Cosgriff-Hernandez, E.M. Determination of the in vivo degradation mechanism of PEGDA hydrogels. J. Biomed. Mater. Res. Part A 2014, 102, 4244–4251. [Google Scholar]
- Zhong, C.; Wu, J.; Reinhart-King, C.A.; Chu, C.C. Synthesis, characterization and cytotoxicity of photo-crosslinked maleic chitosan-polyethylene glycol diacrylate hybrid hydrogels. Acta Biomater. 2010, 6, 3908–3918. [Google Scholar] [CrossRef]
- McAvoy, K.; Jones, D.; Thakur, R.R.S. Synthesis and Characterisation of Photocrosslinked poly(ethylene glycol) diacrylate Implants for Sustained Ocular Drug Delivery. Pharm. Res. 2018, 35, 36. [Google Scholar] [CrossRef] [Green Version]
- Robles-Martinez, P.; Xu, X.; Trenfield, S.J.; Awad, A.; Goyanes, A.; Telford, R.; Basit, A.W.; Gaisford, S. 3D Printing of a Multi-Layered Polypill Containing Six Drugs Using a Novel Stereolithographic Method. Pharmaceutics 2019, 11, 274. [Google Scholar] [CrossRef] [Green Version]
- de Martino, M.; Chiarugi, A. Recent Advances in Pediatric Use of Oral Paracetamol in Fever and Pain Management. Pain Ther. 2015, 4, 149–168. [Google Scholar] [CrossRef] [Green Version]
- Kanani, K.; Gatoulis, S.C.; Voelker, M. Influence of differing analgesic formulations of aspirin on pharmacokinetic parameters. Pharmaceutics 2015, 7, 188–198. [Google Scholar] [CrossRef]
- McElroy, D.M.; Geever, L.M.; Higginbotham, C.L.; Devery, S.M. The Effect of Photoinitiator Concentration on the Physicochemical Properties of Hydrogel Contact Lenses. Appl. Mech. Mater. 2014, 679, 118–127. [Google Scholar] [CrossRef]
- McDermott, S.L.; Walsh, J.E.; Howard, R.G. A comparison of the emission characteristics of UV-LEDs and fluorescent lamps for polymerisation applications. Opt. Laser Technol. 2008, 40, 487–493. [Google Scholar] [CrossRef]
- Dizon, J.R.C.; Chen, Q.; Valino, A.D.; Advincula, R.C. Thermo-mechanical and swelling properties of three-dimensional-printed poly (ethylene glycol) diacrylate/silica nanocomposites. MRS Commun. 2018, 1–9. [Google Scholar] [CrossRef]
- Arikawa, H.; Takahashi, H.; Kanie, T.; Ban, S. Effect of various visible light photoinitiators on the polymerization and color of light-activated resins. Dent. Mater. J. 2009, 28, 454–460. [Google Scholar] [CrossRef] [Green Version]
- Steyrer, B.; Neubauer, P.; Liska, R.; Stampfl, J. Visible Light Photoinitiator for 3D-Printing of Tough Methacrylate Resins. Materials 2017, 10, 1445. [Google Scholar] [CrossRef] [Green Version]
- Asikainen, S.; van Bochove, B.; Seppälä, J.V. Drug-releasing biopolymeric structures manufactured via stereolithography. Biomed. Phys. Eng. Express 2019, 5, 025008. [Google Scholar] [CrossRef] [Green Version]
- Meng, R.F.; Mao, S.; Chapoy, L. Contact Lens. U.S. Patent 8461226, 11 June 2013. [Google Scholar]
- Duan, A.; Li, Y.; Li, B.; Zhu, P. 3D-printable thermochromic acrylic resin with excellent mechanical performance. J. Appl. Polym. Sci. 2019, 137, 48277. [Google Scholar] [CrossRef]
- Yang, W.; Yu, H.; Liang, W.; Wang, Y.; Liu, L. Rapid fabrication of hydrogel microstructures using UV-induced projection printing. Micromachines 2015, 6, 1903–1913. [Google Scholar] [CrossRef] [Green Version]
- Burke, G.; Cao, Z.; Devine, D.M.; Major, I. Preparation of Biodegradable Polyethylene Glycol Dimethacrylate Hydrogels via Thiol-ene Chemistry. Polymers 2019, 11, 1339. [Google Scholar] [CrossRef] [Green Version]
- Burke, G.; Barron, V.; Geever, T.; Geever, L.; Devine, D.M.; Higginbotham, C.L. Evaluation of the materials properties, stability and cell response of a range of PEGDMA hydrogels for tissue engineering applications. J. Mech. Behav. Biomed. Mater. 2019, 99, 1–10. [Google Scholar] [CrossRef]
- Wu, Y.H.; Park, H.B.; Kai, T.; Freeman, B.D.; Kalika, D.S. Water uptake, transport and structure characterization in poly(ethylene glycol) diacrylate hydrogels. J. Memb. Sci. 2010, 347, 197–208. [Google Scholar] [CrossRef]
- Killion, J.A.; Geever, L.M.; Devine, D.M.; Kennedy, J.E.; Higginbotham, C.L. Mechanical properties and thermal behaviour of PEGDMA hydrogels for potential bone regeneration application. J. Mech. Behav. Biomed. Mater. 2011, 4, 1219–1227. [Google Scholar] [CrossRef] [PubMed]
- BASF. Irgacure® TPO-Technical Data Sheet; BASF SE: Ludwigshafen, Germany, 2015. [Google Scholar]
- Burger, A.; Ramberger, R. On the polymorphism of pharmaceuticals and other molecular crystals. I. Mikrochim. Acta 1979, 72, 259–271. [Google Scholar] [CrossRef]
- Sacchetti, M. Thermodynamic Analysis of DSC Data for Acetaminophen Polymorphs. J. Therm. Anal. Calorim. 2001, 63, 345–350. [Google Scholar] [CrossRef]
- Trichy Rengarajan, G.; Beiner, M. Relaxation Behavior and Crystallization Kinetics of Amorphous Acetaminophen. Lett. Drug Des. Discov. 2006, 3, 723–730. [Google Scholar] [CrossRef]
- Rengarajan, G.T.; Enke, D.; Beiner, M. Crystallization Behavior of Acetaminophen in Nanopores. Open Phys. Chem. J. 2007, 1, 18–24. [Google Scholar] [CrossRef]
- Jain, H.; Khomane, K.S.; Bansal, A.K. Implication of microstructure on the mechanical behaviour of an aspirin–paracetamol eutectic mixture. CrystEngComm 2014, 16, 8471–8478. [Google Scholar] [CrossRef]
- Kundu, S.P.; Amjad, F.M.; Sultana, S.; Sultan, Z. Study of Differential Scanning Calorimetry of complex of Magnesium Sulfate with Aspirin, Paracetamol and Naproxen. Banladesh Pharm. J. 2012, 15, 7–12. [Google Scholar]
- Semalty, A.; Semalty, M.; Singh, D.; Rawat, M.S.M. Development and Characterization of Aspirin-Phospholipid Complex for Improved Drug Delivery. J. Pharm. Sci. 2010, 3, 940–947. [Google Scholar]
- Tita, B.; Fulias, A.; Rusu, G.; Tita, D. Thermal Behaviour of Acetylsalicylic Acid-active Substance and Tablets Kinetic Study under Non-isothermal Conditions. Rev. Chim. 2009, 60, 419–423. [Google Scholar]
- Tita, D.; Jurca, T.; Fulias, A.; Marian, E.; Tita, B. Compatibility study of the acetylsalicylic acid with different solid dosage forms excipients. J. Therm. Anal. Calorim. 2013, 112, 407–419. [Google Scholar] [CrossRef]
- Campanella, L.; Micieli, V.; Tomassetti, M.; Vecchio, S. Kinetic investigation and predictive model for the isothermal degradation time in two commercial acetylsalicylic acid-based pharmaceutical tablet formulations. Thermochim. Acta 2011, 526, 151–156. [Google Scholar] [CrossRef]
- Al-Maydama, H.M.; Abduljabbar, A.A.; Al-Maqtari, M.A.; Naji, K.M. Study of temperature and irradiation influence on the physicochemical properties of Aspirin. J. Mol. Struct. 2018, 1157, 364–373. [Google Scholar] [CrossRef]
- de A. Silva, E.M.; de A. Melo, D.M.; de F. V. de Moura, M.; de Farias, R.F. An investigation about the solid state thermal degradation of acetylsalicylic acid: Polymer formation. Thermochim. Acta 2004, 414, 101–104. [Google Scholar] [CrossRef]
- Goyanes, A.; Kobayashi, M.; Martínez-Pacheco, R.; Gaisford, S.; Basit, A.W. Fused-filament 3D printing of drug products: Microstructure analysis and drug release characteristics of PVA-based caplets. Int. J. Pharm. 2016, 514, 290–295. [Google Scholar] [CrossRef]
- Beck, R.C.R.; Chaves, P.S.; Goyanes, A.; Vukosavljevic, B.; Buanz, A.; Windbergs, M.; Basit, A.W.; Gaisford, S. 3D printed tablets loaded with polymeric nanocapsules: An innovative approach to produce customized drug delivery systems. Int. J. Pharm. 2017, 528, 268–279. [Google Scholar] [CrossRef]
- Zhang, J.; Yang, W.; Vo, A.Q.; Feng, X.; Ye, X.; Kim, D.W.; Repka, M.A. Hydroxypropyl methylcellulose-based controlled release dosage by melt extrusion and 3D printing: Structure and drug release correlation. Carbohydr. Polym. 2017, 177, 49–57. [Google Scholar] [CrossRef]
- Goyanes, A.; Allahham, N.; Trenfield, S.J.; Stoyanov, E.; Gaisford, S.; Basit, A.W. Direct powder extrusion 3D printing: Fabrication of drug products using a novel single-step process. Int. J. Pharm. 2019, 567, 118471. [Google Scholar] [CrossRef]
- Vehse, M.; Petersen, S.; Sternberg, K.; Schmitz, K.-P.; Seitz, H. Drug Delivery From Poly(ethylene glycol) Diacrylate Scaffolds Produced by DLC Based Micro-Stereolithography. Macromol. Symp. 2014, 346, 43–47. [Google Scholar] [CrossRef]


| SLA Formulation 1 | PEGDA 2 | PCL Triol 3 | Irgacure TPO 4 | Paracetamol | Aspirin |
|---|---|---|---|---|---|
| % (w/w) | |||||
| 2.50% Para | 19.30 | 77.20 | 1.00 | 2.50 | - |
| 5.00% Para | 18.80 | 75.20 | 1.00 | 5.00 | - |
| 2.50% Asp | 19.30 | 77.20 | 1.00 | - | 2.50 |
| 5.00% Asp | 18.80 | 75.20 | 1.00 | - | 5.00 |
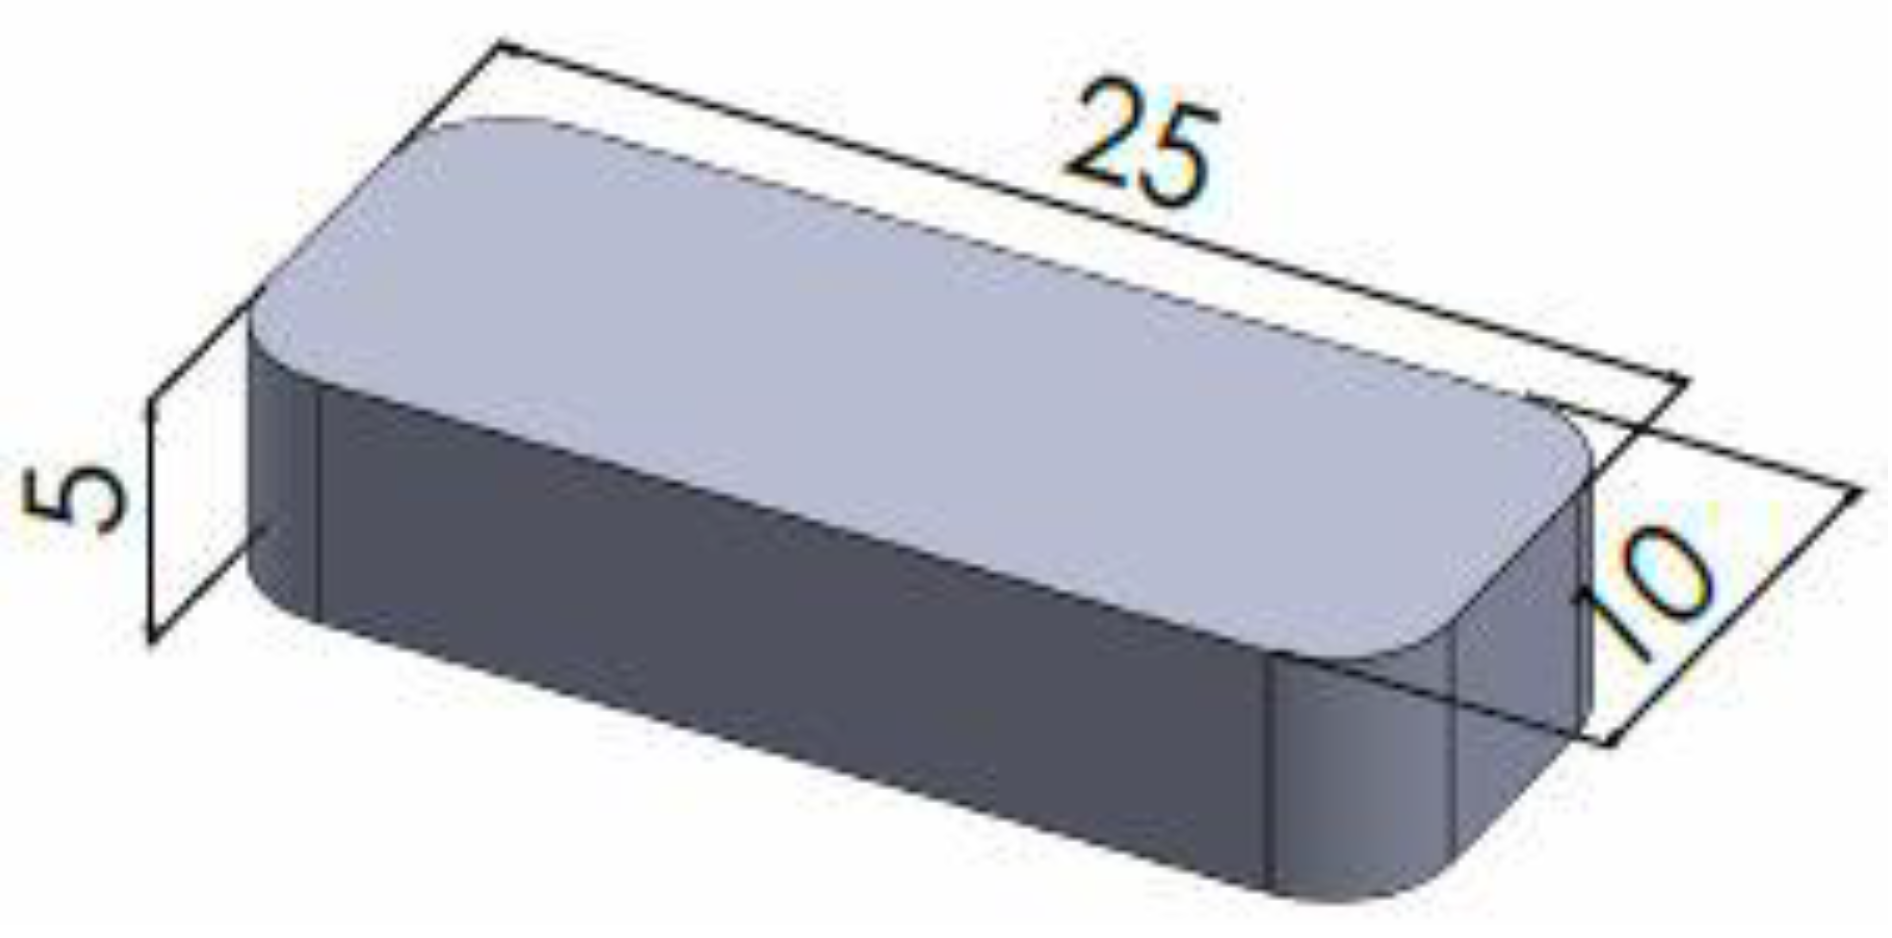
| SLA Formulation | Length (mm) | Width (mm) | Height (mm) |
|---|---|---|---|
| 2.50% Para | 25.26 ± 0.40 | 10.27 ± 0.20 | 5.12 ± 0.10 |
| 5.00% Para | 25.05 ± 0.26 | 10.00 ± 0.27 | 4.96 ± 0.15 |
| 2.50% Asp | 25.72 ± 0.18 | 10.85 ± 0.26 | 4.97 ± 0.11 |
| 5.00% Asp | 25.58 ± 0.26 | 10.64 ± 0.25 | 5.00 ± 0.12 |
© 2019 by the authors. Licensee MDPI, Basel, Switzerland. This article is an open access article distributed under the terms and conditions of the Creative Commons Attribution (CC BY) license (http://creativecommons.org/licenses/by/4.0/).
Share and Cite
Healy, A.V.; Fuenmayor, E.; Doran, P.; Geever, L.M.; Higginbotham, C.L.; Lyons, J.G. Additive Manufacturing of Personalized Pharmaceutical Dosage Forms via Stereolithography. Pharmaceutics 2019, 11, 645. https://doi.org/10.3390/pharmaceutics11120645
Healy AV, Fuenmayor E, Doran P, Geever LM, Higginbotham CL, Lyons JG. Additive Manufacturing of Personalized Pharmaceutical Dosage Forms via Stereolithography. Pharmaceutics. 2019; 11(12):645. https://doi.org/10.3390/pharmaceutics11120645
Chicago/Turabian StyleHealy, Andrew V., Evert Fuenmayor, Patrick Doran, Luke M. Geever, Clement L. Higginbotham, and John G. Lyons. 2019. "Additive Manufacturing of Personalized Pharmaceutical Dosage Forms via Stereolithography" Pharmaceutics 11, no. 12: 645. https://doi.org/10.3390/pharmaceutics11120645