Optimization and Prediction of Ibuprofen Release from 3D DLP Printlets Using Artificial Neural Networks

 ,
,
Abstract
:
1. Introduction
2. Materials and Methods
2.1. Preparation of Photopolymer Solution
2.2. Printing Dosage Forms
2.3. Characterization of Printlets
2.3.1. Determination of Physical and Mechanical Properties
2.3.2. Determination of Drug Concentration in 3DP Printlets
2.3.3. Dissolution Test Conditions
2.3.4. Kinetic Model
2.3.5. Differential Scanning Calorimetry (DSC)
2.4. Artificial Neural Network Modeling
- (1)
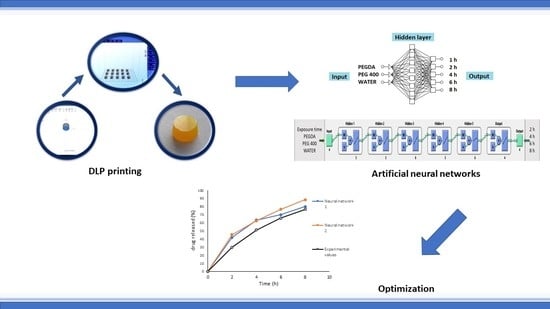
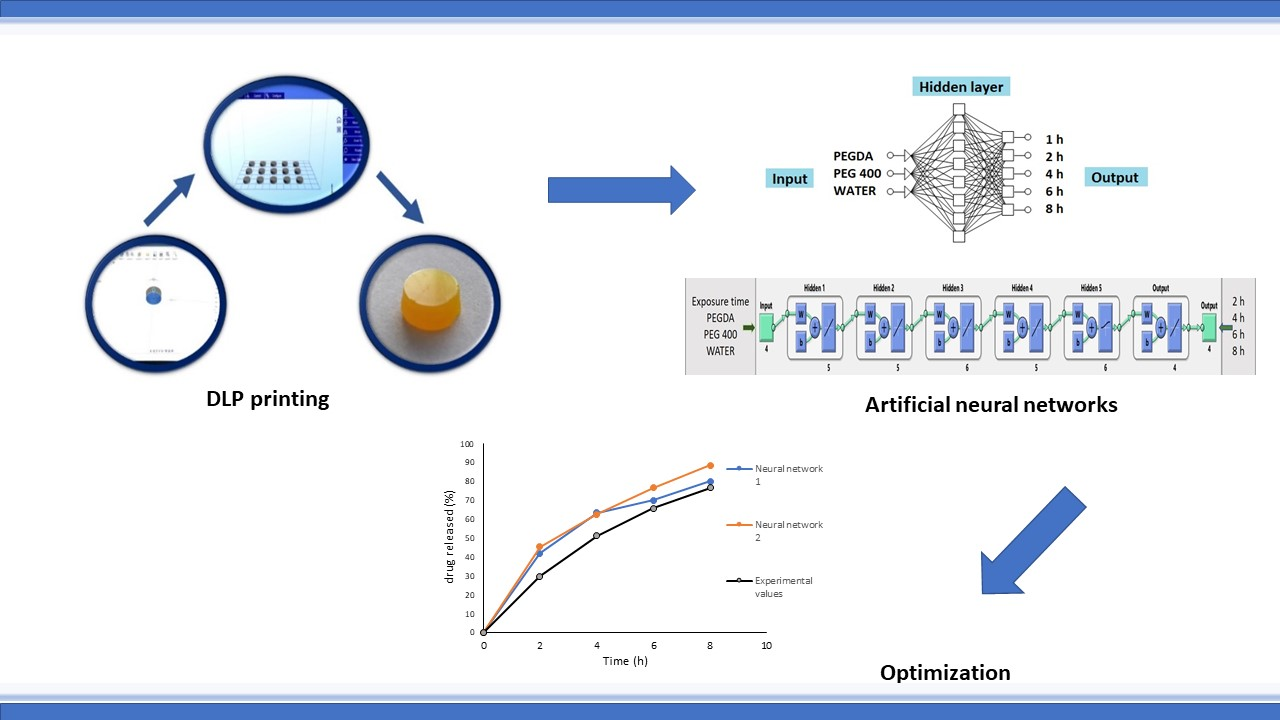
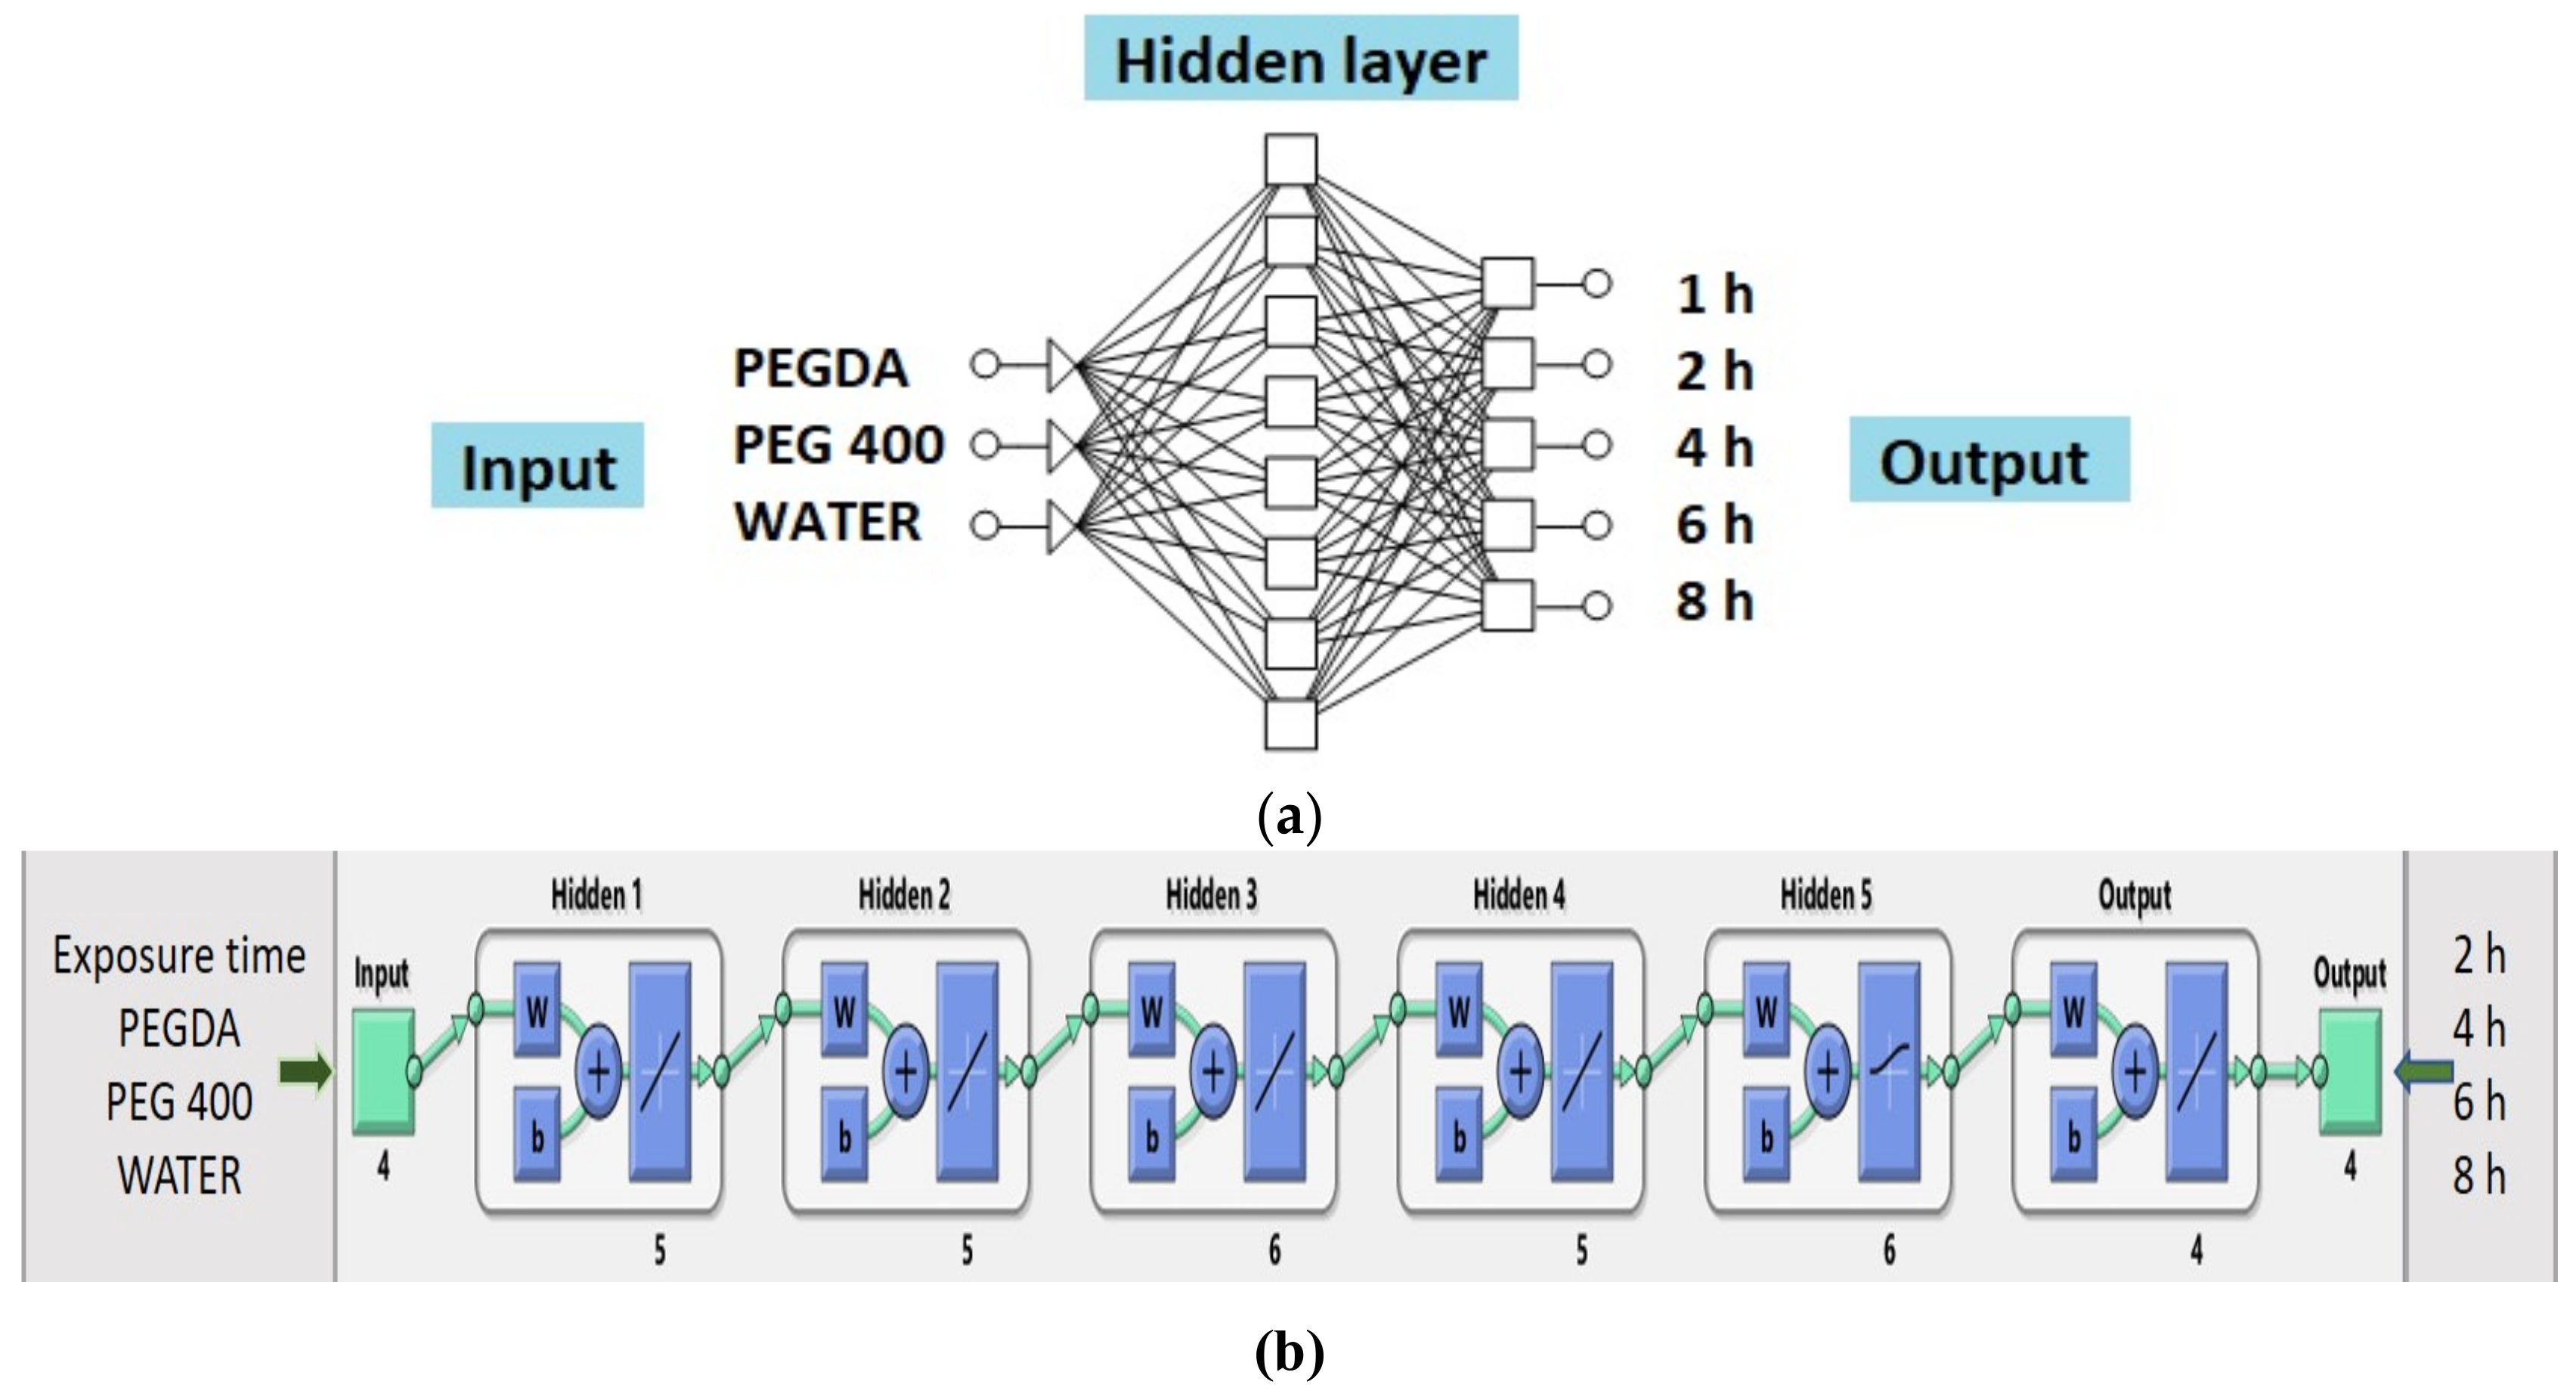
- Neural Network 1. Commercially available STATISTICA 7.0 Neural Networks software (StatSoft Inc., Tulsa, OK, USA.) was used throughout the study. For prediction and optimization of ibuprofen release from 3D DLP printlets, supervised MLP and backpropagation algorithm with linear activation function were used. The data set was split into training (8 formulations), validation (2 formulations) and test (1 formulation) subsets. Amount of PEGDA, PEG 400, and water (% w/w) in formulations were selected as input factors affecting the release of ibuprofen. The cumulative percentage of ibuprofen release from 3D DLP printlets at time points of 1, 2, 4, 6, and 8 h was used as output data (Table S1). A trial and error approach, conducted by varying the number of layers and number of nodes in the hidden layer(s), was used to train the neural network. Learning rate and momentum were 0.6, the number of layers was varied from 3 to 10, and the number of nodes in the hidden layer(s) from 4 to 10. The criteria to choose the ˝best MLP model˝ were minimal test error and maximum coefficient of determination R2 for observed vs. predicted values. After the training process, the prediction ability of the developed network was examined by external validation with the unseen samples of three test formulations.
- (2)
- Neural Network 2. Another approach was the usage of commercial software MATLAB R2014b (The MathWorks, Inc., Natick, MA, USA) to investigate the combination of process and formulation factors on optimization of ibuprofen release. A supervised MLP network and backpropagation algorithm with linear and log-sigmoid activation functions were used for the prediction. Percentage of PEGDA, PEG 400, and water in formulations were selected as input factors affecting the release of ibuprofen, as well as exposure times (s). The cumulative percentage of ibuprofen released after 2, 4, 6, and 8 h was the output data (Table S2). The most optimal MLP model was chosen based on the maximum R and minimal normalized mean square error between the calculated and target output for the test data. After the training process was finished, the prediction was examined by external validation with the unseen test (optimal formulation).
2.5. Optimization of 3D Printed Printlets
3. Results and Discussion
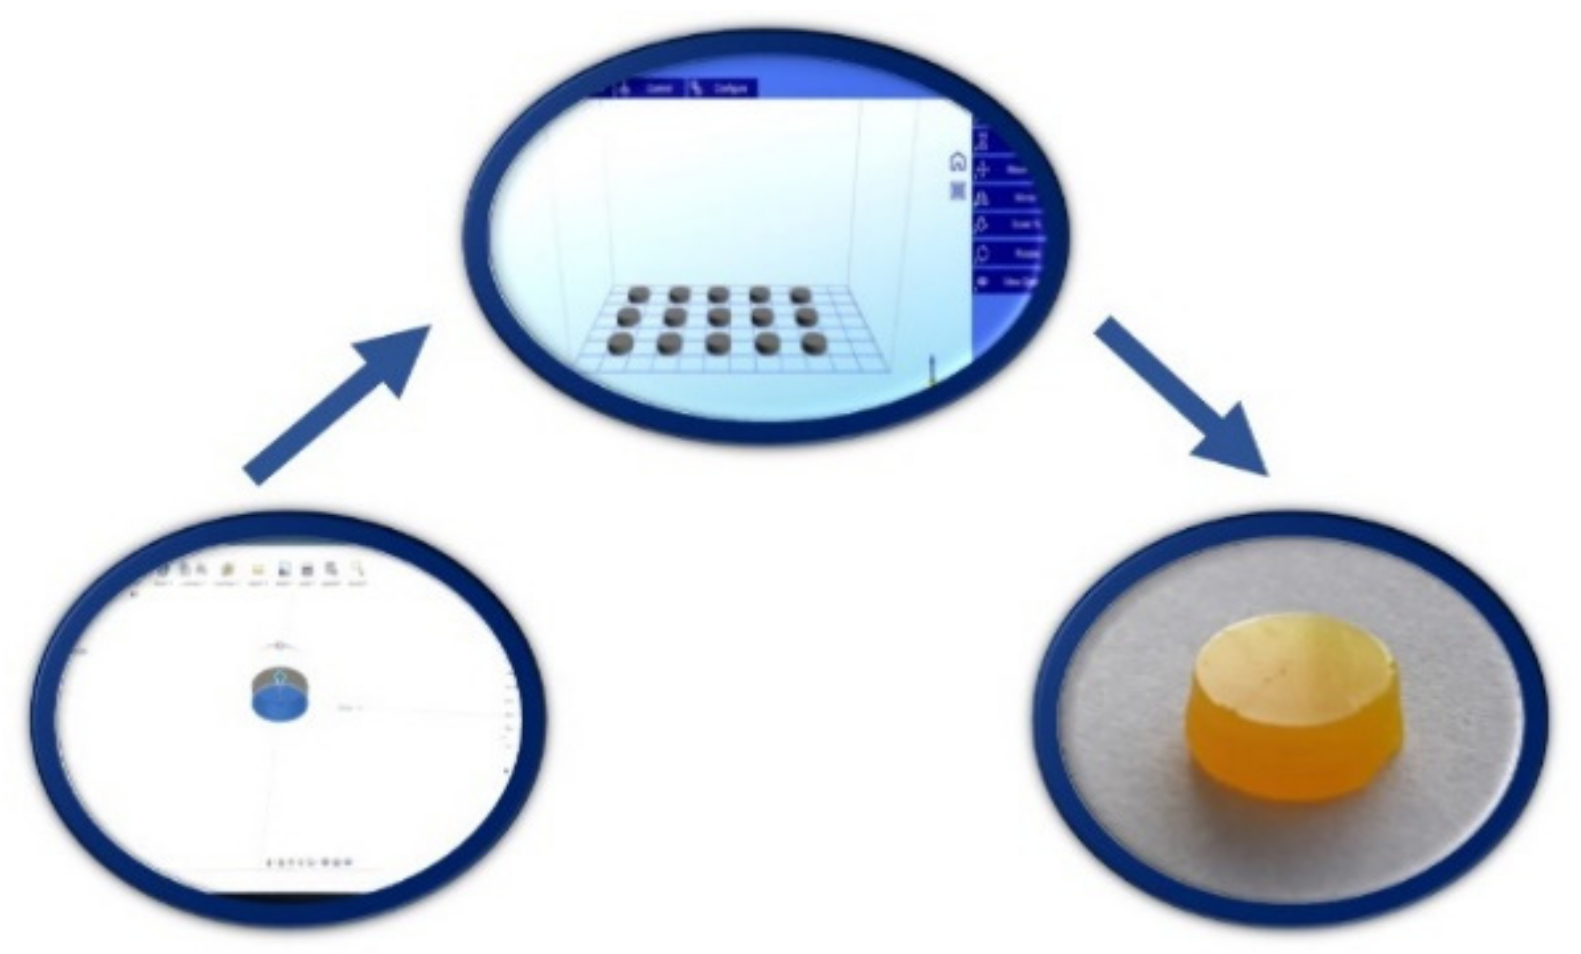
3.1. Printing Process
3.2. Characterization of Printlets
3.2.1. Physical and Mechanical Properties and Drug Content
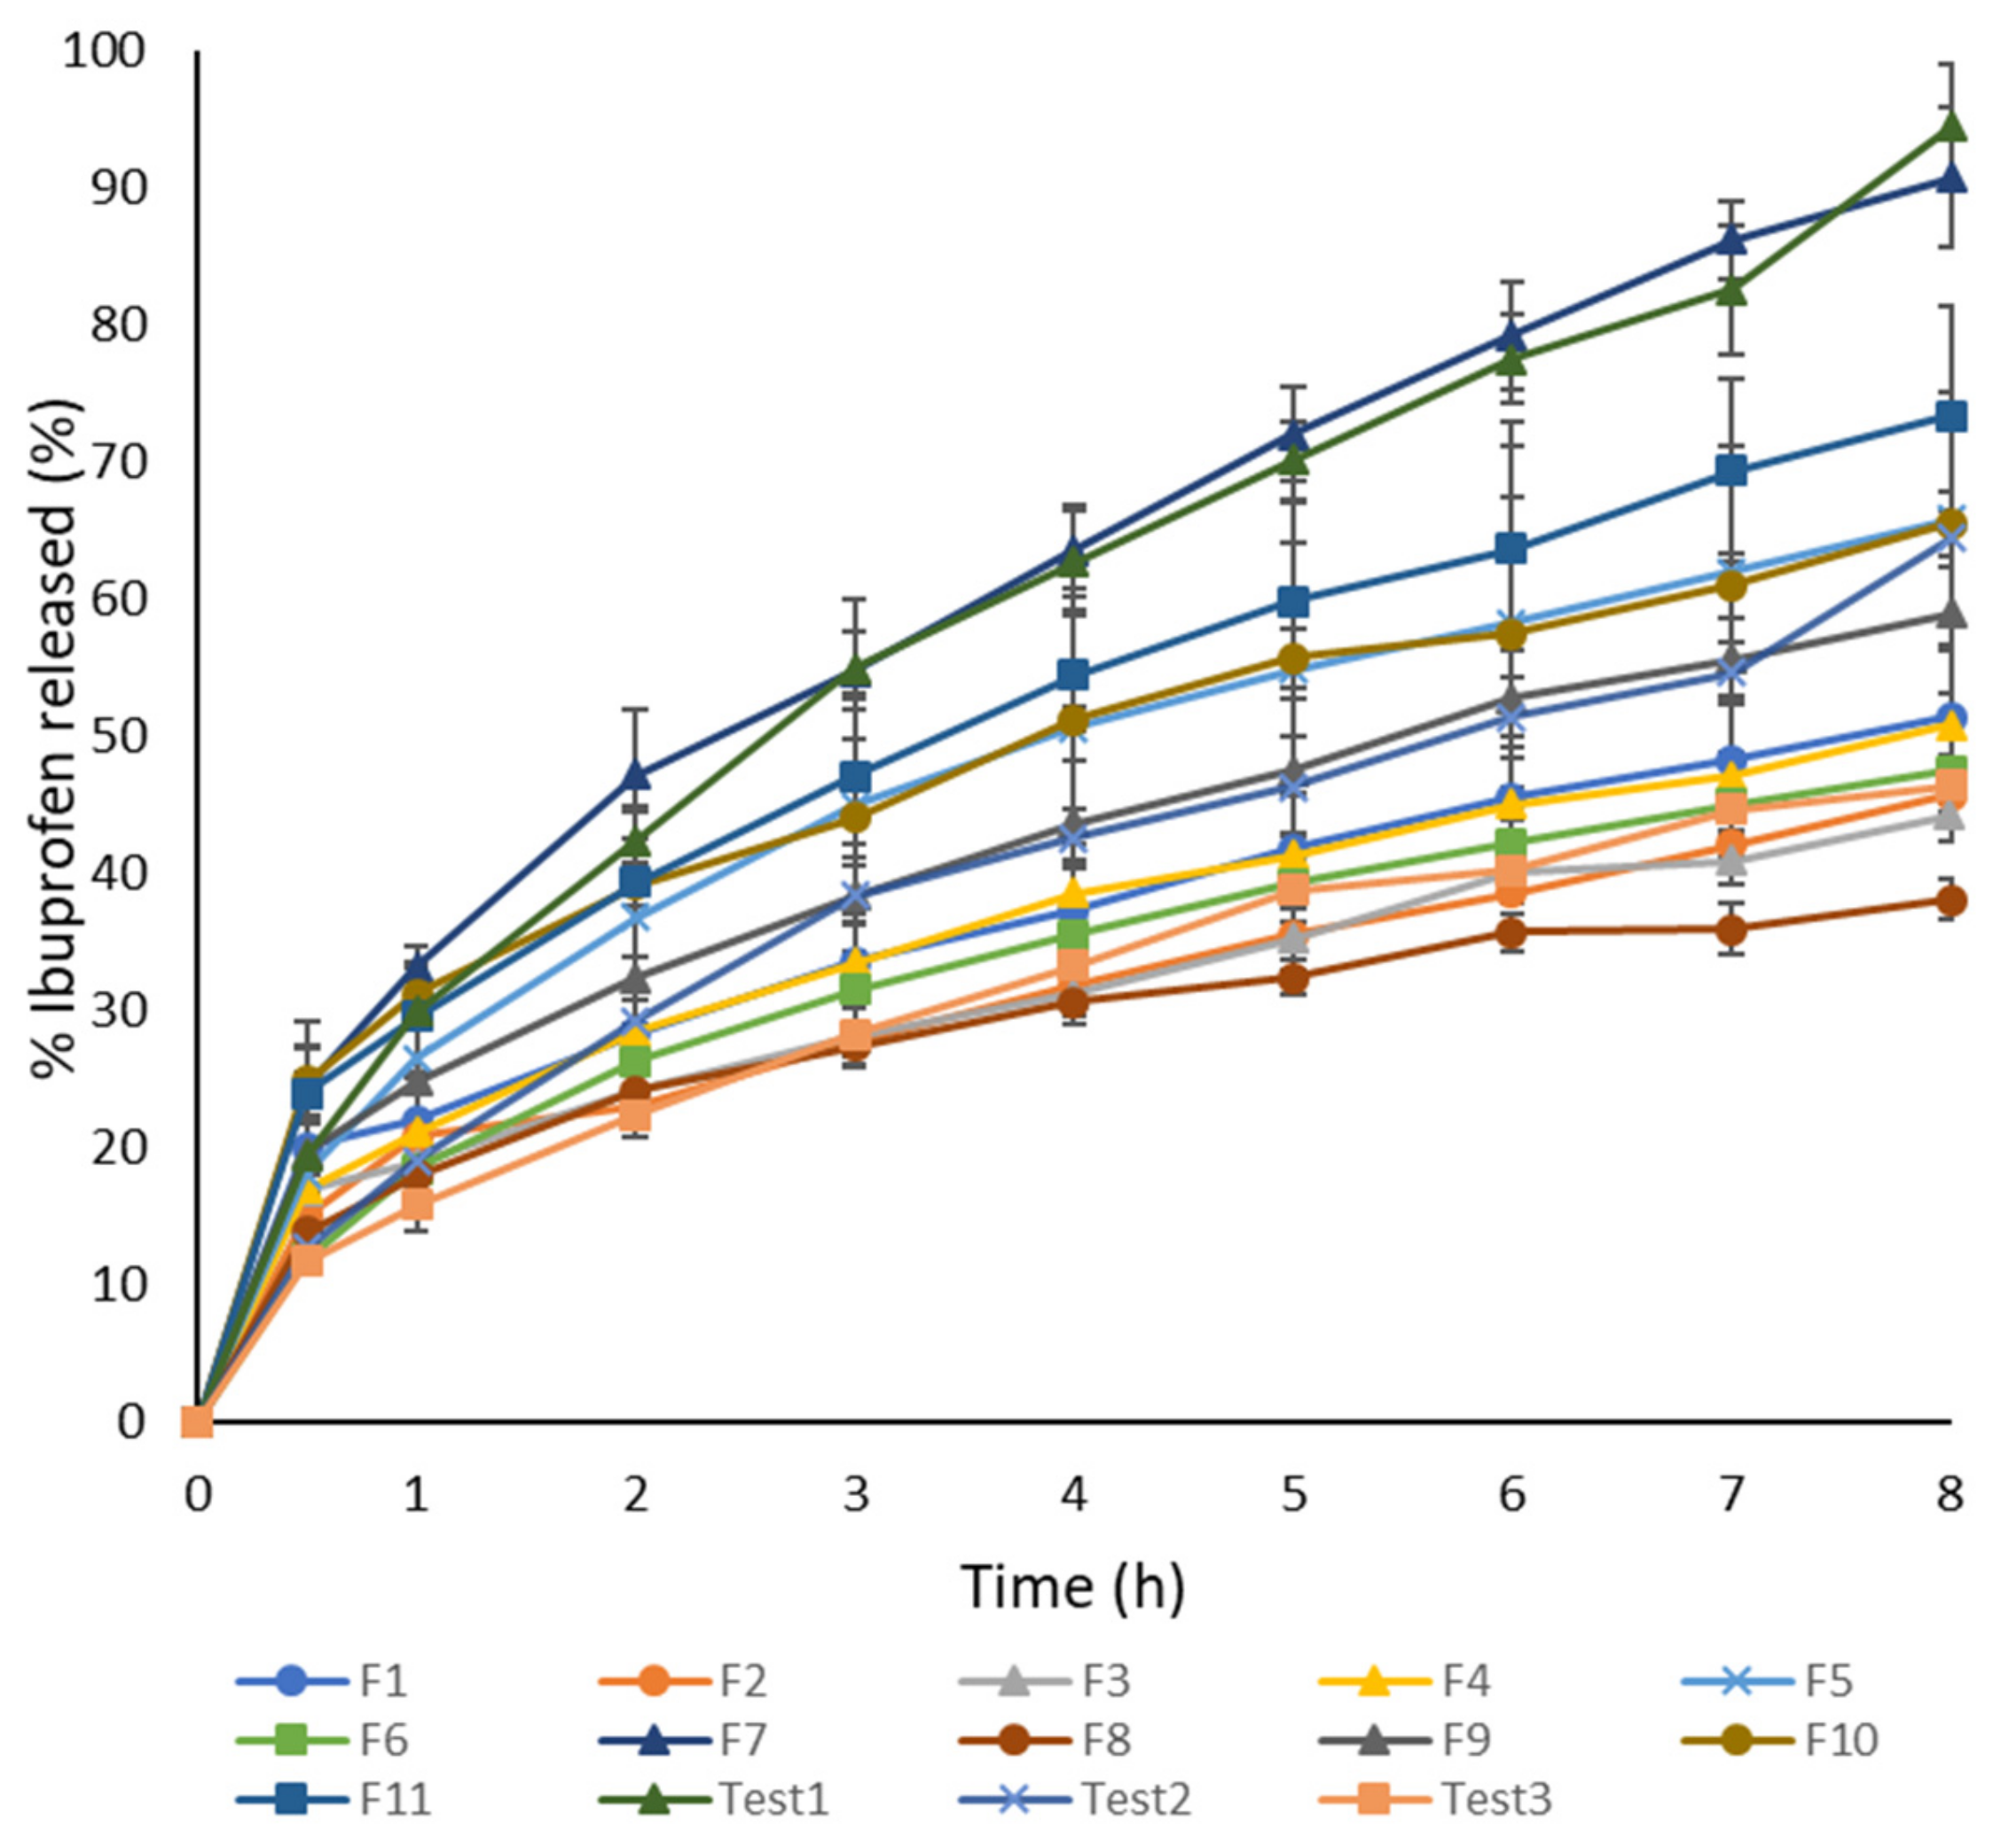
3.2.2. Dissolution Test
3.2.3. Drug Release Kinetic
3.3. Development of Artificial Neural Network Models
- (1)
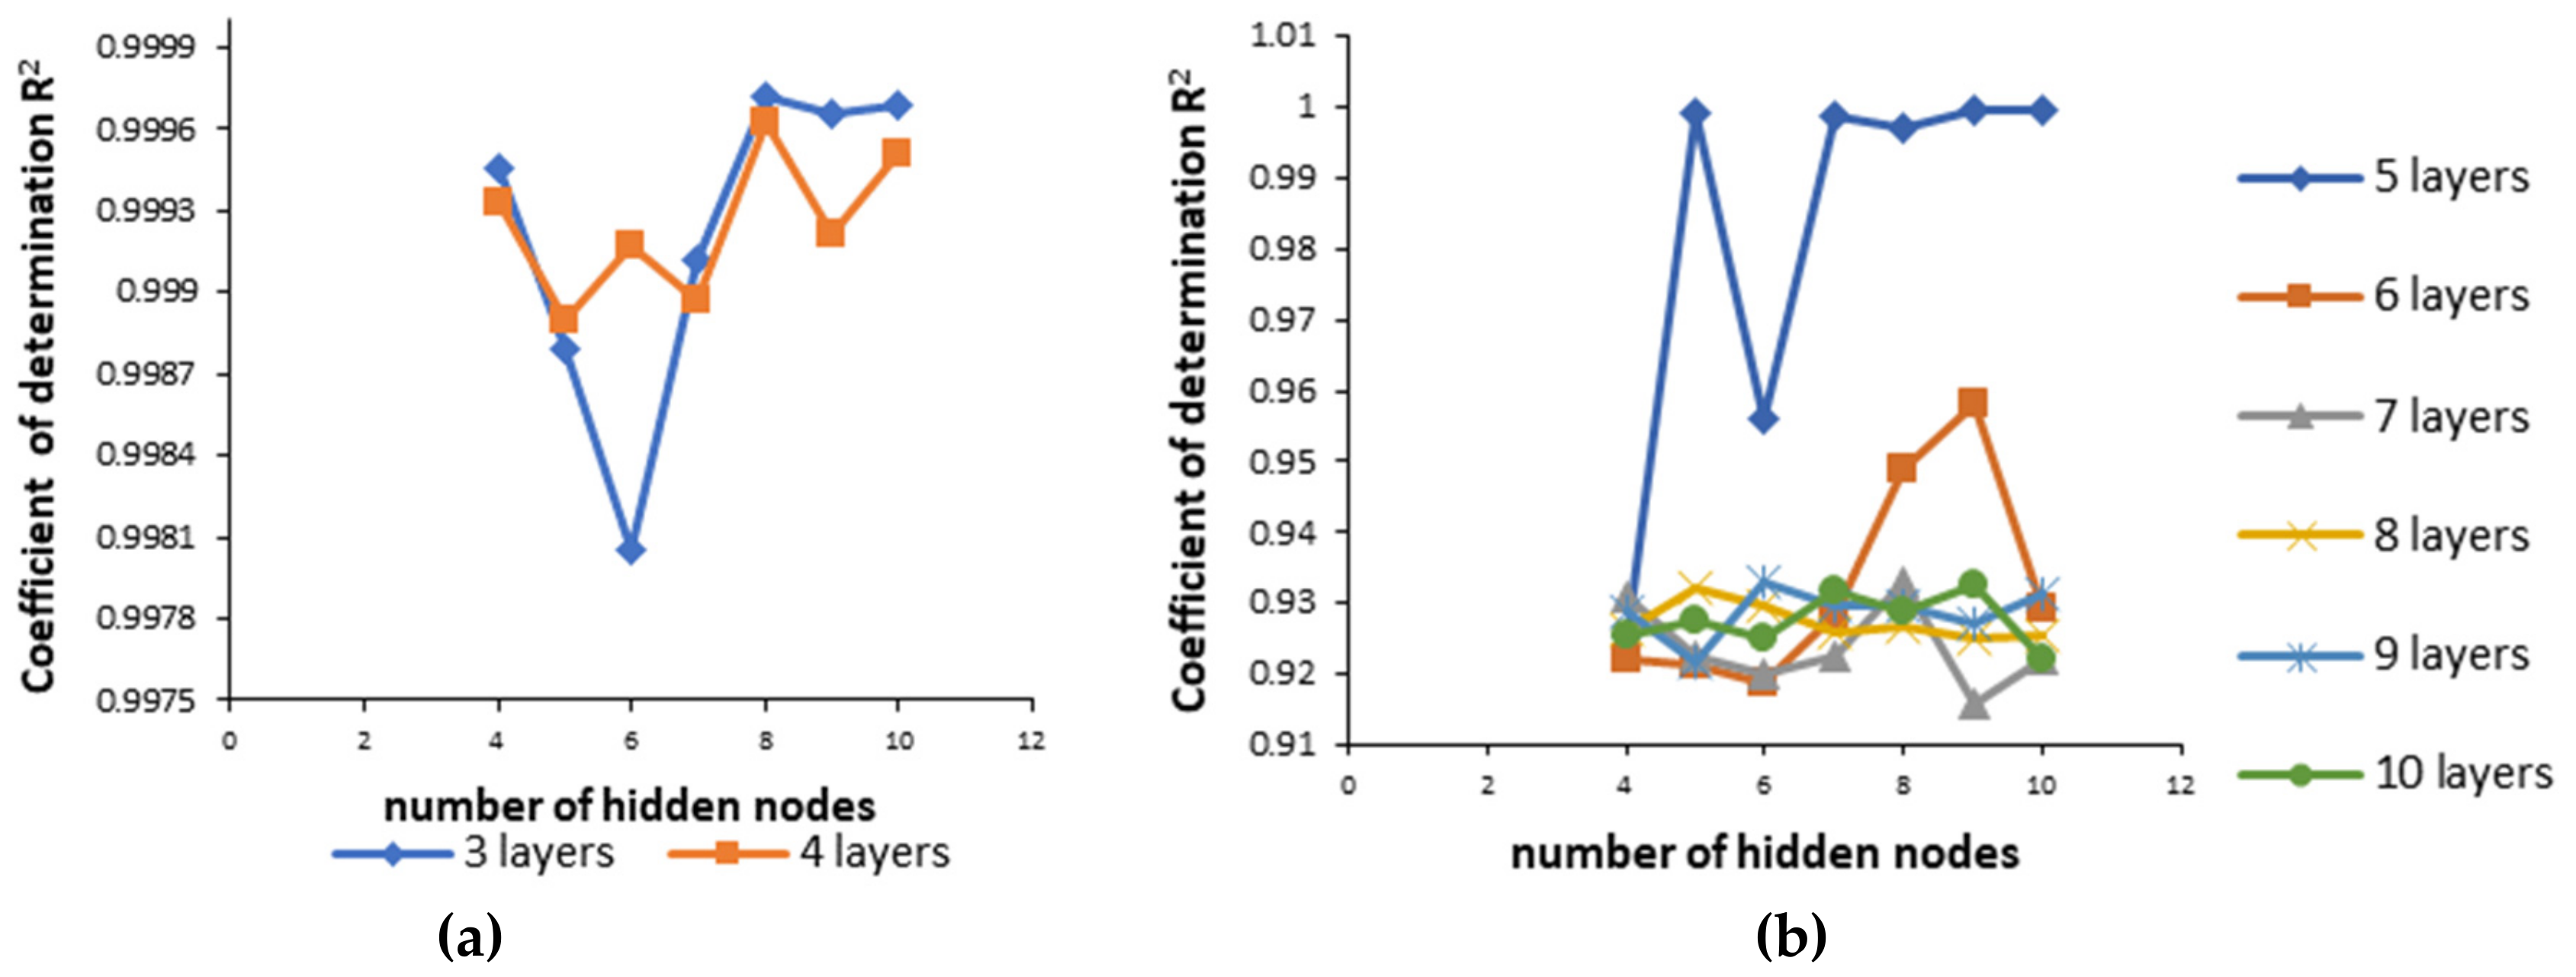
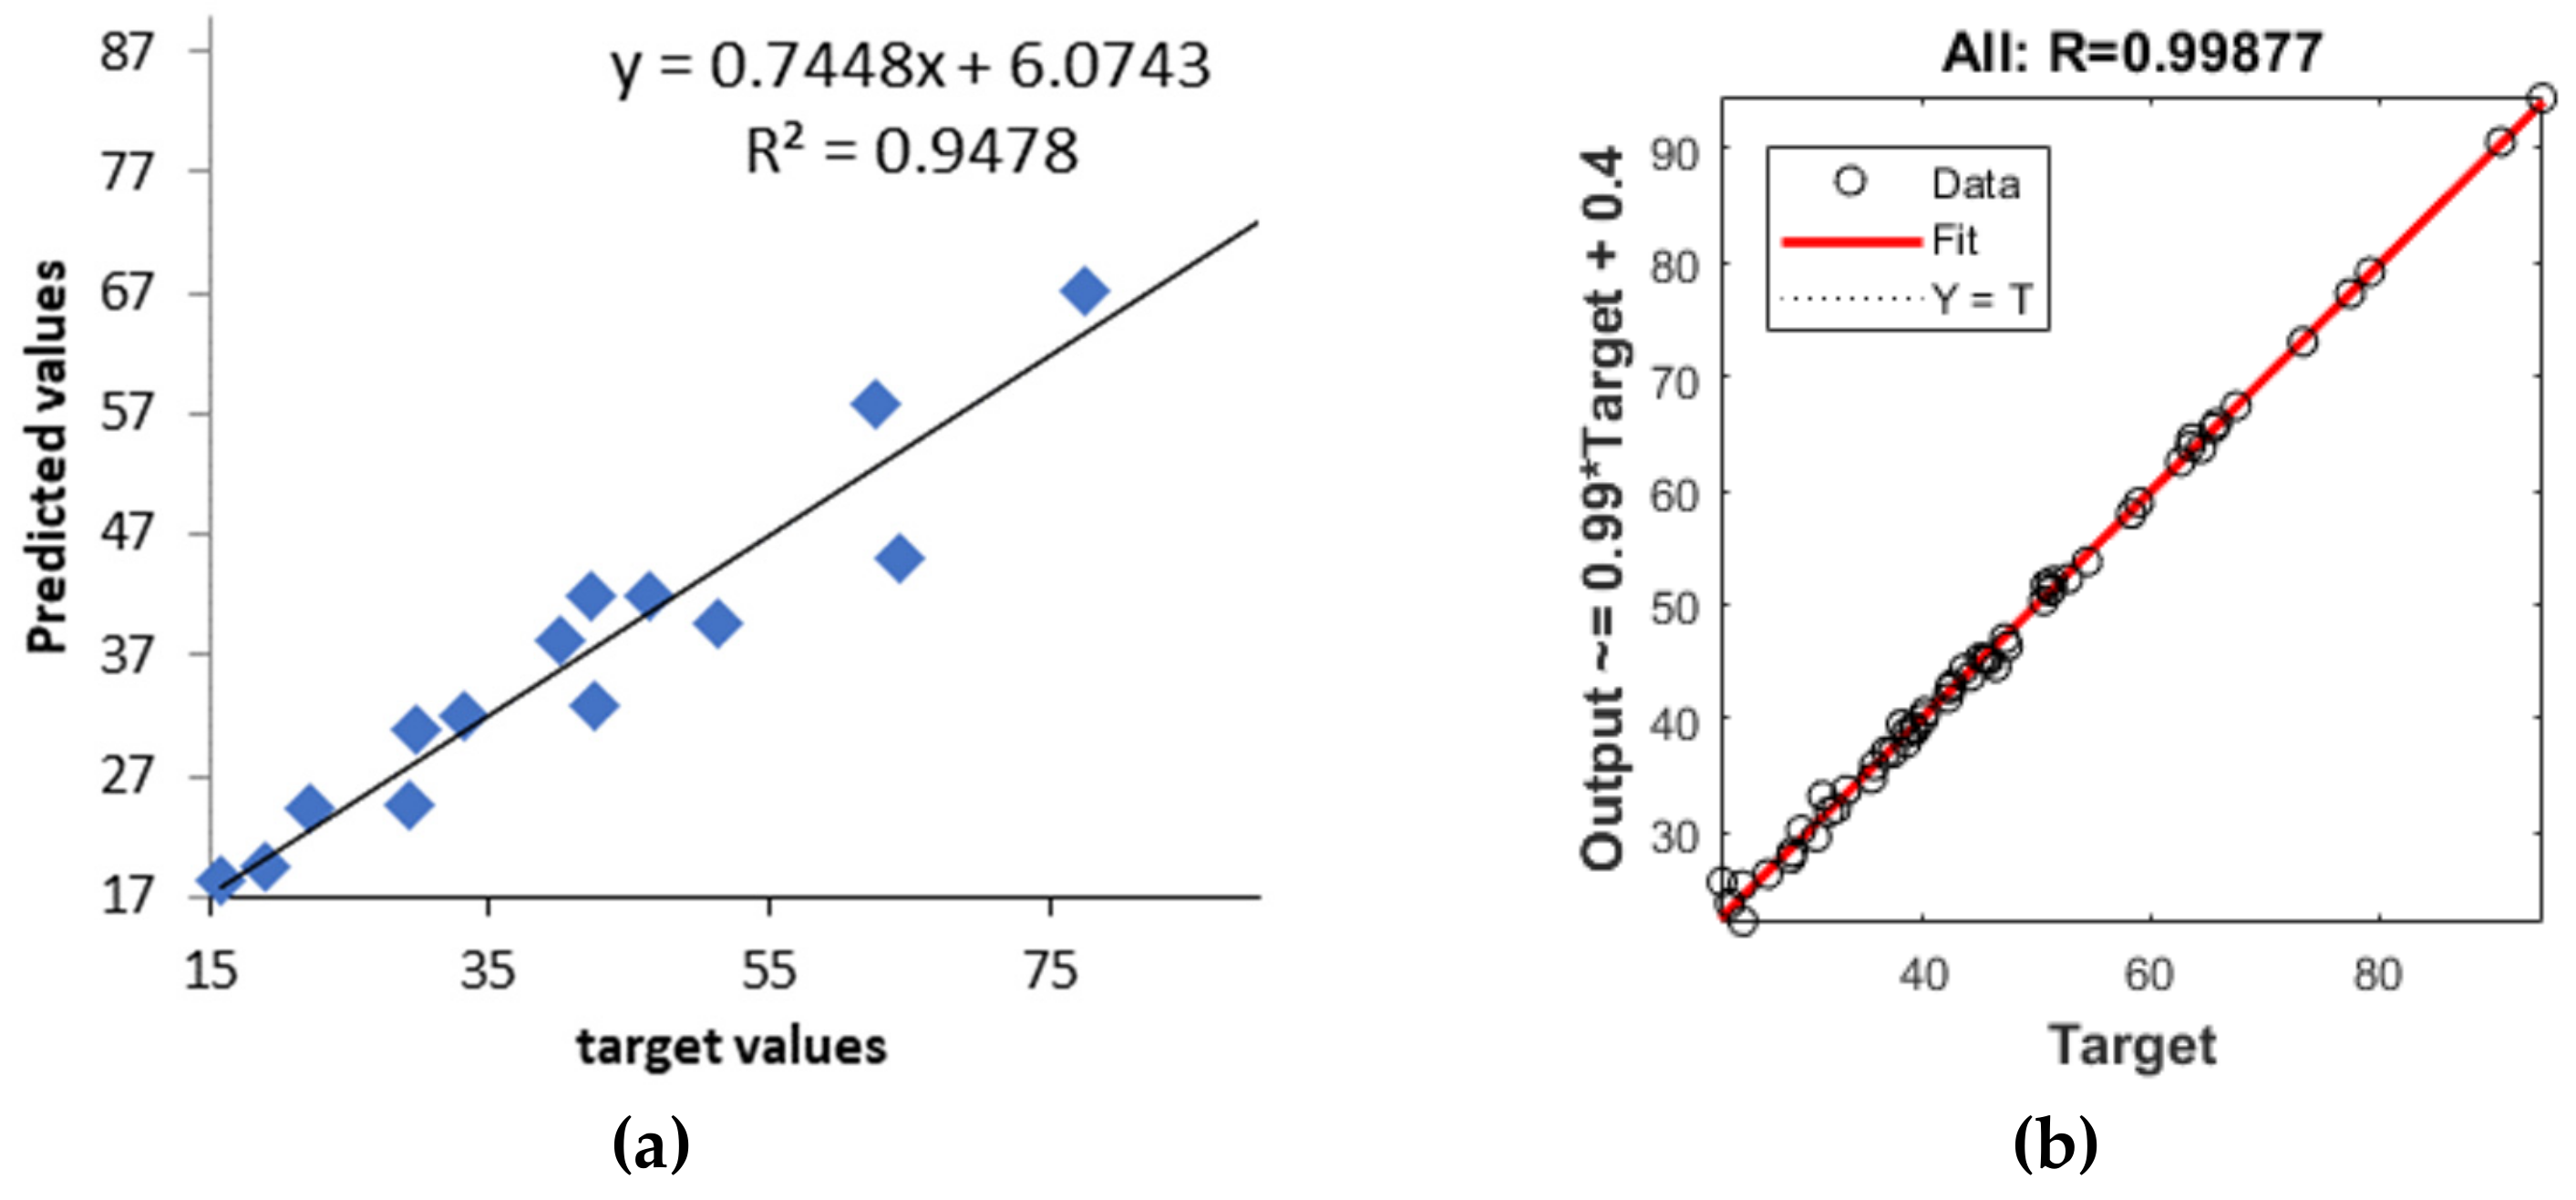
- Neural network 1. In the process of creating the most appropriate neural network 1 it was found that increasing the number of layers decreased the coefficient of determination (Figure 5). One hidden layer is normally adequate to provide an accurate prediction and more than one hidden layer can be used for modeling complex problems [29]. Selected MLP had a minimum root mean square (RMS = 0.0296) and the highest coefficient of determination (R2 = 0.9994) for obtained vs. predicted values of cumulative drug release for two formulations. Hence, a network consisting of three input and five output units, with eight hidden units arranged in a single hidden layer was selected. MLP was tested with a set of test data. Three test formulations (Test 1, 2, 3) were prepared and examined in the same test conditions as formulations F1–F11. A correlation plot was constructed of the experimentally obtained responses and those predicted by MLP. The square coefficient R2 was 0.9478 (Figure 6a).
- (2)
- Neural network 2. For the second version of the ANN, where exposure times were used as inputs as well as percentage of PEGDA, PEG 400, and water, correlation plots of predicted and obtained values of drug release for all formulations (training, validation, and test) showed that the MLP model had a regression plot with coefficient R2 = 0.99877, which indicated that the optimum MLP model was reached (Figure 6b). An optimal neural network with neural network 2 was achieved using five hidden layers with the number of units being 5, 5, 6, 5, and 6 per layer. The data set consisted of training (90% of samples) and validation (10% of samples) subsets.
3.4. Optimization and Characterization of Optimal Formulation
4. Conclusions
Supplementary Materials
Author Contributions
Funding
Conflicts of Interest
References
- Goyanes, A.; Det-Amornrat, U.; Wang, J.; Basit AW. Gaisford, S. 3D scanning and 3D printing as innovative technologies for fabricating personalized topical drug delivery systems. J. Control. Release 2016, 234, 41–48. [Google Scholar] [CrossRef] [PubMed]
- Norman, J.; Madurawe, R.D.; Moore, C.M.V.; Khan, M.A.; Khairuzzaman, A. A new chapter in pharmaceutical manufacturing: 3D-printed drug products. Adv. Drug Deliv. Rev. 2017, 108, 39–50. [Google Scholar] [CrossRef] [PubMed]
- Awad, A.; Trenfield, S.J.; Goyanes, A.; Gaisford, S.; Basit, A.W. Reshaping drug development using 3D printing. Drug Discov. Today 2018, 23, 1547–1555. [Google Scholar] [CrossRef] [PubMed] [Green Version]
- Zhang, J.; Vo, A.Q.; Feng, X.; Bandari, S.; Repka, M.A. Pharmaceutical Additive Manufacturing: a Novel Tool for Complex and Personalized Drug Delivery Systems. AAPS PharmSciTech 2018, 19, 3388–3402. [Google Scholar] [CrossRef] [PubMed]
- Zhang, J.; Feng, X.; Patil, H.; Tiwari, R.V.; Repka, M.A. Coupling 3D printing with hot-melt extrusion to produce controlled-release tablets. Int. J. Pharm. 2017, 519, 186–197. [Google Scholar] [CrossRef] [PubMed]
- Fina, F.; Madla, C.M.; Goyanes, A.; Zhang, J.; Gaisford, S.; Basit, A.W. Fabricating 3D printed orally disintegrating printlets using selective laser sintering. Int. J. Pharm. 2018, 541, 101–107. [Google Scholar] [CrossRef] [PubMed]
- Wang, J.; Goyanes, A.; Gaisford, S.; Basit, A.W. Stereolithographic (SLA) 3D printing of oral modified-release dosage forms. Int. J. Pharm. 2016, 503, 207–212. [Google Scholar] [CrossRef]
- Sadia, M.; Alhnan, M.A.; Ahmed, W.; Jackson, M.J. 3D printing of pharmaceuticals. In Micro and Nanomanufacturing; Springer Nature: Basel, Switzerland, 2017; Volume 2, pp. 467–498. [Google Scholar]
- Martinez, P.R.; Goyanes, A.; Basit, A.W.; Gaisford, S. Fabrication of drug-loaded hydrogels with stereolithographic 3D printing. Int. J. Pharm. 2017, 532, 313–317. [Google Scholar] [CrossRef] [Green Version]
- Martinez, P.R.; Goyanes, A.; Basit, A.W.; Gaisford, S. Influence of Geometry on the Drug Release Profiles of Stereolithographic (SLA) 3D-Printed Tablets. AAPS PharmSciTech 2018, 19, 3355–3361. [Google Scholar] [CrossRef]
- Kadry, H.; Wadnap, S.; Xu, C.; Ahsan, F. Digital light processing (DLP)3D-printing technology and photoreactive polymers in fabrication of modified-release tablets. Eur. J. Pharm. Sci. 2019, 135, 60–67. [Google Scholar] [CrossRef]
- Barmpalexis, P.; Kanaze, F.I.; Kachrimanis, K.; Georgarakis, E. Artificial neural networks in the optimization of a nimodipine controlled release tablet formulation. Eur. J. Pharm. Biopharm. 2010, 74, 316–323. [Google Scholar] [CrossRef] [PubMed]
- Ibrić, S.; Djuriš, J.; Parojčić, J.; Djurić, Z. Artificial Neural Networks in Evaluation and Optimization of Modified Release Solid Dosage Forms. Pharmaceutics 2012, 4, 531–550. [Google Scholar] [CrossRef] [PubMed] [Green Version]
- Agatonovic-Kustrin, S.; Beresford, R. Basic concepts of artificial neural network (ANN) modeling and its application in pharmaceutical research. J. Pharm. Biomed. Anal. 2000, 22, 717–727. [Google Scholar] [CrossRef]
- Das, P.J.; Preuss, C.; Mazumder, B. Artificial Neural Network as Helping Tool for Drug Formulation and Drug Administration Strategies. In Artificial Neural Network for Drug Design, Delivery and Disposition; Elsevier Inc.: Amsterdam, The Netherlands, 2015; pp. 263–276. [Google Scholar] [CrossRef]
- Landin, M.; Rowe, R.C. Artificial neural networks technology to model, understand, and optimize drug formulations. In Formulation Tools for Pharmaceutical Development; Woodhead Publishing: Oxford, UK, 2013; pp. 7–37. [Google Scholar] [CrossRef]
- Havel, J.; Peña, E.M.; Rojas-Hernández, A.; Doucet, J.P.; Panaye, A. Neural networks for optimization of high-performance capillary zone electrophoresis methods. J. Chromatogr. A. 1998, 793, 317–329. [Google Scholar] [CrossRef]
- Medarević, D.P.; Kleinebudde, P.; Djuriš, J.; Djurić, Z.; Ibrić, S. Combined application of mixture experimental design and artificial neural networks in the solid dispersion development. Drug Dev. Ind. Pharm. 2016, 42, 389–402. [Google Scholar] [CrossRef]
- Miletić, T.; Ibrić, S.; Durić, Z. Combined Application of Experimental Design and Artificial Neural Networks in Modeling and Characterization of Spray Drying Drug: Cyclodextrin Complexes. Dry Technol. 2014, 32, 167–179. [Google Scholar] [CrossRef]
- Takahara, J.; Takayama, K.; Nagai, T. Multi-objective simultaneous optimization technique based on an artificial neural network in sustained release formulations. J. Control. Release. 1997, 49, 11–20. [Google Scholar] [CrossRef]
- Fouassier, J.P.; Lalev, J. Supramolecular Photochemistry Principles and Applications of Photochemistry. In Handbook of Photochemistry and Photophysics of Polymeric Materials; Wiley-VCH: Weinheim, Germany, 2012. [Google Scholar] [CrossRef]
- Nguyen, A.K.; Gittard, S.D.; Koroleva, A.; Schlie, S.; Gaidukeviciute, A.; Chichkov, B.N.; Narayan, R.J. Two-photon polymerization of polyethylene glycol diacrylate scaffolds with riboflavin and triethanolamine used as a water-soluble photoinitiator. Regen. Med. 2013, 8, 725–738. [Google Scholar] [CrossRef]
- Savic, I.; Nikolic, V.; Savic, I.; Nikolic, L.; Stankovic, M.; Moder, K. Optimization of total flavonoid compound extraction from camellia sinesis using the artificial neural network and response surface methodology. Hem. Ind. 2012, 67, 249–259. [Google Scholar] [CrossRef]
- Robles-Martinez, P.; Xu, X.; Trenfield, S.; Awad, A.; Goyanes, A. 3D-Printing of a Multi-Layered Polypill containing Six Drugs using a Novel Stereolitographic Method. Pharmaceutics 2019, 11, 1–15. [Google Scholar] [CrossRef]
- Clark, E.A.; Alexander, M.R.; Irvine, D.J.; Roberts, C.J.; Wallace, M.J.; Sharpe, S.; Wildman, R.D. 3D printing of tablets using inkjet with UV photoinitiation. Int. J. Pharm. 2017, 529, 523–530. [Google Scholar] [CrossRef] [PubMed]
- Mhlanga, N.; Ray, S.S. Kinetic models for the release of the anticancer drug doxorubicin from biodegradable polylactide/metal oxide-based hybrids. Int. J. Biol. Macromol. 2015, 72, 1301–1307. [Google Scholar] [CrossRef] [PubMed]
- Caccavo, D. An overview on the mathematical modeling of hydrogels’ behavior for drug delivery systems. Int. J. Pharm. 2019, 560, 175–190. [Google Scholar] [CrossRef] [PubMed]
- Ritger, L.P.A.; Peppas, N.A. Simple equation for description of solute release II. Fickian and anomalous release from swellable devices. J. Control. Release. 1987, 5, 37–42. [Google Scholar] [CrossRef]
- Sun, Y.; Peng, Y.; Chen, Y.; Shukla, A.J. Application of artificial neural networks in the design of controlled release drug delivery systems. Adv. Drug Deliv. Rev. 2003, 55, 1201–1215. [Google Scholar] [CrossRef]
- Jang, E.S.; Kamcev, J.; Kobayashi, K.; Yan, N.; Sujanani, R.; Dilenschneider, T.J.; Park., H.B.; Paul, D.R.; Freeman, B. Influence of water content on alkali metal chloride transport in cross-linked Poly(ethylene glycol) Diacrylate.1. Ion sorption. Polymer 2019, 178, 121554. [Google Scholar] [CrossRef]
- Haddadin, R.; Qian, F.; Desikan, S.; Hussain, M.; Smith, R.L. Estimation of drug solubility in polymers via differential scanning calorimetry and utilization of the fox equation. Pharm. Dev. Technol. 2009, 14, 18–26. [Google Scholar] [CrossRef]
- Hussain, A.; Smith, G.; Khan, K.A.; Bukhari, N.I.; Pedge, N.I.; Ermolina, I. Solubility and dissolution rate enhancement of ibuprofen by co-milling with polymeric excipients. Eur. J. Pharm. Sci. 2018, 123, 395–403. [Google Scholar] [CrossRef]
- Dudognon, E.; Danède, F.; Descamps, M.; Correia, N.T. Evidence for a new crystalline phase of racemic Ibuprofen. Pharm. Res. 2008, 25, 2853–2858. [Google Scholar] [CrossRef]
- Yang, Y.; Ye, Z.; Su, Y.; Zhao, Q.; Li, X.; Ouyang, D. Deep learning for in vitro prediction of pharmaceutical formulations. Acta Pharm. Sin. B. 2019, 9, 177–185. [Google Scholar] [CrossRef]
- Diaz, D.A.; Colgan, S.T.; Langer, C.S.; Bandi, N.; Likar, M.D.; Van Alstine, L. Erratum to: Dissolution Similarity Requirements: How Similar or Dissimilar Are the Global Regulatory Expectations? AAPS J. 2016, 18, 792. [Google Scholar] [CrossRef] [PubMed]


| Formulation | PEGDA | PEG 400 | Water | riboflavin | ibuprofen |
|---|---|---|---|---|---|
| F1 | 32.10 | 32.60 | 30.00 | 0.10 | 5.00 |
| F2 | 30.00 | 44.10 | 20.50 | 0.10 | 5.00 |
| F3 | 74.60 | 10.00 | 10.10 | 0.10 | 5.00 |
| F4 | 62.40 | 21.80 | 10.50 | 0.10 | 5.00 |
| F5 | 50.60 | 34.00 | 10.00 | 0.10 | 5.00 |
| F6 | 65.80 | 11.20 | 17.70 | 0.10 | 5.00 |
| F7 | 30.00 | 54.60 | 10.00 | 0.10 | 5.00 |
| F8 | 58.10 | 10.00 | 26.60 | 0.10 | 5.00 |
| F9 | 39.30 | 45.30 | 10.00 | 0.10 | 5.00 |
| F10 | 46.20 | 23.10 | 25.40 | 0.10 | 5.00 |
| F11 | 40.40 | 35.60 | 18.70 | 0.10 | 5.00 |
| Test 1 | 35.00 | 47.90 | 12.00 | 0.10 | 5.00 |
| Test 2 | 55.00 | 24.90 | 15.00 | 0.10 | 5.00 |
| Test 3 | 65.00 | 7.90 | 22.00 | 0.10 | 5.00 |
| F placebo | 42.50 | 42.40 | 15.00 | 0.10 | 0.00 |
| Formulation | Exposure Time (s) | Bottom Exposure (s) | Layer Thickness (mm) | Bottom Layers |
|---|---|---|---|---|
| F1 | 800.00 | 800.00 | 0.10 | 10.00 |
| F2 | 800.00 | 800.00 | 0.10 | 10.00 |
| F3 | 400.00 | 800.00 | 0.10 | 10.00 |
| F4 | 400.00 | 800.00 | 0.10 | 10.00 |
| F5 | 500.00 | 800.00 | 0.10 | 10.00 |
| F6 | 600.00 | 800.00 | 0.10 | 10.00 |
| F7 | 400.00 | 800.00 | 0.10 | 10.00 |
| F8 | 800.00 | 800.00 | 0.10 | 10.00 |
| F9 | 400.00 | 800.00 | 0.10 | 10.00 |
| F10 | 800.00 | 800.00 | 0.10 | 10.00 |
| F11 | 600.00 | 800.00 | 0.10 | 10.00 |
| Test 1 | 400.00 | 800.00 | 0.10 | 10.00 |
| Test 2 | 500.00 | 800.00 | 0.10 | 10.00 |
| Test 3 | 600.00 | 800.00 | 0.10 | 10.00 |
| F placebo | 600.00 | 800.00 | 0.10 | 10.00 |
| Formulation | Weight (mg) | Diameter (mm) | Thickness (mm) | Hardness (N) | Drug Load (mg) |
|---|---|---|---|---|---|
| F1 | 387.00 ± 45.20 | 11.13 ± 0.62 | 3.00 ± 0.00 | 47.33 ± 3.21 | 24.11 ± 2.51 |
| F2 | 378.00 ± 29.00 | 10.86 ± 0.31 | 3.09 ± 0.20 | 32.00 ± 17.00 | 23.00 ± 1.58 |
| F3 | 323.40 ± 21.60 | 10.81 ± 0.31 | 3.00 ± 0.00 | 108.33 ± 23.71 | 15.00 ± 1.00 |
| F4 | 296.70 ± 4.50 | 10.17 ± 0.26 | 3.02 ± 0.04 | 92.33 ± 29.02 | 14.40 ± 0.22 |
| F5 | 354.40 ± 21.10 | 10.55 ± 0.38 | 3.00 ± 0.00 | 33.00 ± 4.58 | 22.30 ± 0.13 |
| F6 | 278.90 ± 11.50 | 10.04 ± 0.09 | 3.00 ± 0.00 | 132.33 ± 18.88 | 18.30 ± 0.75 |
| F7 | 345.10 ± 32.70 | 10.52 ± 0.32 | 2.99 ± 0.02 | n.d.1 | 21.70 ± 2.05 |
| F8 | 400.10 ± 42.90 | 12.40 ± 0.55 | 2.97 ± 0.23 | 29.67 ± 3.51 | 27.10 ± 2.91 |
| F9 | 340.50 ± 19.50 | 10.60 ± 0.17 | 2.94 ± 0.13 | 19.00 ± 8.66 | 23.00 ± 1.13 |
| F10 | 375.00 ± 28.70 | 11.53 ± 0.43 | 2.92 ± 0.11 | 37.00 ± 16.52 | 25.80 ± 1.98 |
| F11 | 377.50 ± 37.30 | 11.40 ± 0.47 | 2.99 ± 0.12 | 35.00 ± 24.25 | 25.50 ± 2.53 |
| Weight | Linear | Quadratic | Special Cubic | Cubic |
| Adjusted R2 | 0.4828 | 11,760.57 | 0.0573 | 0.5331 |
| Predicted R2 | 0.2042 | −2.6704 | −4.744 | −15888.43 |
| PRESS | 11,760.57 | 54,239.56 | 84,882.21 | 2.35 × 10⁸ |
| Hardness | Linear | Quadratic | Special Cubic | Cubic |
| Adjusted R2 | 0.4575 | 0.5454 | 0.4311 | n.d. |
| Predicted R2 | 0.0542 | −1.4961 | −4.3319 | n.d. |
| PRESS | 13,171.03 | 34,759.87 | 74,249.53 | n.d. |
| Drug load | Linear | Quadratic | Special Cubic | Cubic |
| Adjusted R2 | 0.5184 | 0.6846 | 0.6145 | 0.7212 |
| Predicted R2 | 0.2228 | −0.1716 | −0.8126 | −9,486.5367 |
| PRESS | 139.12 | 209.72 | 324.46 | 1.70 × 10⁶ |
| Formulation | Zero Order | First Order | Higuchi | Korsmeyer–Peppas | |||||
|---|---|---|---|---|---|---|---|---|---|
| k0 | R2 | k1 | R2 | kh | R2 | kkp | R2 | n | |
| F1 | 0.0707 | 0.9859 | 0.0021 | 0.9428 | 1.9807 | 0.9945 | 5.3769 | 0.9780 | 0.3588 |
| F2 | 0.0643 | 0.9881 | 0.0022 | 0.9348 | 1.7921 | 0.9861 | 3.9965 | 0.9777 | 0.3843 |
| F3 | 0.0614 | 0.9866 | 0.0021 | 0.9498 | 1.7126 | 0.9886 | 4.5005 | 0.9739 | 0.3619 |
| F4 | 0.0727 | 0.9642 | 0.0023 | 0.8935 | 2.0614 | 0.9982 | 4.1796 | 0.9977 | 0.4024 |
| F5 | 0.0997 | 0.9379 | 0.0025 | 0.8345 | 2.8606 | 0.9922 | 3.9337 | 0.9950 | 0.4609 |
| F6 | 0.0744 | 0.9427 | 0.0026 | 0.8285 | 2.1292 | 0.9940 | 2.3934 | 0.9932 | 0.4895 |
| F7 | 0.1445 | 0.9775 | 0.0027 | 0.8961 | 4.0722 | 0.9985 | 4.7498 | 0.9985 | 0.4767 |
| F8 | 0.0510 | 0.9285 | 0.0020 | 0.8493 | 1.4654 | 0.9871 | 4.0217 | 0.9962 | 0.3671 |
| F9 | 0.0856 | 0.9746 | 0.0023 | 0.9089 | 2.4164 | 0.9993 | 4.8273 | 0.9972 | 0.4027 |
| F10 | 0.0857 | 0.9591 | 0.0020 | 0.8963 | 2.4347 | 0.9957 | 7.4583 | 0.9968 | 0.3489 |
| F11 | 0.1082 | 0.9744 | 0.0023 | 0.9089 | 3.0557 | 0.9989 | 5.5710 | 0.9958 | 0.4147 |
| Test 1 | 0.1552 | 0.9758 | 0.0031 | 0.8732 | 4.3715 | 0.9959 | 3.0129 | 0.9980 | 0.5535 |
| Test 2 | 0.1045 | 0.9641 | 0.0031 | 0.8563 | 2.9500 | 0.9891 | 1.8925 | 0.9944 | 0.5656 |
| Test 3 | 0.0776 | 0.9685 | 0.0029 | 0.8875 | 2.1940 | 0.9959 | 1.9670 | 0.9969 | 0.5144 |
| F optimal | 0.1286 | 0.9892 | 0.0029 | 0.9516 | 3.5609 | 0.9749 | 3.5776 | 0.9544 | 0.4872 |
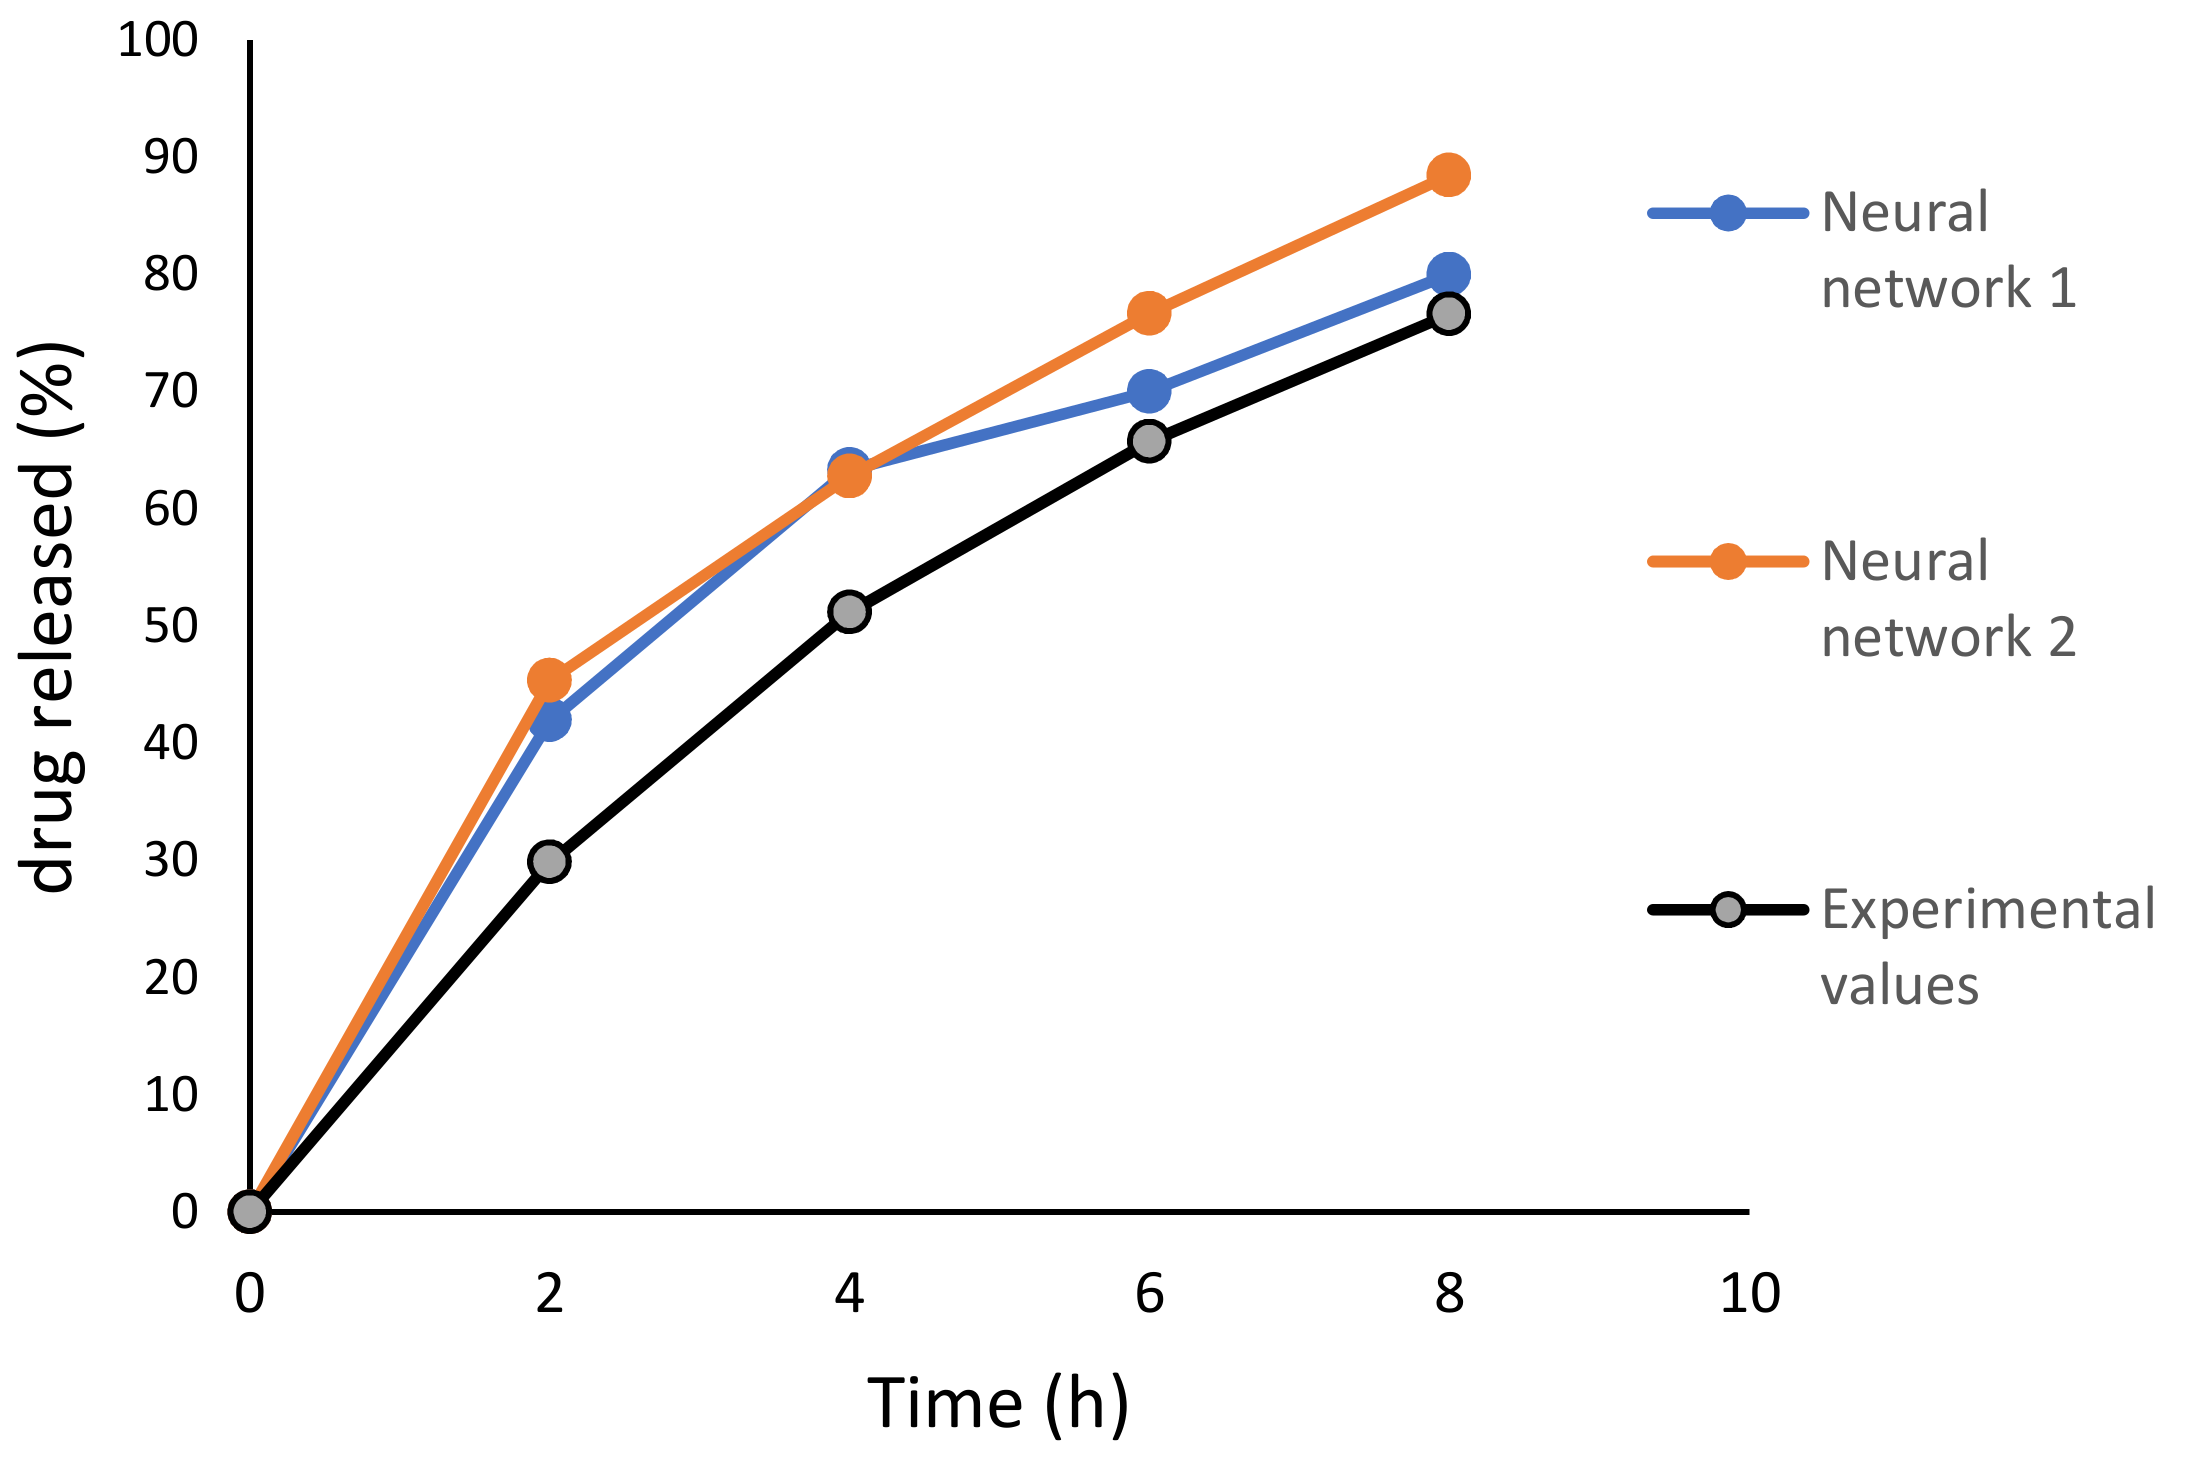
| Time (h) | Predicted Values (%) Neural Network 1 | Predicted Values (%) Neural Network 2 | Experimental Values (%) |
|---|---|---|---|
| 2 | 41.96 | 45.37 | 29.85 |
| 4 | 63.34 | 62.77 | 51.18 |
| 6 | 70.00 | 76.66 | 65.73 |
| 8 | 79.99 | 88.46 | 76.60 |
© 2019 by the authors. Licensee MDPI, Basel, Switzerland. This article is an open access article distributed under the terms and conditions of the Creative Commons Attribution (CC BY) license (http://creativecommons.org/licenses/by/4.0/).
Share and Cite
Madzarevic, M.; Medarevic, D.; Vulovic, A.; Sustersic, T.; Djuris, J.; Filipovic, N.; Ibric, S. Optimization and Prediction of Ibuprofen Release from 3D DLP Printlets Using Artificial Neural Networks. Pharmaceutics 2019, 11, 544. https://doi.org/10.3390/pharmaceutics11100544
Madzarevic M, Medarevic D, Vulovic A, Sustersic T, Djuris J, Filipovic N, Ibric S. Optimization and Prediction of Ibuprofen Release from 3D DLP Printlets Using Artificial Neural Networks. Pharmaceutics. 2019; 11(10):544. https://doi.org/10.3390/pharmaceutics11100544
Chicago/Turabian StyleMadzarevic, Marijana, Djordje Medarevic, Aleksandra Vulovic, Tijana Sustersic, Jelena Djuris, Nenad Filipovic, and Svetlana Ibric. 2019. "Optimization and Prediction of Ibuprofen Release from 3D DLP Printlets Using Artificial Neural Networks" Pharmaceutics 11, no. 10: 544. https://doi.org/10.3390/pharmaceutics11100544