Myth or Truth: The Glass Forming Ability Class III Drugs Will Always Form Single-Phase Homogenous Amorphous Solid Dispersion Formulations

 ,
,
Abstract
:1. Introduction
- (i)
- (ii)
- They should dissolve in the same solvent. DCM was considered the first choice of solvent in this study due to its high volatility.
2. Materials and Methods
2.1. Preparation of Amorphous Solid Dispersions (ASDs)
2.1.1. Film-Casting
2.1.2. Spray Drying
2.2. Characterization of Materials
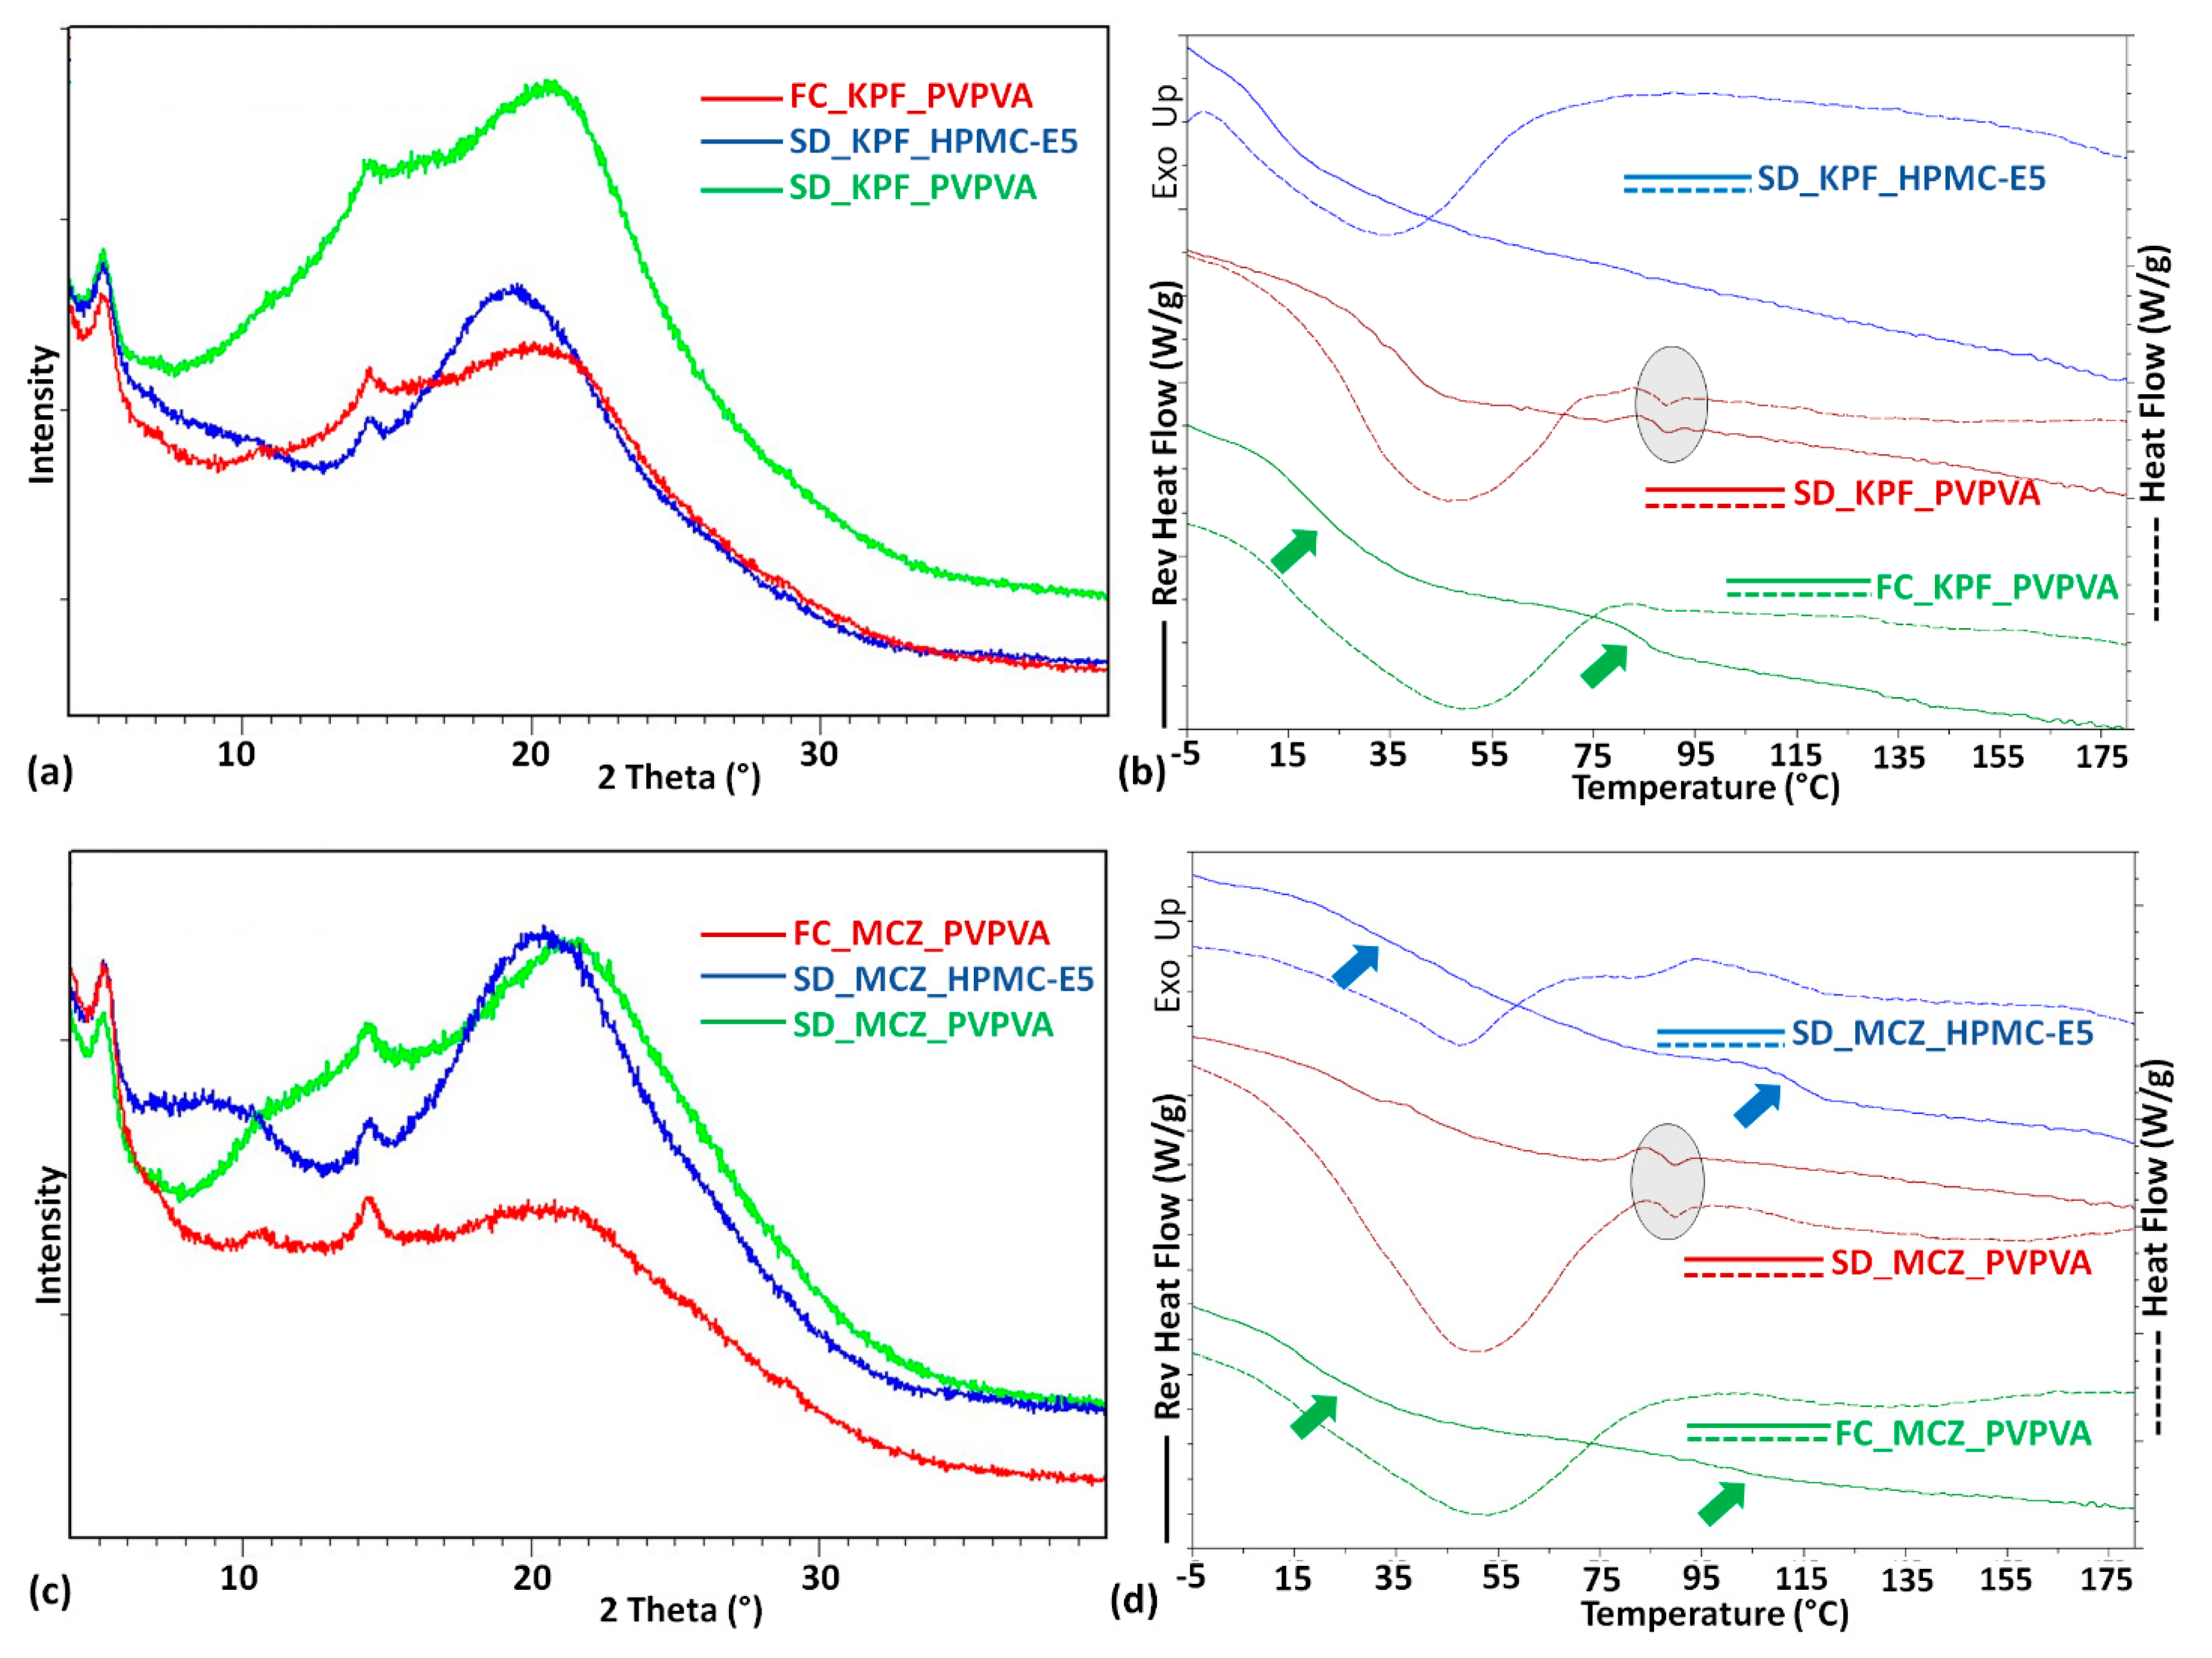
2.2.1. Powder X-Ray Diffraction (PXRD)
2.2.2. Modulated Differential Scanning Calorimetry (mDSC)
3. Result and Discussion
4. Conclusions
Author Contributions
Funding
Acknowledgments
Conflicts of Interest
List of Abbreviation
| API | Active pharmaceutical ingredients |
| ASD | Amorphous solid dispersions |
| DCM | Dichloromethane |
| °C | Degree Celsius |
| FC | Film-Casting |
| FTIR | Fourier-transform infrared spectroscopy |
| GFA | Glass forming ability |
| HPMC-E5 | Hydroxypropylmethylcellulose |
| mDSC | Modulated differential scanning calorimetry |
| PXRD | Powder X-Ray diffraction |
| PVPVA 64 | Poly(1-vinylpyrrolidone-co-vinyl acetate) |
| SD | Spray Drying |
| Tg | Glass transition temperature |
| ΔHf | Heat of Fusion |
| ΔGmix | Gibbs energy of mixing |
| ΔHmix | Enthalpy of mixing |
| ΔSmix | Entropy of mixing |
References
- Kalepu, S.; Nekkanti, V. Insoluble drug delivery strategies: Review of recent advances and business prospects. Acta Pharm. Sin. B 2015, 5, 442–453. [Google Scholar] [CrossRef] [PubMed]
- Graeser, K.A.; Patterson, J.E.; Zeitler, J.A.; Gordon, K.C.; Rades, T. Correlating thermodynamic and kinetic parameters with amorphous stability. Eur. J. Pharm. Sci. 2009, 37, 492–498. [Google Scholar] [CrossRef] [PubMed]
- Van den Mooter, G. The use of amorphous solid dispersions: A formulation strategy to overcome poor solubility and dissolution rate. Drug Discov. Today Technol. 2012, 9, e79–e85. [Google Scholar] [CrossRef] [PubMed]
- Vasconcelos, T.; Marques, S.; Das Neves, J.; Sarmento, B. Amorphous solid dispersions: Rational selection of a manufacturing process. Adv. Drug Deliv. Rev. 2016, 100, 85–101. [Google Scholar] [CrossRef] [PubMed]
- Anderson, B.D. Predicting Solubility/Miscibility in Amorphous Dispersions: It Is Time to Move Beyond Regular Solution Theories. J. Pharm. Sci. 2018, 107, 24–33. [Google Scholar] [CrossRef]
- He, Y.; Ho, C. Amorphous Solid Dispersions: Utilization and Challenges in Drug Discovery and Development. J. Pharm. Sci. 2015, 104, 3237–3258. [Google Scholar] [CrossRef] [PubMed]
- DeBoyace, K.; Wildfong, P.L.D. The Application of Modeling and Prediction to the Formation and Stability of Amorphous Solid Dispersions. J. Pharm. Sci. 2018, 107, 57–74. [Google Scholar] [CrossRef]
- Marsac, P.J.; Konno, H.; Taylor, L.S. A Comparison of the Physical Stability of Amorphous Felodipine and Nifedipine Systems. Pharm. Res. 2006, 23, 2306–2316. [Google Scholar] [CrossRef]
- Baird, J.A.; Van Eerdenburgh, B.; Taylor, L.S. A Classification System to Assess the Crystallization Tendency of Organic Molecules from Undercooled Melts. J. Pharm. Sci. 2010, 99, 3787–3806. [Google Scholar] [CrossRef]
- Blaabjerg, L.I.; Lindenberg, E.; Löbmann, K.; Grohganz, H.; Rades, T. Glass forming ability of amorphous drugs investigated by continuous cooling and isothermal transformation. Mol. Pharm. 2016, 13, 3318–3325. [Google Scholar] [CrossRef]
- Van Eerdenbrugh, B.; Baird, J.A.; Taylor, L.S. Crystallization Tendency of Active Pharmaceutical Ingredients Following Rapid Solvent Evaporation —Classification and Comparison with Crystallization Tendency from Undercooled Melts. J. Pharm. Sci. 2010, 99, 3826–3838. [Google Scholar] [CrossRef] [PubMed]
- Mahlin, D.; Ponnambalam, S.; Heidarian Höckerfelt, M.; Bergström, C.A.S. Toward in silico prediction of glass-forming ability from molecular structure alone: A screening tool in early drug development. Mol. Pharm. 2011, 8, 498–506. [Google Scholar] [CrossRef] [PubMed]
- Mahlin, D.; Bergström, C.A.S. Early drug development predictions of glass-forming ability and physical stability of drugs. Eur. J. Pharm. Sci. 2013, 49, 323–332. [Google Scholar] [CrossRef] [PubMed]
- Blaabjerg, L.I.; Bulduk, B.; Lindenberg, E.; Löbmann, K.; Rades, T.; Grohganz, H. Influence of glass forming ability on the physical stability of supersaturated amorphous solid dispersions. J. Pharm. Sci. 2019, 108, 2561–2569. [Google Scholar] [CrossRef] [PubMed]
- Singh, A.; Van den Mooter, G. Spray drying formulation of amorphous solid dispersions. Adv. Drug Deliv. Rev. 2016, 100, 27–50. [Google Scholar] [CrossRef] [PubMed]
- Paudel, A.; Worku, Z.A.; Meeus, J.; Guns, S.; Van Den Mooter, G. Manufacturing of solid dispersions of poorly water soluble drugs by spray drying: Formulation and process considerations. Int. J. Pharm. 2013, 453, 253–284. [Google Scholar] [CrossRef] [PubMed]
- Davis, M.; Walker, G. Recent strategies in spray drying for the enhanced bioavailability of poorly water-soluble drugs. J. Control. Release 2018, 269, 110–127. [Google Scholar] [CrossRef] [Green Version]
- Baird, J.A.; Taylor, L.S. Evaluation of amorphous solid dispersion properties using thermal analysis techniques. Adv. Drug Deliv. Rev. 2012, 64, 396–421. [Google Scholar] [CrossRef]
- Baghel, S.; Cathcart, H.; O’Reilly, N.J. Theoretical and experimental investigation of drug-polymer interaction and miscibility and its impact on drug supersaturation in aqueous medium. Eur. J. Pharm. Biopharm. 2016, 107, 16–31. [Google Scholar] [CrossRef]
- Newman, A.; Munson, E. Characterizing Miscibility in Amorphous Solid Dispersions. Am. Pharm. Rev. 2012, 15, 92–98. [Google Scholar]
- Alhalaweh, A.; Alzghoul, A.; Mahlin, D.; Bergström, C.A.S. Physical stability of drugs after storage above and below the glass transition temperature: Relationship to glass-forming ability. Int. J. Pharm. 2015, 495, 312–317. [Google Scholar] [CrossRef] [PubMed]
- Skrdla, P.J.; Floyd, P.D.; Dell’orco, P.C. The amorphous state: First-principles derivation of the Gordon-Taylor equation for direct prediction of the glass transition temperature of mixtures; estimation of the crossover temperature of fragile glass formers; physical basis of the “Rule of 2/3”. Phys. Chem. Chem. Phys. 2017, 19, 20523–20532. [Google Scholar] [CrossRef] [PubMed]
- Gordon, M.; Taylor, J.S. Ideal copolymers and the 2nd-order transitions of synthetic rubbers 1. Non-crystalline copolymers. J. Appl. Chem. 1952, 2, 493–500. [Google Scholar] [CrossRef]
- Painter, P.C.; Graf, J.F.; Coleman, M.M. Effect of hydrogen-bonding on the enthalpy of mixing and the composition dependence of the glass-transition temperature in polymer blends. Macromolecules 1991, 24, 5630–5638. [Google Scholar] [CrossRef]
- Gashi, Z.; Censi, R.; Malaj, L.; Gobetto, R.; Mozzicafreddo, M.; Angeletti, M.; Masic, A.; Di Martino, P. Differences in the interaction between aryl propionic acid de-rivatives and poly(vinylpyrrolidone) K30: A multi-methodological approach. J. Pharm. Sci. 2009, 98, 4216–4228. [Google Scholar] [CrossRef] [PubMed]
- Haser, A.; Cao, T.; Lubach, J.; Listro, T.; Acquarulo, L.; Zhang, F. Melt extrusion vs. spray drying: The effect of processing methods on crystalline content of naproxen-povidone formulations. Eur. J. Pharm. Sci. 2017, 102, 115–125. [Google Scholar] [CrossRef] [PubMed]
- Dedroog, S.; Huygens, C.; Van den Mooter, G. Chemically identical but physically different: A comparison of spray drying, hot melt extrusion and cryo-milling for the formulation of high drug loaded amorphous solid dispersions of naproxen. Eur. J. Pharm. Biopharm. 2019, 135, 1–12. [Google Scholar] [CrossRef]
- Janssens, S.; Van Den Mooter, G. Review: Physical chemistry of solid dispersions. J. Pharm. Pharmacol. 2009, 61, 1571–1586. [Google Scholar] [CrossRef]
- Yani, Y.; Kanaujia, P.; Chow, P.S.; Tan, R.B.H. Effect of API-Polymer Miscibility and Interaction on the Stabilization of Amorphous Solid Dispersion: A Molecular Simulation Study. Ind. Eng. Chem. Res. 2017, 56, 12698–12707. [Google Scholar] [CrossRef]
- Gupta, P.; Thilagavathi, R.; Chakraborti, A.K.; Bansal, A.K. Role of Molecular Interaction in Stability of Celecoxib-PVP Amorphous Systems. Mol. Pharm. 2005, 2, 384–391. [Google Scholar] [CrossRef]
- Clayden, J.; Greeves, N.; Warren, S. Organic Chemistry; Oxford University Press: Oxford, UK, 2012; ISBN 978-0199270293. [Google Scholar]
- Desiraju, G.; Steiner, T. The Weak Hydrogen Bond: In Structural Chemistry and Biology; Oxford University Press: Oxford, UK, 2001; ISBN 9780198509707. [Google Scholar]
- Steiner, T. Weak Hydrogen Bonds. In Implications of Molecular and Materials Structure for New Technologies; NATO Science Series (Series E: Applied Sciences); Howard, J.A.K., Allen, F.H., Shields, G.P., Eds.; Springer: Dordrecht, The Netherlands, 1999; Volume 360, p. 185. ISBN 978-0-7923-5817-6. [Google Scholar]
- Kumara Swamy, K.C.; Kumaraswamy, S.; Kommana, P. Very Strong C-H⋯O, N-H⋯O, and O-H⋯O Hydrogen Bonds Involving a Cyclic Phosphate. J. Am. Chem. Soc. 2001, 123, 12642–12649. [Google Scholar] [CrossRef] [PubMed]
- Taylor, L.S.; Zografi, G. Spectroscopic characterization of interactions between PVP and indomethacin in amorphous molecular dispersions. J. Pharm. Sci. 1997, 14, 1691–1698. [Google Scholar]
- Yuan, X.; Xiang, T.-X.; Anderson, B.D.; Munson, E.J. Hydrogen bonding interactions in amorphousindomethacin and its amorphous solid dispersions with poly(vinylpyrrolidone) and poly(vinylpyrrolidone-co-vinyl acetate) studied using 13C solid-state NMR. Mol. Pharm. 2015, 12, 4518–4528. [Google Scholar] [CrossRef] [PubMed]
- Xiang, T.-X.; Anderson, B.D. Molecular dynamics simulation of amorphous hydroxypropylmethylcellulose and its mixtures with felodipine and water. J. Pharm. Sci. 2017, 106, 803–816. [Google Scholar] [CrossRef] [PubMed]
- Marsac, P.; Li, T.; Taylor, L.S. Estimation of drug–polymer miscibility and solubility in amorphous solid dispersions using experimentally determined interaction parameters. Pharm. Res. 2009, 26, 139–151. [Google Scholar] [CrossRef] [PubMed]
- Van den Mooter, G.; Wuyts, M.; Blaton, N.; Busson, R.; Grobet, P.; Augustijns, P.; Kinget, R. Physical stabilisation of amorphous ketoconazole in solid dispersions with polyvinylpyrrolidone K25. Eur. J. Pharm. Sci. 2001, 12, 261–269. [Google Scholar] [CrossRef]
- Hua, Y.; Flood, A.H. Click chemistry generates privileged CH hydrogen-bonding triazoles: The latest addition to anion supramolecular chemistry. Chem. Soc. Rev. 2010, 39, 1262–1271. [Google Scholar] [CrossRef]
- Bandyopadhyay, I.; Raghavachari, K.; Flood, A.H. Strong CH⋯Halide hydrogen bonds from 1,2,3-triazoles quantified using pre-organized and shape-persistent triazolophanes. ChemPhysChem 2009, 10, 2535–2540. [Google Scholar] [CrossRef]
- Mugheirbi, N.A.; Marsac, P.J.; Taylor, L.S. Insights into Water-Induced Phase Separation in Itraconazole—Hydroxypropylmethyl Cellulose Spin Coated and Spray Dried Dispersions. Mol. Pharm. 2017, 14, 4387–4402. [Google Scholar] [CrossRef]
- Frizon, F.; Eloy, J.d.O.; Donaduzzi, C.M.; Mitsui, M.L.; Marchetti, J.M. Dissolution rate enhancement of loratadine in polyvinylpyrrolidone K-30 solid dispersions by solvent methods. Powder Technol. 2013, 235, 532–539. [Google Scholar] [CrossRef]
- Saboo, S.; Taylor, L.S. Water-induced phase separation of miconazole-poly (vinylpyrrolidone-co-vinyl acetate) amorphous solid dispersions: Insights with confocal fluorescence microscopy. Int. J. Pharm. 2017, 529, 654–666. [Google Scholar] [CrossRef] [PubMed]
- Chan, S.-Y.; Chung, Y.-Y.; Cheah, X.-Z.; Yen-Ling Tan, E.; Quah, J. The characterization and dissolution performances of spray dried solid dispersion of ketoprofen in hydrophilic carriers. Asian J. Pharm. Sci. 2015, 10, 372–385. [Google Scholar] [CrossRef] [Green Version]
- Rumondor, A.C.F.; Ivanisevic, I.; Bates, S.; Alonzo, D.E.; Taylor, L.S. Evaluation of Drug-Polymer Miscibility in Amorphous Solid Dispersion Systems. Pharm. Res. 2009, 26, 2523–2534. [Google Scholar] [CrossRef] [PubMed]
- Knopp, M.M.; Tajber, L.; Tian, Y.; Olesen, N.E.; Jones, D.S.; Kozyra, A.; Löbmann, K.; Paluch, K.; Brennan, C.M.; Holm, R.; et al. Comparative Study of Different Methods for the Prediction of Drug–Polymer Solubility. Mol. Pharm. 2015, 12, 3408–3419. [Google Scholar] [CrossRef]
- Medarević, D.; Djuriš, J.; Barmpalexis, P.; Kachrimanis, K.; Ibrić, S. Analytical and Computational Methods for the Estimation of Drug-Polymer Solubility and Miscibility in Solid Dispersions Development. Pharmaceutics 2019, 11, 372. [Google Scholar] [CrossRef]


| Serial No. | API a | Molecular Weight (g/mole) | GFA CLASS | Melting Point (°C) | Heat of Fusion (ΔHf, J/g) | Glass Transition Temperature (°C) [9] | |
|---|---|---|---|---|---|---|---|
| Based on Crystallization from Melt [9,10] | Based on Rapid Solvent Evaporation (Using Spin Coating) [11] | ||||||
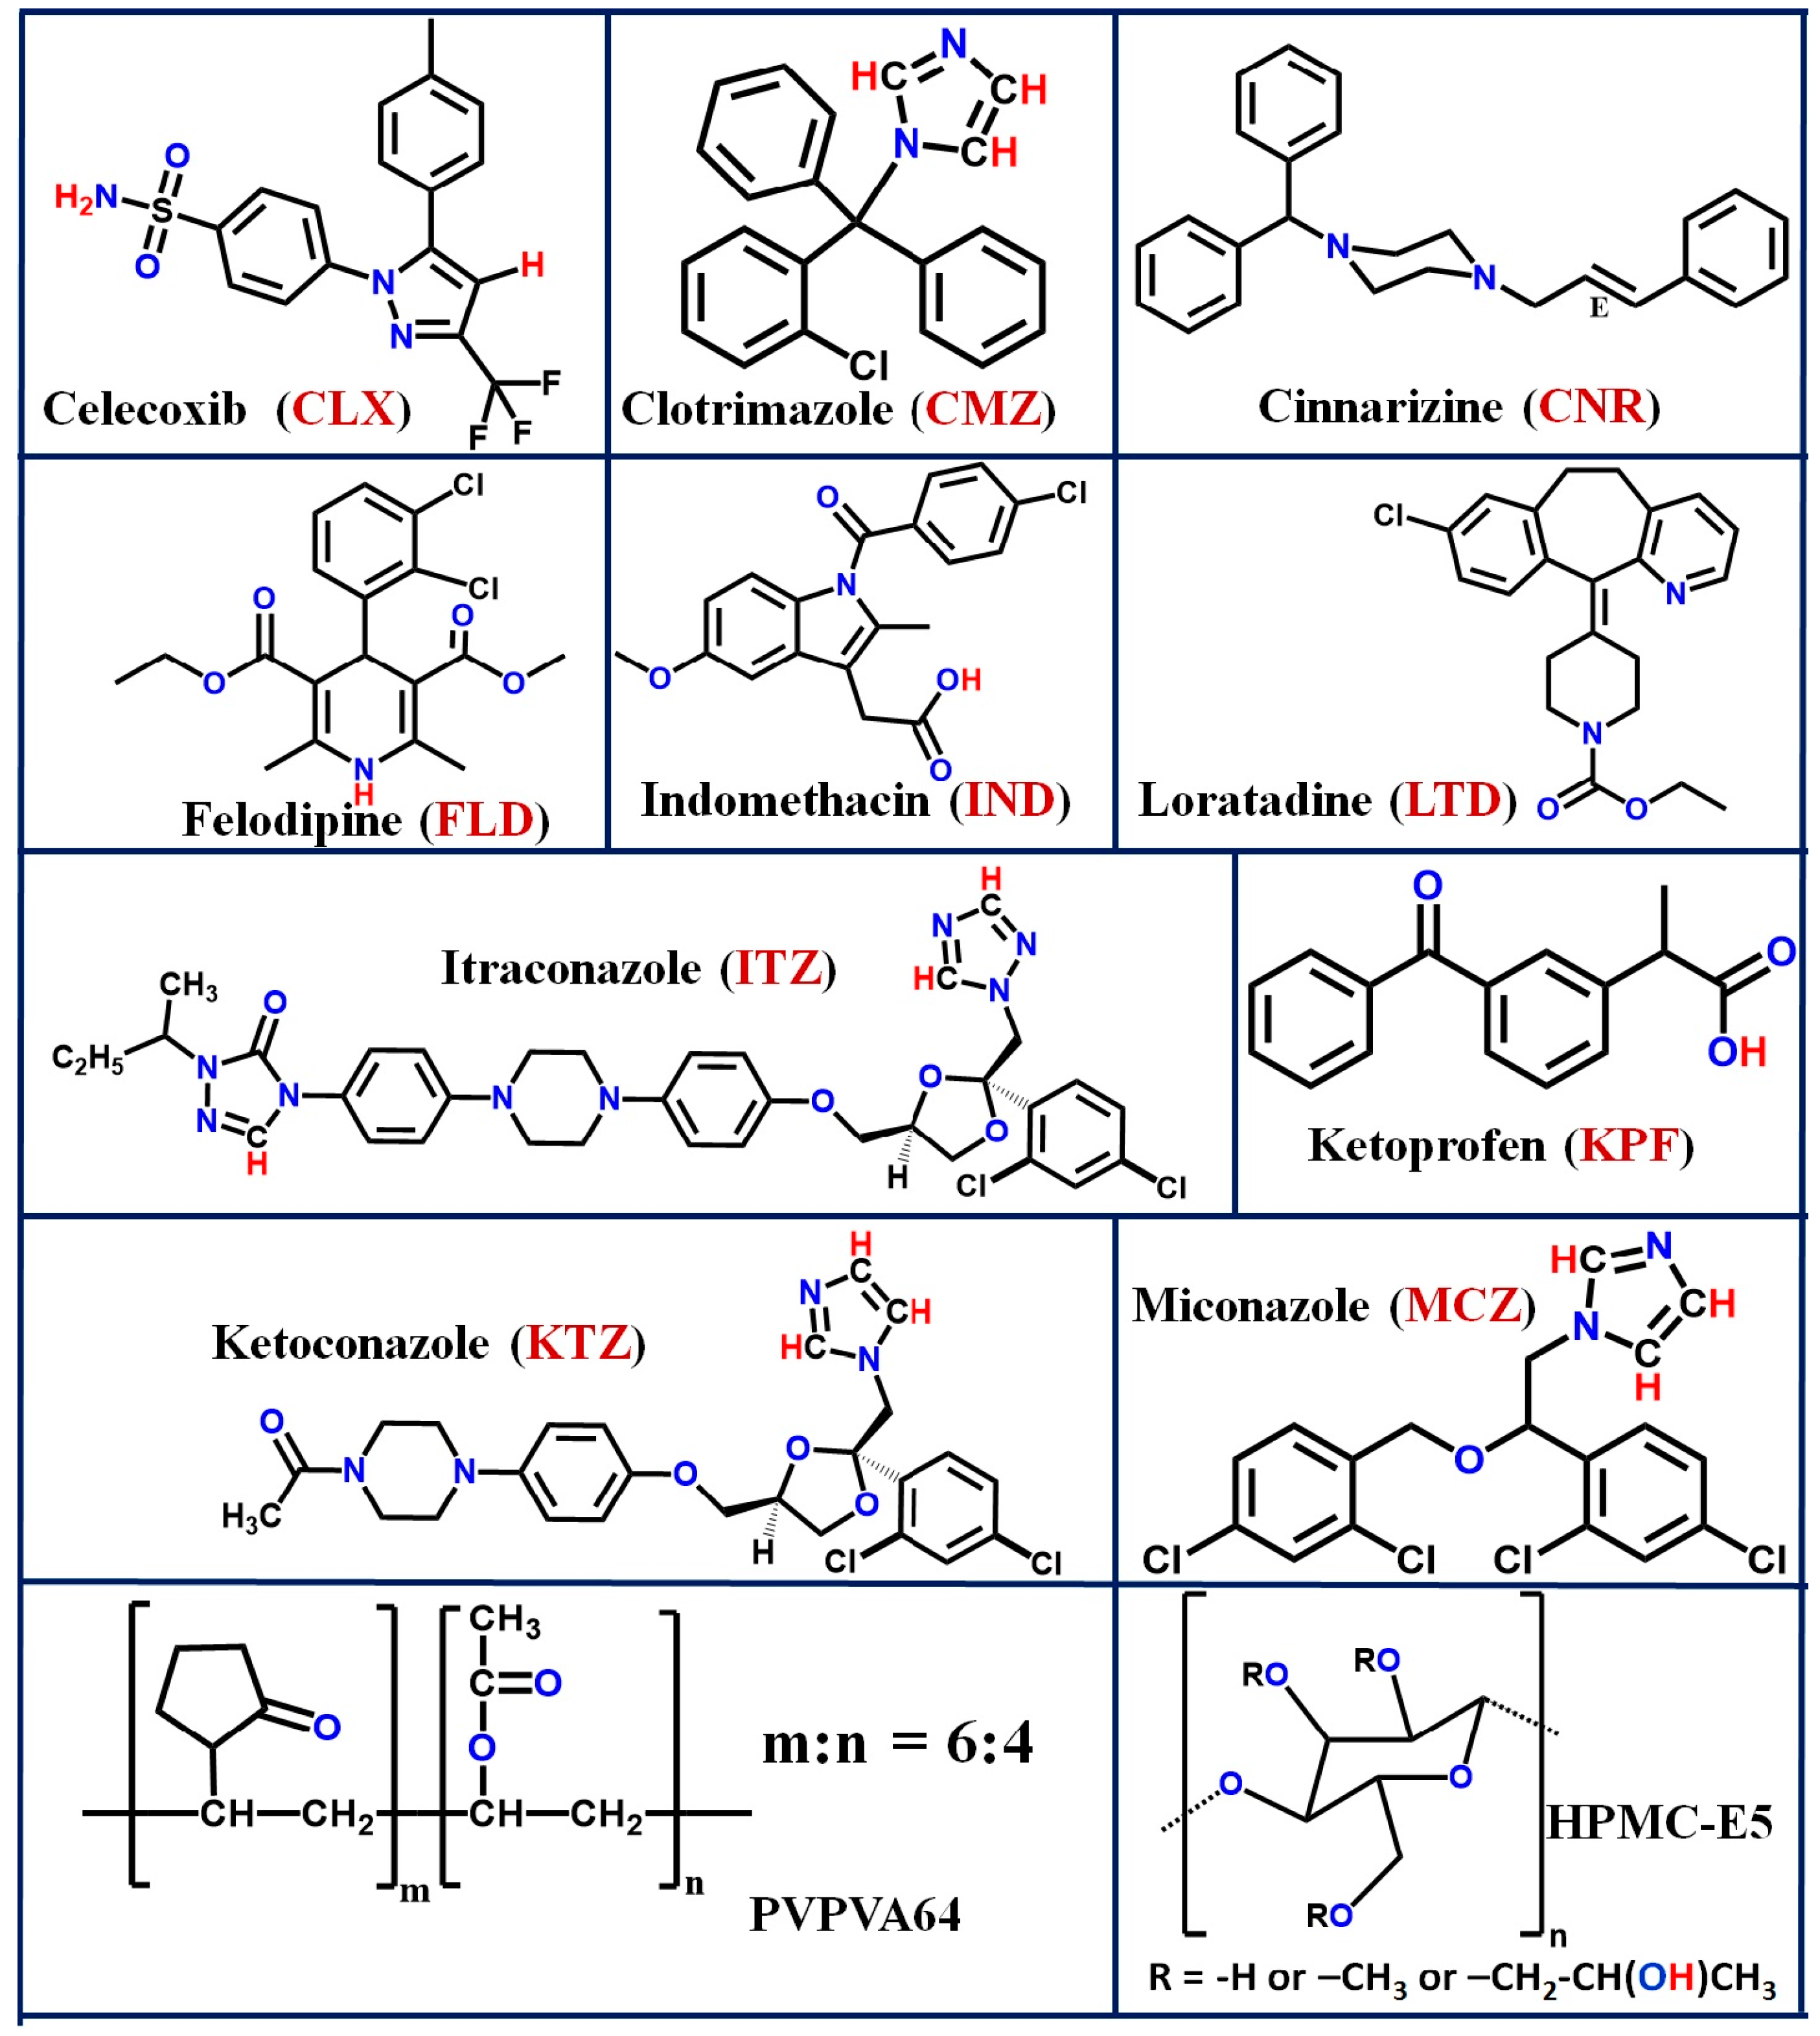
| 1 | Celecoxib (CLX) | 381.37 | Class II | Class III | 160.5 | 93.5 | 58 |
| 2 | Clotrimazole (CMZ) | 344.84 | Class III | Class III | 141.5 | 88.5 | 30 |
| 3 | Cinnarizine b (CNR) | 368.51 | Class III | Class II or III | 119 | 110 | 7 |
| 4 | Felodipine b (FLD) | 384.26 | Class III | Class III | 142 | 72 | 45 |
| 5 | Indomethacin b (IND) | 357.79 | Class III | Class III | 159 | 110 | 45 |
| 6 | Itraconazole b (ITZ) | 705.64 | Class III | Class III | 166 | 84.5 | 58 |
| 7 | Ketoconazole b (KTZ) | 531.43 | Class III | Class III | 147 | 99 | 45 |
| 8 | Ketoprofen b (KPF) | 254.28 | Class III | Class III | 94 | 111.5 | −3 |
| 9 | Loratadine (LTD) | 382.88 | Class III | Class II or III | 134 | 71.5 | 37 |
| 10 | Miconazole (MCZ) | 416.13 | Class III | Class III | 84 | 81.5 | 1 |
| ASD Sample a | DSC Measurement | PXRD Pattern Signature | ||
|---|---|---|---|---|
| Observed Glass-Transition Temperature, Tg (°C) b | Calculated Glass-Transition Temperature, Tg (°C) c (Using Gordon Taylor Equation [22,23]) | Melting Point (°C); Heat of Fusion, ΔHf (J/g); % Crystallinity | ||
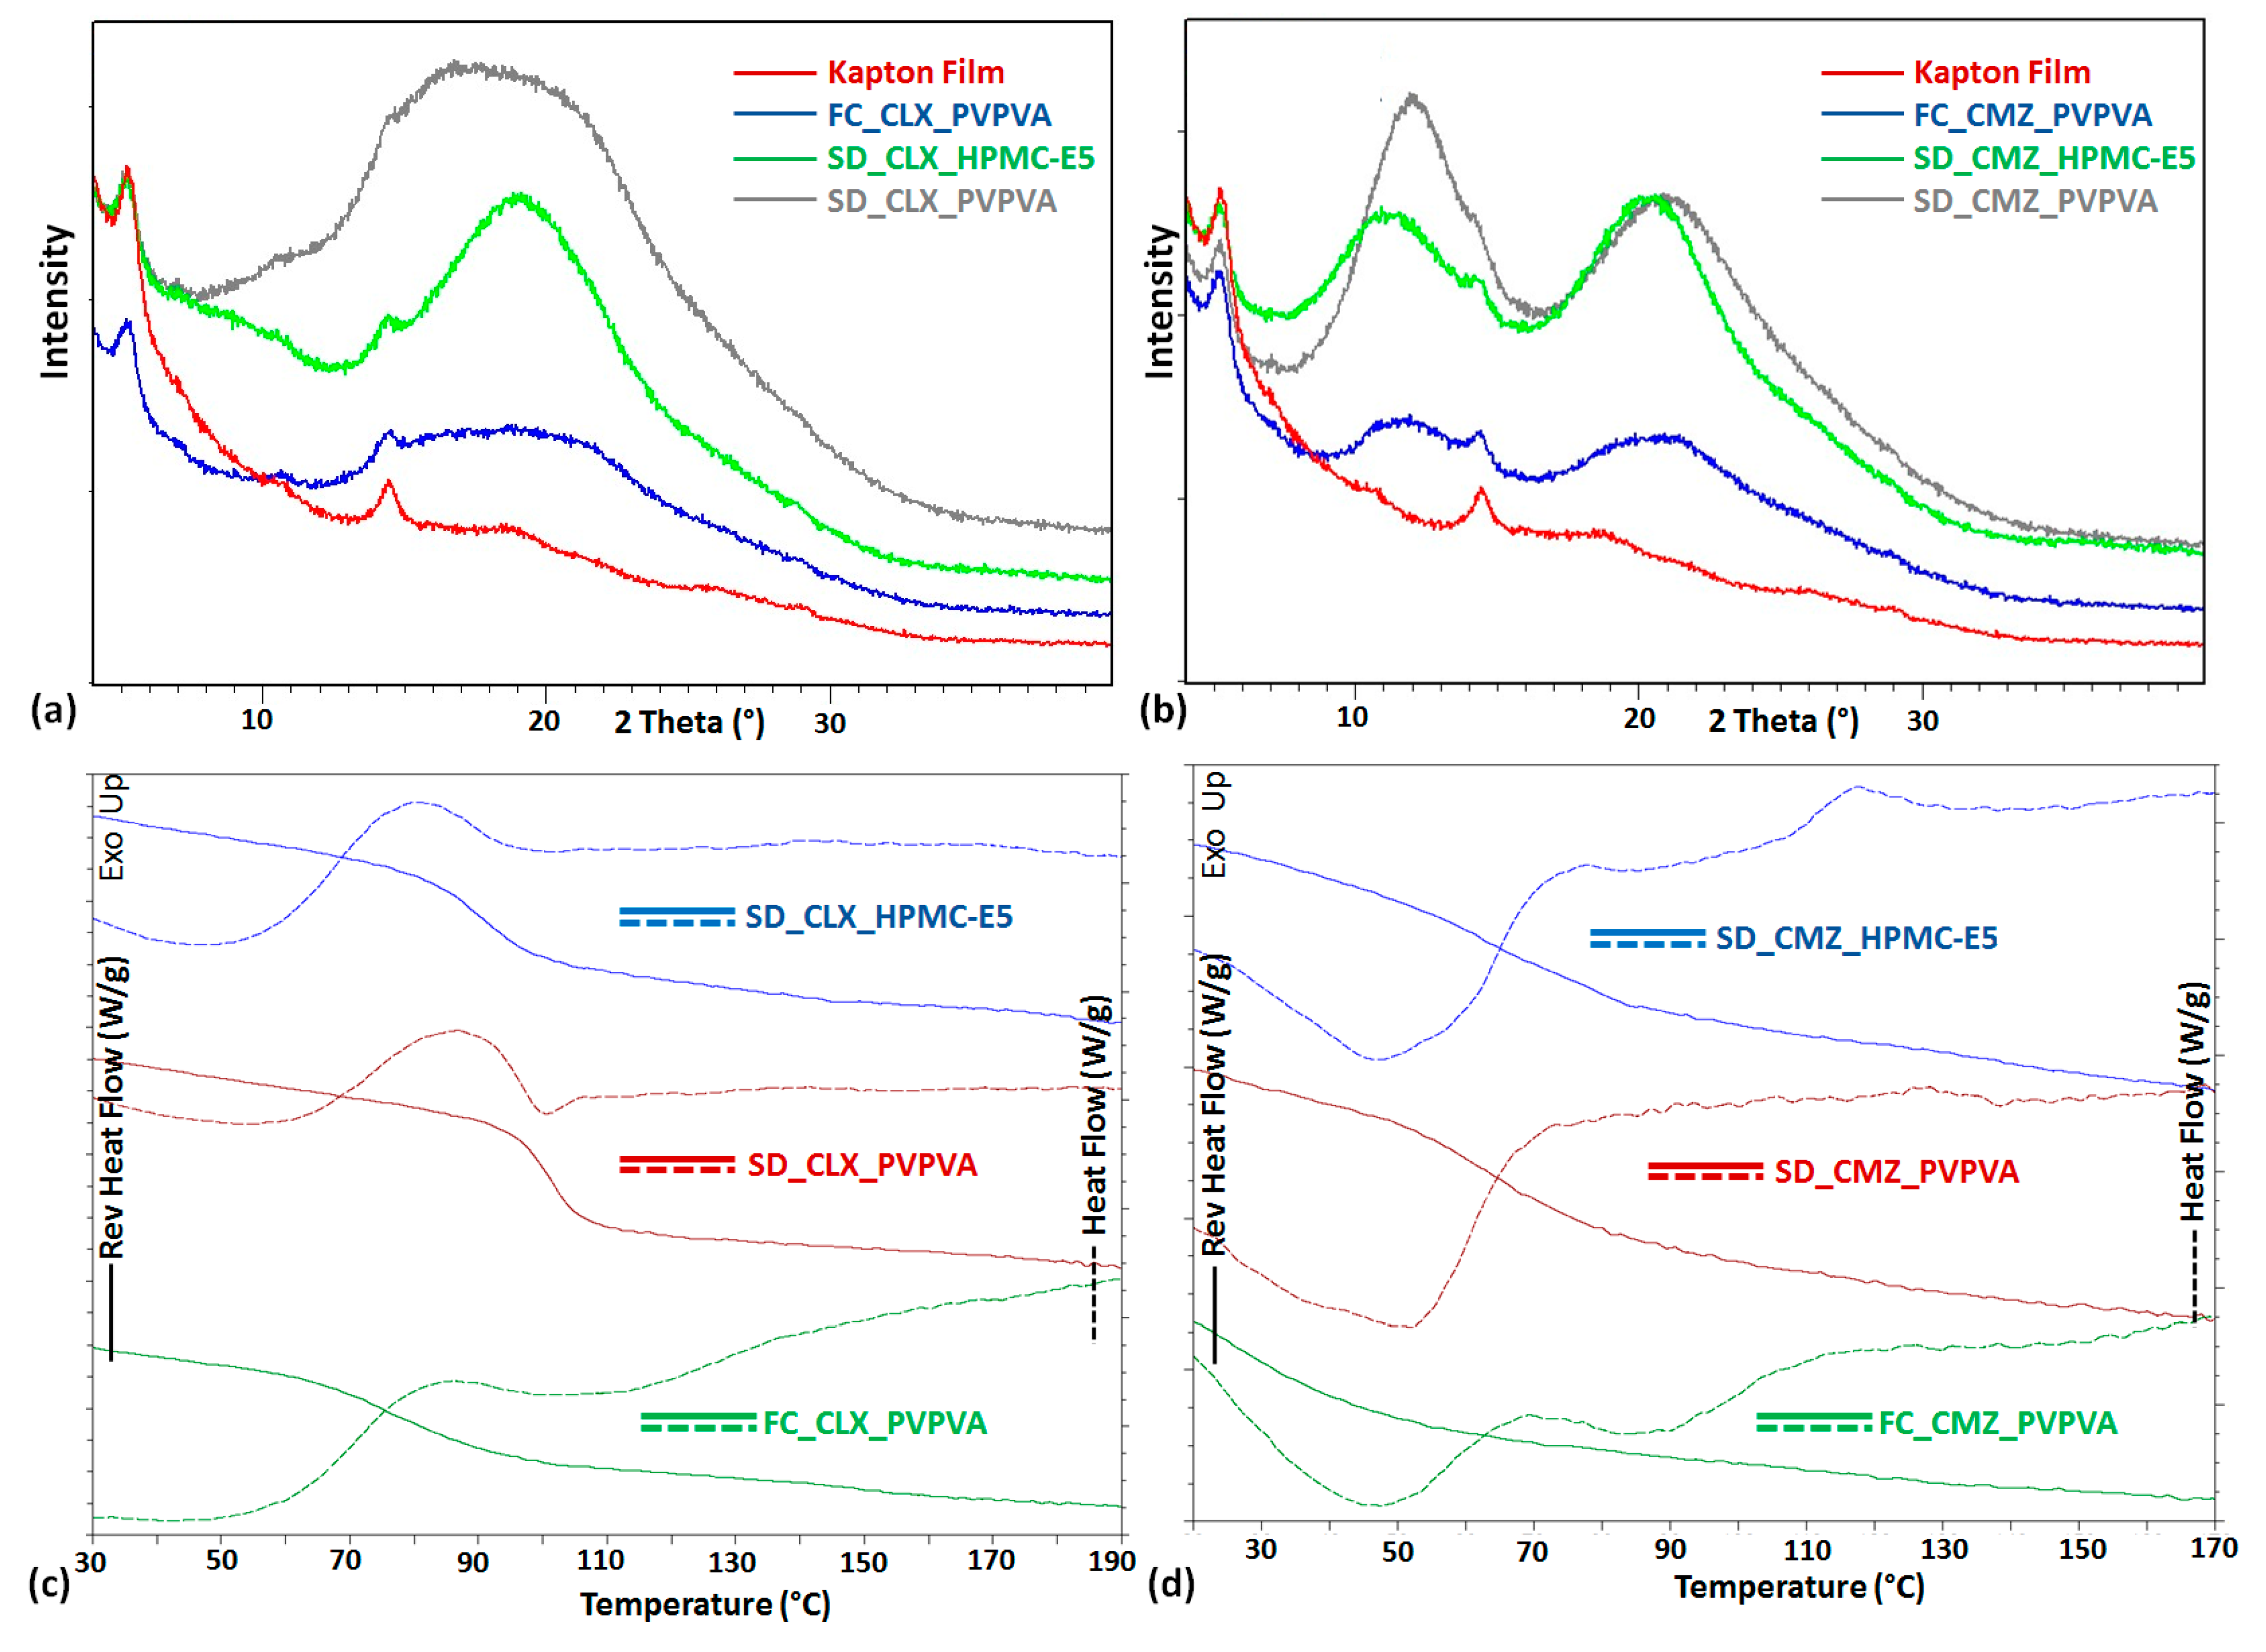
| FC_CLX_PVPVA | 75 | 89 | ----- | Amorphous solid |
| SD_CLX_PVPVA | 100 | 89 | ----- | Amorphous solid |
| SD_CLX_HPMC-E5 | 90 | 114 | ----- | Amorphous solid |
| FC_CMZ_PVPVA | 31 | 73 | ----- | Amorphous solid |
| SD_CMZ_PVPVA | 63 | 73 | ----- | Amorphous solid |
| SD_CMZ_HPMC-E5 | 74 | 94 | ----- | Amorphous solid |
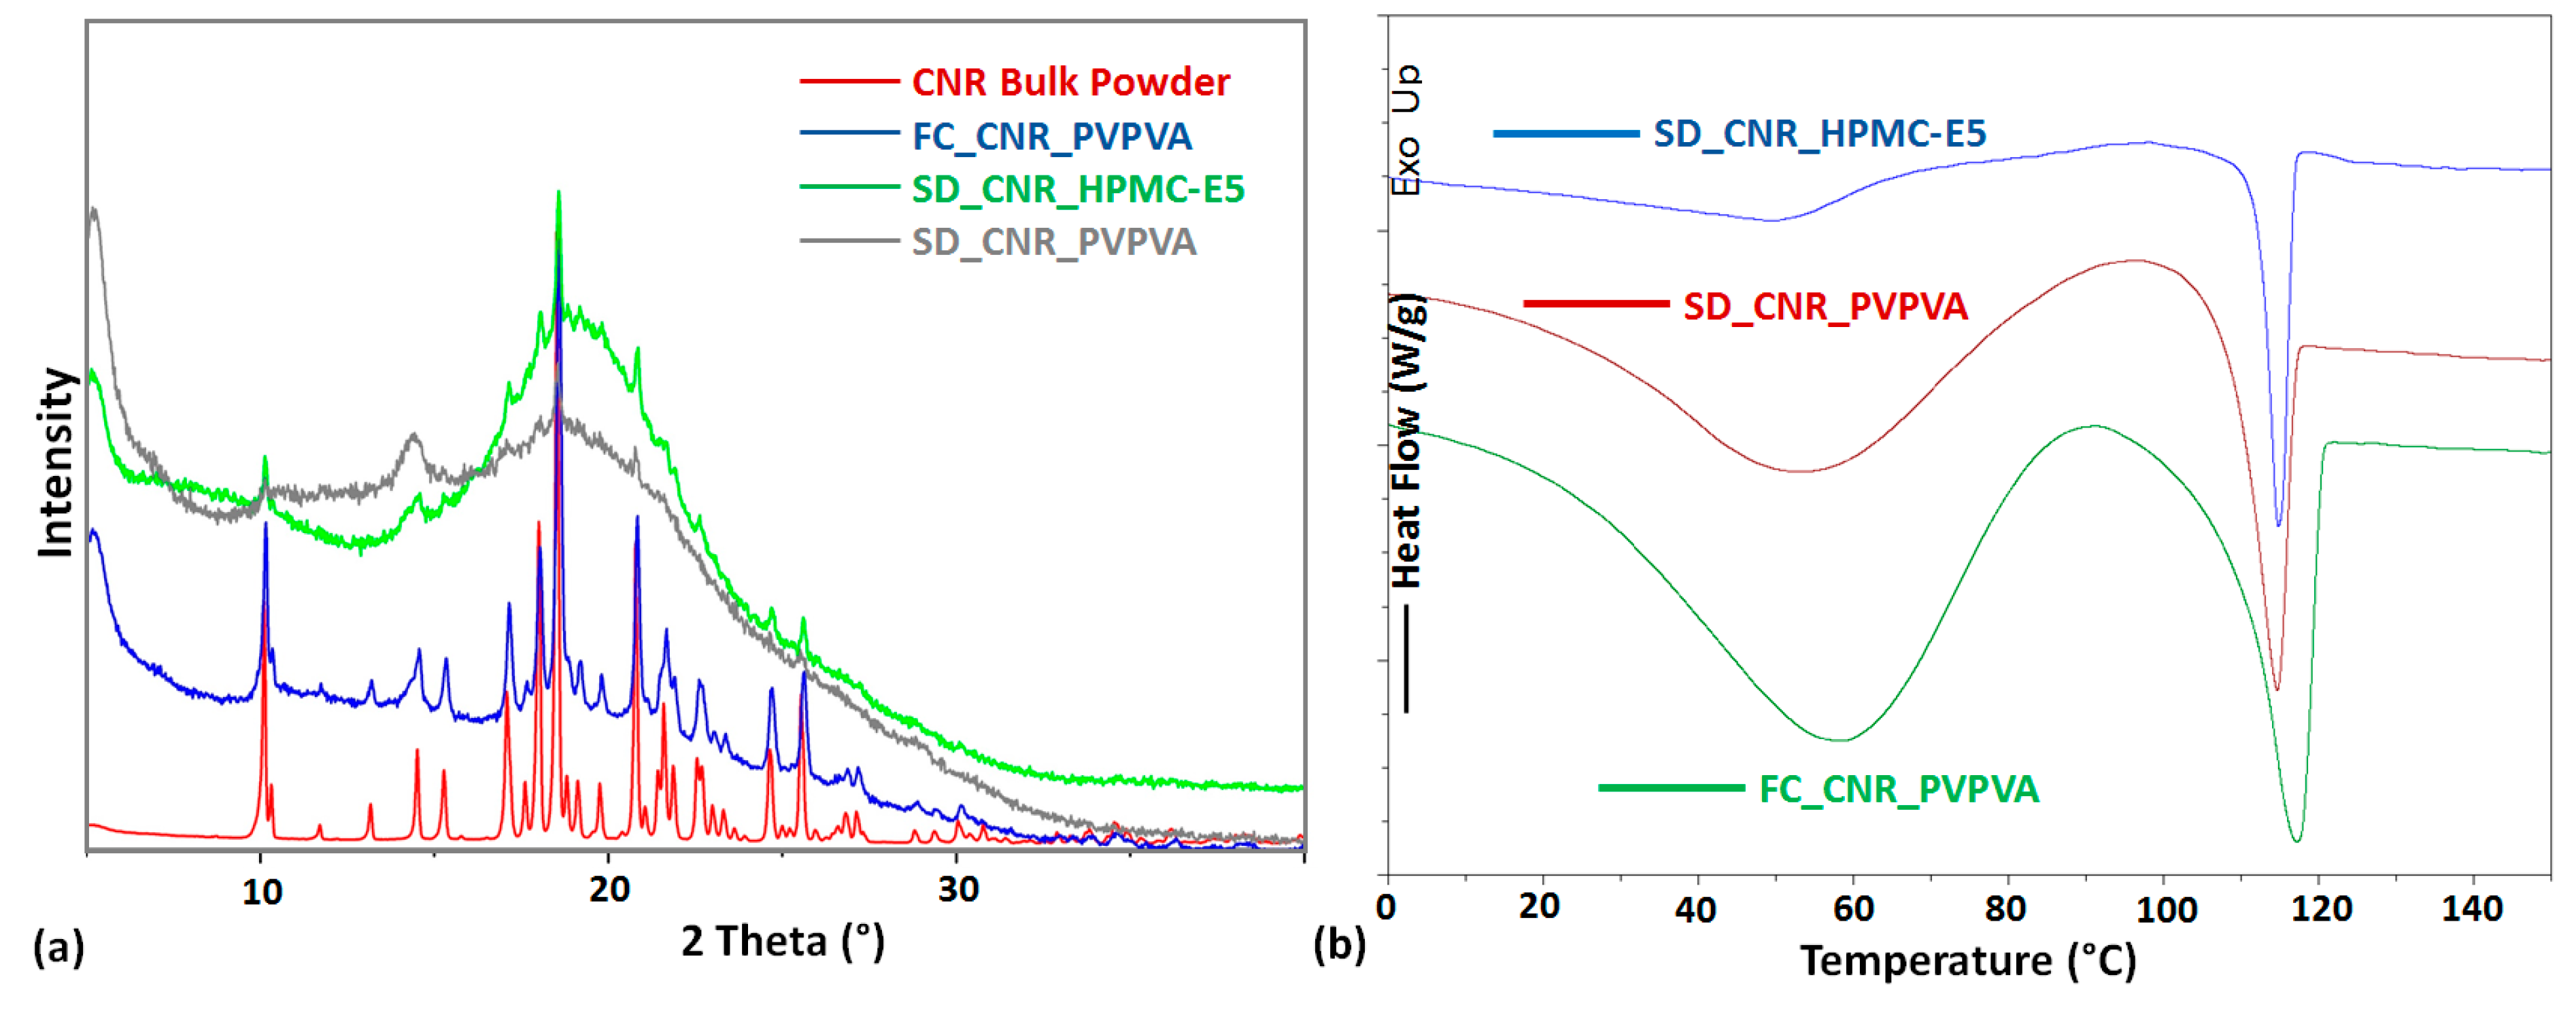
| FC_CNR_PVPVA | 28 | 57 | 109.15; 29.56 67% | very high crystalline content |
| SD_CNR_PVPVA | 44 | 57 | 109.15; 13.86 32% | Crystalline content |
| SD_CNR_HPMC-E5 | 51 | 81 | 112.31; 11.23 26% | Crystalline content |
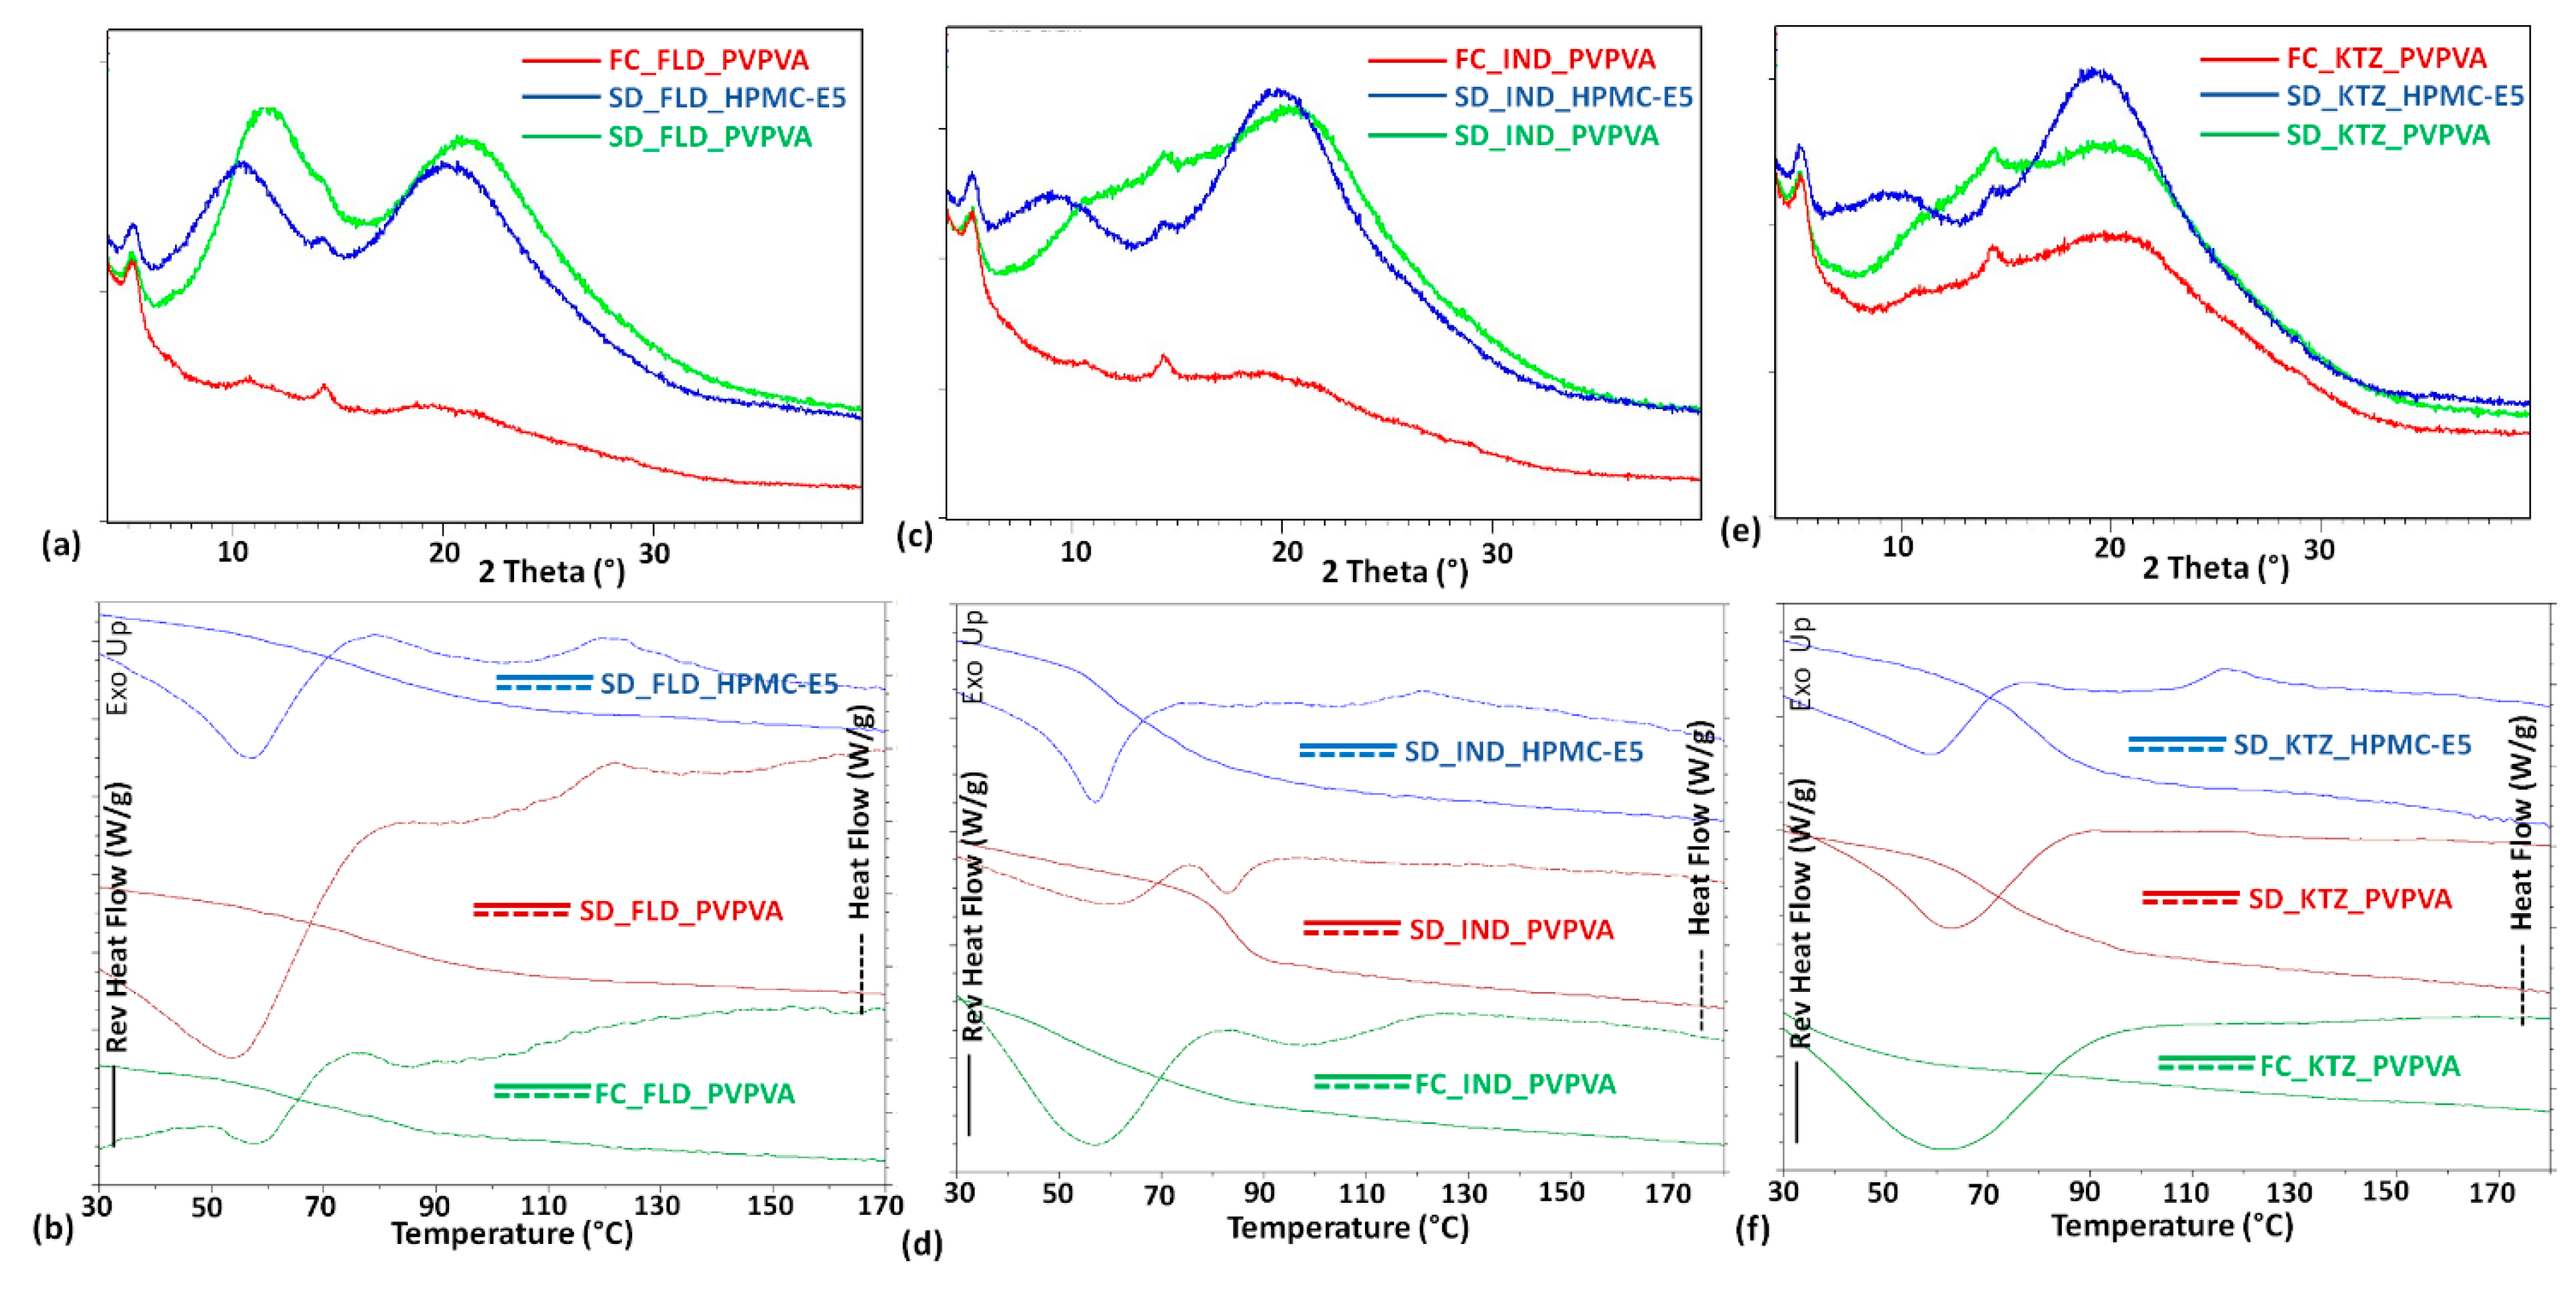
| FC_FLD_PVPVA | 63 | 82 | ----- | Amorphous solid |
| SD_FLD_PVPVA | 76 | 82 | ----- | Amorphous solid |
| SD_FLD_HPMC-E5 | 78 | 106 | ----- | Amorphous solid |
| FC_IND_PVPVA | 52 | 81 | ----- | Amorphous solid |
| SD_IND_PVPVA | 83 | 81 | ----- | Amorphous solid |
| SD_IND_HPMC-E5 | 59 | 105 | ----- | Amorphous solid |
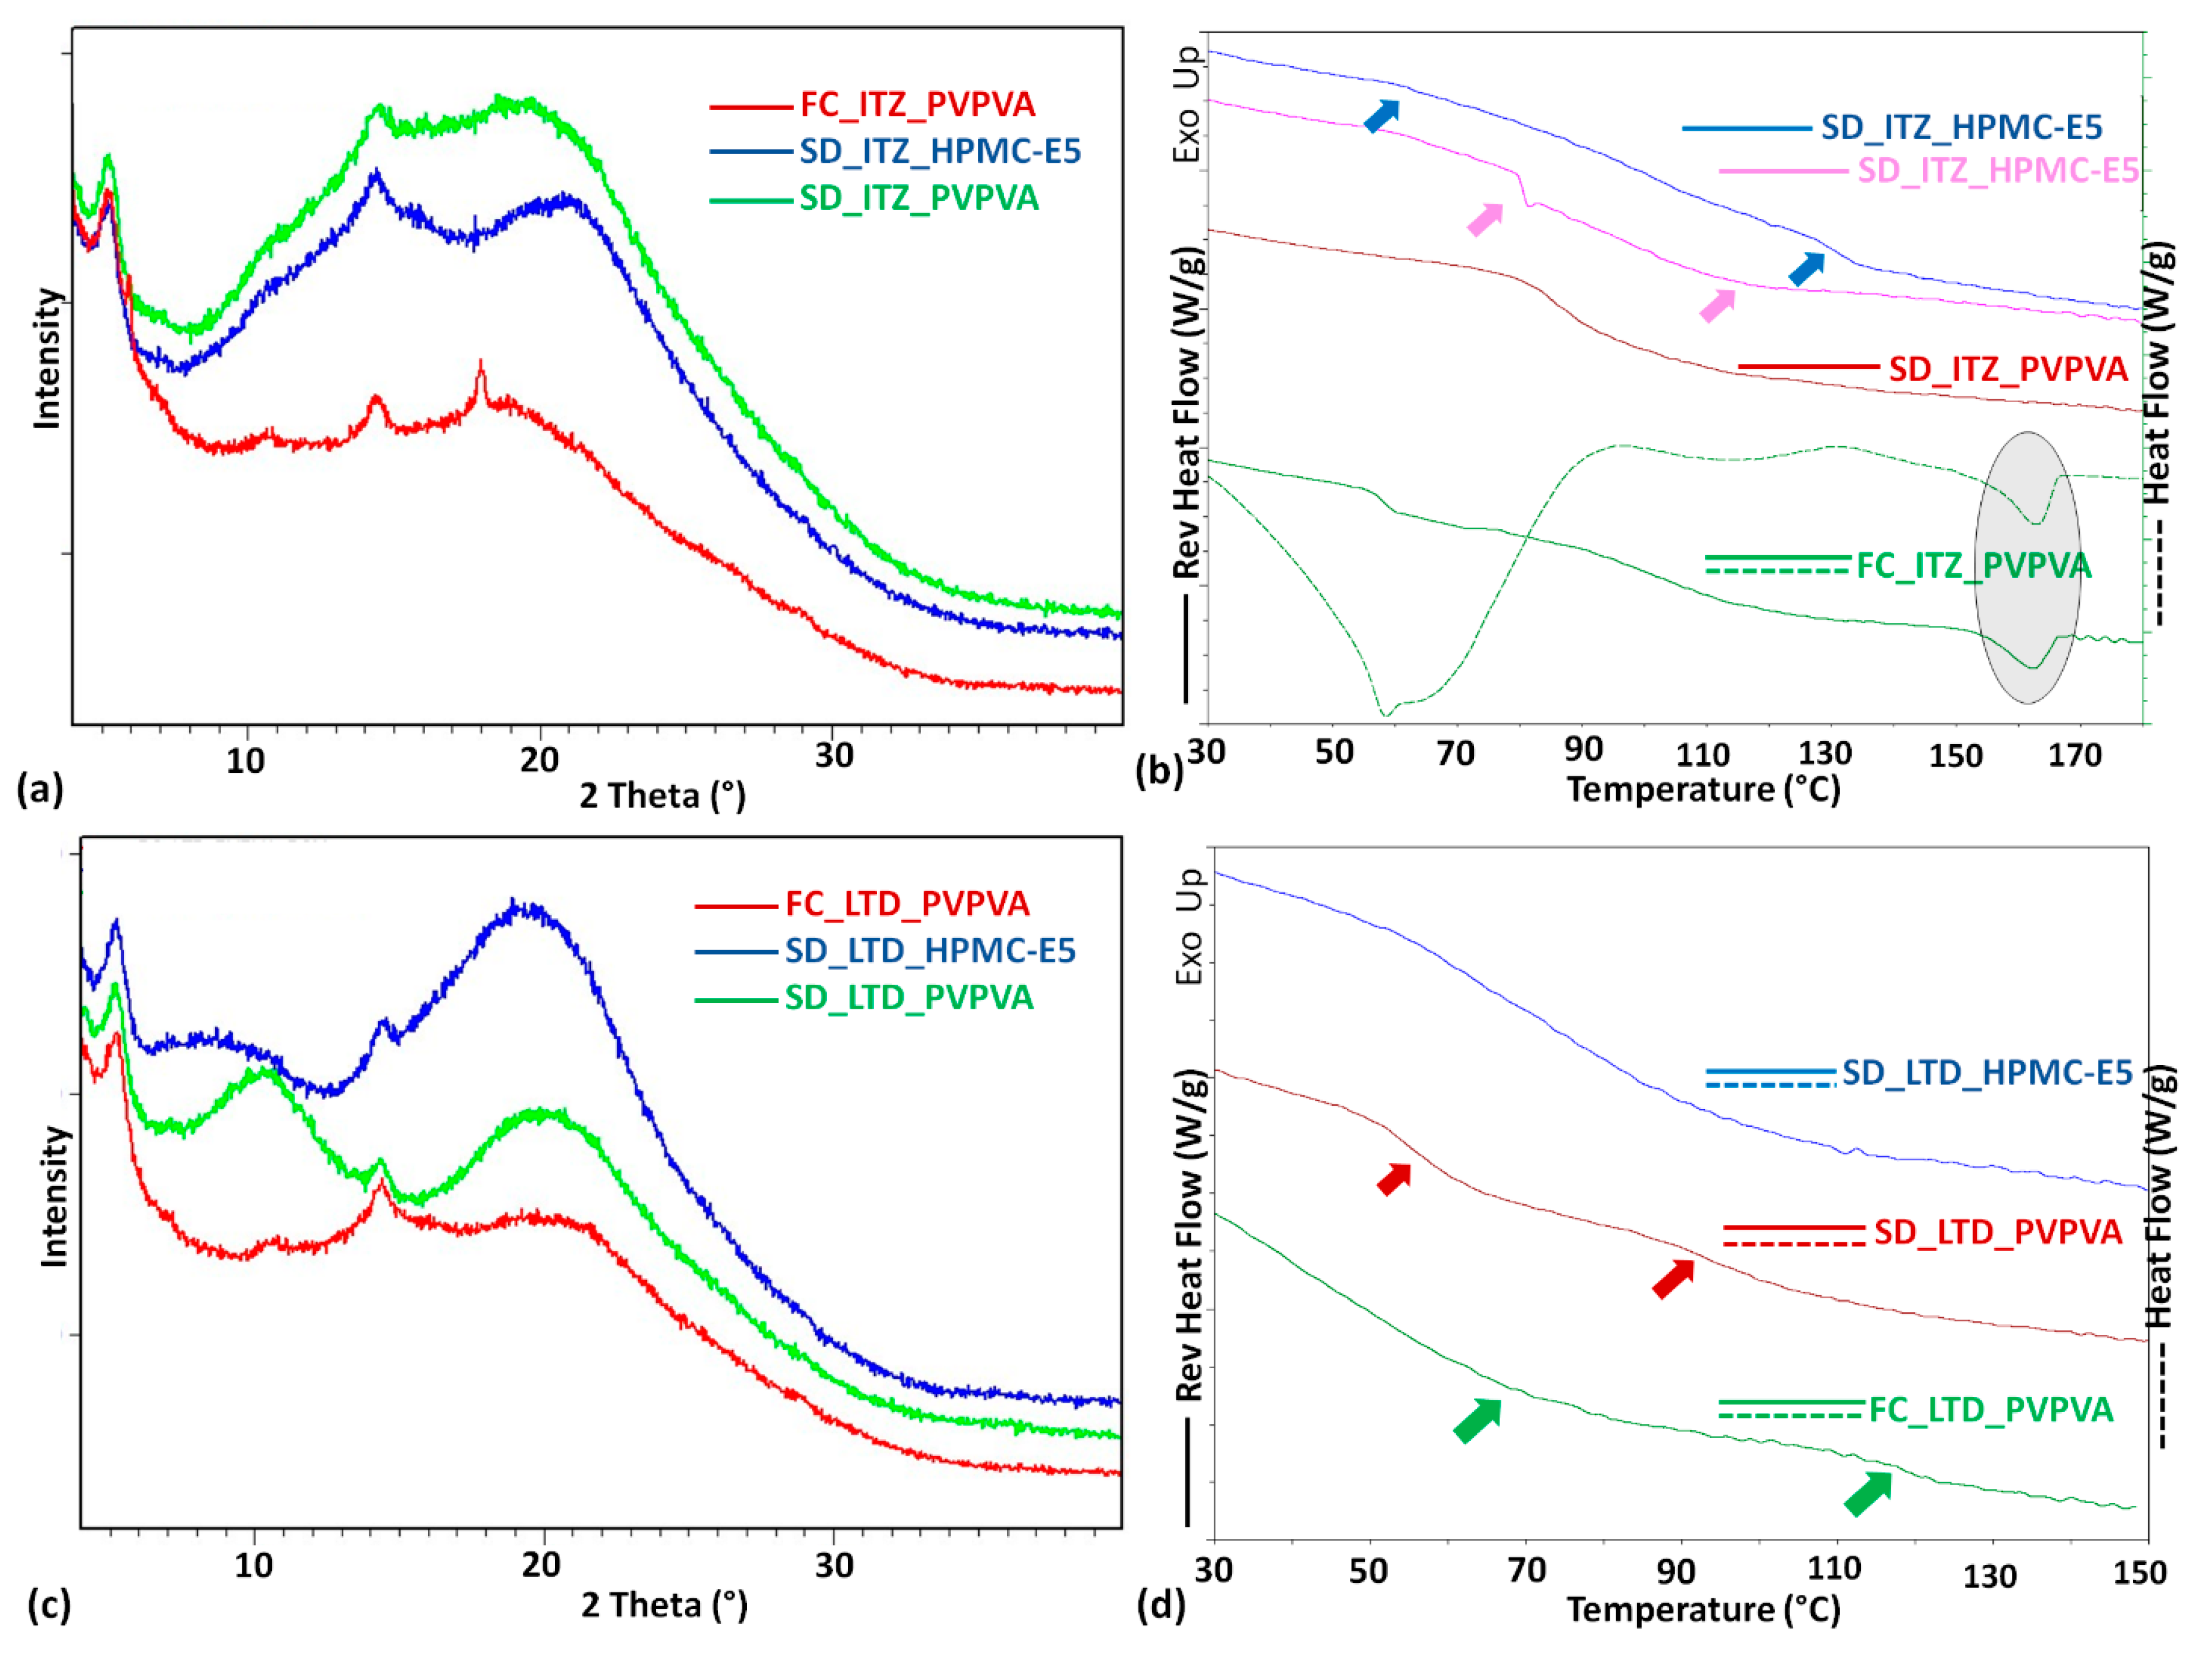
| FC_ITZ_PVPVA | 59; 103 | 87 | 99.69; 1.722 153.83; 4.032 17% | Crystalline content |
| SD_ITZ_PVPVA | 85 | 87 | ----- | Amorphous solid |
| SD_ITZ_HPMC-E5 | 83; 102 | 111 | ----- | Amorphous solid |
| FC_KTZ_PVPVA | 30 | 82 | ----- | Amorphous solid |
| SD_KTZ_PVPVA | 72 | 82 | ----- | Amorphous solid |
| SD_KTZ_HPMC-E5 | 78 | 105 | ----- | Amorphous solid |
| FC_KPF_PVPVA | 16 85 | 53 | ----- | |
| SD_KPF_PVPVA | 38 | 53 | 86.40; 0.2755 0.6% | Amorphous solid |
| SD_KPF_HPMC-E5 | 11 | 72 | ----- | Amorphous solid |
| FC_LTD_PVPVA | 39; 118 | 76 | ----- | Amorphous solid |
| SD_LTD_PVPVA | 54; 93 | 76 | ----- | Amorphous solid |
| SD_LTD_HPMC-E5 | 74 | 98 | ----- | Amorphous solid |
| FC_MCZ_PVPVA | 16; 104 | 60 | ----- | Amorphous solid |
| SD_MCZ_PVPVA | 39 | 60 | 86.29; 0.3815 1% | Amorphous solid |
| SD_MCZ_HPMC-E5 | 46; 114 | 82 | ----- | Amorphous solid |
© 2019 by the authors. Licensee MDPI, Basel, Switzerland. This article is an open access article distributed under the terms and conditions of the Creative Commons Attribution (CC BY) license (http://creativecommons.org/licenses/by/4.0/).
Share and Cite
Panini, P.; Rampazzo, M.; Singh, A.; Vanhoutte, F.; Van den Mooter, G. Myth or Truth: The Glass Forming Ability Class III Drugs Will Always Form Single-Phase Homogenous Amorphous Solid Dispersion Formulations. Pharmaceutics 2019, 11, 529. https://doi.org/10.3390/pharmaceutics11100529
Panini P, Rampazzo M, Singh A, Vanhoutte F, Van den Mooter G. Myth or Truth: The Glass Forming Ability Class III Drugs Will Always Form Single-Phase Homogenous Amorphous Solid Dispersion Formulations. Pharmaceutics. 2019; 11(10):529. https://doi.org/10.3390/pharmaceutics11100529
Chicago/Turabian StylePanini, Piyush, Massimiliano Rampazzo, Abhishek Singh, Filip Vanhoutte, and Guy Van den Mooter. 2019. "Myth or Truth: The Glass Forming Ability Class III Drugs Will Always Form Single-Phase Homogenous Amorphous Solid Dispersion Formulations" Pharmaceutics 11, no. 10: 529. https://doi.org/10.3390/pharmaceutics11100529