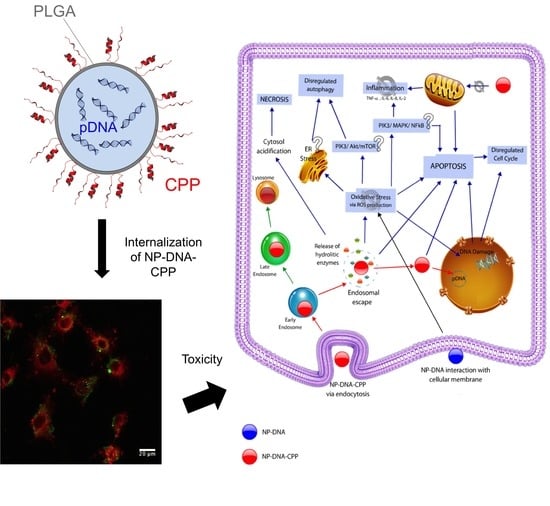
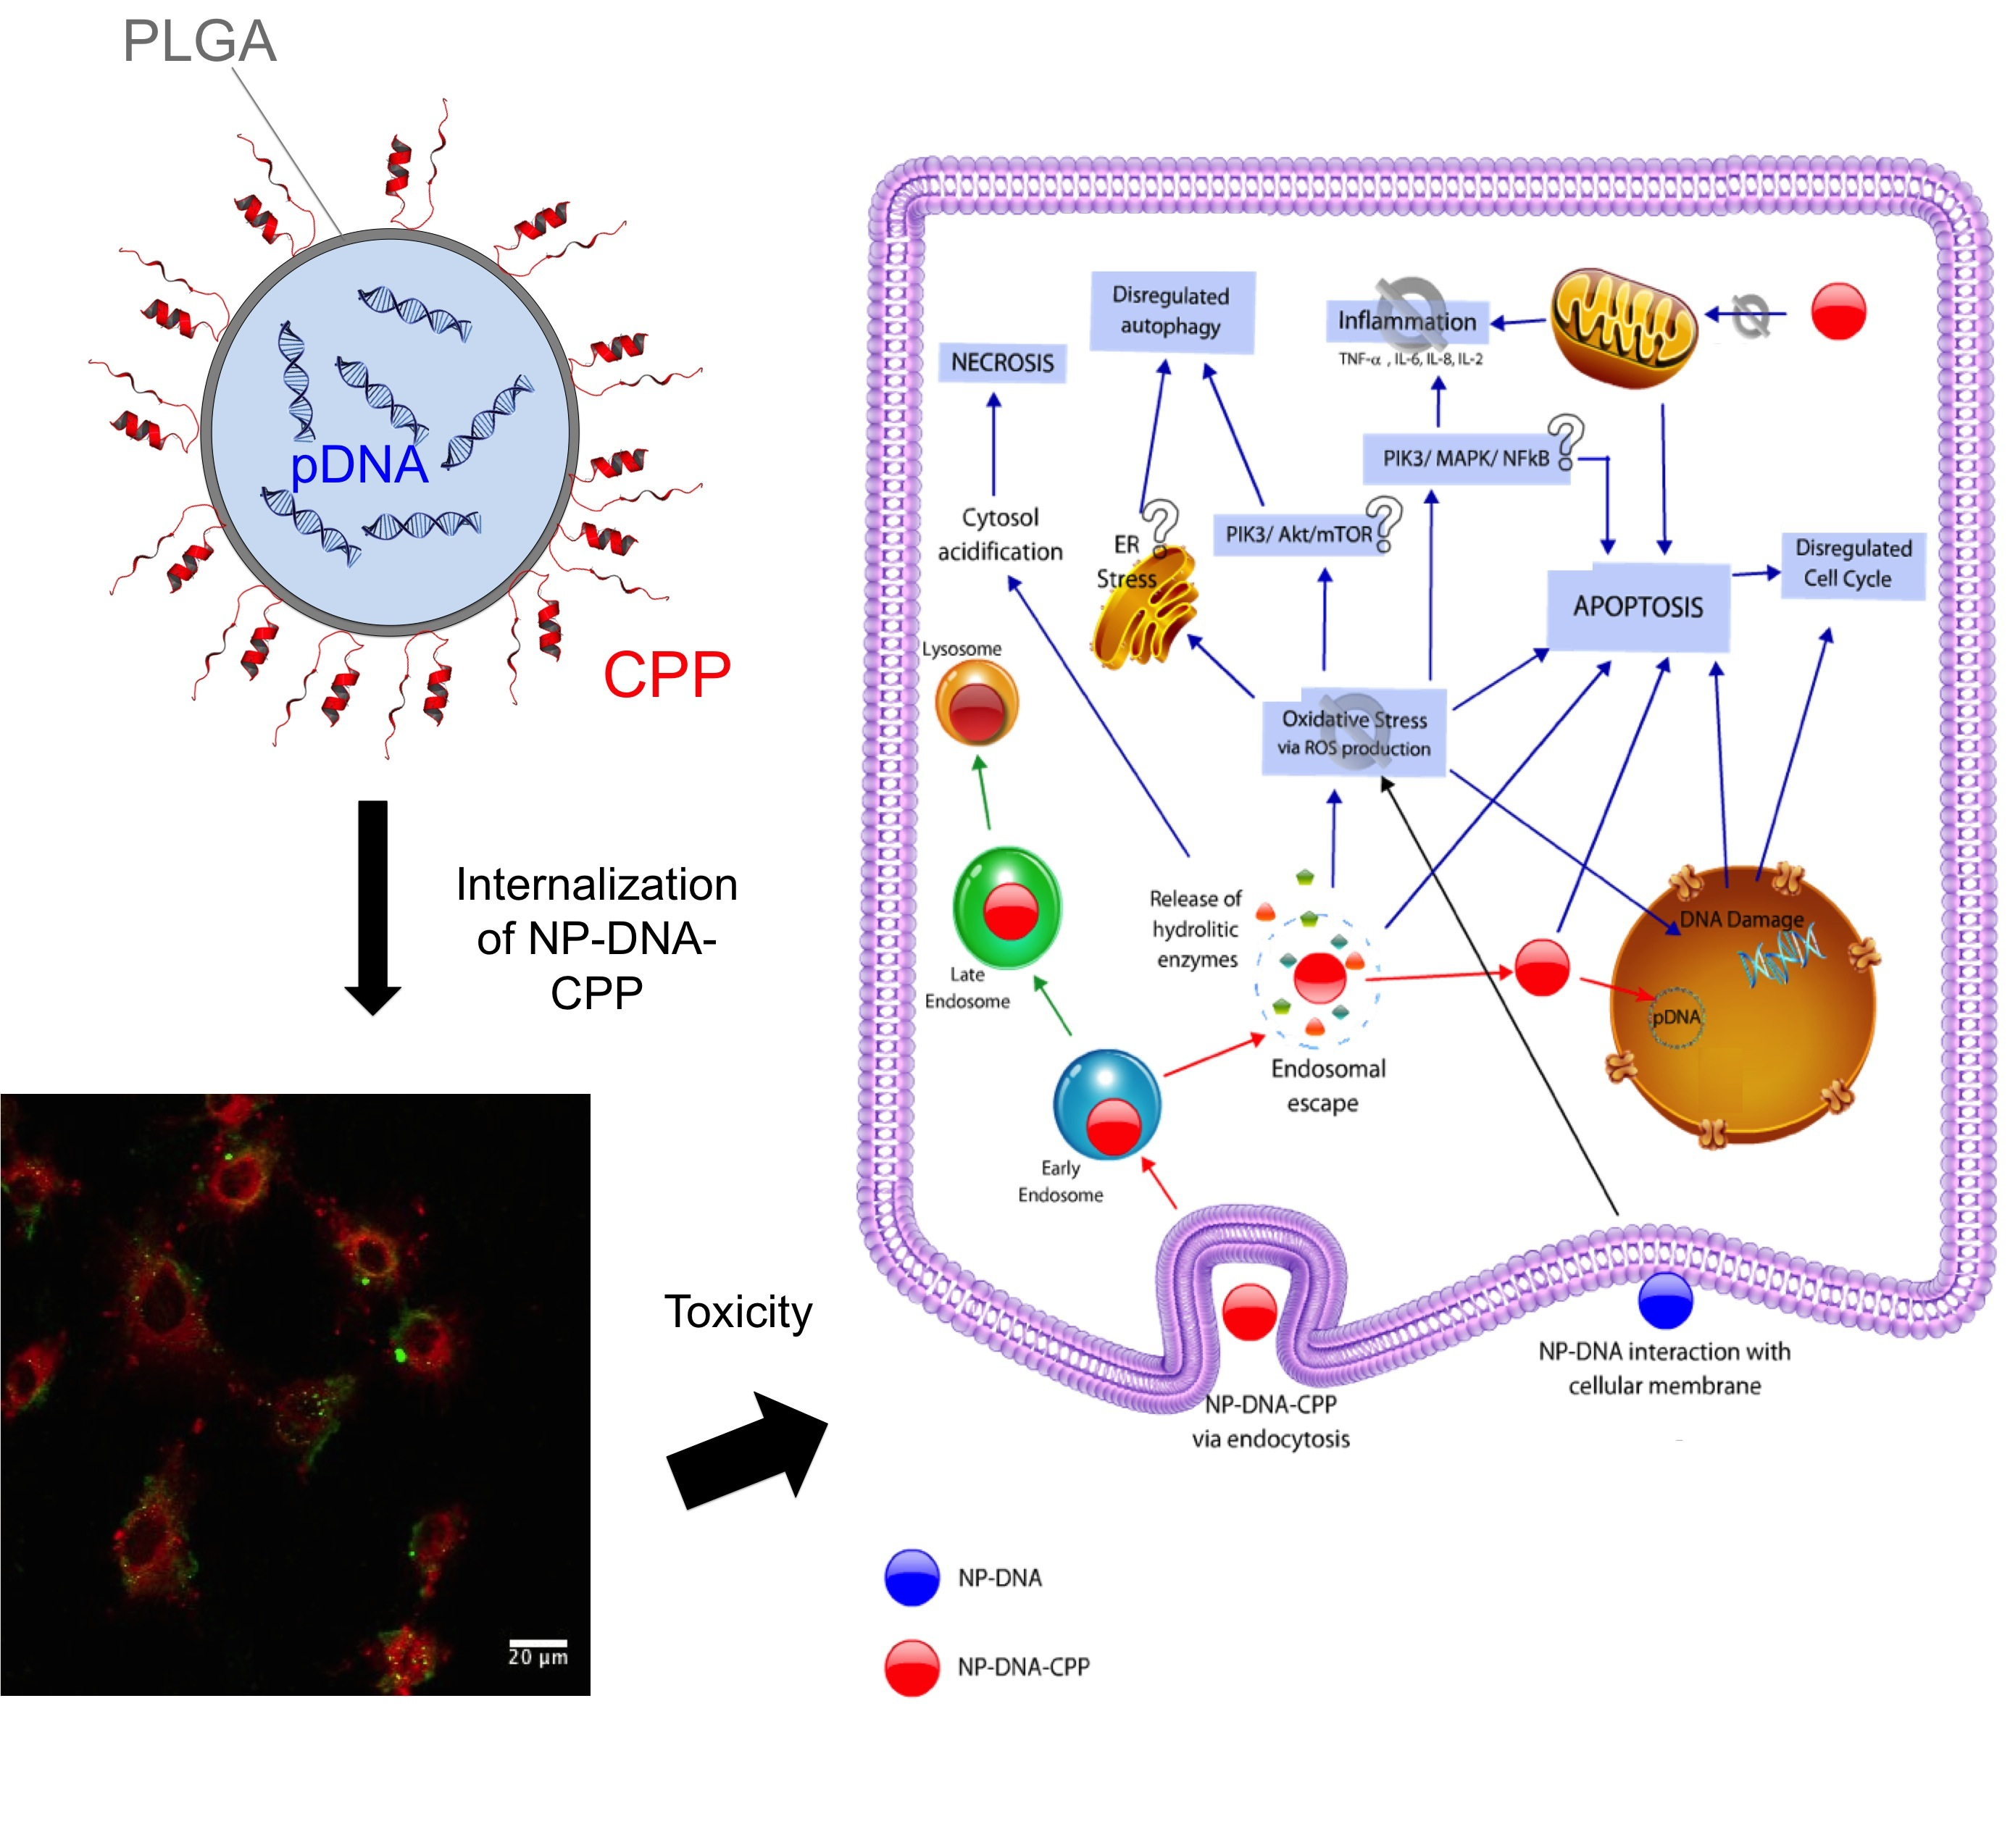
Nanotoxicologic Effects of PLGA Nanoparticles Formulated with a Cell-Penetrating Peptide: Searching for a Safe pDNA Delivery System for the Lungs


Abstract
:
1. Introduction
2. Materials and Methods
2.1. Plasmid Purification and Extraction
2.2. Nanoparticles Production
2.3. Nanoparticle Characterization
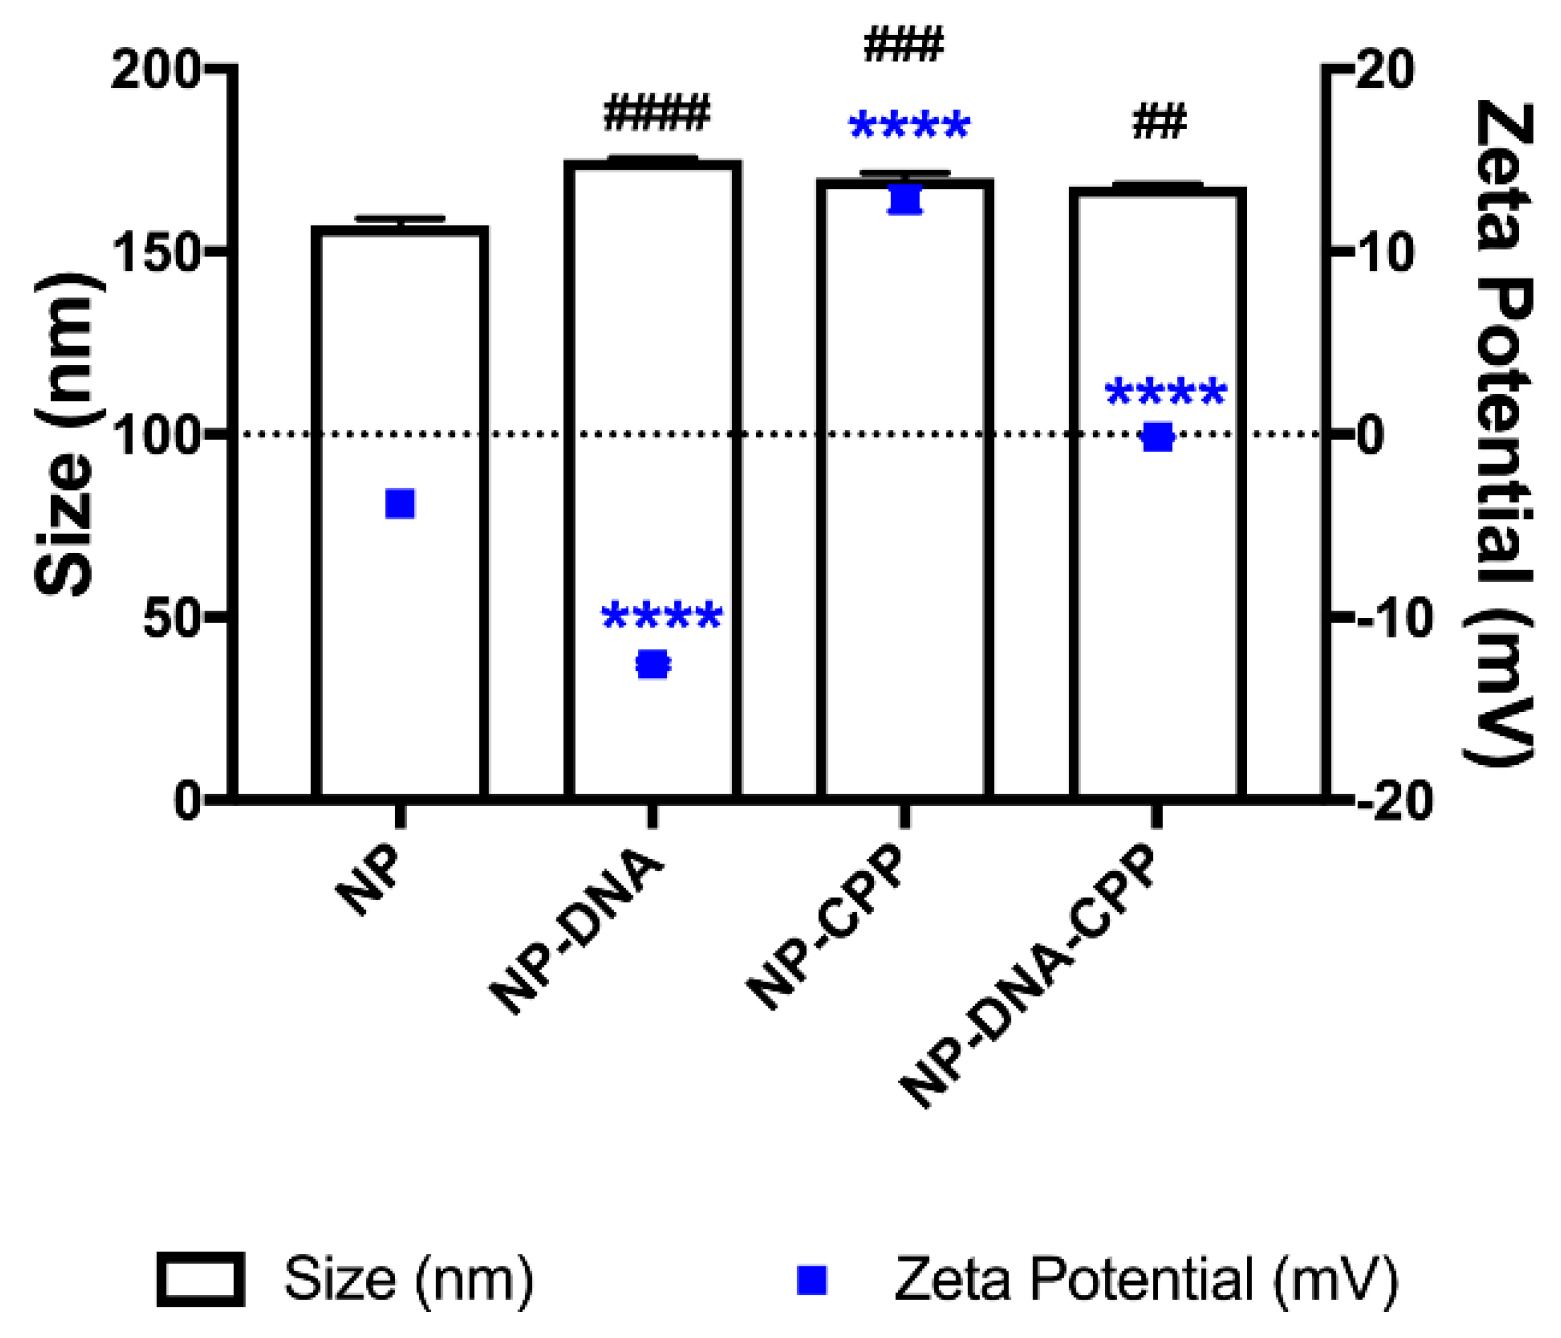
2.3.1. Zetasizer and Zeta Potential Measurement
2.3.2. Encapsulation Efficiency
2.4. Cell Culture
2.4.1. Cell Toxicity
- Mitochondrial Activity—MTS: Cytotoxicity was determined in both cell lines using a MTS Cell Proliferation Assay Kit (Promega, Madison, WI, USA) following manufacturer’s instructions. This assay is based on the ability of viable cells to convert tetrazolium salt into a coloured formazan. Briefly, 5 × 10⁴ cells were seeded per well in a 96-well plate using complete media. After 24 h of incubation, treatments were added ranging from 0.075 to 1.2 mg/mL of PLGA, and incubated for 24 h. Both pDNA encapsulated nanoparticles and placebo (empty) nanoparticles were assessed. MTS reagent was added to the cells and incubated for 4 h, and samples read using a spectrophotometer (SpectraMax M2, Molecular Devices) at 492 nm. Cell viability for treated cells was determined in comparison to cells that had no treatment (media only).
- Lactate Dehydrogenase Release—LDH: The lactate dehydrogenase release assay (LDH assay) (RayBiotech) was used to determine the cytotoxic effect of the NPs by the quantification of plasma membrane damage. LDH is a stable enzyme found in the cytoplasm of all cells, and is quickly released to the cell culture supernatant when the cellular membrane is damaged. LDH assay was performed as per manufacturer’s instructions. Both cell lines (A549 and Beas-2B) were seeded (5 × 10⁴ cells/well) in a 96-well plate using complete media. After 24 h 100 µL of the treatment was added to the cells (pDNA-NPs from 0.1 to 1.2 mg/mL of PLGA prepared in SF:NaCl) and incubated for further 24 h. 100 µL of the supernatant of each well was transferred to another 96-well plate and 100 µL of the reaction mixture added to each well and incubated at room temperature for 30 min, protected for light. Samples were measured using a spectrophotometer at 450 nm. The controls in this assay included complete media (10% serum), SF:NaCl, NaCl 0.9%, Triton-X 2%, media with no cells and cells with no reagent added. LDH Release (%) was calculated in comparison to control cells with media only.
2.4.2. Cellular Uptake
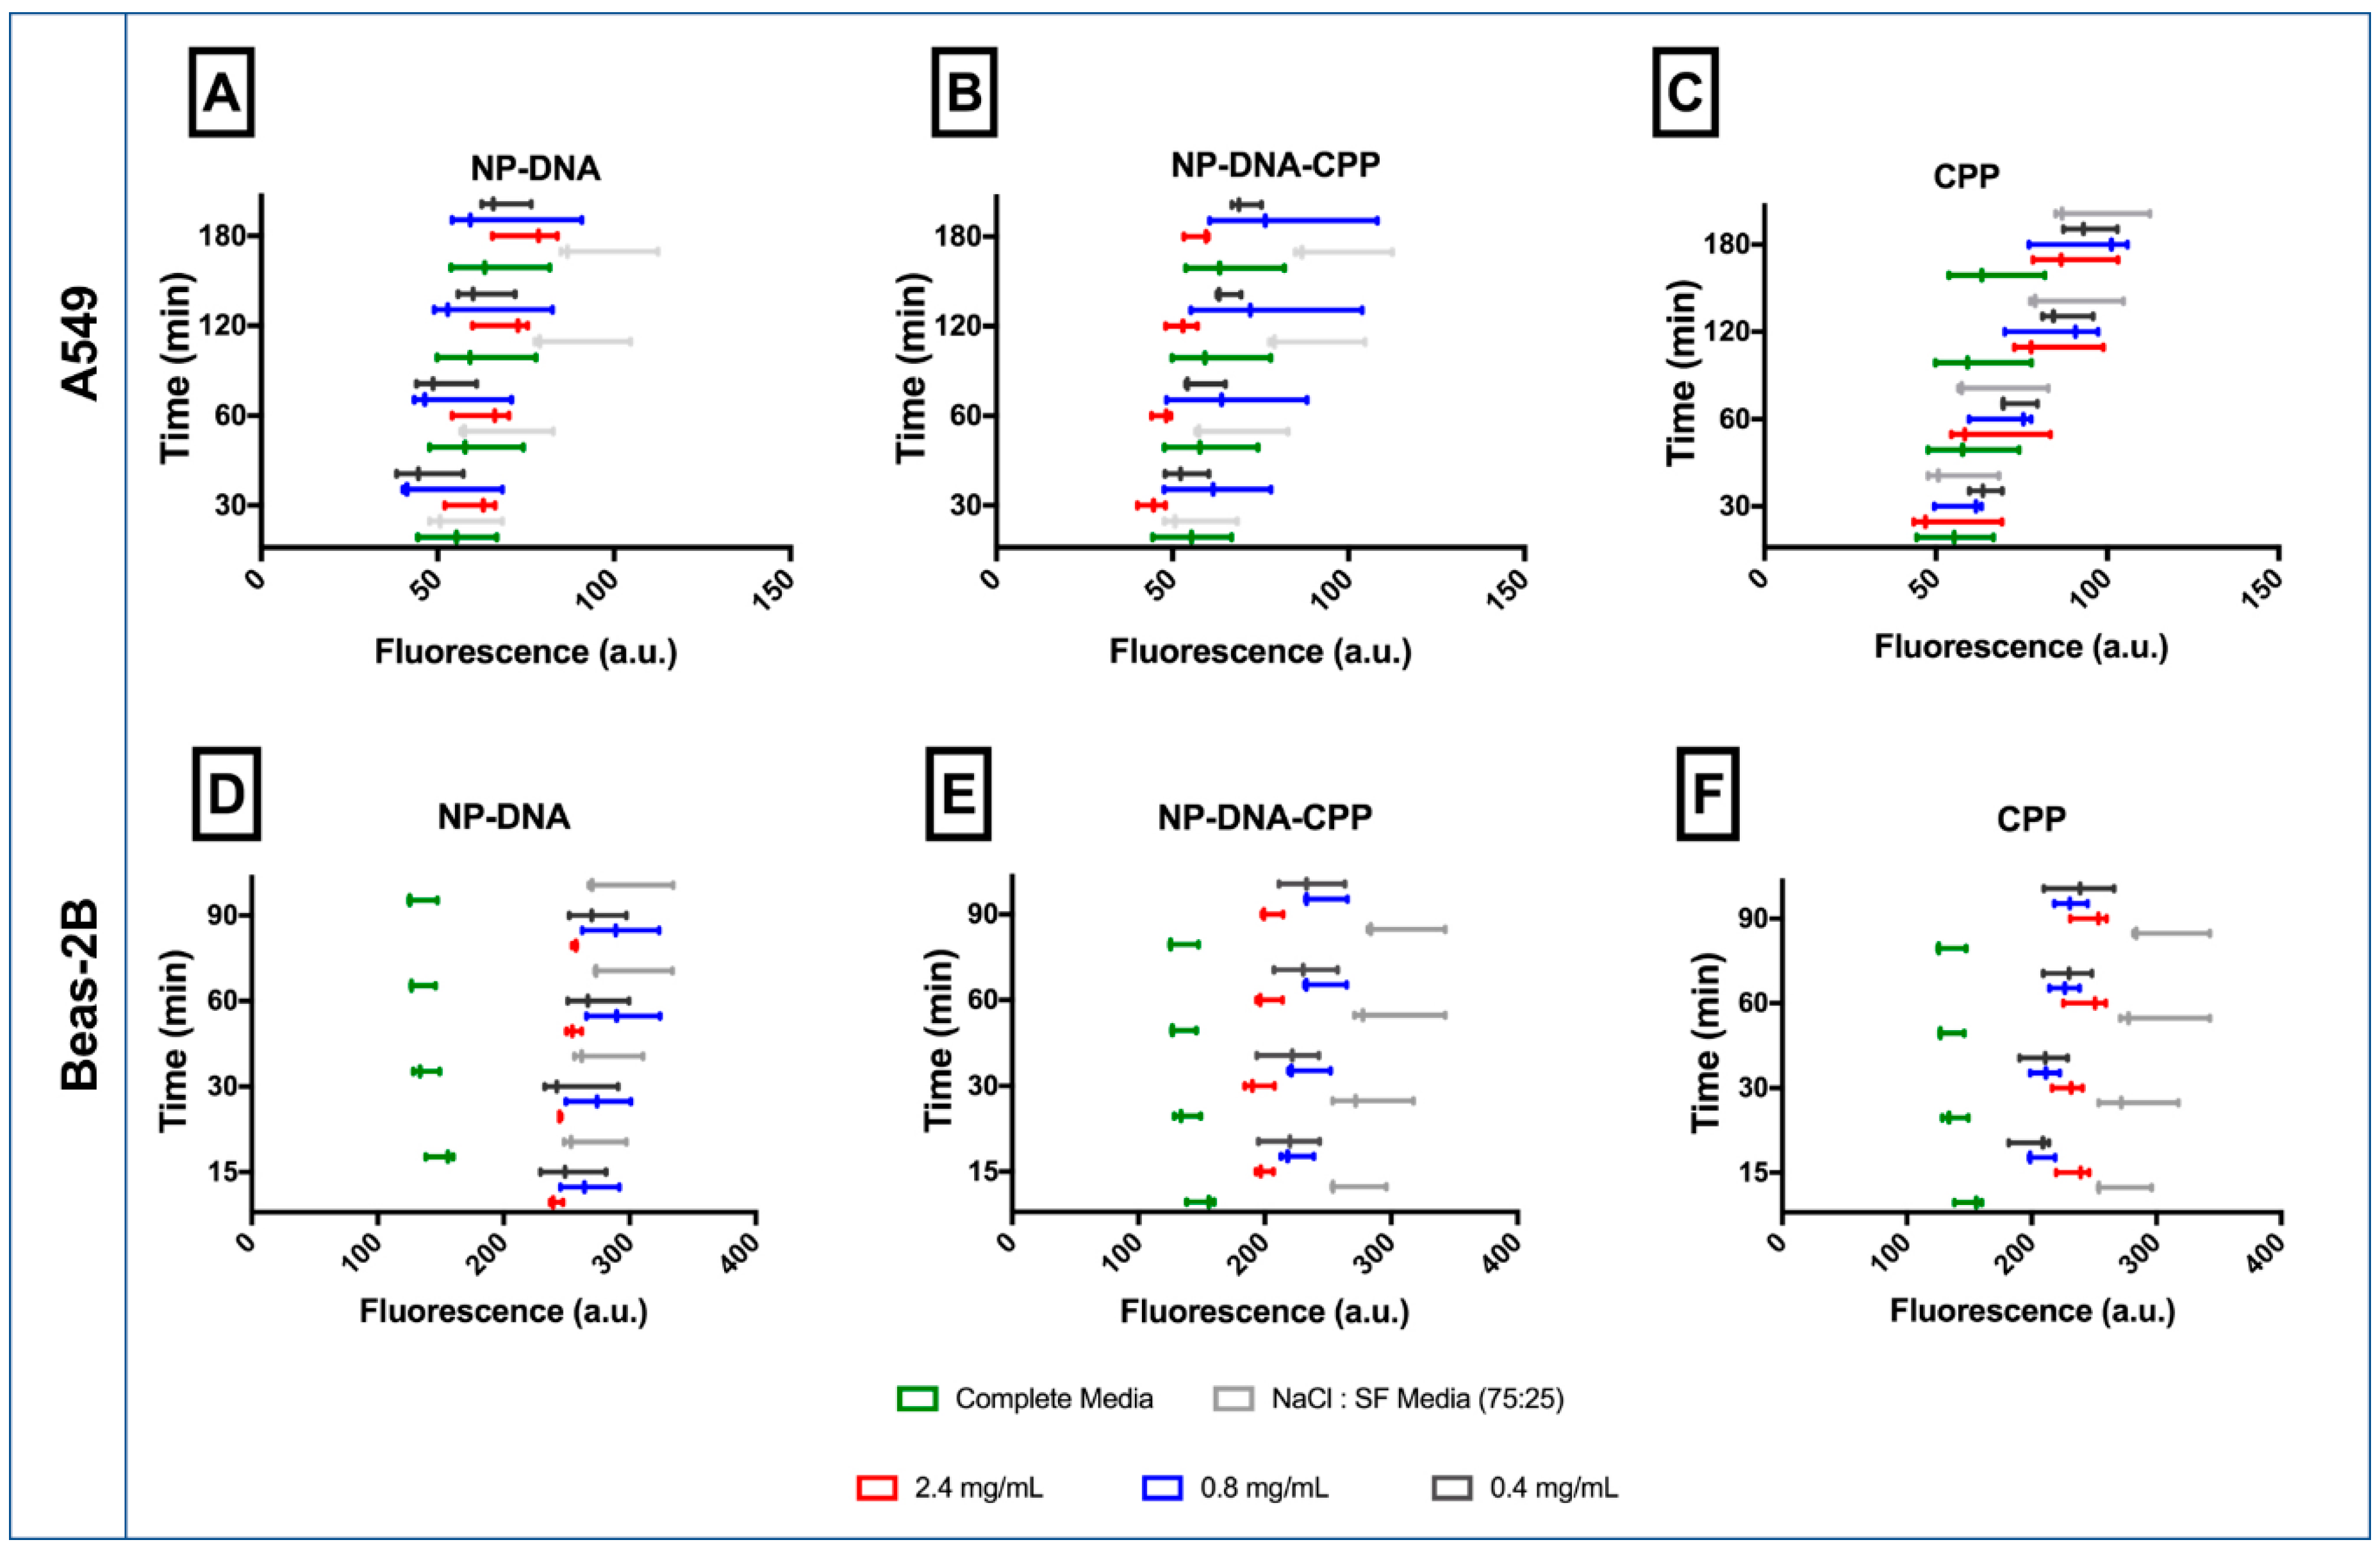
- Cellular uptake by flow cytometry: Cellular uptake of the NPs was assessed using flow cytometry BD AccuriTM Flow Cytometer C6 (BD Accuri). Cells were seeded in 6-well plates (5 × 10⁵ cells/well) using complete media and allowed to attach and grow for 24 h. Cells were then incubated with the NPs–DNA and NPs–DNA–CPP, prepared in SF:NaCl for 3 h. Cells were washed twice with phosphate buffer solution (PBS), detached using trypsin and resuspended in PBS for flow analysis. Uptake was evaluated using the fluorescent channel 2 (FL2 detector, 585/625 nm; laser configuration of 3-blue 1-red, laser 488 nm). Measurements were carried out in triplicate and 10,000 events were acquired in the gated region of the forward-scatter/side scatter plot per sample. Cellular uptake results were calculated as the percentage of cells that internalized the particles (%) and the mean fluorescence intensity (a.u.). Internalization was assessed after 3, 24 and 48 h of incubation.
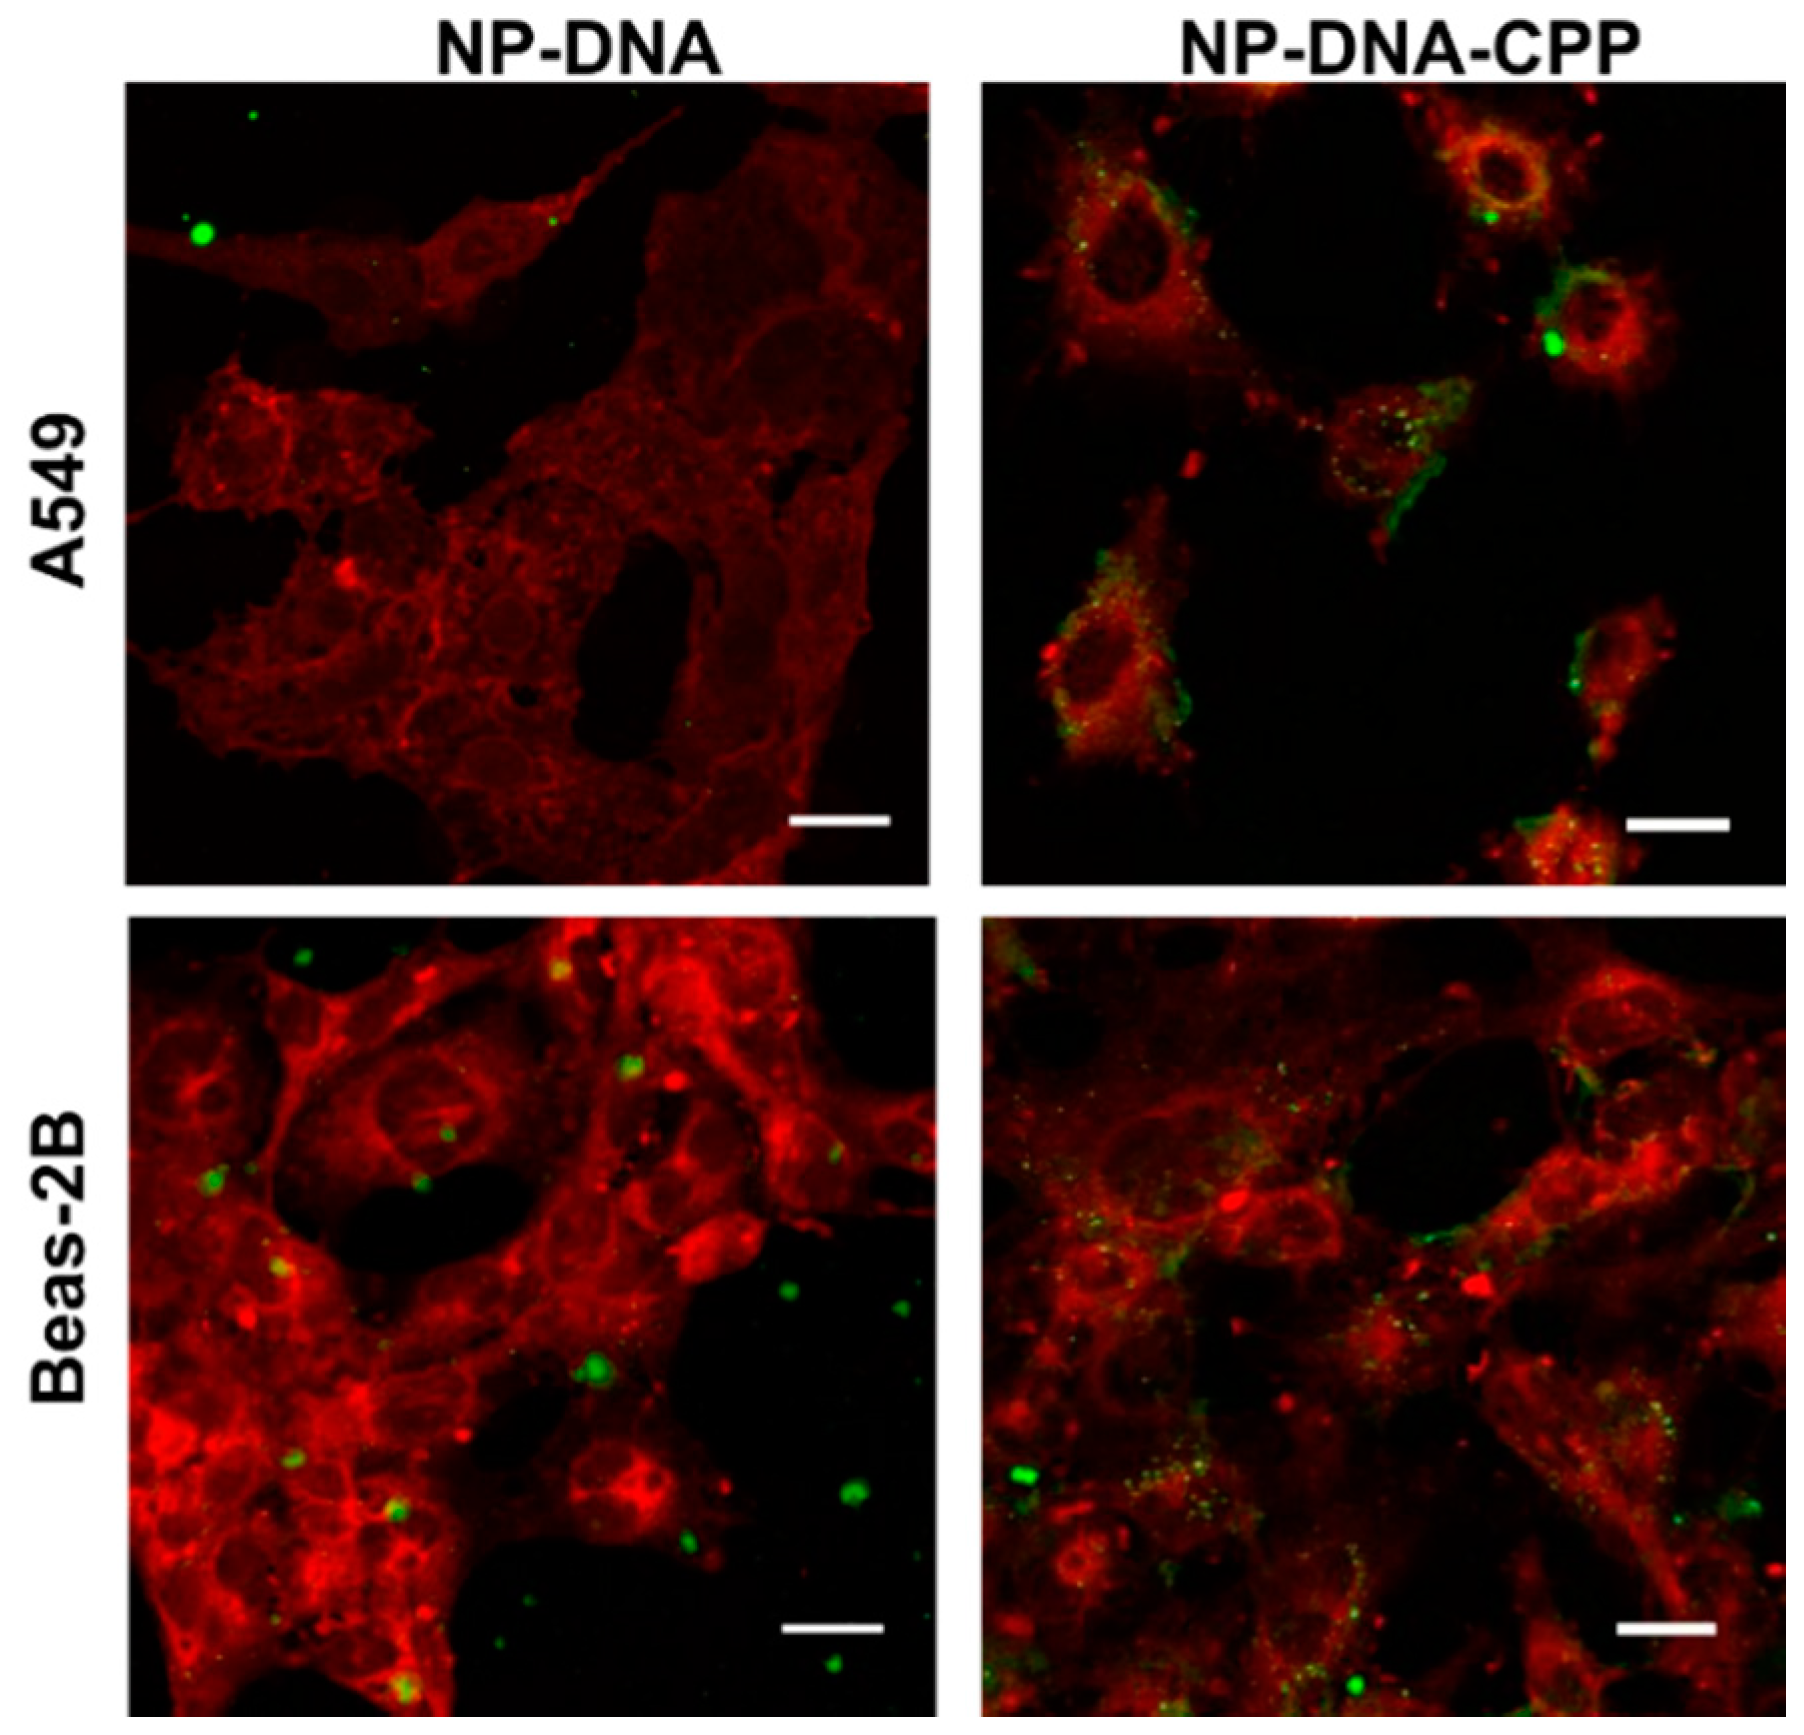
- Cellular Uptake by Confocal Microscopy: To confirm the internalization of NPs–DNA–CPP after 3 h, cells were visualized by confocal microscopy. Cells were seeded in 8 chamber-slides for fixed cell imaging (LabTek, Brendale, QLD, Australia) at a density of 50,000 cells per chamber for both cell lines. NPs treatments were added to the cells and incubated at 37 °C for 3 h for uptake studies. Cells were washed twice with warm PBS and fixed with 4% paraformaldehyde for 15 min. The cell membrane was counter-stained using Cell Mask Deep Red Membrane Stain (5 min incubation at 37 °C, Thermo Fisher) and the nucleus was stained using 4′,6-diamidino-2-phenylindole (DAPI) (1 µg/mL for 10 min). The chamber was removed and ProLong® Gold Antifade Mountant (Thermo Fisher) was used to mount the coverslip.
2.4.3. Apoptosis and Necrosis
2.4.4. Cell Cycle
2.4.5. Caspase-3
2.4.6. Nuclei Morphology by DAPI Staining
2.4.7. Oxidative Stress by 2′,7′–dichlorofluorescin diacetate (DCFDA) dye
2.4.8. Inflammatory Markers
2.4.9. Autophagy
2.5. Statistical Analysis
3. Results
3.1. Nanoparticles Production and Characterization
3.2. Cell Toxicity
3.3. Cellular Uptake
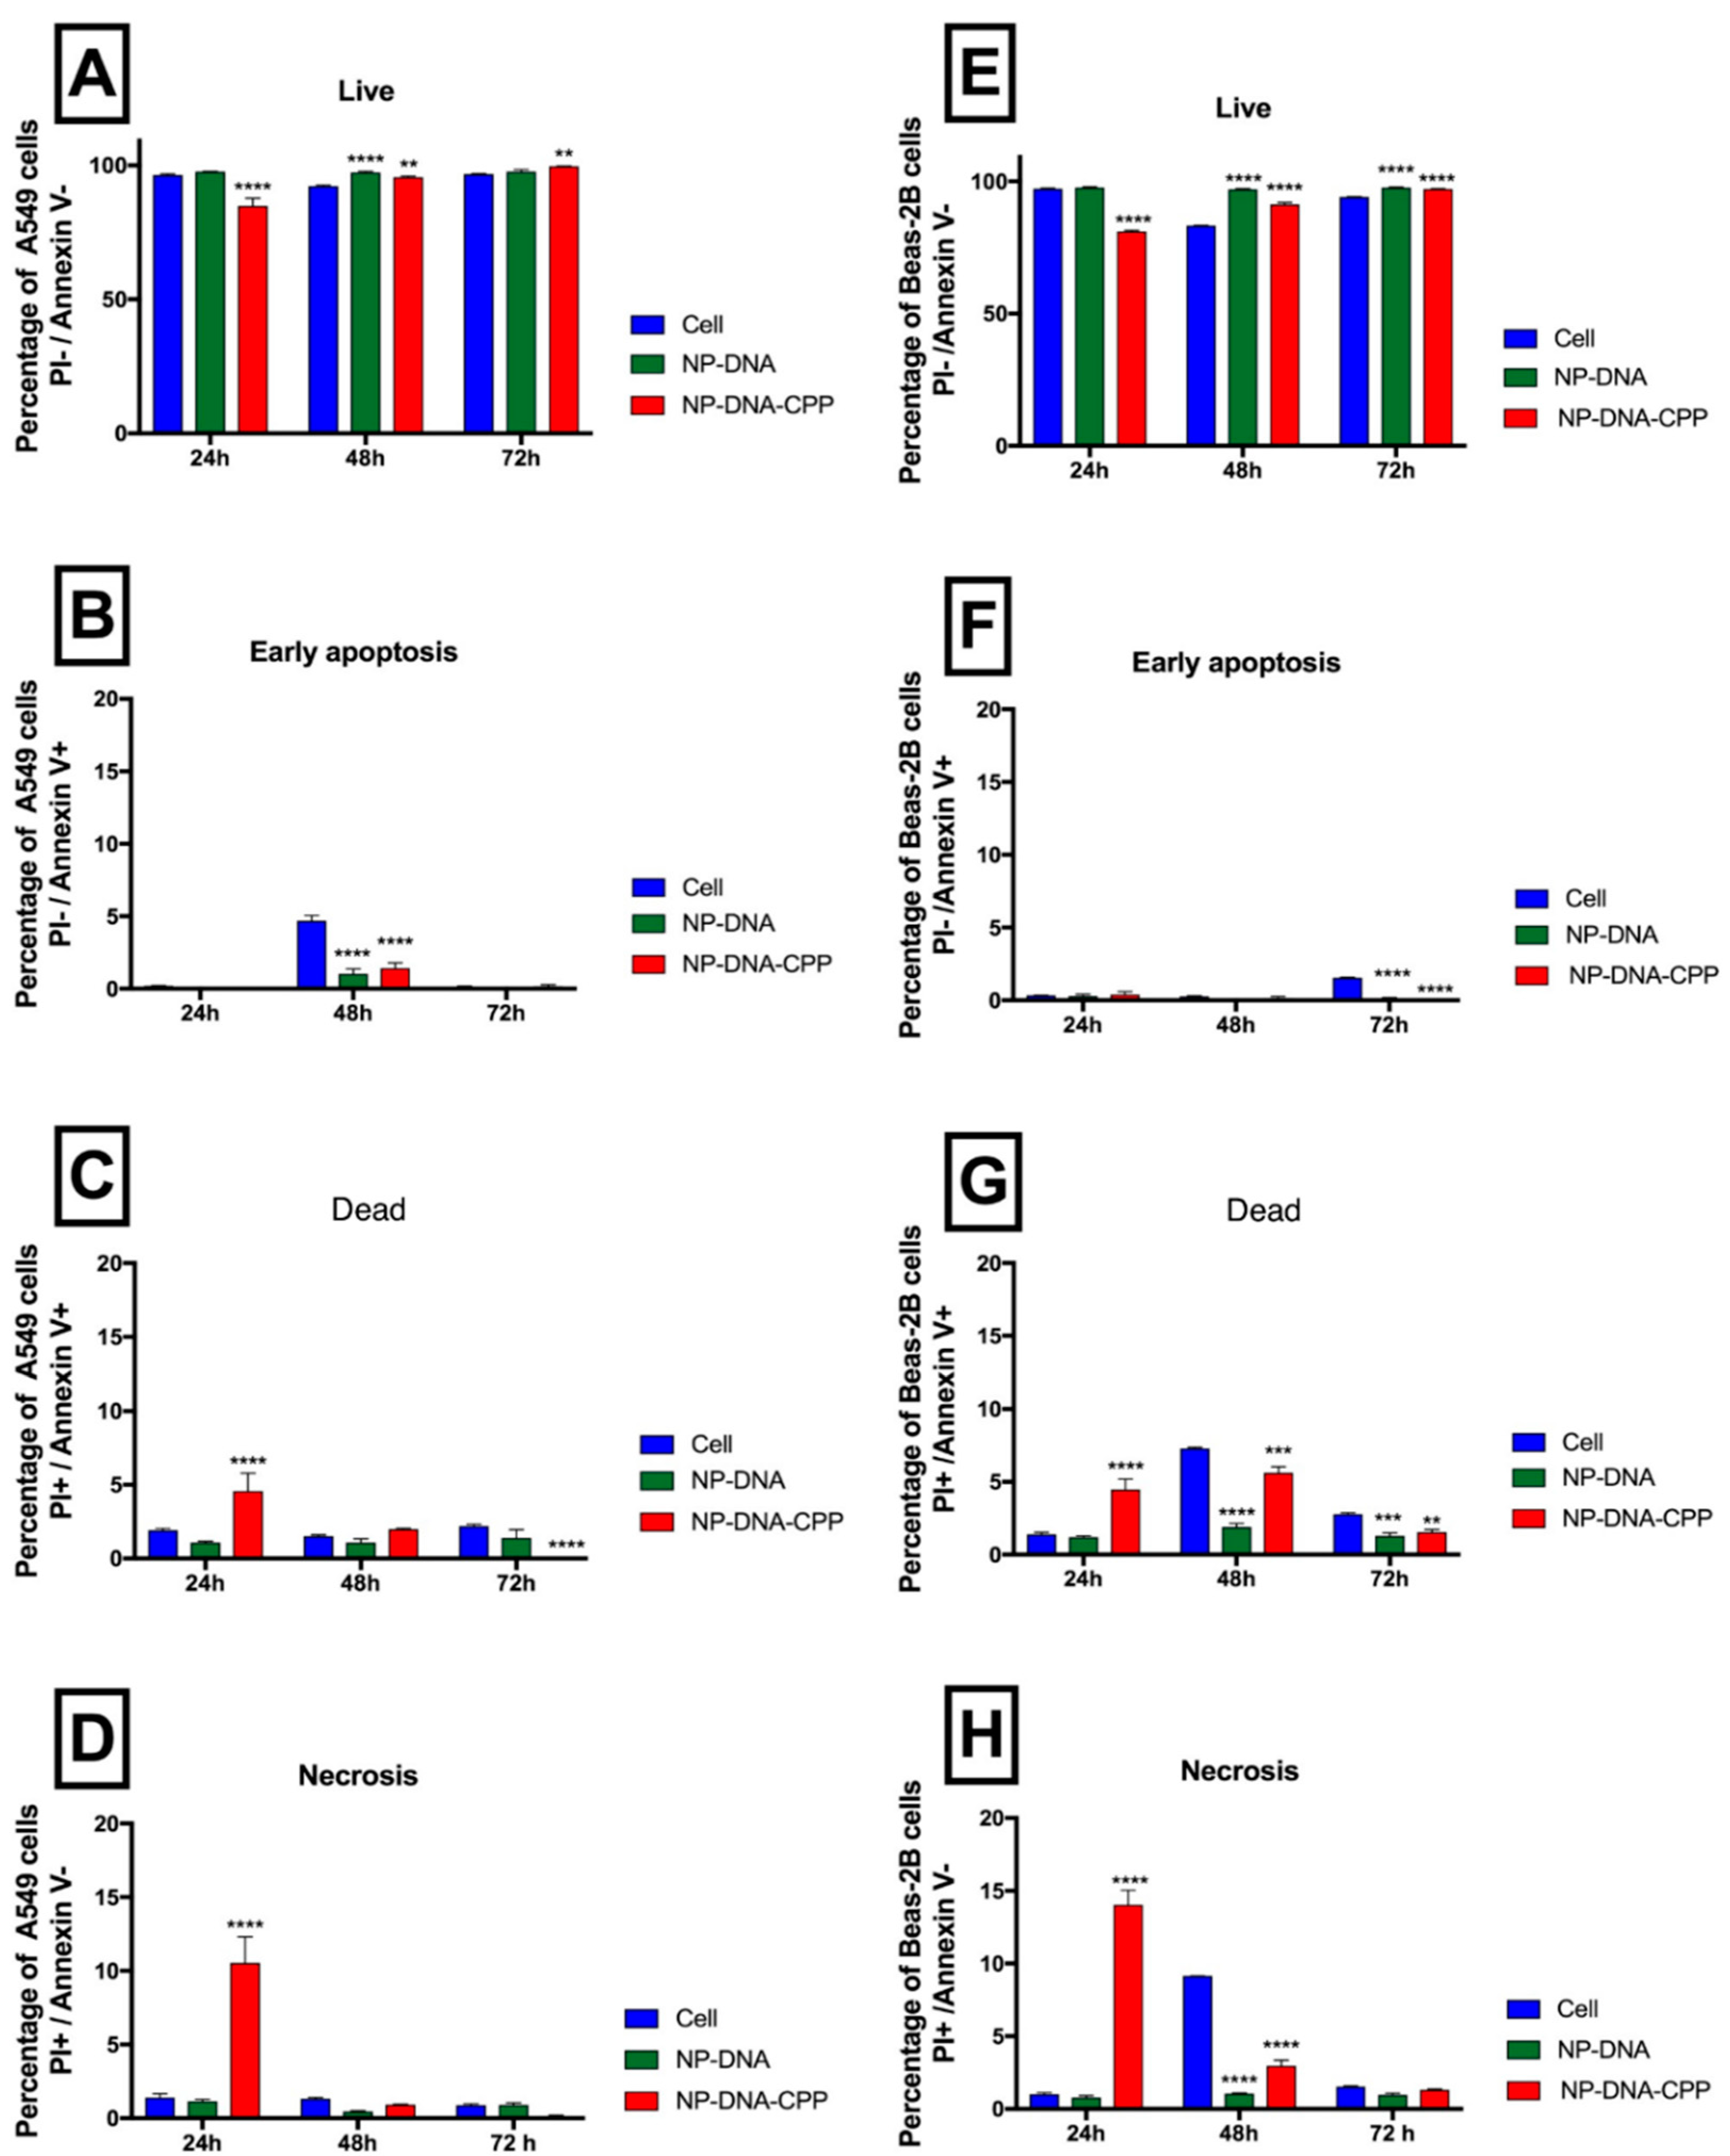
3.4. Apoptosis
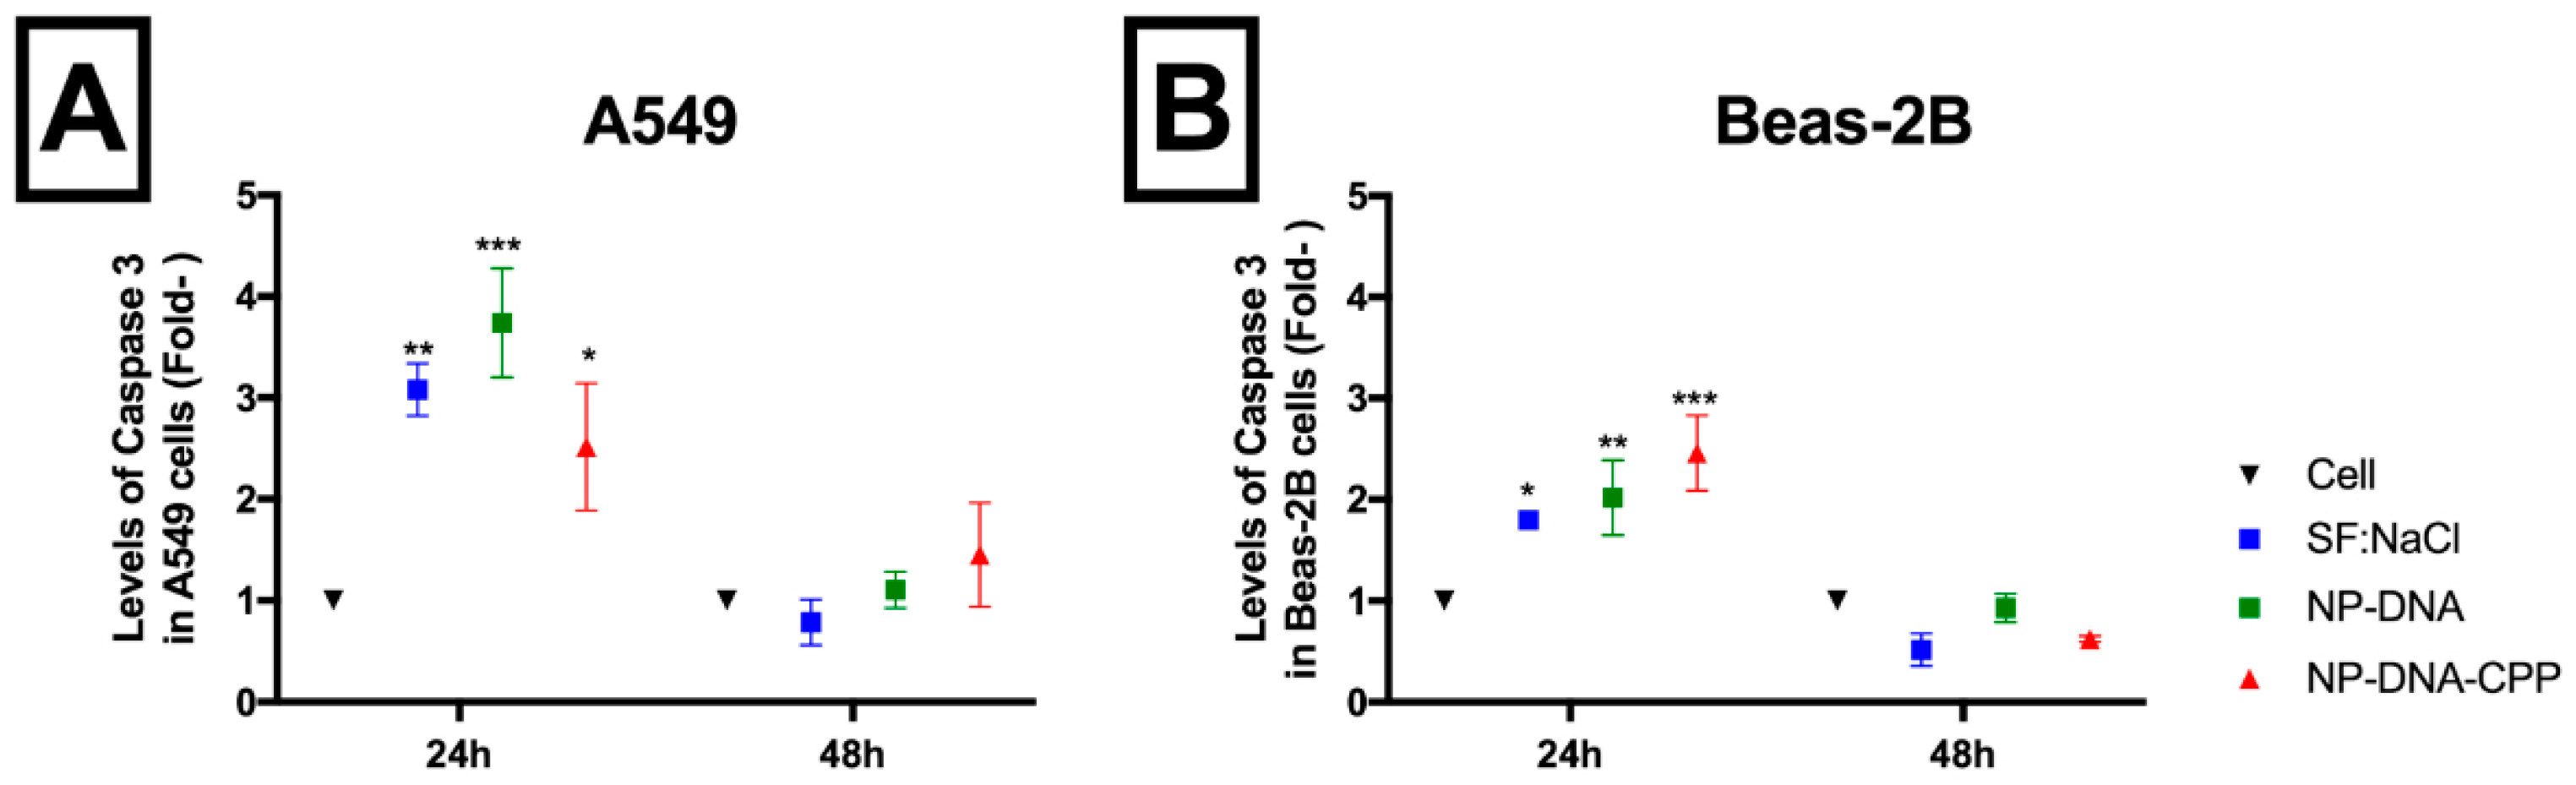
3.5. Caspase-3
3.6. Cell Cycle
3.7. Oxidative Stress
3.8. DNA Damage via Nuclei Morphology
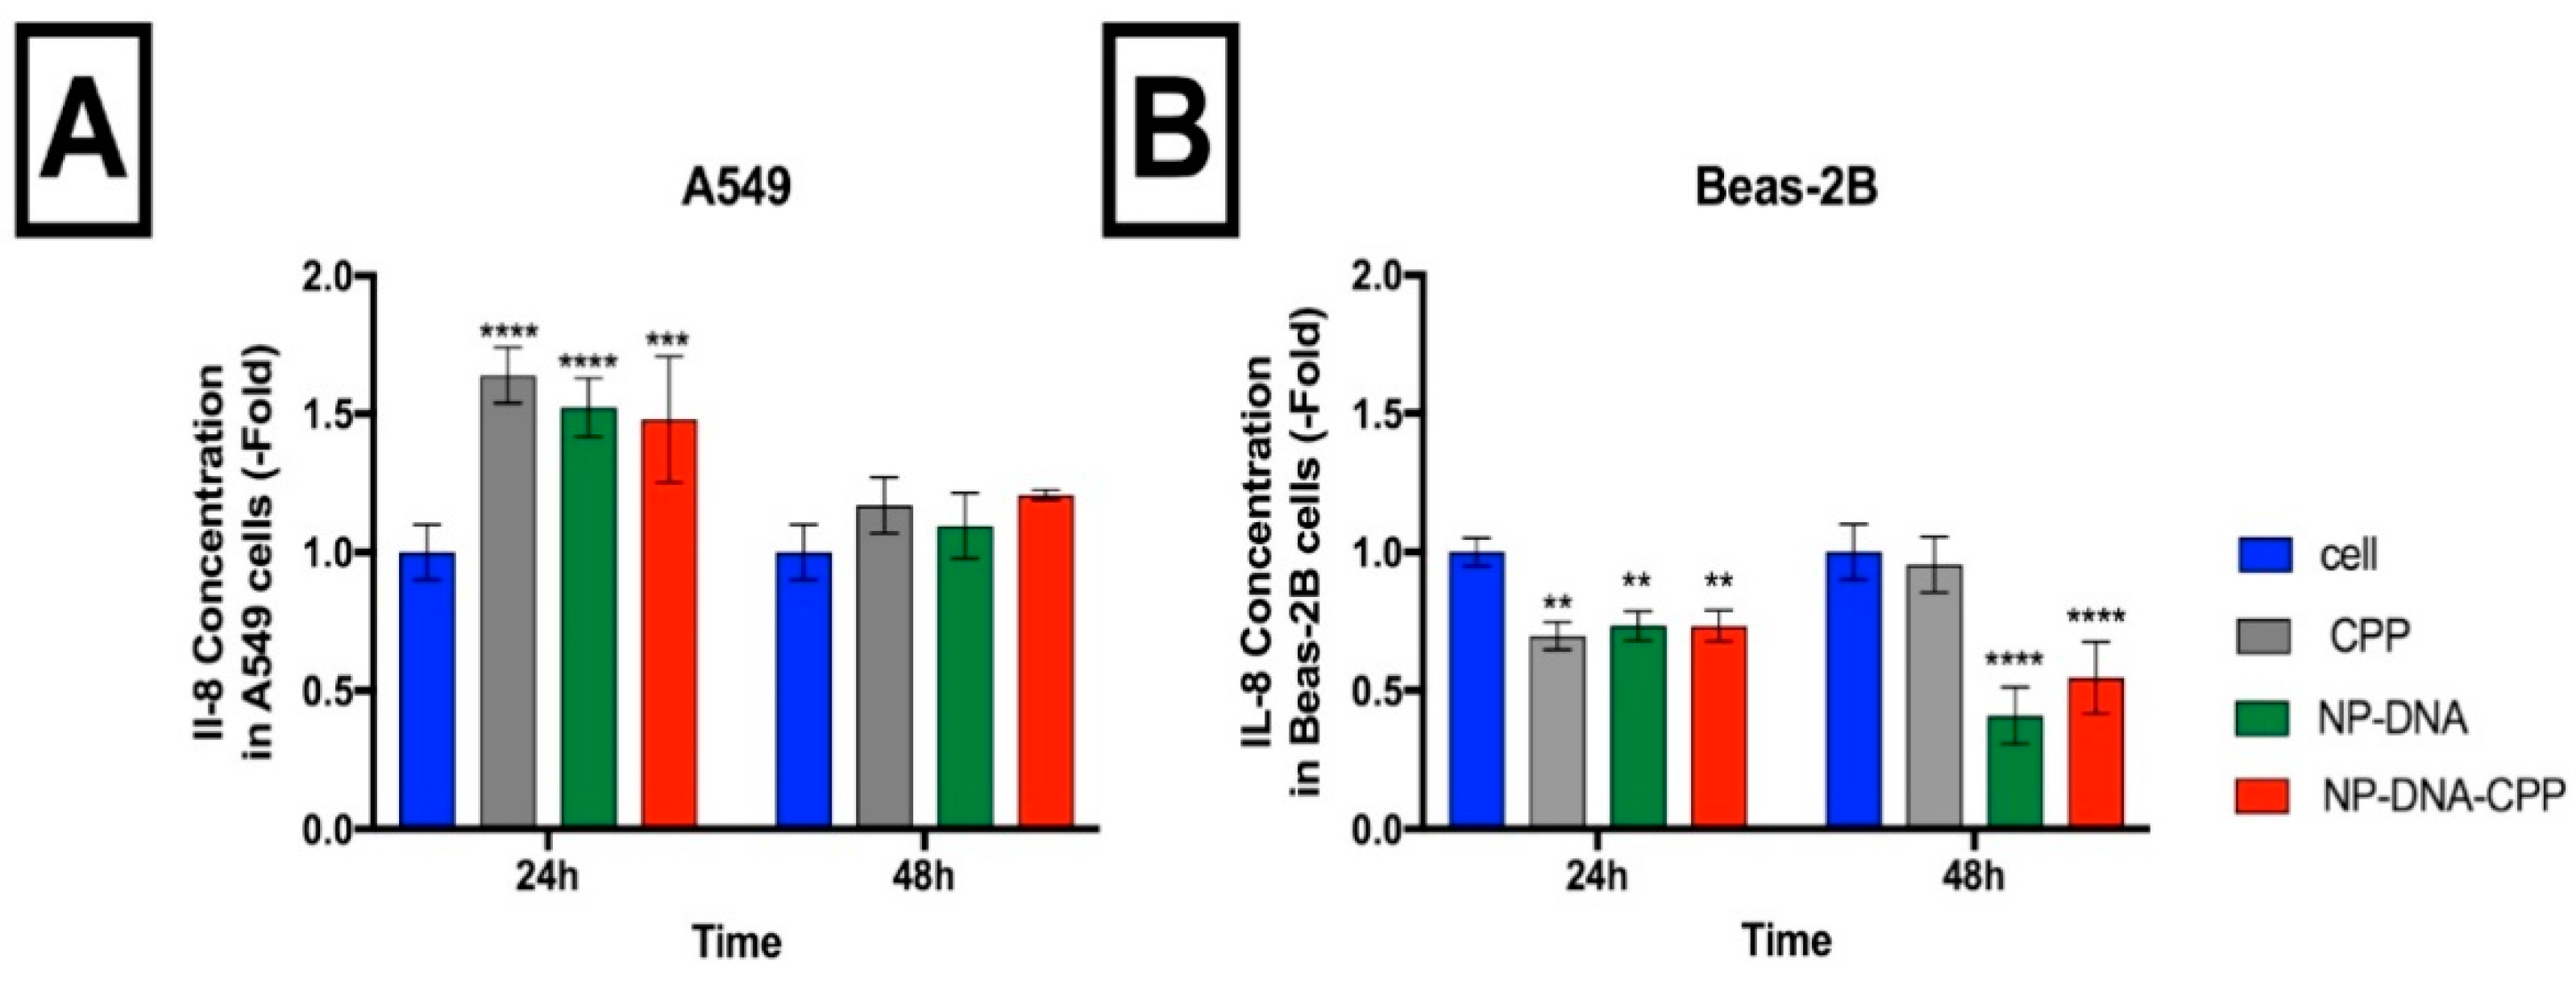
3.9. Inflammatory Markers
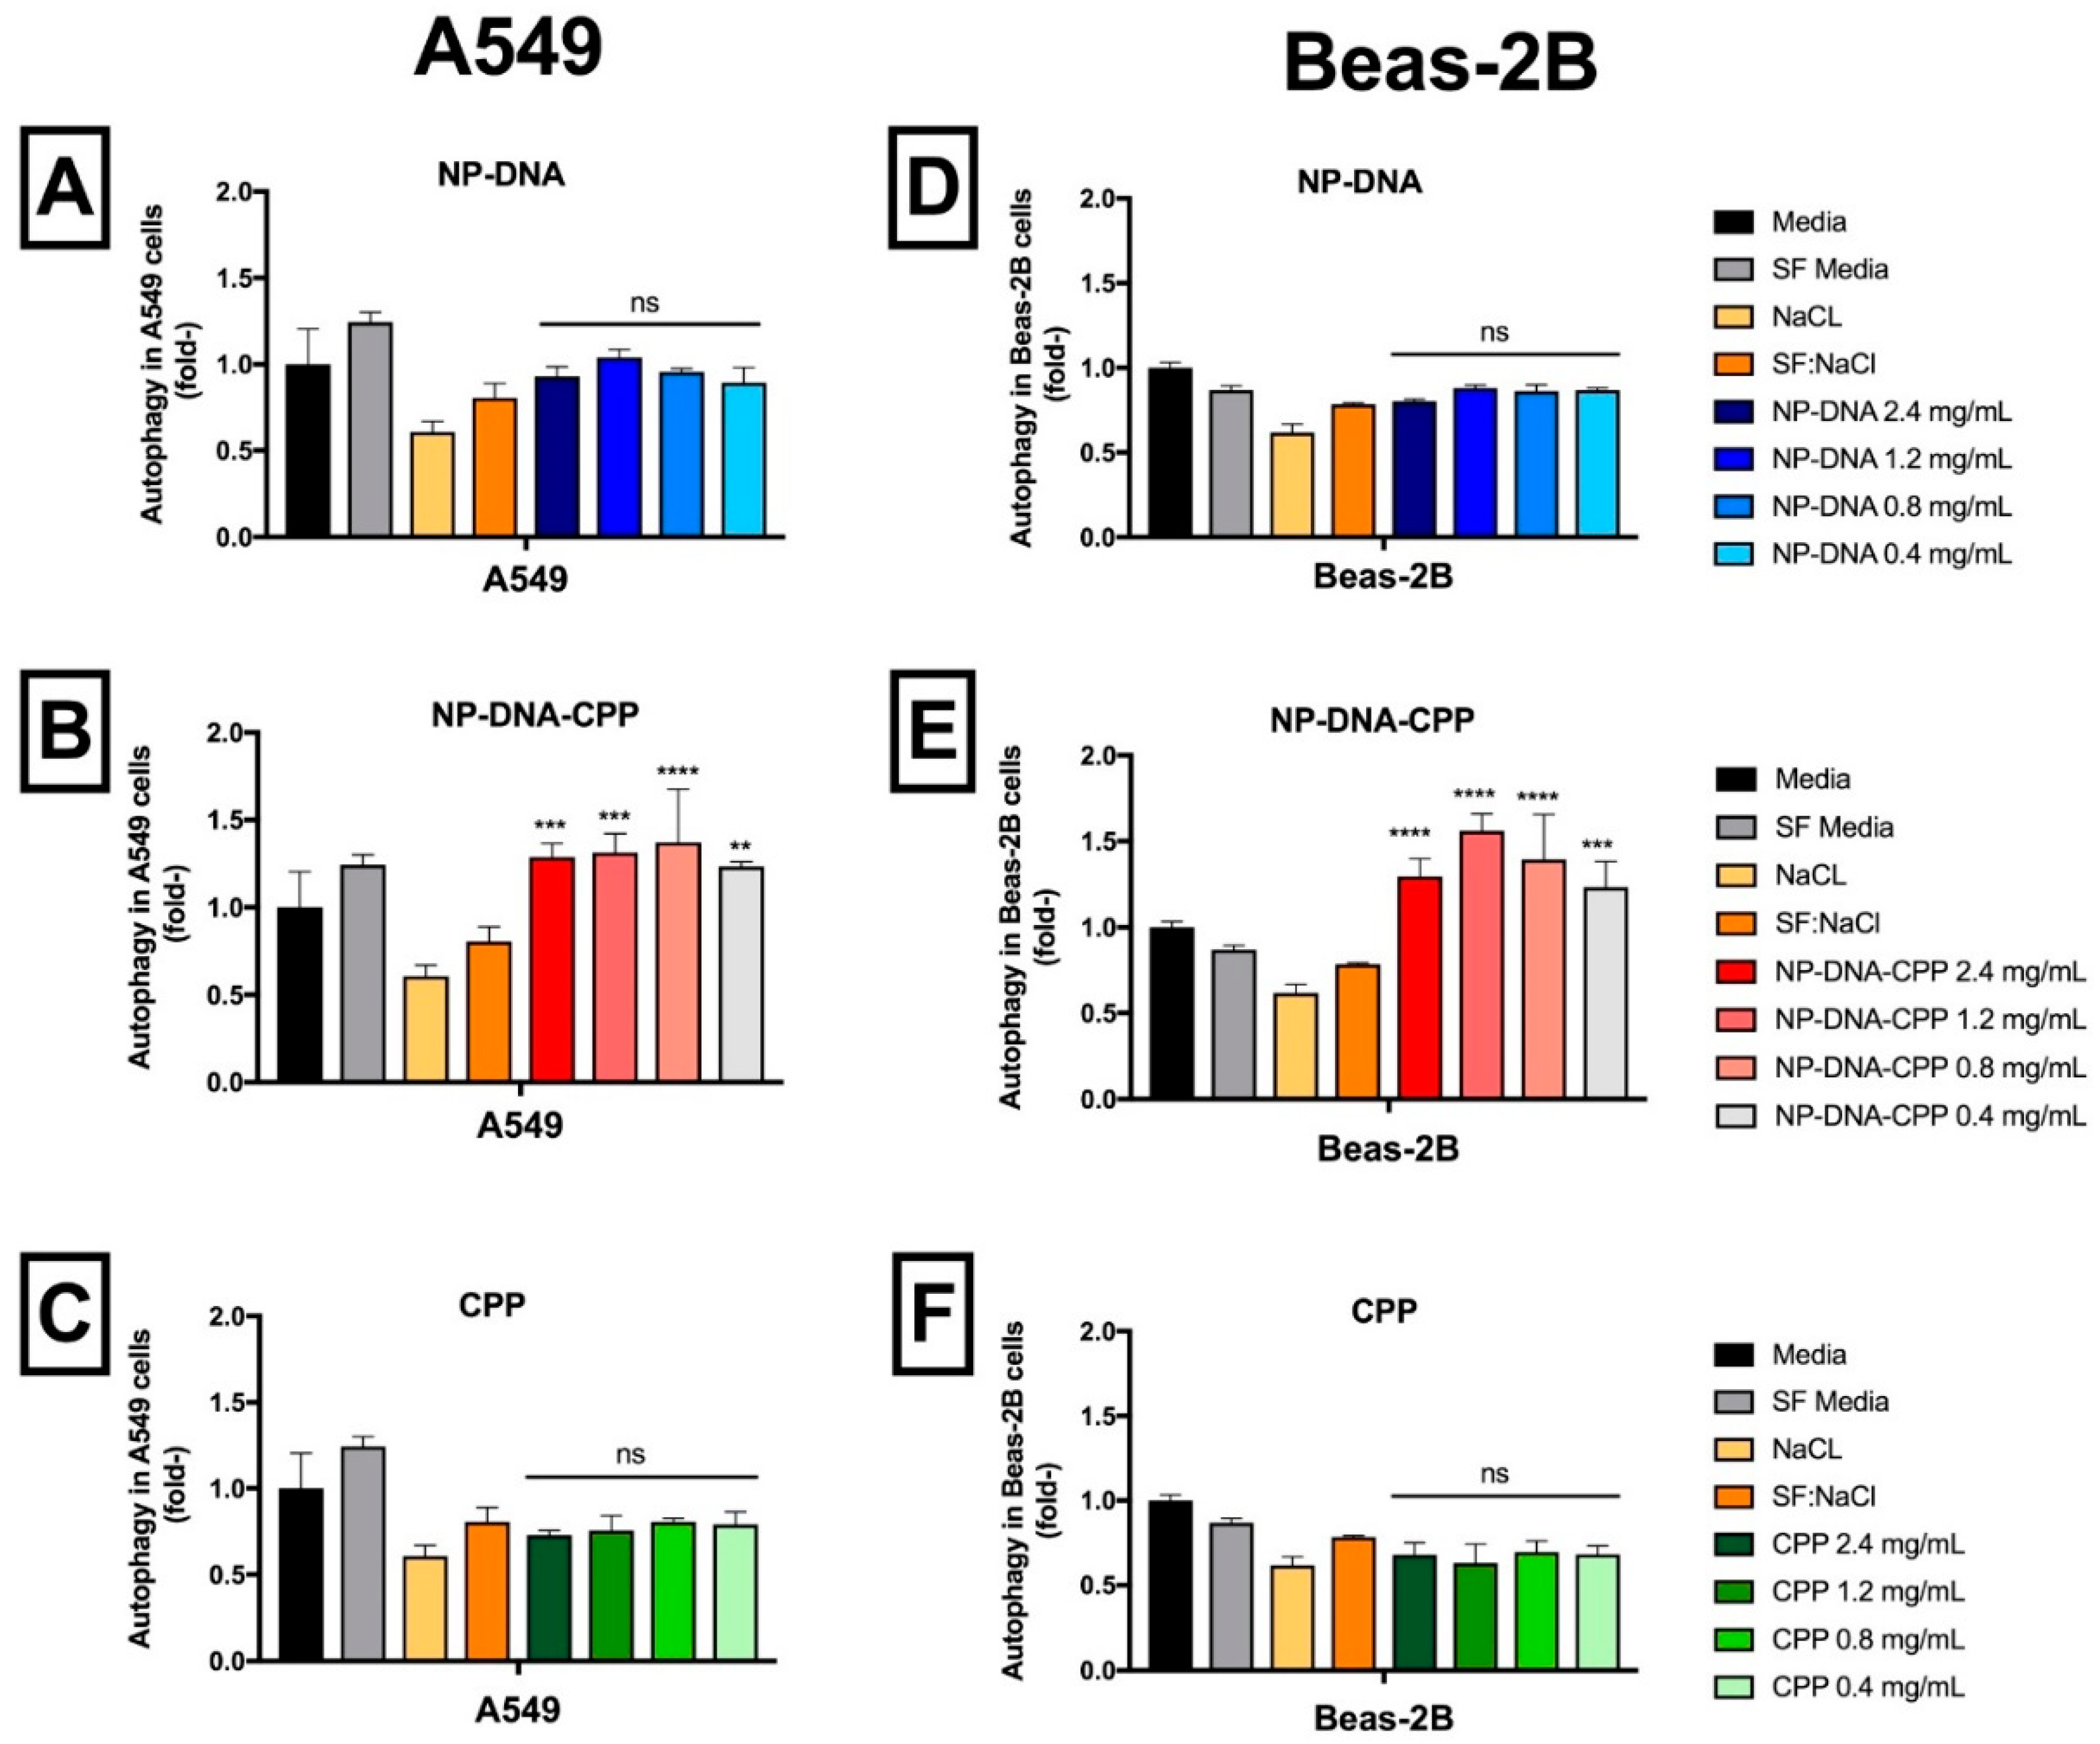
3.10. Autophagy
4. Discussion
4.1. Nanoparticle Characterization and Cytotoxicity
4.2. ROS Production, Inflammatory markers, Apoptosis, Nuclei Morphology and Autophagy
5. Conclusions
Supplementary Materials
Author Contributions
Funding
Acknowledgments
Conflicts of Interest
References
- Teo, P.Y.; Cheng, W.; Hedrick, J.L.; Yang, Y.Y. Co-delivery of drugs and plasmid DNA for cancer therapy. Adv. Drug Deliv. Rev. 2016, 98, 41–63. [Google Scholar] [CrossRef] [PubMed]
- Khanna, P.; Ong, C.; Bay, B.H.; Baeg, G.H. Nanotoxicity: An interplay of oxidative stress, inflammation and cell death. Nanomaterials 2015, 5, 1163–1180. [Google Scholar] [CrossRef] [PubMed]
- Ye, J.; Liu, E.; Yu, Z.; Pei, X.; Chen, S.; Zhang, P.; Shin, M.C.; Gong, J.; He, H.; Yang, V.C. Cpp-assisted intracellular drug delivery, what is next? Int. J. Mol. Sci. 2016, 17, 1892. [Google Scholar] [CrossRef] [PubMed]
- Makadia, H.K.; Siegel, S.J. Poly lactic-co-glycolic acid (PLGA) as biodegradable controlled drug delivery carrier. Polymer 2011, 3, 1377–1397. [Google Scholar] [CrossRef] [PubMed]
- Shin, S.W.; Song, I.H.; Um, S.H. Role of physicochemical properties in nanoparticle toxicity. Nanomaterials 2015, 5, 1351–1365. [Google Scholar] [CrossRef] [PubMed]
- Khalili Fard, J.; Jafari, S.; Eghbal, M.A. A review of molecular mechanisms involved in toxicity of nanoparticles. Adv. Pharm. Bull. 2015, 5, 447–454. [Google Scholar] [CrossRef] [PubMed]
- Rajanahalli, P.; Stucke, C.J.; Hong, Y. The effects of silver nanoparticles on mouse embryonic stem cell self-renewal and proliferation. Toxicol. Rep. 2015, 2, 758–764. [Google Scholar] [CrossRef] [PubMed] [Green Version]
- Park, M.V.; Neigh, A.M.; Vermeulen, J.P.; de la Fonteyne, L.J.; Verharen, H.W.; Briede, J.J.; van Loveren, H.; de Jong, W.H. The effect of particle size on the cytotoxicity, inflammation, developmental toxicity and genotoxicity of silver nanoparticles. Biomaterials 2011, 32, 9810–9817. [Google Scholar] [CrossRef]
- Alton, E.W.F.W.; Armstrong, D.K.; Ashby, D.; Bayfield, K.J.; Bilton, D.; Bloomfield, E.V.; Boyd, A.C.; Brand, J.; Buchan, R.; Calcedo, R.; et al. Repeated nebulisation of non-viral cftr gene therapy in patients with cystic fibrosis: A randomised, double-blind, placebo-controlled, phase 2b trial. Lancet Respir. Med. 2015, 3, 684–691. [Google Scholar] [CrossRef]
- Gomes Dos Reis, L.; Svolos, M.; Hartwig, B.; Windhab, N.; Young, P.M.; Traini, D. Inhaled gene delivery: A formulation and delivery approach. Expert Opin. Drug Deliv. 2017, 14, 319–330. [Google Scholar] [CrossRef]
- Fu, P.P.; Xia, Q.; Hwang, H.-M.; Ray, P.C.; Yu, H. Mechanisms of nanotoxicity: Generation of reactive oxygen species. J. Food Drug Anal. 2014, 22, 64–75. [Google Scholar] [CrossRef] [PubMed] [Green Version]
- Wang, Y.; Santos, A.; Evdokiou, A.; Losic, D. An overview of nanotoxicity and nanomedicine research: Principles, progress and implications for cancer therapy. J. Mater. Chem. B 2015, 3, 7153–7172. [Google Scholar] [CrossRef]
- Kim, J.A.; Aberg, C.; Salvati, A.; Dawson, K.A. Role of cell cycle on the cellular uptake and dilution of nanoparticles in a cell population. Nat. Nanotechnol. 2011, 7, 62–68. [Google Scholar] [CrossRef] [PubMed]
- Kajstura, M.; Halicka, H.D.; Pryjma, J.; Darzynkiewicz, Z. Discontinuous fragmentation of nuclear DNA during apoptosis revealed by discrete “sub-g1” peaks on DNA content histograms. Cytom. A 2007, 71, 125–131. [Google Scholar] [CrossRef] [PubMed]
- Eidet, J.R.; Pasovic, L.; Maria, R.; Jackson, C.J.; Utheim, T.P. Objective assessment of changes in nuclear morphology and cell distribution following induction of apoptosis. Diagn. Pathol. 2014, 9, 92. [Google Scholar] [CrossRef] [PubMed] [Green Version]
- Zhang, B.; Sai Lung, P.; Zhao, S.; Chu, Z.; Chrzanowski, W.; Li, Q. Shape dependent cytotoxicity of plga-peg nanoparticles on human cells. Sci. Rep. 2017, 7, 7315. [Google Scholar] [CrossRef] [PubMed]
- Toy, R.; Roy, K. Engineering nanoparticles to overcome barriers to immunotherapy. Bioeng. Transl. Med. 2016, 1, 47–62. [Google Scholar] [CrossRef] [Green Version]
- Xiong, S.; George, S.; Yu, H.; Damoiseaux, R.; France, B.; Ng, K.W.; Loo, J.S. Size influences the cytotoxicity of poly (lactic-co-glycolic acid) (PLGA) and titanium dioxide (tio(2)) nanoparticles. Arch. Toxicol. 2013, 87, 1075–1086. [Google Scholar] [CrossRef]
- Grabowski, N.; Hillaireau, H.; Vergnaud, J.; Santiago, L.A.; Kerdine-Romer, S.; Pallardy, M.; Tsapis, N.; Fattal, E. Toxicity of surface-modified plga nanoparticles toward lung alveolar epithelial cells. Int. J. Pharm. 2013, 454, 686–694. [Google Scholar] [CrossRef]
- Platel, A.; Carpentier, R.; Becart, E.; Mordacq, G.; Betbeder, D.; Nesslany, F. Influence of the surface charge of plga nanoparticles on their in vitro genotoxicity, cytotoxicity, ros production and endocytosis. J. Appl. Toxicol. 2016, 36, 434–444. [Google Scholar] [CrossRef]
- Claudia, M.; Kristin, O.; Jennifer, O.; Eva, R.; Eleonore, F. Comparison of fluorescence-based methods to determine nanoparticle uptake by phagocytes and non-phagocytic cells in vitro. Toxicology 2017, 378, 25–36. [Google Scholar] [CrossRef] [PubMed]
- Dailey, L.A.; Jekel, N.; Fink, L.; Gessler, T.; Schmehl, T.; Wittmar, M.; Kissel, T.; Seeger, W. Investigation of the proinflammatory potential of biodegradable nanoparticle drug delivery systems in the lung. Toxicol. Appl. Pharmacol. 2006, 215, 100–108. [Google Scholar] [CrossRef] [PubMed]
- Calarco, A.; Bosetti, M.; Margarucci, S.; Fusaro, L.; Nicoli, E.; Petillo, O.; Cannas, M.; Galderisi, U.; Peluso, G. The genotoxicity of pei-based nanoparticles is reduced by acetylation of polyethylenimine amines in human primary cells. Toxicol. Lett. 2013, 218, 10–17. [Google Scholar] [CrossRef] [PubMed]
- Yang, D.; Elner, S.G.; Bian, Z.M.; Till, G.O.; Petty, H.R.; Elner, V.M. Pro-inflammatory cytokines increase reactive oxygen species through mitochondria and nadph oxidase in cultured rpe cells. Exp. Eye Res. 2007, 85, 462–472. [Google Scholar] [CrossRef] [PubMed]
- Mittal, M.; Siddiqui, M.R.; Tran, K.; Reddy, S.P.; Malik, A.B. Reactive oxygen species in inflammation and tissue injury. Antioxid. Redox Signal. 2014, 20, 1126–1167. [Google Scholar] [CrossRef]
- Sha, Q.; Truong-Tran, A.Q.; Plitt, J.R.; Beck, L.A.; Schleimer, R.P. Activation of airway epithelial cells by toll-like receptor agonists. Am. J. Respir. Cell Mol. Biol. 2004, 31, 358–364. [Google Scholar] [CrossRef] [PubMed]
- MacRedmond, R.; Greene, C.; Taggart, C.C.; McElvaney, N.; O’Neill, S. Respiratory epithelial cells require toll-like receptor 4 for induction of human beta-defensin 2 by lipopolysaccharide. Respir. Res. 2005, 6, 116. [Google Scholar] [CrossRef]
- Bexiga, M.G.; Varela, J.A.; Wang, F.; Fenaroli, F.; Salvati, A.; Lynch, I.; Simpson, J.C.; Dawson, K.A. Cationic nanoparticles induce caspase 3-, 7- and 9-mediated cytotoxicity in a human astrocytoma cell line. Nanotoxicology 2011, 5, 557–567. [Google Scholar] [CrossRef]
- Halamoda Kenzaoui, B.; Chapuis Bernasconi, C.; Guney-Ayra, S.; Juillerat-Jeanneret, L. Induction of oxidative stress, lysosome activation and autophagy by nanoparticles in human brain-derived endothelial cells. Biochem. J. 2012, 441, 813–821. [Google Scholar] [CrossRef]


| Treatment | A549 Cells (%) | Beas-2B Cells (%) |
|---|---|---|
| Cell Control | 0.94 ± 0.16 | 0.95 ± 0.03 |
| CPP | 1.34 ± 0.52 | 0.85 ± 0.25 |
| NPs | 4.20 ± 0.82 a | 2.53 ± 0.52 b |
| NPs-CPP | 96.76 ± 1.71 c | 83.85 ± 1.21 c |
| Cell Cycle Phases | Beas-2B | |||
|---|---|---|---|---|
| Cell | SF:NaCl | NP-DNA | NP-DNA-CPP | |
| G0/G1 | 51.53 ± 3.34 c | 58.48 ± 3.08 | 54.46 ± 1.33 a | 49.96 ± 1.53 d |
| S | 11.81 ± 1.00 | 9.115 ± 1.76 | 10.48 ±1.19 | 11.00 ± 1.57 |
| G2/M | 35.74 ± 0.51 b | 30.28 ± 1.37 | 34.70 ± 1.03 a | 30.99 ± 0.85 |
| Sub-G1 | 0.95 ± 0.07 | 2.02 ± 0.11 | 1.02 ± 0.03 | 8.27 ± 0.26 d |
| A549 | ||||
| Cell | SF:NaCl | NP-DNA | NP-DNA-CPP | |
| G0/G1 | 62.06 ± 1.41 d | 77.83 ± 0.05 | 74.88 ± 0.89 | 71.08 ± 1.30 c |
| S | 20.20 ± 3.01 d | 6.79 ± 0.25 | 6.52 ± 2.55 | 5.87 ± 0.66 |
| G2/M | 16.54 ± 4.02 | 14.61 ± 1.08 | 18.28 ± 2.31 | 16.33 ± 1.65 |
| Sub-G1 | 0.76 ± 0.40 | 0.70 ± 0.11 | 0.47 ± 0.04 | 7.09 ± 0.39 b |
© 2019 by the authors. Licensee MDPI, Basel, Switzerland. This article is an open access article distributed under the terms and conditions of the Creative Commons Attribution (CC BY) license (http://creativecommons.org/licenses/by/4.0/).
Share and Cite
Gomes dos Reis, L.; Lee, W.-H.; Svolos, M.; Moir, L.M.; Jaber, R.; Windhab, N.; Young, P.M.; Traini, D. Nanotoxicologic Effects of PLGA Nanoparticles Formulated with a Cell-Penetrating Peptide: Searching for a Safe pDNA Delivery System for the Lungs. Pharmaceutics 2019, 11, 12. https://doi.org/10.3390/pharmaceutics11010012
Gomes dos Reis L, Lee W-H, Svolos M, Moir LM, Jaber R, Windhab N, Young PM, Traini D. Nanotoxicologic Effects of PLGA Nanoparticles Formulated with a Cell-Penetrating Peptide: Searching for a Safe pDNA Delivery System for the Lungs. Pharmaceutics. 2019; 11(1):12. https://doi.org/10.3390/pharmaceutics11010012
Chicago/Turabian StyleGomes dos Reis, Larissa, Wing-Hin Lee, Maree Svolos, Lyn Margaret Moir, Rima Jaber, Norbert Windhab, Paul Michael Young, and Daniela Traini. 2019. "Nanotoxicologic Effects of PLGA Nanoparticles Formulated with a Cell-Penetrating Peptide: Searching for a Safe pDNA Delivery System for the Lungs" Pharmaceutics 11, no. 1: 12. https://doi.org/10.3390/pharmaceutics11010012