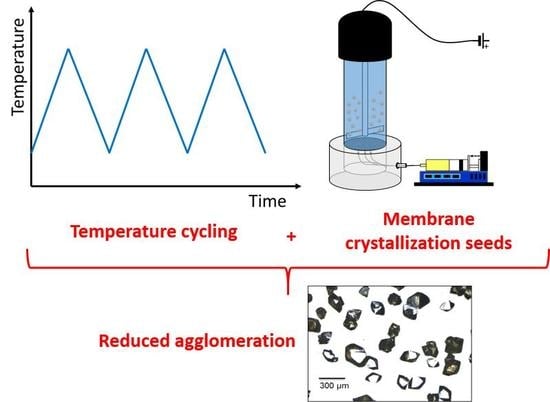
Preventing Crystal Agglomeration of Pharmaceutical Crystals Using Temperature Cycling and a Novel Membrane Crystallization Procedure for Seed Crystal Generation


Abstract
:
1. Introduction
2. Materials and Methods
2.1. Seeded Batch Crystallization Experiments
2.2. Seeds Preparation
2.2.1. Membrane Crystallization
2.2.2. Antisolvent Crystallization
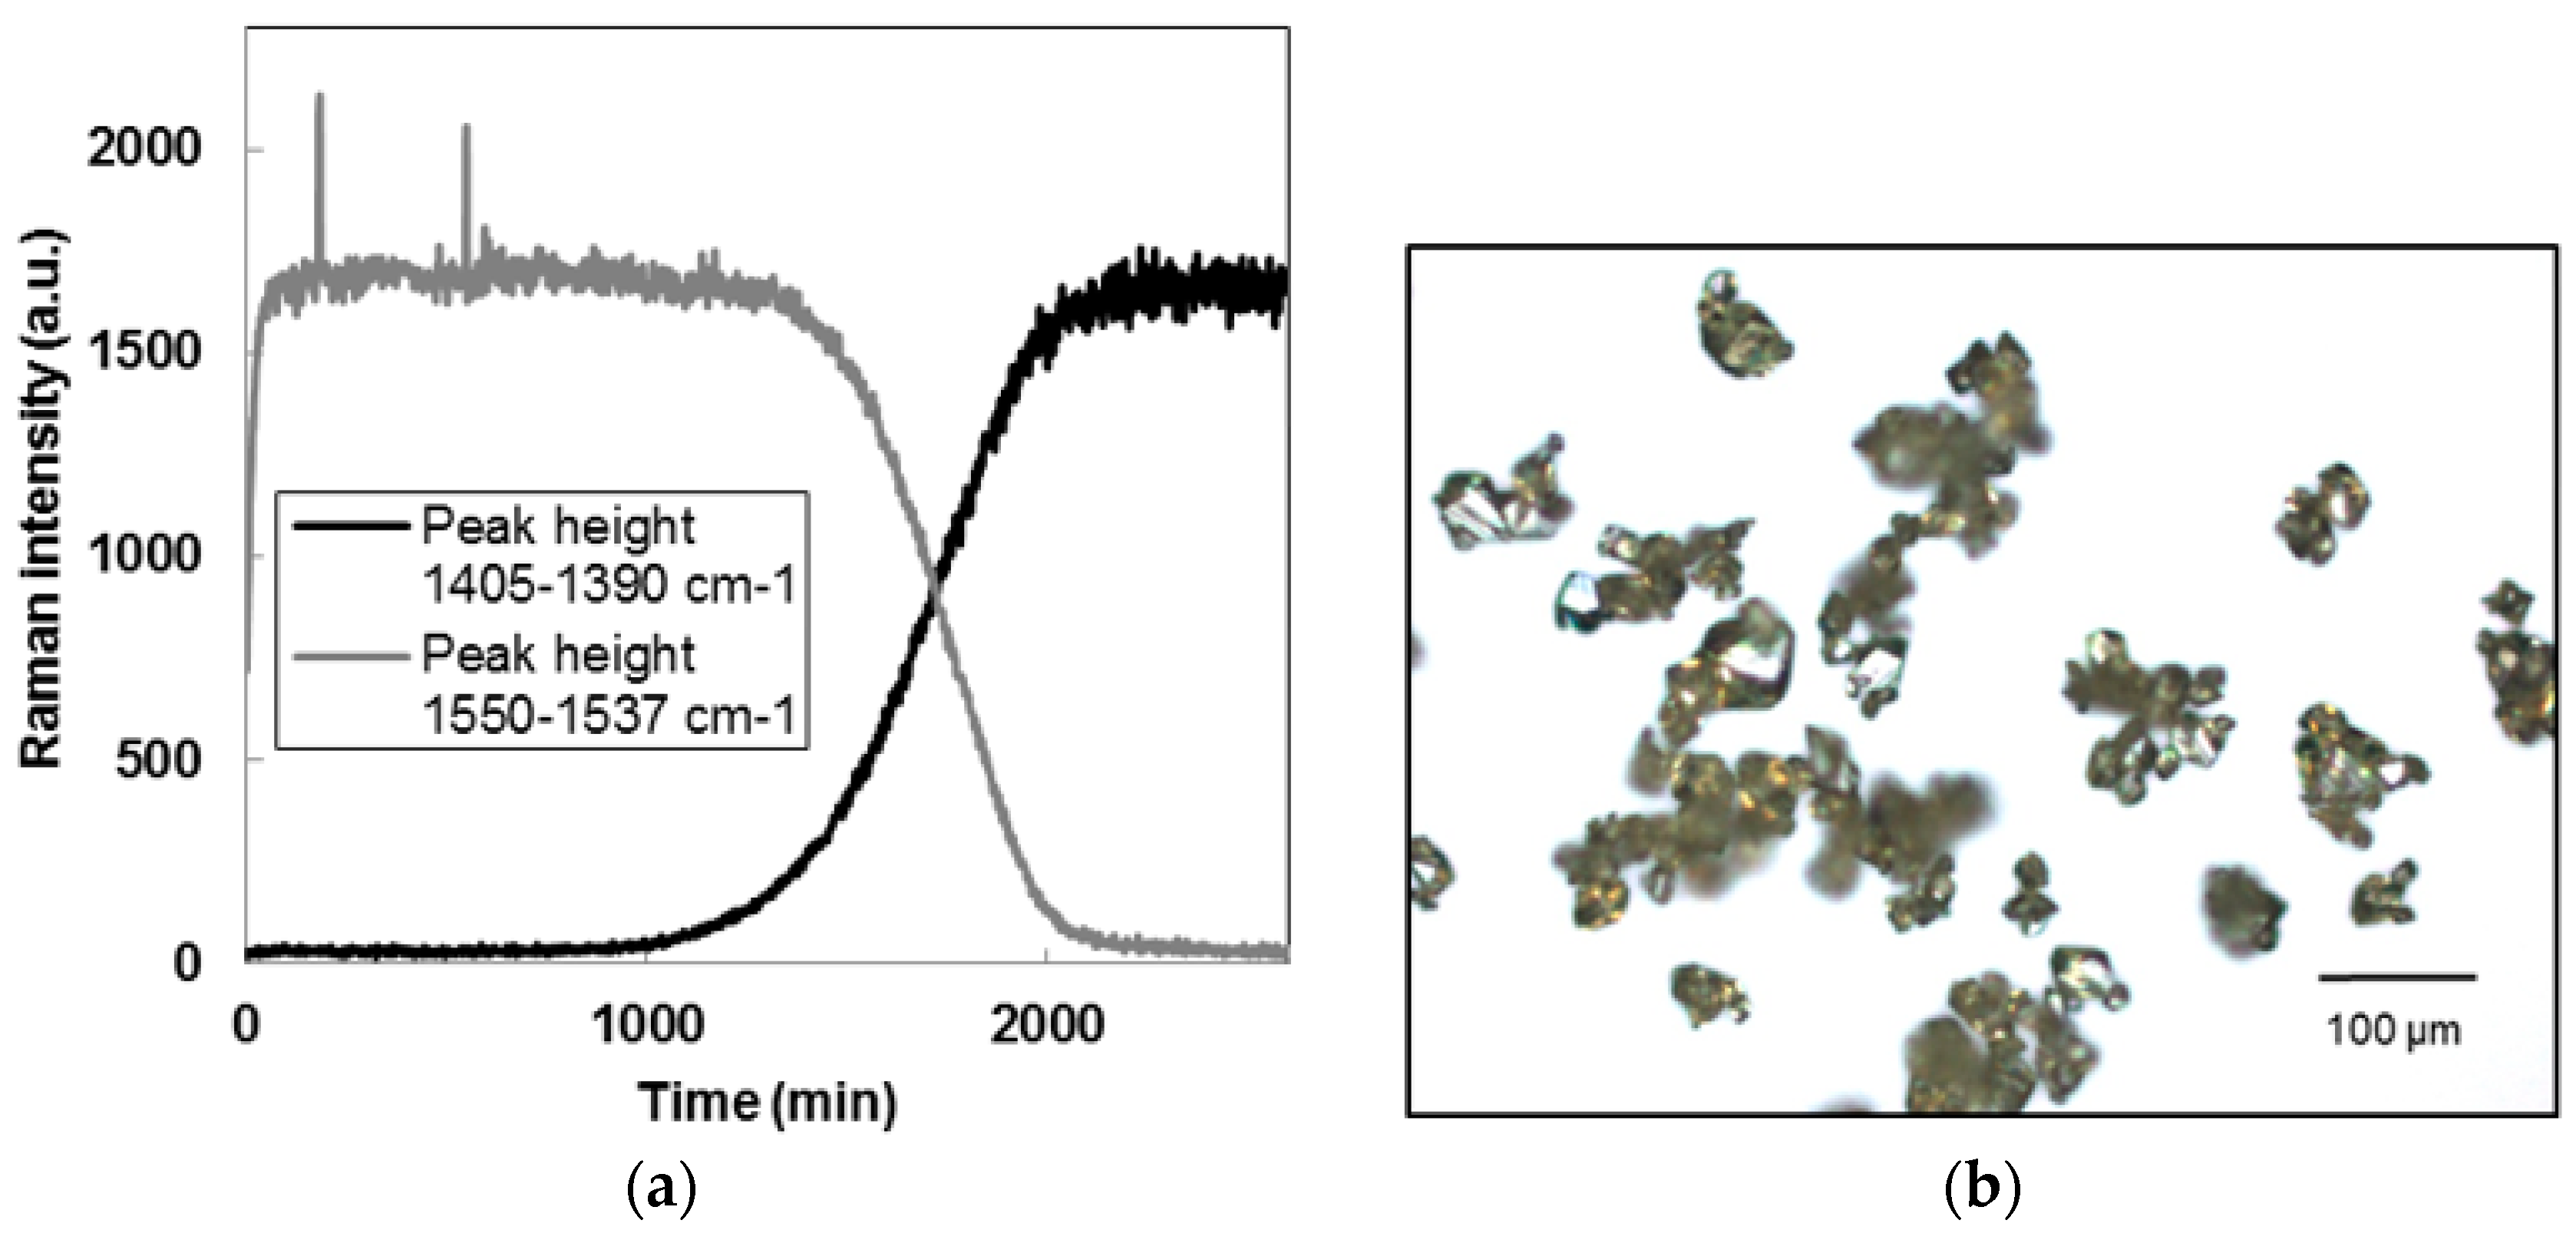
2.2.3. Polymorphic Transformation
2.2.4. Cooling Crystallization
3. Results and Discussion
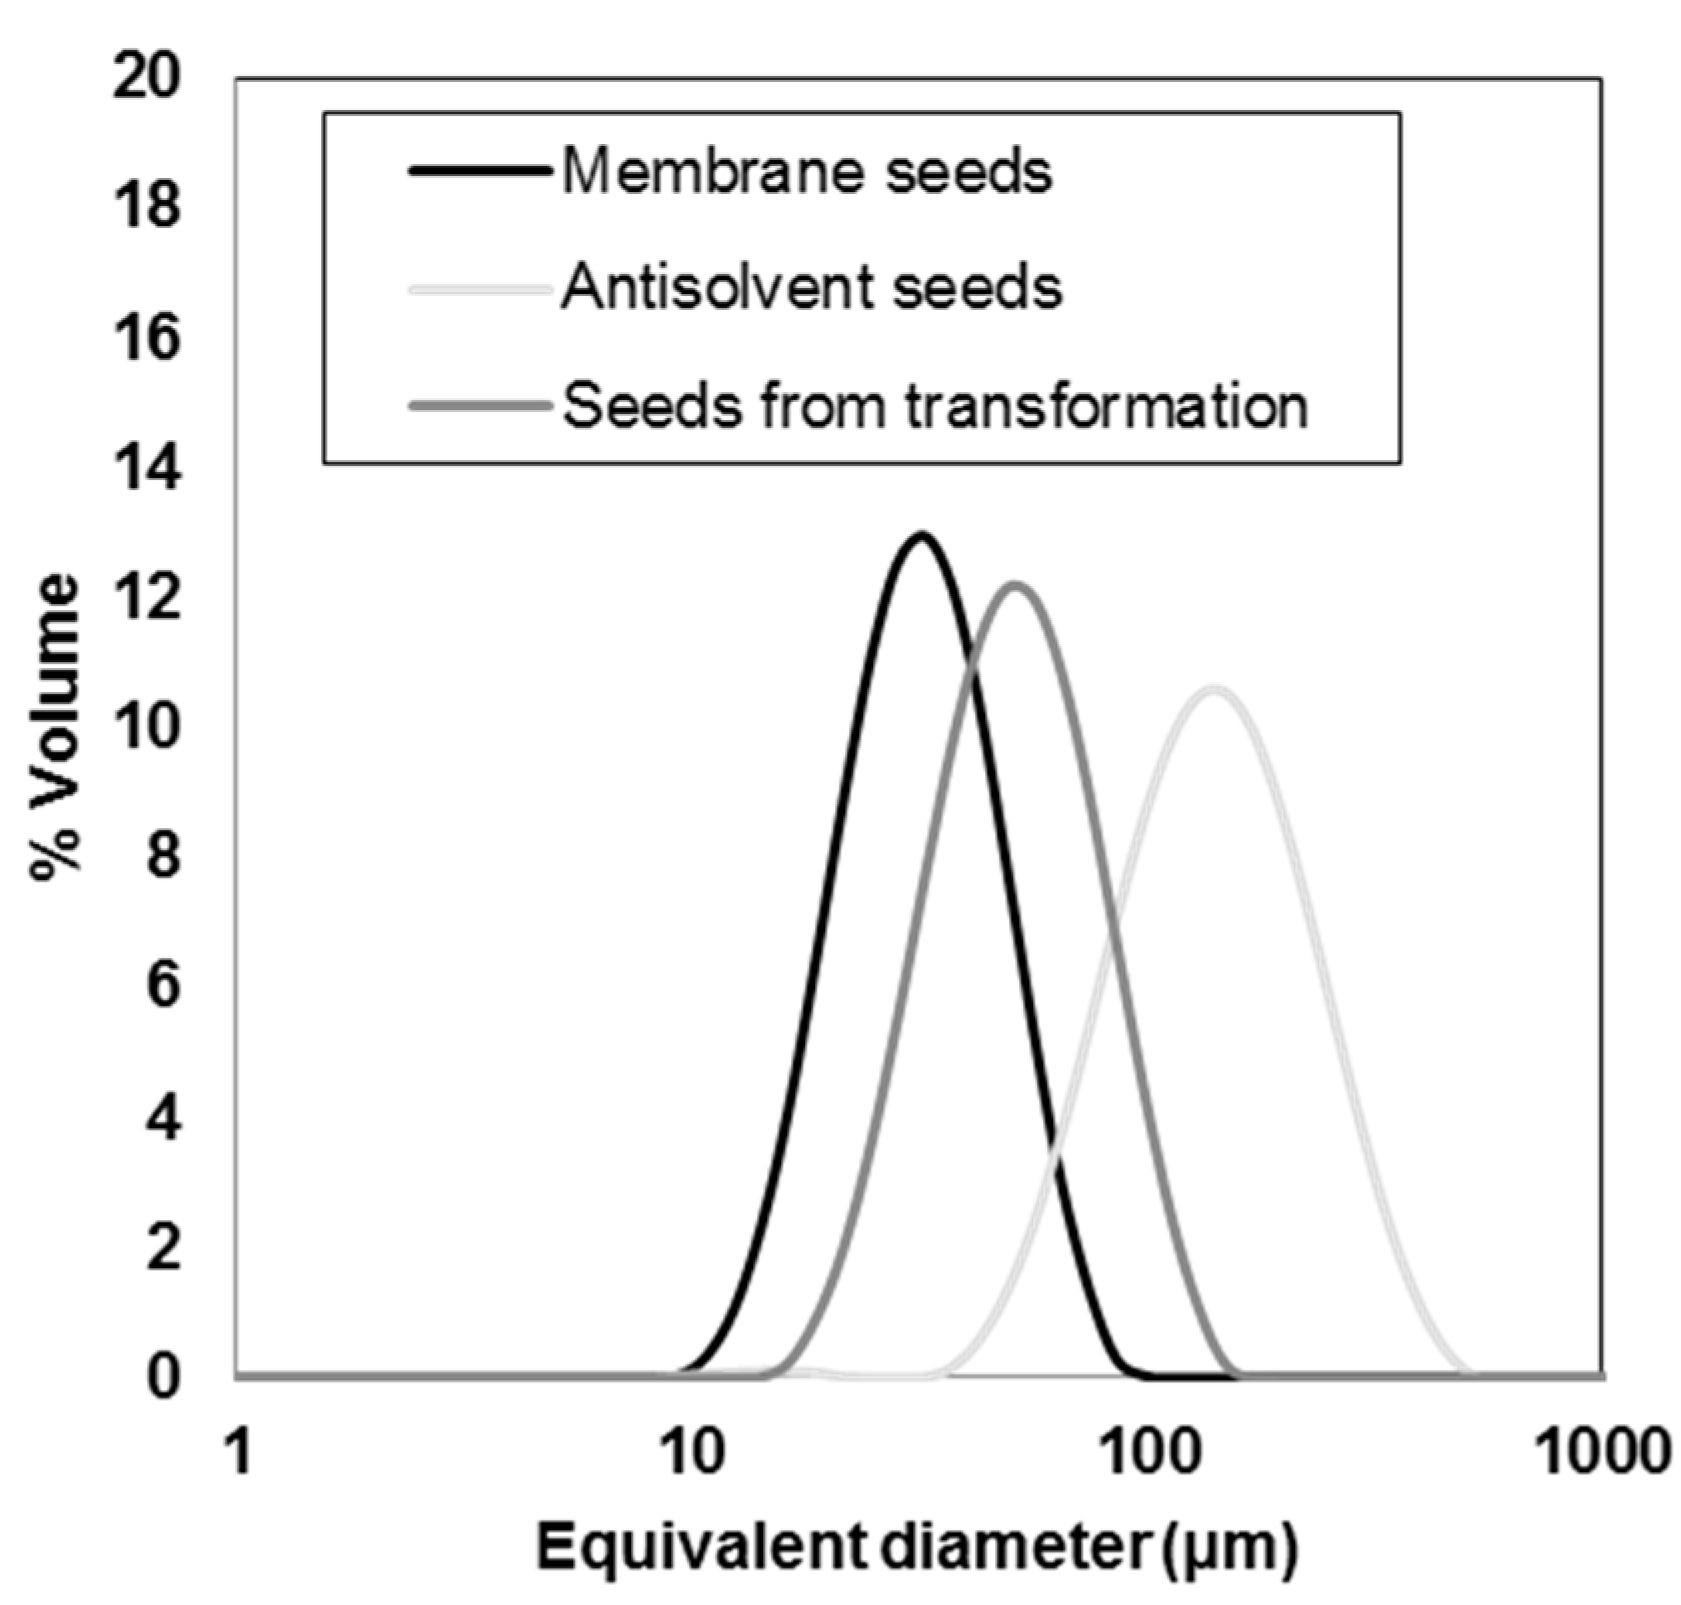
3.1. Seeds Characterization and Comparison
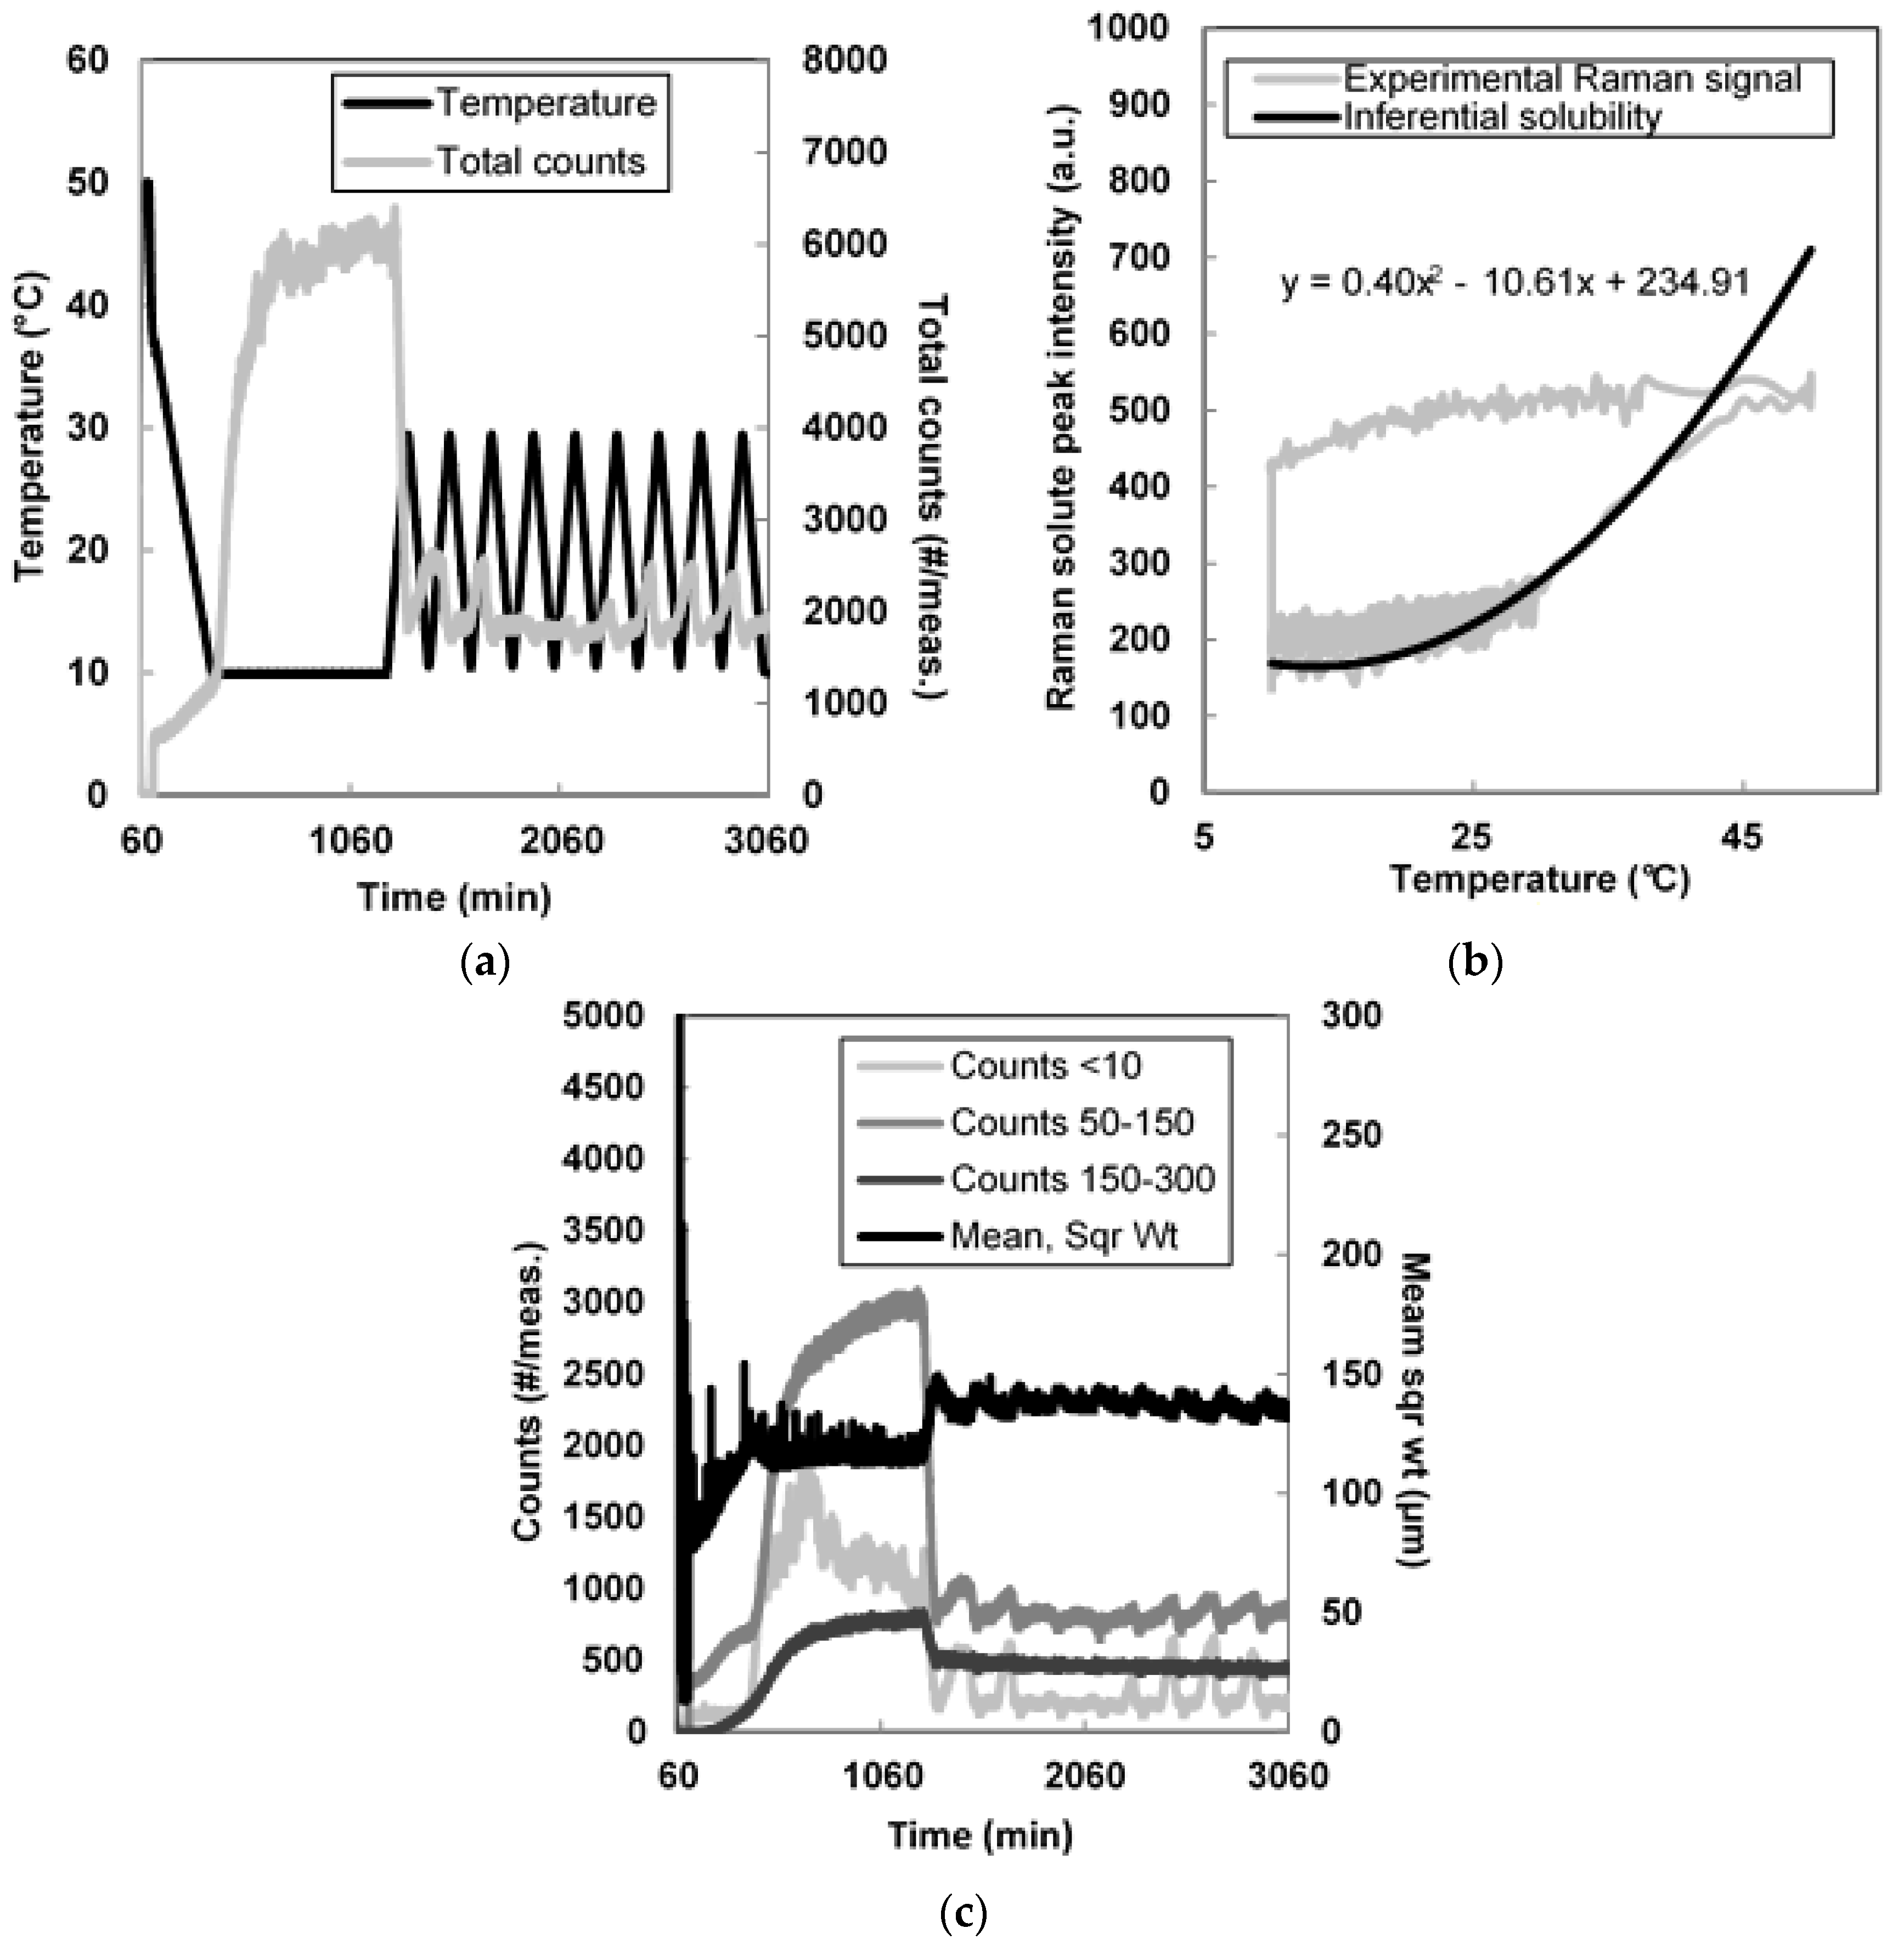
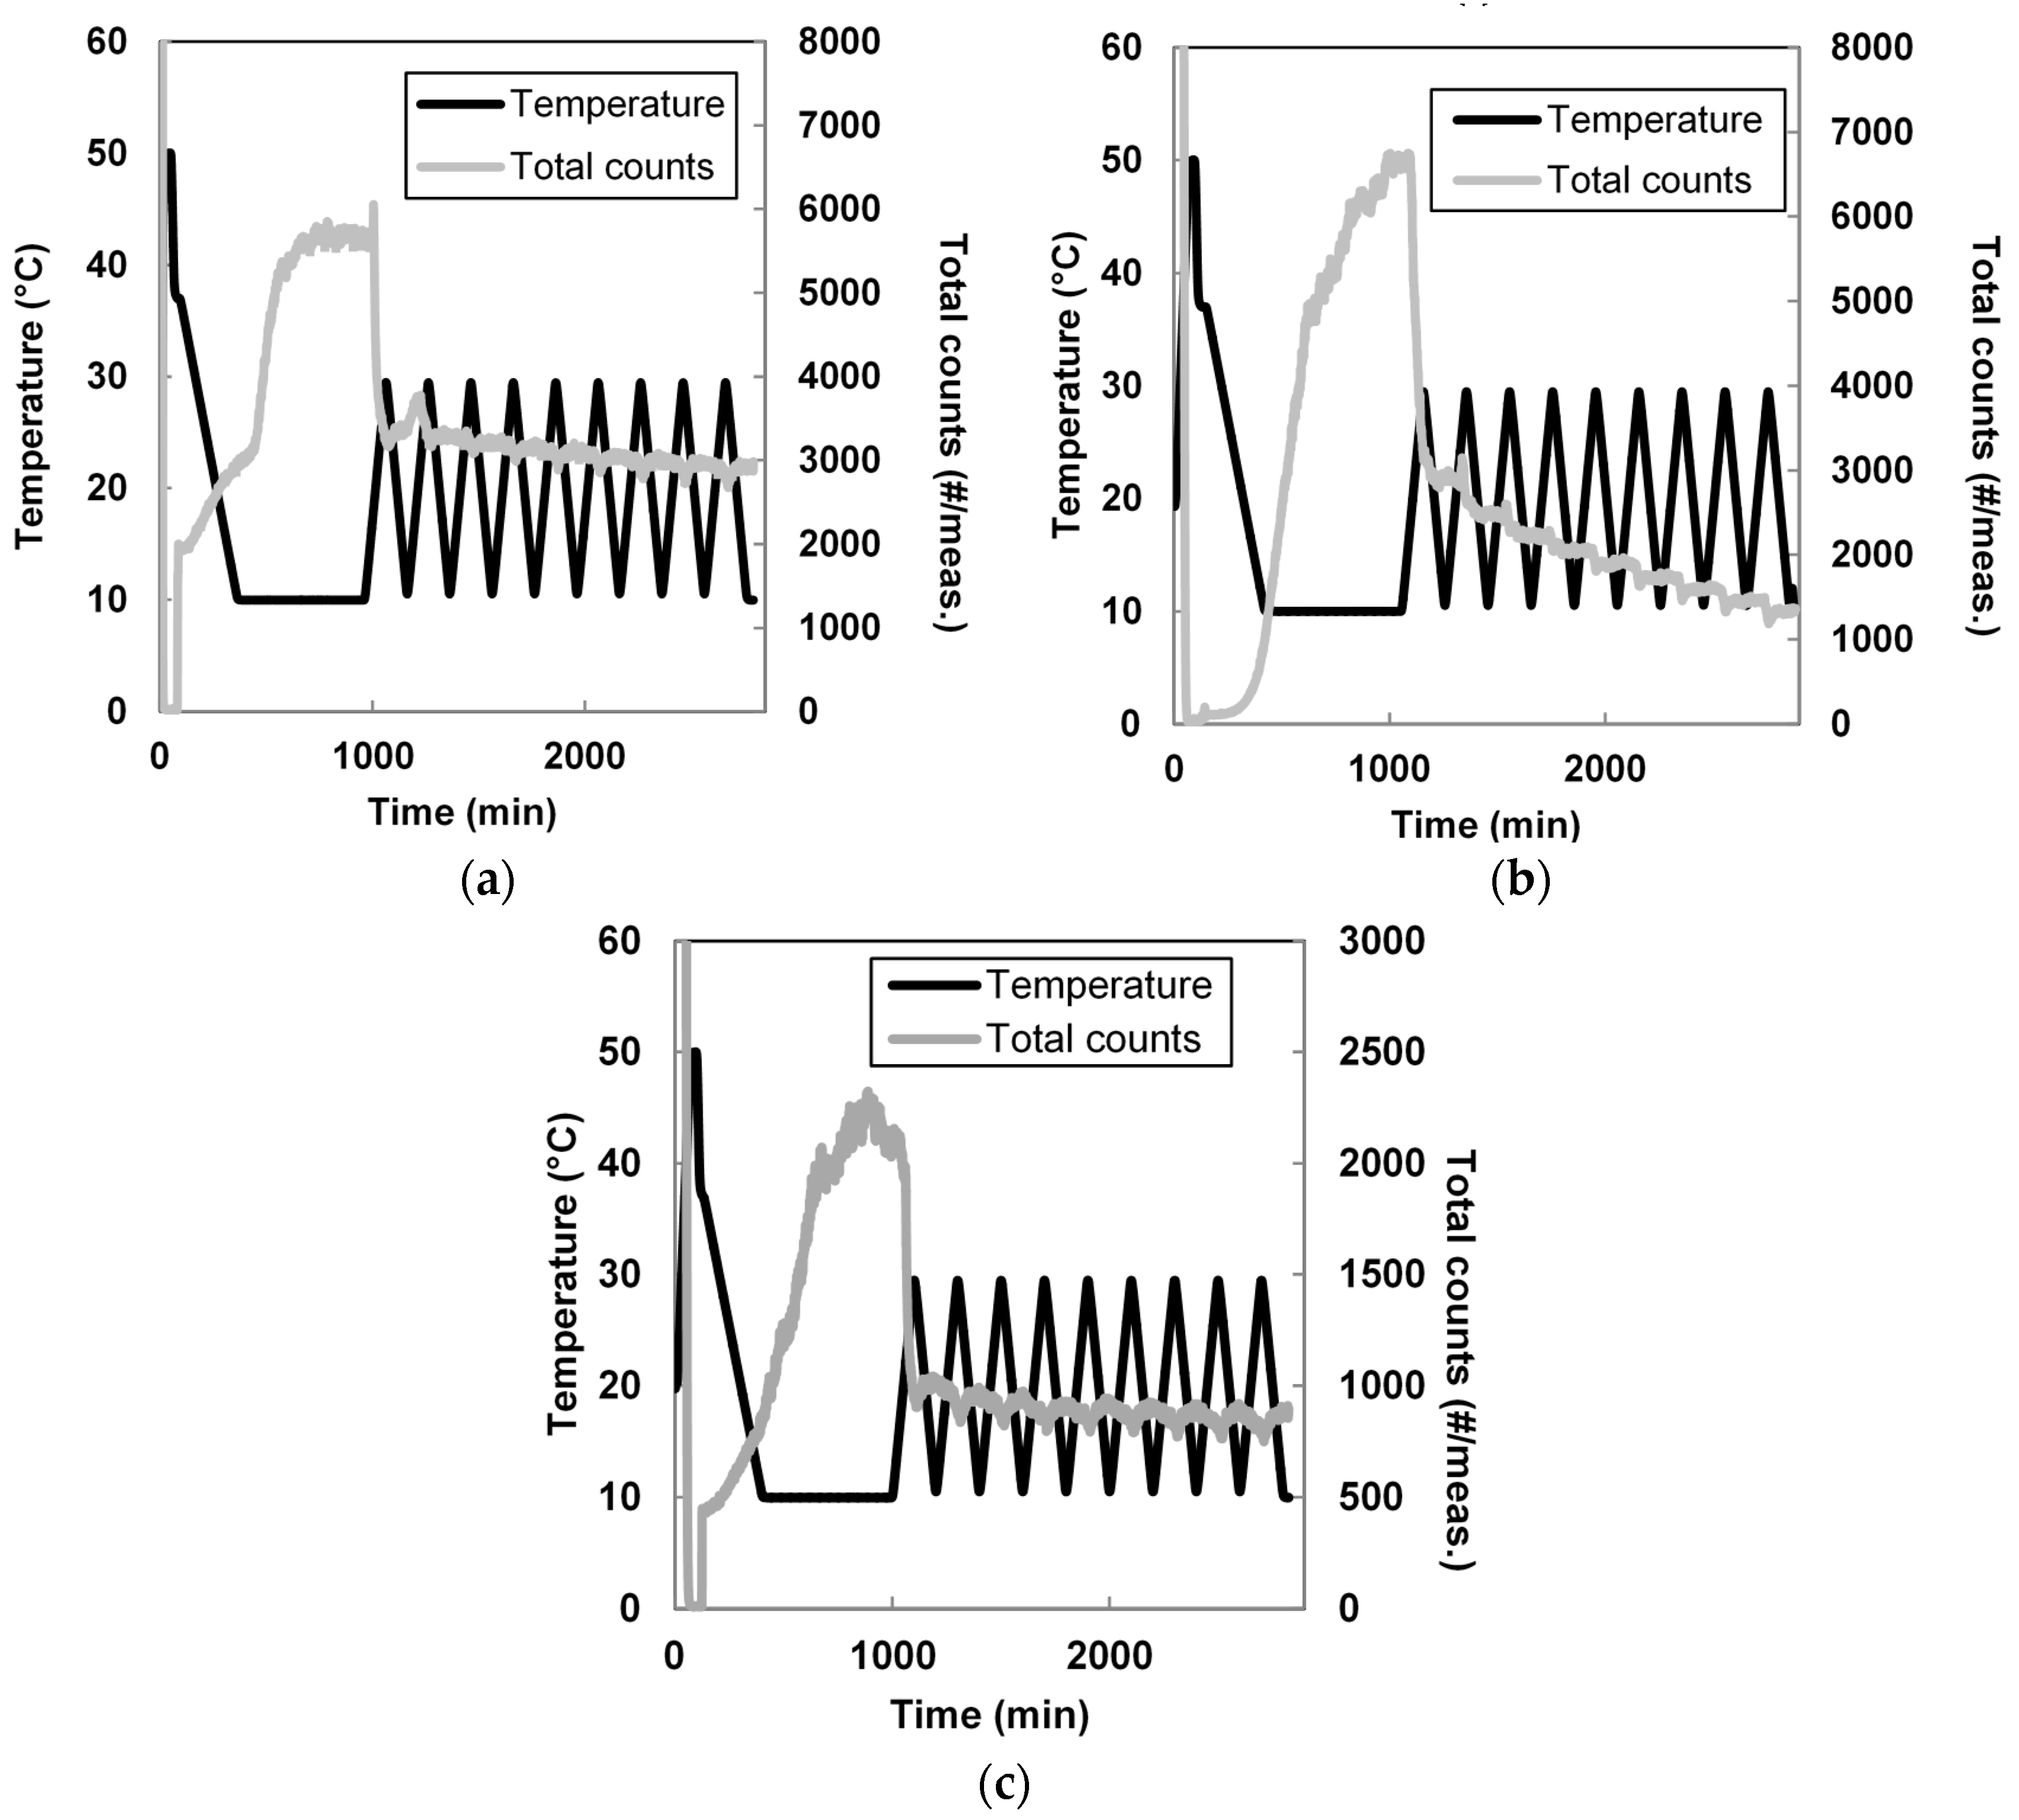
3.2. Seeded Growth Experiments
4. Conclusions
Supplementary Materials
Acknowledgments
Author Contributions
Conflicts of Interest
References
- Ålander, E. Agglomeration of paracetamol during crystallization in pure and mixed solvents. Ind. Eng. Chem. Res. 2004, 43, 629–637. [Google Scholar] [CrossRef]
- Lindenberg, C.; Scholl, J.; Vicum, L.; Mazzotti, M.; Brozio, J. l-Glutamic acid precipitation: Agglomeration effect. Cryst. Growth Des. 2008, 8, 224–237. [Google Scholar] [CrossRef]
- Yu, Z.Q.; Tan, R.B.H.; Chow, P.S. Effects of operating conditions on agglomeration and habit of paracetamol crystals in anti-solvent crystallization. J. Cryst. Growth 2005, 279, 477–488. [Google Scholar] [CrossRef]
- Brunsteiner, M.; Jones, A.G.; Pratola, F.; Price, S.L.; Simons, S.J.R. Toward a molecular understanding of crystal agglomeration. Cryst. Growth Des. 2005, 5, 3–16. [Google Scholar] [CrossRef]
- Ochsenbein, D.R.; Vetter, T.; Morari, M.; Mazzotti, M. Agglomeration of needle-like crystals in suspension. II. Modeling. Cryst. Growth Des. 2015, 15, 4296–4310. [Google Scholar] [CrossRef]
- Saleemi, A.N.; Steele, G.; Pedge, N.I.; Freeman, A.; Nagy, Z.K. Enhancing crystalline properties of a cardiovascular active pharmaceutical ingredient using a process analytical technology based crystallization feedback control strategy. Int. J. Pharm. 2012, 430, 56–64. [Google Scholar] [CrossRef] [PubMed]
- Chow, A.H.L.; Leung, M.W.M. A study of the mechanisms of wet spherical agglomeration of pharmaceutical powders. Drug Dev. Ind. Pharm. 1996, 22, 357–371. [Google Scholar] [CrossRef]
- Kawashima, Y.; Imai, M.; Takeuchi, H.; Yamamoto, H.; Kamiya, K.; Hino, T. Improved flowability and compactibility of spherically agglomerated crystals of ascorbic acid for direct tableting designed by spherical crystallization process. Powder Technol. 2003, 130, 283–289. [Google Scholar] [CrossRef]
- Thati, J. Particle Engineering by Spherical Crystallization: Mechanisms and Influence of Process Conditions. Ph.D. Thesis, KTH Royal Institute of Technology, Stockholm, Sweden, 2011. Available online: http://www.diva-portal.org/smash/record.jsf?pid=diva2:410938 (accessed on 1 July 2016).
- Yoshiura, H.; Nagano, H.; Hirasawa, I. New insights into additive structure effect on crystal agglomeration of L-valine. Chem. Eng. Technol. 2013, 36, 2023–2028. [Google Scholar] [CrossRef]
- Kawashima, Y.; Niwa, T.; Takeuchi, H.; Hino, T.; Itoh, Y.; Furuyama, S. Characterization of polymorphs of tranilast anhydrate and tranilast monohydrate when crystallized by two solvent change spherical crystallization techniques. J. Pharm. Sci. 1991, 80, 472–478. [Google Scholar] [CrossRef] [PubMed]
- Peña, R.; Nagy, Z.K. Process intensification through continuous spherical crystallization using a two-stage mixed suspension mixed product removal (MSMPR) system. Cryst. Growth Des. 2015, 15, 4225–4236. [Google Scholar] [CrossRef]
- Toldy, A.I.; Badruddoza, A.Z.M.; Zheng, L.; Hatton, T.A.; Gunawan, R.; Rajagopalan, R. Spherical crystallization of glycine from monodisperse microfluidic emulsions. Cryst. Growth Des. 2012, 12, 3977–3982. [Google Scholar] [CrossRef]
- Abioye, A.O.; Kola-Mustapha, A.; Ruparelia, K. Impact of in situ granulation and temperature quenching on crystal habit and micromeritic properties of ibuprofen-cationic dextran conjugate crystanules. Int. J. Pharm. 2014, 462, 83–102. [Google Scholar] [CrossRef] [PubMed]
- Abioye, A.O.; Kola-Mustapha, A.; Chi, G.T.; Ilya, S. Quantification of in situ granulation-induced changes in pre-compression, solubility, dose distribution and intrinsic in vitro release characteristics of ibuprofen-cationic dextran conjugate crystanules. Int. J. Pharm. 2014, 471, 453–477. [Google Scholar] [CrossRef] [PubMed]
- Abioye, A.O.; Chi, G.T.; Simone, E.; Nagy, Z.K. Real-time monitoring of the mechanism of ibuprofen-cationic dextran crystanule formation using crystallization process informatics system (CryPRINS). Int. J. Pharm. 2016, 509, 264–278. [Google Scholar] [CrossRef] [PubMed]
- Chabanon, E.; Mangin, D.; Charcosset, C. Membranes and crystallization processes: State of the art and prospects. J. Member. Sci. 2016, 509, 57–67. [Google Scholar] [CrossRef]
- Kober, P.A. Pervaporation, perstillation and percrystallization. J. Member. Sci. 1995, 100, 61–64. [Google Scholar] [CrossRef]
- Wu, Y.; Kong, Y.; Liu, J.; Zhang, J.; Xu, J. An experimental study on membrane distillation-crystallization for treating waste water in taurine production. Desalination 1991, 80, 235–242. [Google Scholar] [CrossRef]
- Azoury, R.; Garside, J.; Robertson, W.G. Crystallization processes using reverse osmosis. J. Cryst. Growth 1986, 79, 654–657. [Google Scholar] [CrossRef]
- Zhang, X.; Zhang, P.; Wei, K.; Wang, Y.; Ma, R. The study of continuous membrane crystallization on lysozyme. Desalination 2008, 219, 101–117. [Google Scholar] [CrossRef]
- Curcio, E.; Di Profio, G.; Drioli, E. Membrane crystallization of macromolecular solutions. Desalination 2002, 145, 173–177. [Google Scholar] [CrossRef]
- Di Profio, G.; Di Curcio, E.; Cassetta, A.; Lamba, D.; Drioli, E. Membrane crystallization of lysozyme: Kinetic aspects. J. Cryst. Growth 2003, 257, 359–369. [Google Scholar] [CrossRef]
- Di Profio, G.; Fontanova, E.; Curcio, E.; Drioli, E. From tailored supports to controlled nucleation: Exploring material chemistry, surface nanostructure, and wetting regime effects in heterogeneous nucleation of organic molecules. Cryst. Growth Des. 2012, 12, 3749–3757. [Google Scholar] [CrossRef]
- Caridi, A.; Di Profio, G.; Caliandro, R.; Guagliardi, A.; Curcio, E.; Drioli, E. Selecting the desired solid form by membrane crystallizers: Crystals or cocrystals. Cryst. Growth Des. 2012, 12, 4349–4356. [Google Scholar] [CrossRef]
- Di Profio, G.; Curcio, E.; Ferraro, S.; Stabile, C.; Drioli, E. Effect of supersaturation control and heterogeneous nucleation on porous membrane surfaces in the crystallization of l-glutamic acid polymorphs. Cryst. Growth Des. 2009, 9, 2179–2186. [Google Scholar] [CrossRef]
- Hansen, T.B.; Qu, H. Formation of Piroxicam polymorphism in solution crystallization: Effect and interplay of operation parameters. Cryst. Growth Des. 2015, 15, 4694–4700. [Google Scholar] [CrossRef]
- Othman, R.; Vladisavljević, G.T.; Simone, E.; Holdich, R.G. Preparation of microcrystals of piroxicam monohydrate by antisolvent precipitation via microfabricated metallic membranes with ordered pore arrays. Cryst. Growth Des. 2017, 17, 6692–6702. [Google Scholar] [CrossRef] [PubMed]
- Othman, R. Production of Functional Pharmaceutical Nano/Micro-Particles by Solvent Displacement Method Using Advanced Micro-Engineered Dispersion Devices. Ph.D. Thesis, Loughborough University, Loughborough, UK, 2016. [Google Scholar]
- Liu, G.; Hansen, T.B.; Qu, H.; Yang, M.; Pajander, J.P.; Rantanen, J.; Christensen, L.P. Crystallization of piroxicam solid forms and the effects of additives. Chem. Eng. Technol. 2014, 37, 1297–1304. [Google Scholar] [CrossRef]
- Abu Bakar, M.R.; Nagy, Z.K.; Saleemi, A.N.; Rielly, C.D. The impact of direct nucleation control on crystal size distribution in pharmaceutical crystallization processes. Cryst. Growth Des. 2009, 9, 1378–1384. [Google Scholar] [CrossRef]
- Saleemi, A.N.; Rielly, C.D.; Nagy, Z.K. Comparative investigation of supersaturation and automated direct nucleation control of crystal size distribution using ATR-Uv/Vis spectroscopy and FBRM. Cryst. Growth Des. 2012, 12, 1792–1807. [Google Scholar] [CrossRef]
- Yang, Y.; Song, L.; Nagy, Z.K. Automated direct nucleation control in continuous mixed suspension mixed product removal cooling crystallization. Cryst. Growth Des. 2015, 15, 5839–5848. [Google Scholar] [CrossRef]
- Kacker, R.; Salvador, P.M.; Sturm, G.S.J.; Stefanidis, G.D.; Lakerveld, R.; Nagy, Z.K. Microwave Assisted Direct Nucleation Control for Batch Crystallization: Crystal Size Control with Reduced Batch Time. Cryst. Growth Des. 2016, 16, 440–446. [Google Scholar] [CrossRef]
- Simone, E.; Zhang, W.; Nagy, Z.K. Application of process analytical technology-based feedback control strategies to improve purity and size distribution in biopharmaceutical crystallization. Cryst. Growth Des. 2015, 15, 2908–2919. [Google Scholar] [CrossRef]
- Morelli, S.; Holdich, R.G.; Dragosavac, M.M. Chitosan and Poly (Vinyl Alcohol) microparticles produced by membrane emulsification for encapsulation and pH controlled release. Chem. Eng. J. 2016, 288, 451–460. [Google Scholar] [CrossRef]
- Imbrogno, A.; Dragosavac, M.M.; Piacentini, E.; Vladisavljević, G.T.; Holdich, R.G.; Giorno, L. Polycaprolactone multicore-matrix particle for the simultaneous encapsulation of hydrophilic and hydrophobic compounds produced by membrane emulsification and solvent diffusion processes. Colloids Surf. B Biointerfaces 2015, 135, 116–125. [Google Scholar] [CrossRef] [PubMed] [Green Version]
- Vladisavljević, G.T.; Wang, B.; Dragosavac, M.M.; Holdich, R.G. Production of food-grade multiple emulsions with high encapsulation yield using oscillating membrane emulsification. Colloids Surf. A Physicochem. Eng. Asp. 2014, 458, 78–84. [Google Scholar] [CrossRef] [Green Version]


| Seeds Type | d(0.1) (µm) | d(0.5) (µm) | d(0.9) (µm) | Span(-) | D[4,3] (µm) | D[3,2] (µm) |
|---|---|---|---|---|---|---|
| Membrane | 19.8 ± 1.23 | 32.5 ± 1.85 | 53.1 ± 3.62 | 1.03 ± 0.07 | 34.8 ± 4.25 | 30.2 ± 1.73 |
| Transformation | 28.8 ± 0.49 | 50.6 ± 0.83 | 87.5 ± 1.45 | 1.16 ± 0.002 | 55.0 ± 0.90 | 46.0 ± 0.78 |
| Antisolvent | 65.6 ± 0.05 | 121 ± 3.39 | 220.9 ± 12.85 | 1.28 ± 0.07 | 134 ± 5.15 | 101 ± 2.67 |
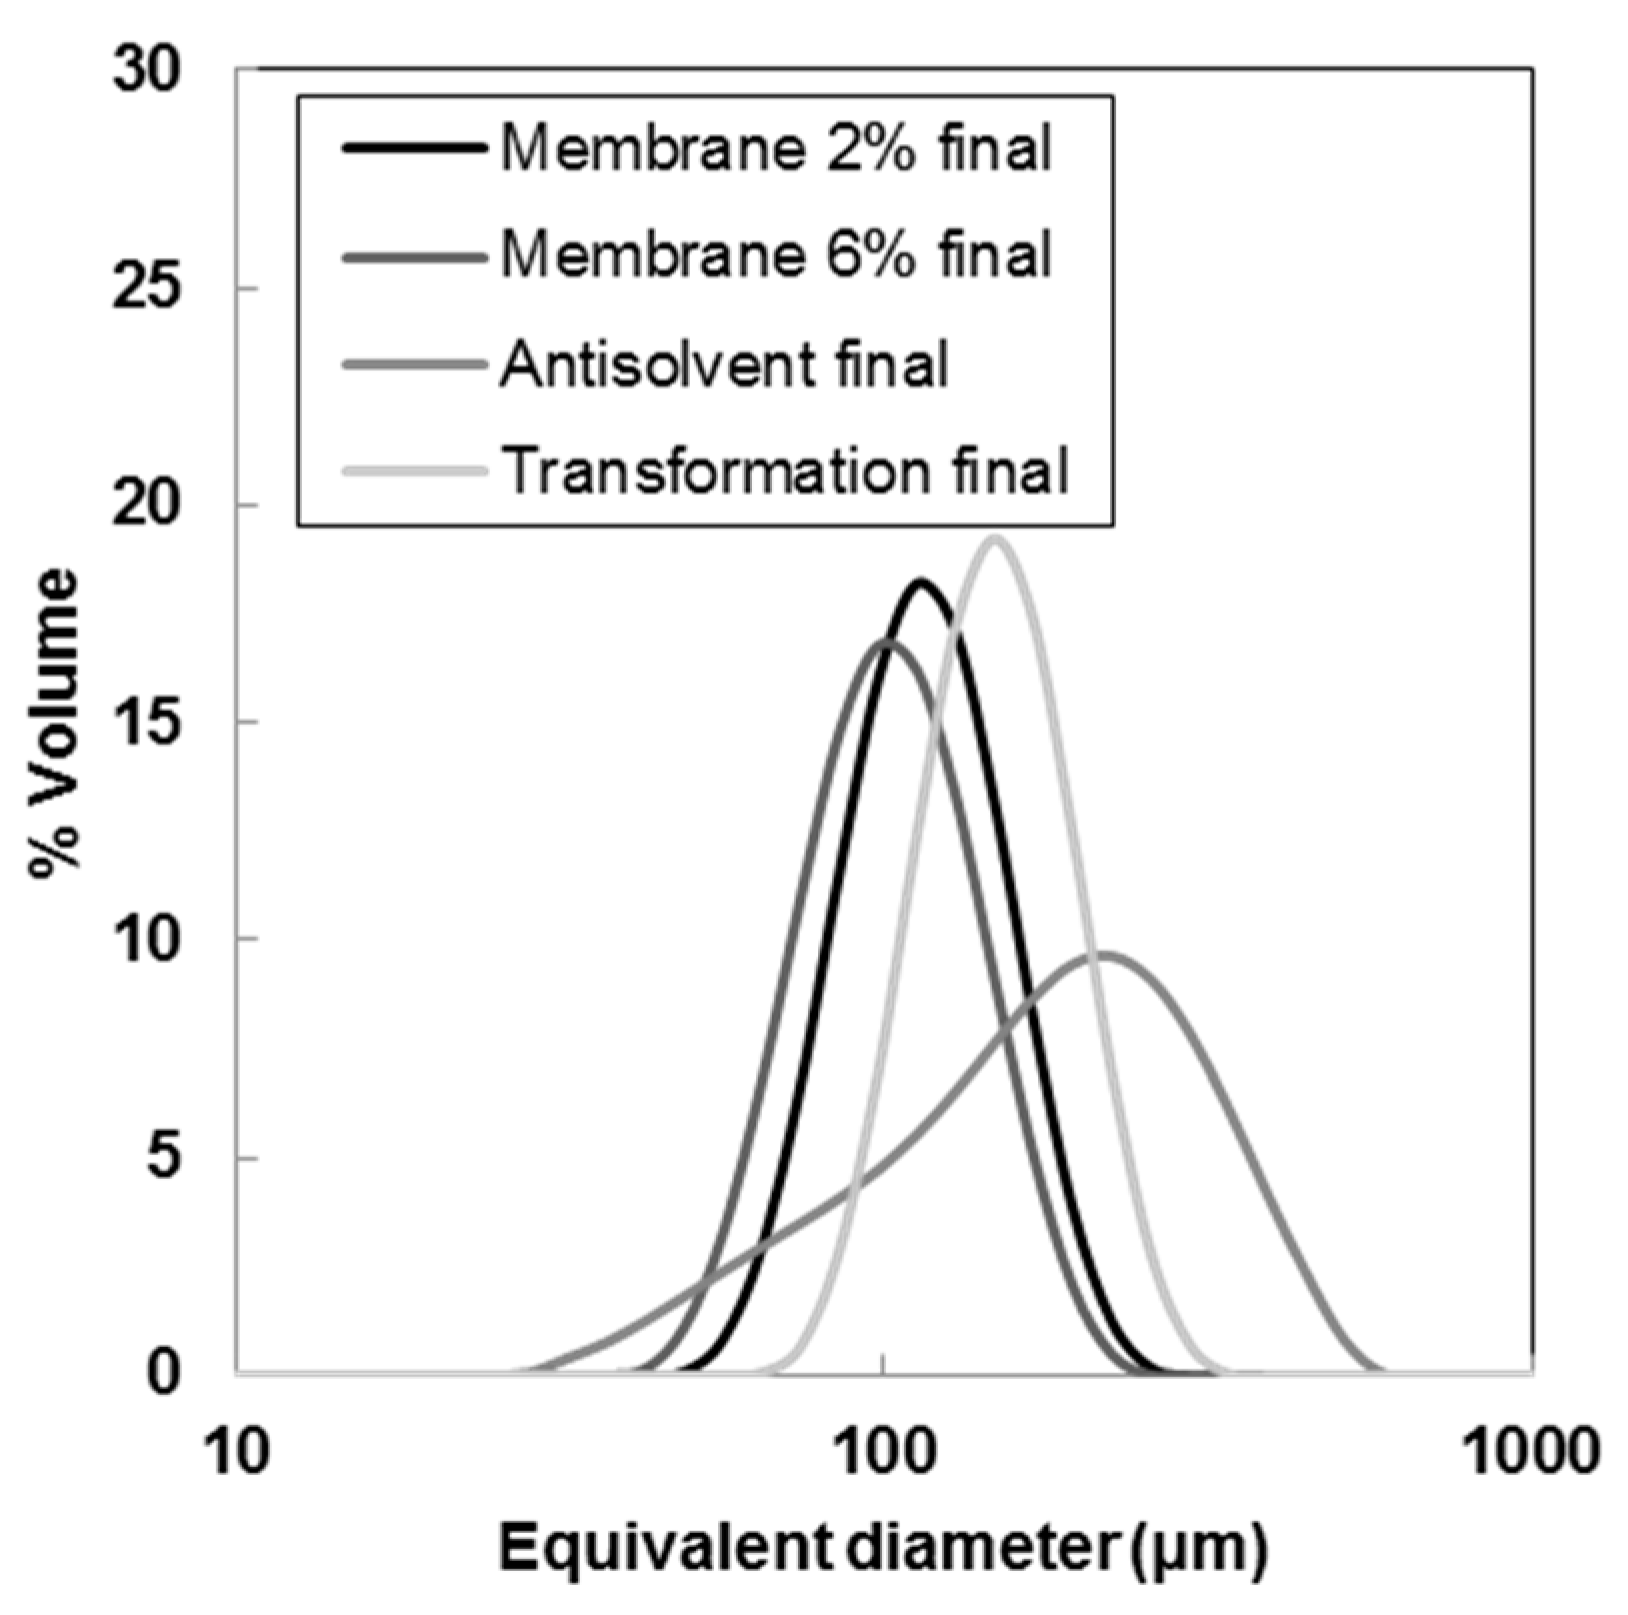
| Sample | d(0.1) (µm) | d(0.5) (µm) | d(0.9) (µm) | Span(-) | D[4,3] (µm) | D[3,2] (µm) |
|---|---|---|---|---|---|---|
| Membrane 2% | 78.7 ± 1.21 | 115 ± 0.46 | 166 ± 3.61 | 0.76 ± 0.04 (−25%) | 119 ± 0.9 (+243%) | 110 ± 0.33 (+263%) |
| Membrane 6% | 67.7 ± 0.31 | 101 ± 0.70 | 152 ± 1.60 | 0.83 ± 0.01 (−19%) | 106 ± 0.74 (+205%) | 96.7 ± 0.63 (+220%) |
| Transformation | 104 ±0.45 | 148 ± 0.62 | 211 ± 0.86 | 0.72 ± 0.001 (−38%) | 153 ± 0.64 (+179%) | 142 ± 0.60 (+209%) |
| Antisolvent | 70.3 ± 1.07 | 181 ± 1.59 | 340 ± 1.97 | 1.49 ± 0.01 (+16%) | 195 ± 1.38 (+46%) | 138 ± 1.35 (+36%) |
© 2018 by the authors. Licensee MDPI, Basel, Switzerland. This article is an open access article distributed under the terms and conditions of the Creative Commons Attribution (CC BY) license (http://creativecommons.org/licenses/by/4.0/).
Share and Cite
Simone, E.; Othman, R.; Vladisavljević, G.T.; Nagy, Z.K. Preventing Crystal Agglomeration of Pharmaceutical Crystals Using Temperature Cycling and a Novel Membrane Crystallization Procedure for Seed Crystal Generation. Pharmaceutics 2018, 10, 17. https://doi.org/10.3390/pharmaceutics10010017
Simone E, Othman R, Vladisavljević GT, Nagy ZK. Preventing Crystal Agglomeration of Pharmaceutical Crystals Using Temperature Cycling and a Novel Membrane Crystallization Procedure for Seed Crystal Generation. Pharmaceutics. 2018; 10(1):17. https://doi.org/10.3390/pharmaceutics10010017
Chicago/Turabian StyleSimone, Elena, Rahimah Othman, Goran T. Vladisavljević, and Zoltan K. Nagy. 2018. "Preventing Crystal Agglomeration of Pharmaceutical Crystals Using Temperature Cycling and a Novel Membrane Crystallization Procedure for Seed Crystal Generation" Pharmaceutics 10, no. 1: 17. https://doi.org/10.3390/pharmaceutics10010017