
Virus-Host Dynamics in Archaeal Groundwater Biofilms and the Associated Bacterial Community Composition
 , , , , and
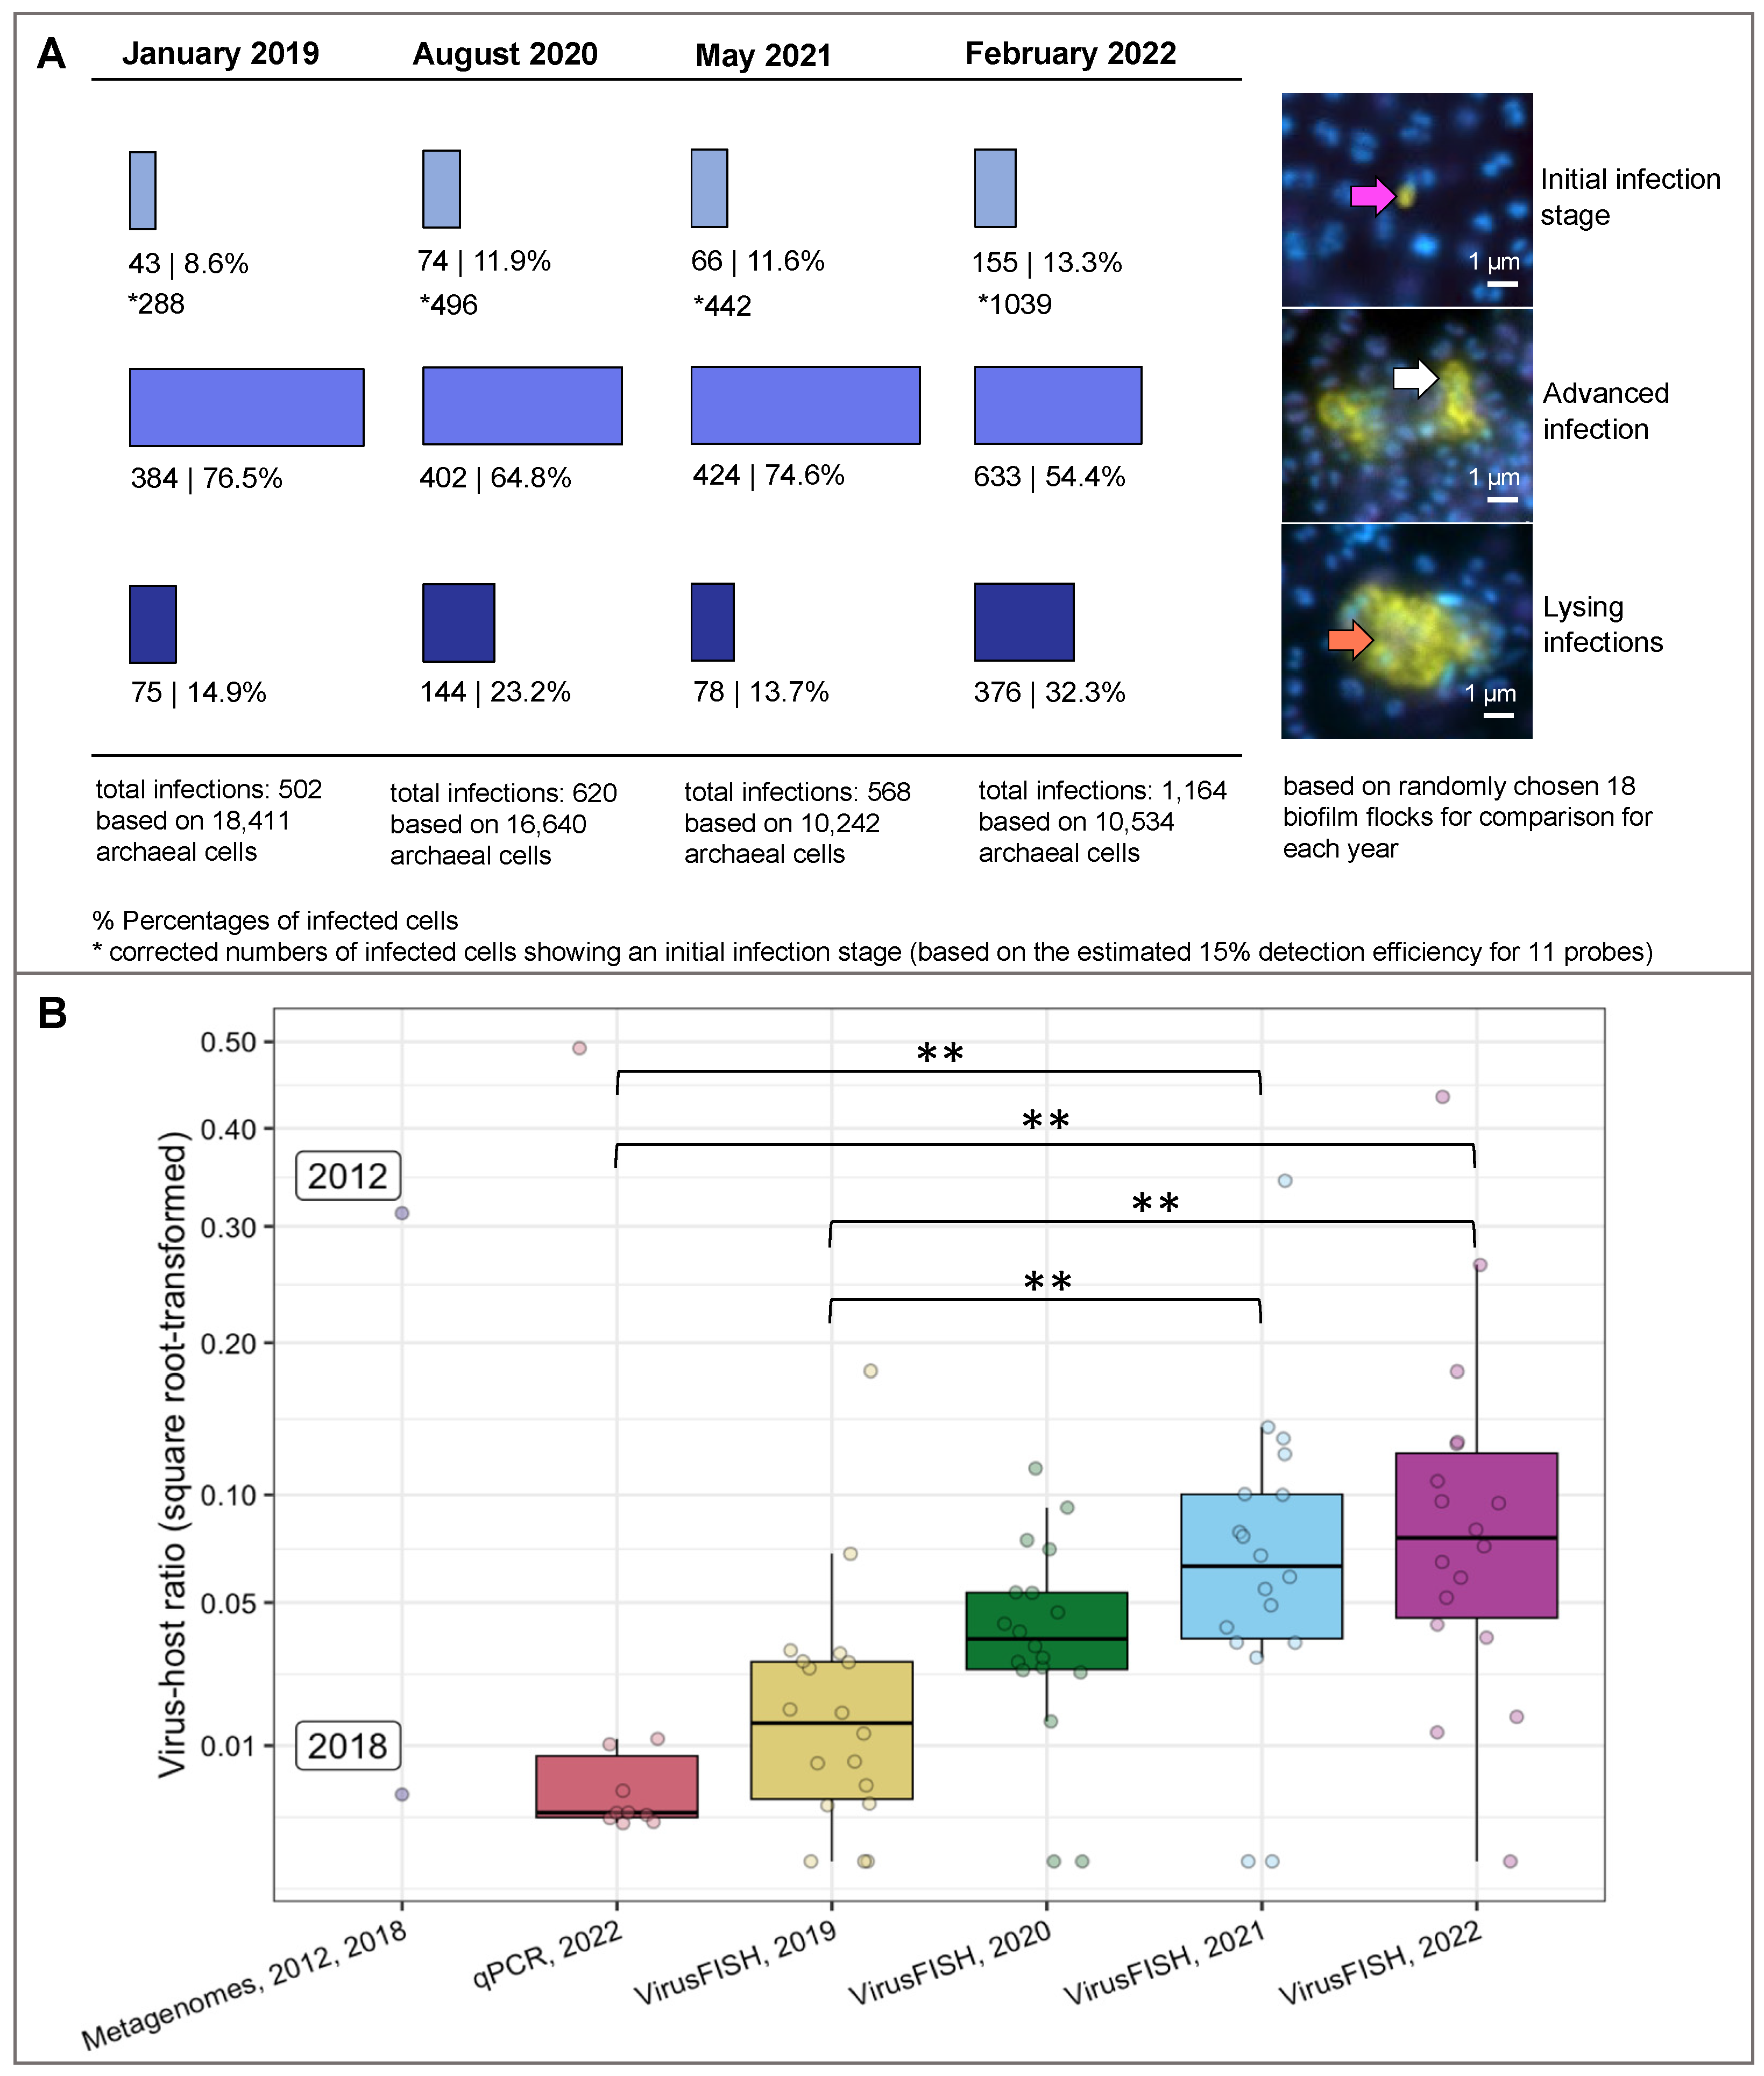
Abstract
:1. Introduction
2. Materials and Methods
2.1. Sampling Procedure and DNA Extraction
2.2. VirusFISH for Enumerating Viral-Host Ratios
2.3. Determining the Detection Efficiencies of Direct-GeneFISH and VirusFISH
2.4. Quantitative Real-Time PCR (qPCR) Targeting Altivir_1_MSI and Archaeal as Well as Bacterial 16S rRNA Gene Sequences
2.5. Statistical Analysis
2.6. Full Length 16S rRNA Gene Sequencing from DNA of Individual MSI Biofilm Flocks by Using Nanopore Sequencing
3. Results
3.1. VirusFISH Reveals an Increase in Viral Infections of Ca. Altiarchaeum hamiconexum Cells in the MSI over Four Years
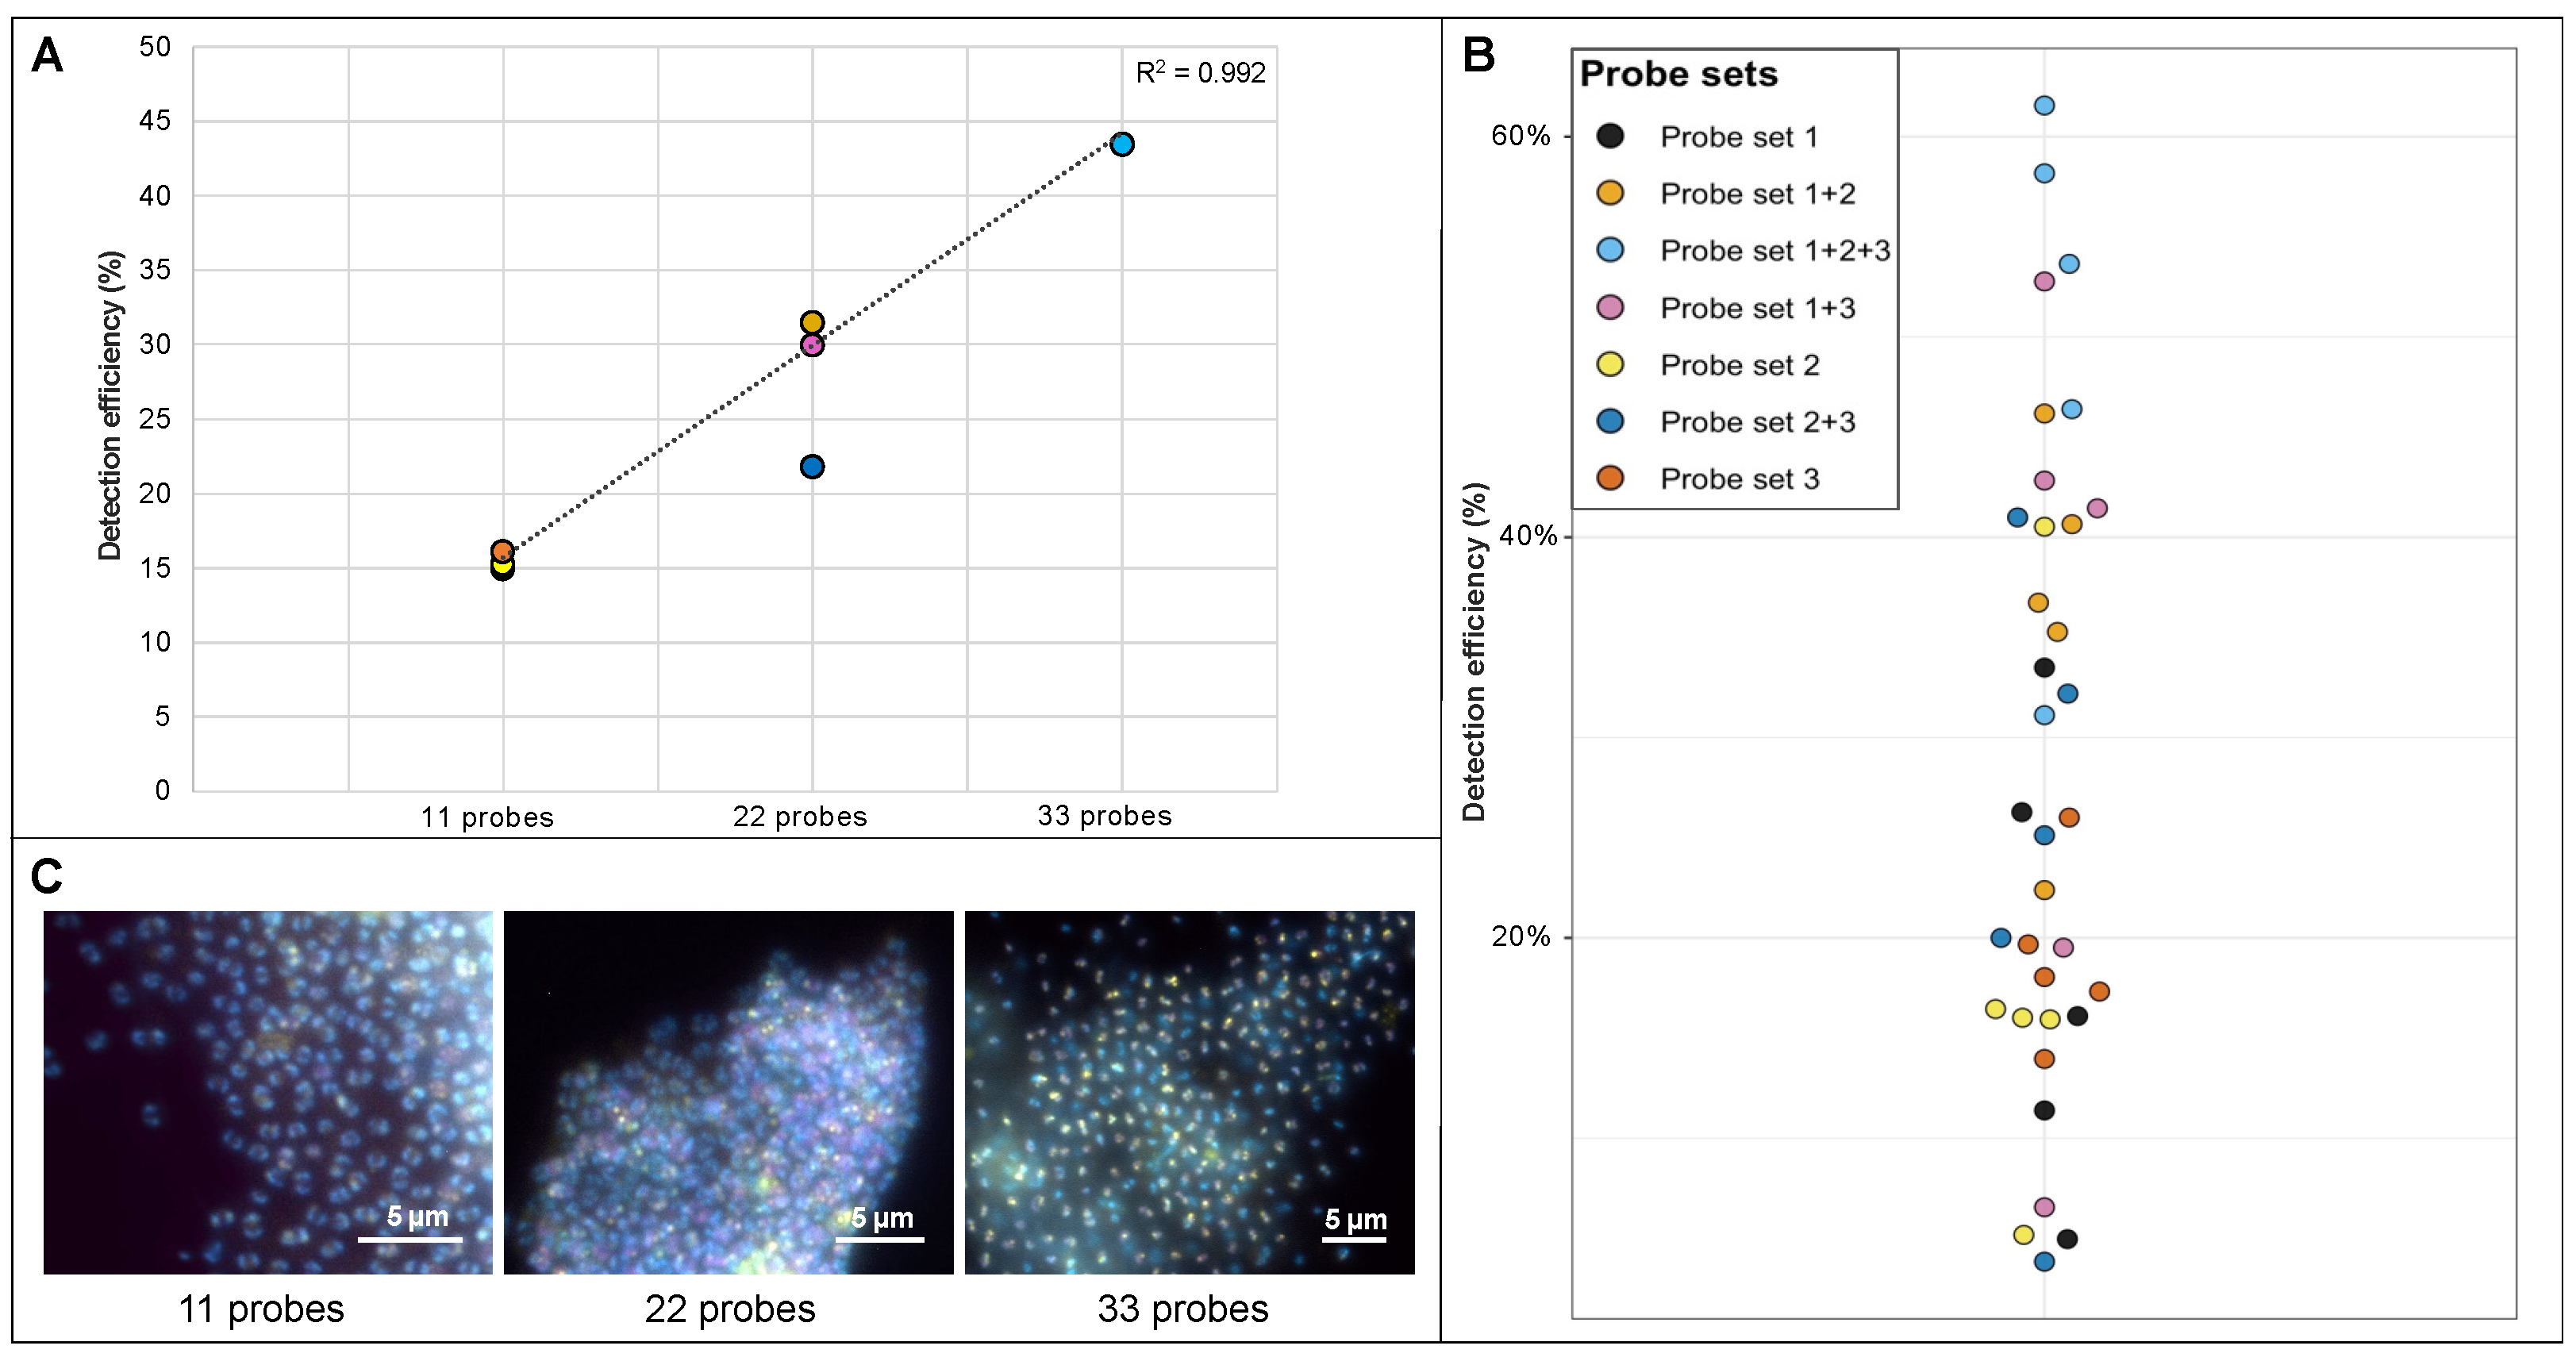
3.2. Determining the Detection Efficiency of VirusFISH via Host-Directed Direct-GeneFISH
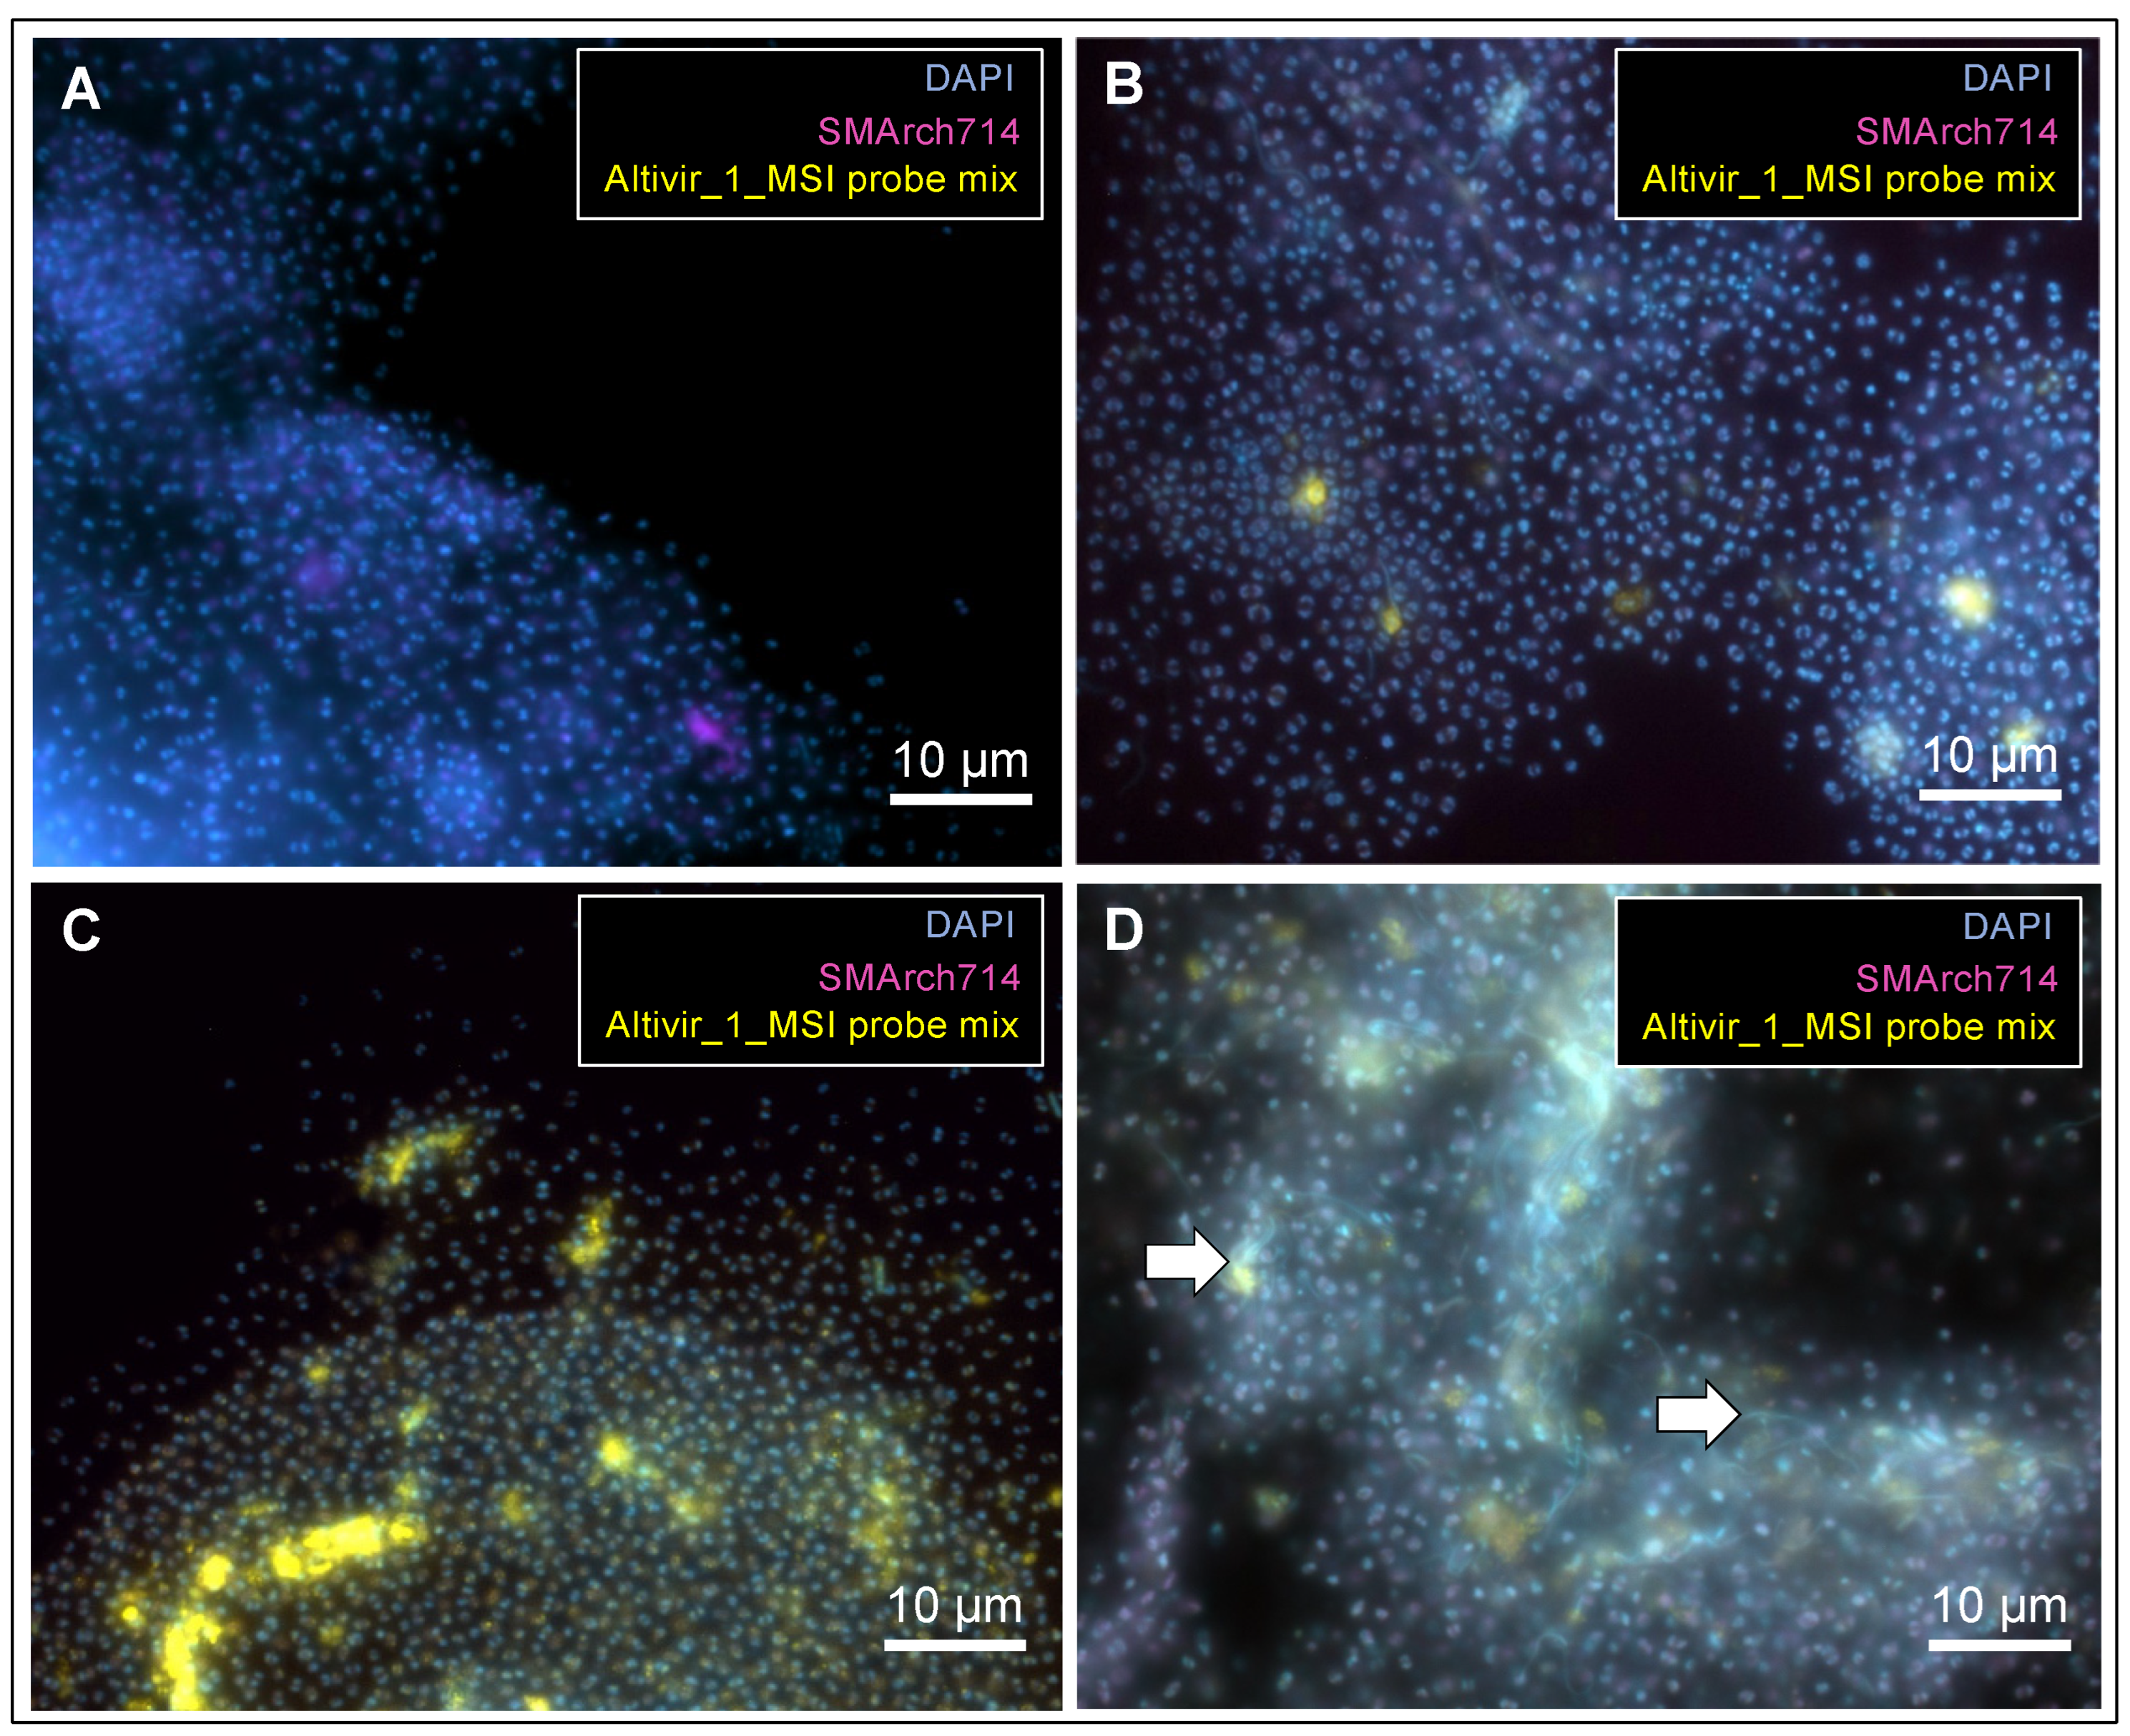
3.3. Filamentous Microorganisms Are Enriched in Areas of Vast Viral Lysis Suggesting a Development of Ca. A. hamiconexum Biofilms over Time
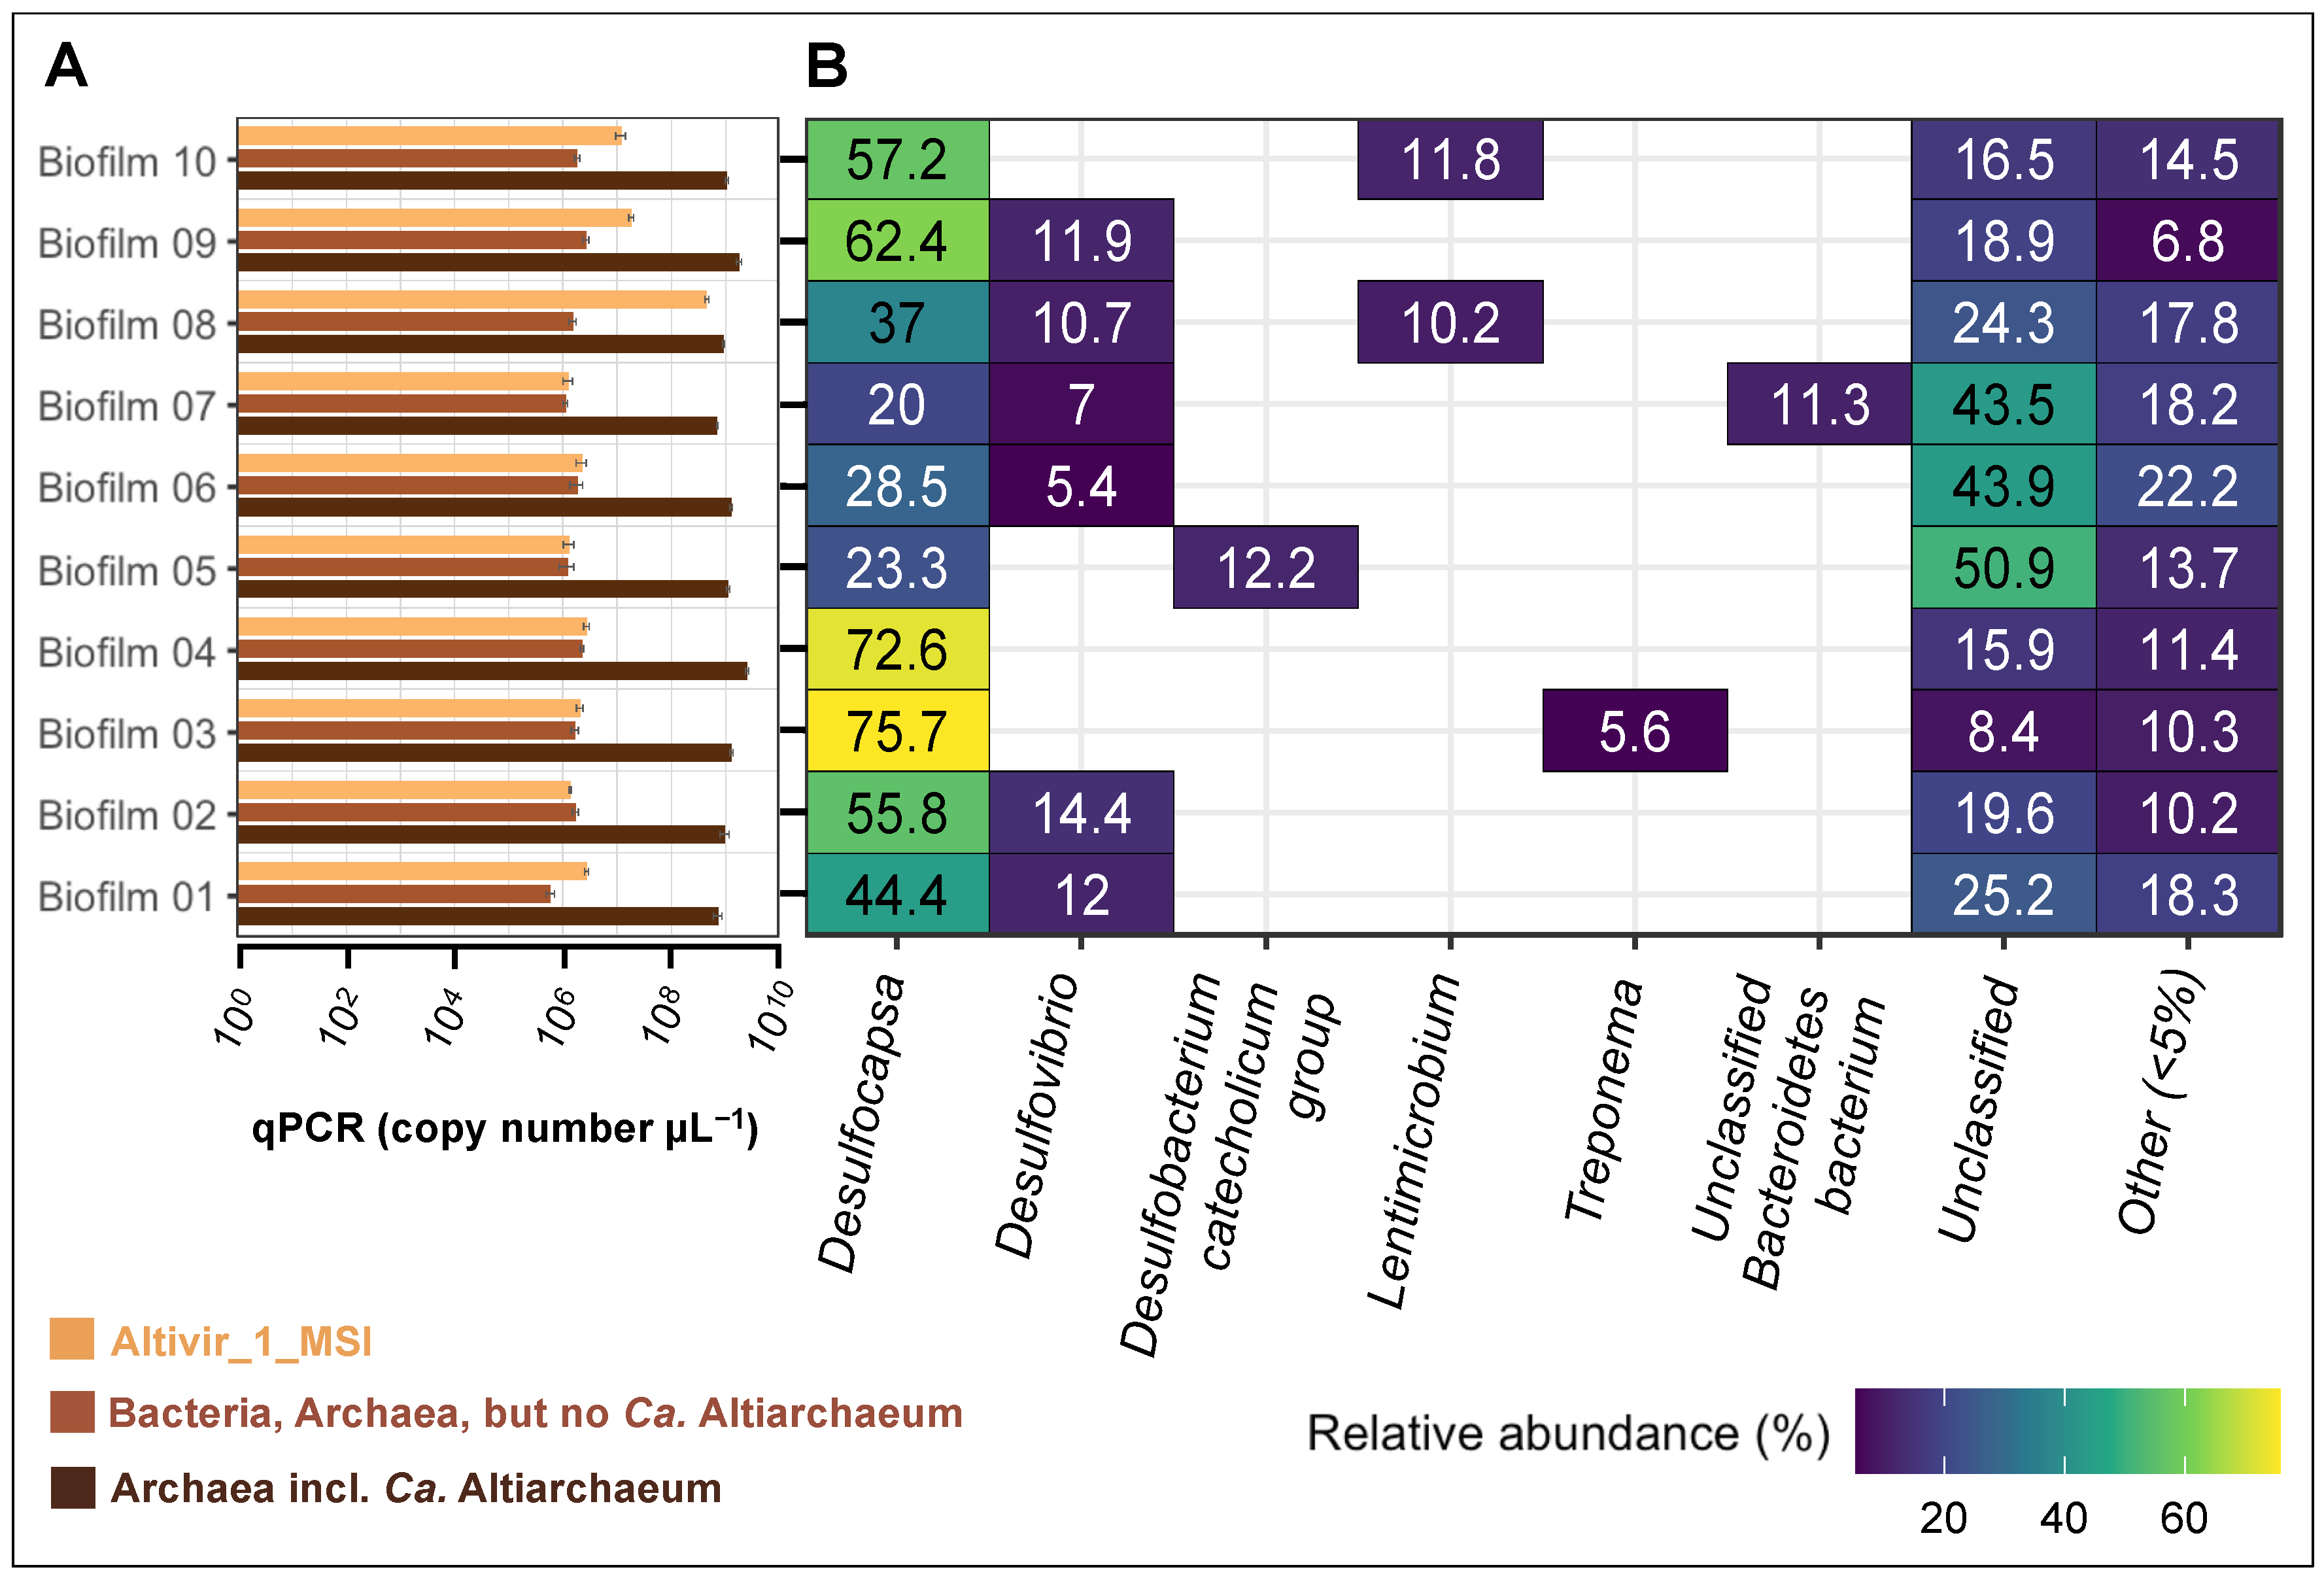
3.4. Biofilm Flocks with Different Virus-Host Ratios Are Associated with a Constant Bacteriome
4. Discussion
5. Outlook
Supplementary Materials
Author Contributions
Funding
Institutional Review Board Statement
Informed Consent Statement
Data Availability Statement
Acknowledgments
Conflicts of Interest
References
- Suttle, C.A. Marine Viruses—Major Players in the Global Ecosystem. Nat. Rev. Microbiol. 2007, 5, 801–812. [Google Scholar] [CrossRef] [PubMed]
- Proctor, L.; Fuhrman, J. Mortality of Marine Bacteria in Response to Enrichments of the Virus Size Fraction from Seawater. Mar. Ecol. Prog. Ser. 1992, 87, 283–293. [Google Scholar] [CrossRef]
- Fuhrman, J.A. Marine Viruses and Their Biogeochemical and Ecological Effects. Nature 1999, 399, 541–548. [Google Scholar] [CrossRef] [PubMed]
- Howard-Varona, C.; Hargreaves, K.R.; Abedon, S.T.; Sullivan, M.B. Lysogeny in Nature: Mechanisms, Impact and Ecology of Temperate Phages. ISME J. 2017, 11, 1511–1520. [Google Scholar] [CrossRef] [Green Version]
- Anderson, R.E.; Brazelton, W.J.; Baross, J.A. Is the Genetic Landscape of the Deep Subsurface Biosphere Affected by Viruses? Front. Microbiol. 2011, 2, 219. [Google Scholar] [CrossRef] [PubMed] [Green Version]
- Magnabosco, C.; Lin, L.-H.; Dong, H.; Bomberg, M.; Ghiorse, W.; Stan-Lotter, H.; Pedersen, K.; Kieft, T.L.; van Heerden, E.; Onstott, T.C. The Biomass and Biodiversity of the Continental Subsurface. Nat. Geosci. 2018, 11, 707–717. [Google Scholar] [CrossRef]
- Holmfeldt, K.; Nilsson, E.; Simone, D.; Lopez-Fernandez, M.; Wu, X.; de Bruijn, I.; Lundin, D.; Andersson, A.F.; Bertilsson, S.; Dopson, M. The Fennoscandian Shield Deep Terrestrial Virosphere Suggests Slow Motion ‘Boom and Burst’ Cycles. Commun. Biol. 2021, 4, 307. [Google Scholar] [CrossRef]
- Rahlff, J.; Turzynski, V.; Esser, S.P.; Monsees, I.; Bornemann, T.L.V.; Figueroa-Gonzalez, P.A.; Schulz, F.; Woyke, T.; Klingl, A.; Moraru, C.; et al. Lytic Archaeal Viruses Infect Abundant Primary Producers in Earth’s Crust. Nat. Commun. 2021, 12, 4642. [Google Scholar] [CrossRef]
- Thingstad, T.; Lignell, R. Theoretical Models for the Control of Bacterial Growth Rate, Abundance, Diversity and Carbon Demand. Aquat. Microb. Ecol. 1997, 13, 19–27. [Google Scholar] [CrossRef] [Green Version]
- Engelhardt, T.; Kallmeyer, J.; Cypionka, H.; Engelen, B. High Virus-to-Cell Ratios Indicate Ongoing Production of Viruses in Deep Subsurface Sediments. ISME J. 2014, 8, 1503–1509. [Google Scholar] [CrossRef]
- Kyle, J.E.; Eydal, H.S.C.; Ferris, F.G.; Pedersen, K. Viruses in Granitic Groundwater from 69 to 450 m Depth of the Äspö Hard Rock Laboratory, Sweden. ISME J. 2008, 2, 571–574. [Google Scholar] [CrossRef] [PubMed] [Green Version]
- Attar, N. Archaeal Virus Escapology. Nat. Rev. Microbiol. 2016, 14, 665. [Google Scholar] [CrossRef] [PubMed]
- Prangishvili, D.; Bamford, D.H.; Forterre, P.; Iranzo, J.; Koonin, E.V.; Krupovic, M. The Enigmatic Archaeal Virosphere. Nat. Rev. Microbiol. 2017, 15, 724–739. [Google Scholar] [CrossRef] [PubMed]
- Wirth, J.; Young, M. The Intriguing World of Archaeal Viruses. PLoS Pathog. 2020, 16, e1008574. [Google Scholar] [CrossRef] [PubMed]
- Probst, A.; Moissl-Eichinger, C. “Altiarchaeales”: Uncultivated Archaea from the Subsurface. Life 2015, 5, 1381–1395. [Google Scholar] [CrossRef] [Green Version]
- Probst, A.J.; Weinmaier, T.; Raymann, K.; Perras, A.; Emerson, J.B.; Rattei, T.; Wanner, G.; Klingl, A.; Berg, I.A.; Yoshinaga, M.; et al. Biology of a Widespread Uncultivated Archaeon That Contributes to Carbon Fixation in the Subsurface. Nat. Commun. 2014, 5, 5497. [Google Scholar] [CrossRef] [PubMed] [Green Version]
- Probst, A.J.; Birarda, G.; Holman, H.-Y.N.; DeSantis, T.Z.; Wanner, G.; Andersen, G.L.; Perras, A.K.; Meck, S.; Völkel, J.; Bechtel, H.A.; et al. Coupling Genetic and Chemical Microbiome Profiling Reveals Heterogeneity of Archaeome and Bacteriome in Subsurface Biofilms That Are Dominated by the Same Archaeal Species. PLoS ONE 2014, 9, e99801. [Google Scholar] [CrossRef]
- Henneberger, R.; Moissl, C.; Amann, T.; Rudolph, C.; Huber, R. New Insights into the Lifestyle of the Cold-Loving SM1 Euryarchaeon: Natural Growth as a Monospecies Biofilm in the Subsurface. Appl. Environ. Microbiol. 2006, 72, 192–199. [Google Scholar] [CrossRef] [Green Version]
- Moissl, C.; Rachel, R.; Briegel, A.; Engelhardt, H.; Huber, R. The Unique Structure of Archaeal “Hami”, Highly Complex Cell Appendages with Nano-Grappling Hooks. Mol. Microbiol. 2005, 56, 361–370. [Google Scholar] [CrossRef]
- Rudolph, C.; Wanner, G.; Huber, R. Natural Communities of Novel Archaea and Bacteria Growing in Cold Sulfurous Springs with a String-of-Pearls-Like Morphology. Appl. Environ. Microbiol. 2001, 67, 2336–2344. [Google Scholar] [CrossRef] [Green Version]
- Rudolph, C.; Moissl, C.; Henneberger, R.; Huber, R. Ecology and Microbial Structures of Archaeal/Bacterial Strings-of-Pearls Communities and Archaeal Relatives Thriving in Cold Sulfidic Springs. FEMS Microbiol. Ecol. 2004, 50, 1–11. [Google Scholar] [CrossRef]
- Probst, A.J.; Ladd, B.; Jarett, J.K.; Geller-McGrath, D.E.; Sieber, C.M.K.; Emerson, J.B.; Anantharaman, K.; Thomas, B.C.; Malmstrom, R.R.; Stieglmeier, M.; et al. Differential Depth Distribution of Microbial Function and Putative Symbionts through Sediment-Hosted Aquifers in the Deep Terrestrial Subsurface. Nat. Microbiol. 2018, 3, 328–336. [Google Scholar] [CrossRef] [Green Version]
- Perras, A.K.; Daum, B.; Ziegler, C.; Takahashi, L.K.; Ahmed, M.; Wanner, G.; Klingl, A.; Leitinger, G.; Kolb-Lenz, D.; Gribaldo, S.; et al. S-Layers at Second Glance? Altiarchaeal Grappling Hooks (Hami) Resemble Archaeal S-Layer Proteins in Structure and Sequence. Front. Microbiol. 2015, 6, 543. [Google Scholar] [CrossRef] [PubMed]
- Pires, D.P.; Melo, L.D.R.; Azeredo, J. Understanding the Complex Phage-Host Interactions in Biofilm Communities. Annu. Rev. Virol. 2021, 8, 73–94. [Google Scholar] [CrossRef]
- Weinbauer, M.G. Ecology of Prokaryotic Viruses. FEMS Microbiol. Rev. 2004, 28, 127–181. [Google Scholar] [CrossRef] [PubMed] [Green Version]
- Vidakovic, L.; Singh, P.K.; Hartmann, R.; Nadell, C.D.; Drescher, K. Dynamic Biofilm Architecture Confers Individual and Collective Mechanisms of Viral Protection. Nat. Microbiol. 2018, 3, 26–31. [Google Scholar] [CrossRef] [PubMed] [Green Version]
- Bond, M.C.; Vidakovic, L.; Singh, P.K.; Drescher, K.; Nadell, C.D. Matrix-Trapped Viruses Can Prevent Invasion of Bacterial Biofilms by Colonizing Cells. eLife 2021, 10, e65355. [Google Scholar] [CrossRef]
- Secor, P.R.; Sweere, J.M.; Michaels, L.A.; Malkovskiy, A.V.; Lazzareschi, D.; Katznelson, E.; Rajadas, J.; Birnbaum, M.E.; Arrigoni, A.; Braun, K.R.; et al. Filamentous Bacteriophage Promote Biofilm Assembly and Function. Cell. Host Microbe 2015, 18, 549–559. [Google Scholar] [CrossRef] [PubMed] [Green Version]
- Fernández, L.; Rodríguez, A.; García, P. Phage or Foe: An Insight into the Impact of Viral Predation on Microbial Communities. ISME J. 2018, 12, 1171–1179. [Google Scholar] [CrossRef] [Green Version]
- Probst, A.J.; Holman, H.-Y.N.; DeSantis, T.Z.; Andersen, G.L.; Birarda, G.; Bechtel, H.A.; Piceno, Y.M.; Sonnleitner, M.; Venkateswaran, K.; Moissl-Eichinger, C. Tackling the Minority: Sulfate-Reducing Bacteria in an Archaea-Dominated Subsurface Biofilm. ISME J. 2013, 7, 635–651. [Google Scholar] [CrossRef] [Green Version]
- Wagner, C.; Reddy, V.; Asturias, F.; Khoshouei, M.; Johnson, J.E.; Manrique, P.; Munson-McGee, J.; Baumeister, W.; Lawrence, C.M.; Young, M.J. Isolation and Characterization of Metallosphaera Turreted Icosahedral Virus, a Founding Member of a New Family of Archaeal Viruses. J. Virol. 2017, 91, e00925-17. [Google Scholar] [CrossRef] [PubMed] [Green Version]
- Barrero-Canosa, J.; Moraru, C.; Zeugner, L.; Fuchs, B.M.; Amann, R. Direct-GeneFISH: A Simplified Protocol for the Simultaneous Detection and Quantification of Genes and RRNA in Microorganisms. Environ. Microbiol. 2017, 19, 70–82. [Google Scholar] [CrossRef] [PubMed]
- Langmead, B.; Salzberg, S.L. Fast Gapped-Read Alignment with Bowtie. Nat. Methods 2012, 9, 357–359. [Google Scholar] [CrossRef] [Green Version]
- Olm, M.R.; Crits-Christoph, A.; Bouma-Gregson, K.; Firek, B.A.; Morowitz, M.J.; Banfield, J.F. InStrain Profiles Population Microdiversity from Metagenomic Data and Sensitively Detects Shared Microbial Strains. Nat. Biotechnol. 2021, 39, 727–736. [Google Scholar] [CrossRef]
- Wright, E.S. Using DECIPHER v2.0 to Analyze Big Biological Sequence Data in R. R J. 2016, 8, 352–359. [Google Scholar] [CrossRef] [Green Version]
- Moissl, C.; Rudolph, C.; Rachel, R.; Koch, M.; Huber, R. In Situ Growth of the Novel SM1 Euryarchaeon from a String-of-Pearls-like Microbial Community in Its Cold Biotope, Its Physical Separation and Insights into Its Structure and Physiology. Arch. Microbiol. 2003, 180, 211–217. [Google Scholar] [CrossRef]
- Untergasser, A.; Cutcutache, I.; Koressaar, T.; Ye, J.; Faircloth, B.C.; Remm, M.; Rozen, S.G. Primer3—New Capabilities and Interfaces. Nucleic Acids Res. 2012, 40, e115. [Google Scholar] [CrossRef] [Green Version]
- Altschul, S.F.; Gish, W.; Miller, W.; Myers, E.W.; Lipman, D.J. Basic Local Alignment Search Tool. J. Mol. Biol. 1990, 215, 403–410. [Google Scholar] [CrossRef]
- Burggraf, S.; Huber, H.; Stetter, K.O. Reclassification of the Crenarchaeal Orders and Families in Accordance with 16S RRNA Sequence Data. Int. J. Syst. Bacteriol. 1997, 47, 657–660. [Google Scholar] [CrossRef] [Green Version]
- Amann, R.I.; Ludwig, W.; Schleifer, K.-H. Phylogenetic Identification and In Situ Detection of Individual Microbial Cells without Cultivation. Micorbiol. Rev. 1995, 59, 33. [Google Scholar] [CrossRef]
- Parada, A.E.; Needham, D.M.; Fuhrman, J.A. Every Base Matters: Assessing Small Subunit RRNA Primers for Marine Microbiomes with Mock Communities, Time Series and Global Field Samples: Primers for Marine Microbiome Studies. Environ. Microbiol. 2016, 18, 1403–1414. [Google Scholar] [CrossRef] [PubMed]
- Apprill, A.; McNally, S.; Parsons, R.; Weber, L. Minor Revision to V4 Region SSU RRNA 806R Gene Primer Greatly Increases Detection of SAR11 Bacterioplankton. Aquat. Microb. Ecol. 2015, 75, 129–137. [Google Scholar] [CrossRef] [Green Version]
- R Core Team. R: A Language and Environment for Statistical Computing; R Foundation for Statistical Computing: Vienna, Austria, 2022. [Google Scholar]
- De Coster, W.; D’Hert, S.; Schultz, D.T.; Cruts, M.; Van Broeckhoven, C. NanoPack: Visualizing and Processing Long-Read Sequencing Data. Bioinformatics 2018, 34, 2666–2669. [Google Scholar] [CrossRef] [Green Version]
- Quast, C.; Pruesse, E.; Yilmaz, P.; Gerken, J.; Schweer, T.; Yarza, P.; Peplies, J.; Glöckner, F.O. The SILVA Ribosomal RNA Gene Database Project: Improved Data Processing and Web-Based Tools. Nucleic Acids Res. 2013, 41, D590–D596. [Google Scholar] [CrossRef]
- Li, H. Minimap2: Pairwise Alignment for Nucleotide Sequences. Bioinformatics 2018, 34, 3094–3100. [Google Scholar] [CrossRef] [PubMed] [Green Version]
- Wickham, H.; Averick, M.; Bryan, J.; Chang, W.; McGowan, L.D.; François, R.; Grolemund, G.; Hayes, A.; Henry, L.; Hester, J.; et al. Welcome to the Tidyverse. J. Open Source Softw. 2019, 4, 1686. [Google Scholar] [CrossRef] [Green Version]
- Wickham, H. ggplot2: Elegant Graphics for Data Analysis; Springer: New York, NY, USA, 2016; ISBN 978-3-319-24277-4. [Google Scholar]
- Kallmeyer, J.; Pockalny, R.; Adhikari, R.R.; Smith, D.C.; D’Hondt, S. Global Distribution of Microbial Abundance and Biomass in Subseafloor Sediment. Proc. Natl. Acad. Sci. USA 2012, 109, 16213–16216. [Google Scholar] [CrossRef] [Green Version]
- Bar-On, Y.M.; Phillips, R.; Milo, R. The Biomass Distribution on Earth. Proc. Natl. Acad. Sci. USA 2018, 115, 6506–6511. [Google Scholar] [CrossRef] [Green Version]
- Kodama, Y.; Watanabe, K. Sulfuricurvum kujiense Gen. Nov., Sp. Nov., a Facultatively Anaerobic, Chemolithoautotrophic, Sulfur-Oxidizing Bacterium Isolated from an Underground Crude-Oil Storage Cavity. Int. J. Syst. Evol. Microbiol. 2004, 54, 2297–2300. [Google Scholar] [CrossRef] [Green Version]
- Zhang, J.; Mao, L.; Zhang, L.; Loh, K.-C.; Dai, Y.; Tong, Y.W. Metagenomic Insight into the Microbial Networks and Metabolic Mechanism in Anaerobic Digesters for Food Waste by Incorporating Activated Carbon. Sci. Rep. 2017, 7, 11293. [Google Scholar] [CrossRef]
- Li, J.; Liang, Y.; Miao, Y.; Wang, D.; Jia, S.; Liu, C.-H. Metagenomic Insights into Aniline Effects on Microbial Community and Biological Sulfate Reduction Pathways during Anaerobic Treatment of High-Sulfate Wastewater. Sci. Total. Environ. 2020, 742, 140537. [Google Scholar] [CrossRef] [PubMed]
- Jarett, J.K.; Džunková, M.; Schulz, F.; Roux, S.; Paez-Espino, D.; Eloe-Fadrosh, E.; Jungbluth, S.P.; Ivanova, N.; Spear, J.R.; Carr, S.A.; et al. Insights into the Dynamics between Viruses and Their Hosts in a Hot Spring Microbial Mat. ISME J. 2020, 14, 2527–2541. [Google Scholar] [CrossRef]
- Wirth, J.; Young, M. Viruses in Subsurface Environments. Annu. Rev. Virol. 2022, 9, 99–119. [Google Scholar] [CrossRef]
- Turzynski, V.; Monsees, I.; Moraru, C.; Probst, A.J. Imaging Techniques for Detecting Prokaryotic Viruses in Environmental Samples. Viruses 2021, 13, 2126. [Google Scholar] [CrossRef] [PubMed]
- Monsees, I.; Turzynski, V.; Esser, S.P.; Soares, A.; Timmermann, L.I.; Weidenbach, K.; Banas, J.; Kloster, M.; Beszteri, B.; Schmitz, R.A.; et al. Label-Free Raman Microspectroscopy for Identifying Prokaryotic Virocells. mSystems 2022, 7, e01505-21. [Google Scholar] [CrossRef] [PubMed]


Disclaimer/Publisher’s Note: The statements, opinions and data contained in all publications are solely those of the individual author(s) and contributor(s) and not of MDPI and/or the editor(s). MDPI and/or the editor(s) disclaim responsibility for any injury to people or property resulting from any ideas, methods, instructions or products referred to in the content. |
© 2023 by the authors. Licensee MDPI, Basel, Switzerland. This article is an open access article distributed under the terms and conditions of the Creative Commons Attribution (CC BY) license (https://creativecommons.org/licenses/by/4.0/).
Share and Cite
Turzynski, V.; Griesdorn, L.; Moraru, C.; Soares, A.R.; Simon, S.A.; Stach, T.L.; Rahlff, J.; Esser, S.P.; Probst, A.J. Virus-Host Dynamics in Archaeal Groundwater Biofilms and the Associated Bacterial Community Composition. Viruses 2023, 15, 910. https://doi.org/10.3390/v15040910
Turzynski V, Griesdorn L, Moraru C, Soares AR, Simon SA, Stach TL, Rahlff J, Esser SP, Probst AJ. Virus-Host Dynamics in Archaeal Groundwater Biofilms and the Associated Bacterial Community Composition. Viruses. 2023; 15(4):910. https://doi.org/10.3390/v15040910
Chicago/Turabian StyleTurzynski, Victoria, Lea Griesdorn, Cristina Moraru, André R. Soares, Sophie A. Simon, Tom L. Stach, Janina Rahlff, Sarah P. Esser, and Alexander J. Probst. 2023. "Virus-Host Dynamics in Archaeal Groundwater Biofilms and the Associated Bacterial Community Composition" Viruses 15, no. 4: 910. https://doi.org/10.3390/v15040910