Article

The EBV Gastric Cancer Resource (EBV-GCR): A Suite of Tools for Investigating EBV-Associated Human Gastric Carcinogenesis

by
Mikhail Y. Salnikov
1,
Eric Wang
2,
Erik Christensen
3,4,
Martin A. Prusinkiewicz
1,
Parisa Shooshtari
2,3,4,5 and
Joe S. Mymryk
1,6,7,8,*
1
Department of Microbiology and Immunology, Western University, London, ON N6A 3K7, Canada
2
Department of Pathology and Laboratory Medicine, Western University, London, ON N6A 3K7, Canada
3
Department of Computer Science, Western University, London, ON N6A 5B7, Canada
4
Children’s Health Research Institute, Lawson Health Research Institute, London, ON N6A 5W9, Canada
5
The Ontario Institute for Cancer Research, Toronto, ON M5G 0A3, Canada
6
Department of Oncology, Western University, London, ON N6A 3K7, Canada
7
London Regional Cancer Program, Lawson Health Research Institute, London, ON N6A 5W9, Canada
8
Department of Otolaryngology, Western University, London, ON N6A 5W9, Canada
*
Author to whom correspondence should be addressed.
Viruses 2023, 15(4), 853; https://doi.org/10.3390/v15040853
Submission received: 4 March 2023 / Revised: 23 March 2023 / Accepted: 24 March 2023 / Published: 27 March 2023
(This article belongs to the Special Issue State-of-the-Art Virology Research in Canada)

Abstract

:
Epstein-Barr virus (EBV) causes lifelong infection in over 90% of the world’s population. EBV infection leads to several types of B cell and epithelial cancers due to the viral reprogramming of host-cell growth and gene expression. EBV is associated with 10% of stomach/gastric adenocarcinomas (EBVaGCs), which have distinct molecular, pathological, and immunological characteristics compared to EBV-negative gastric adenocarcinomas (EBVnGCs). Publicly available datasets, such as The Cancer Genome Atlas (TCGA), contain comprehensive transcriptomic, genomic, and epigenomic data for thousands of primary human cancer samples, including EBVaGCs. Additionally, single-cell RNA-sequencing data are becoming available for EBVaGCs. These resources provide a unique opportunity to explore the role of EBV in human carcinogenesis, as well as differences between EBVaGCs and their EBVnGC counterparts. We have constructed a suite of web-based tools called the EBV Gastric Cancer Resource (EBV-GCR), which utilizes TCGA and single-cell RNA-seq data and can be used for research related to EBVaGCs. These web-based tools allow investigators to gain in-depth biological and clinical insights by exploring the effects of EBV on cellular gene expression, associations with patient outcomes, immune landscape features, and differential gene methylation, featuring both whole-tissue and single-cell analyses.

1. Introduction

Epstein-Barr virus (EBV) is a gamma-herpesvirus estimated to infect 90% of the world’s population [1]. EBV infects B lymphocytes and mucosal epithelial cells, influencing their cellular differentiation and growth [2,3,4]. EBV uses a variety of immune evasion strategies to establish lifelong latent infections [5]. Furthermore, EBV expresses several oncogenic proteins and microRNAs (miRNAs) [6,7] that are mechanistically associated with multiple types of cancers, including Burkitt’s and other lymphomas, nasopharyngeal carcinomas, and EBV-associated gastric adenocarcinomas (EBVaGCs) [8]. Overall, EBV infections account for 1.5% of all human cancer cases worldwide [9].
It is estimated that EBV is the causative agent of around 10% of all gastric cancer (GC) cases worldwide, though relative proportions differ by region [10,11]. Furthermore, EBVaGCs are molecularly and pathologically distinct entities from EBV-negative GCs (EBVnGCs), with higher survival rates, male-dominant incidence, genome-wide promoter hypermethylation, increased T cell infiltration, as well as higher levels of MHC-I and MHC-II expression [12,13,14,15,16]. Additionally, several EBV-associated proteins and 44 miRNAs originating from the Bam-HI A rightward transcripts (miR-BARTs) are consistently expressed in EBVaGCs, likely contributing to the oncogenesis and progression of EBVaGCs [17,18].
Indeed, a large recent meta-analysis reported that individuals with latent epithelial EBV infections exhibit an 18-fold increased risk of gastric cancer development [19]. Other risk factors include eating salty or spicy foods, frequently drinking coffee and high-temperature drinks, and exposure to wood dust and/or iron filings [20].
As no licensed prophylactic or therapeutic EBV vaccines exist [21], understanding the mechanistic roles that EBV-encoded proteins and miRNAs play in EBVaGC remains a research area of high importance. While a variety of cell line and animal models exist to help understand how EBV manipulates human cells [22,23], many animal models are not robust, and the applicability of these models to humans is unclear [24,25]. These in vitro and in vivo studies benefit from being validated by observations within primary human cancer tissues. However, this often requires a large quantity of methodologically robust clinical data that can provide the statistical power and sample sizes required to validate EBVaGC cancer models.
The Cancer Genome Atlas (TCGA) is a comprehensive, publicly available atlas of genomic, epigenomic, and transcriptomic data from primary, surgically resected human cancers (https://www.cancer.gov/tcga; accessed on 29 August 2022). The outcome of this endeavor is a massive, publicly available, and comprehensive dataset of multidimensional maps of genomic changes in over 11,000 tumor samples from 33 different types of human cancer. Most samples collected to construct the TCGA have complete mRNA and miRNA sequencing and DNA methylation profiling. Additional work has systematically estimated numerous immune landscape features for each TCGA cancer sample [26]. Many TCGA samples include comprehensive clinical data, which allows for the comparison of a variety of clinical variables, such as patient survival [27].
Of the different types of EBV-associated cancers, the TCGA includes stomach adenocarcinoma (STAD) samples from nearly 400 cancer patients [28]. All TCGA STAD samples were surgically resected from treatment-naïve patients to avoid the confounding effects of chemo- and radio-therapeutic treatments on the molecular data. The TCGA STADs can be divided based on their molecular features into EBVaGCs and EBVnGCs, with the latter consisting of four subgroups: microsatellite-instable (MSI) tumors, tumors with chromosomal instability (CIN), genomically stable (GS) tumors, and tumors with DNA polymerase epsilon (POLE) mutations [29]. Along with mRNA and miRNA read counts for cellular genes, both viral mRNA and miRNA read counts are available for EBVaGC samples, as are clinical outcomes, including patient survival, and immune landscape features [26,27]. Although the scope of the data provided by TCGA is vast, several tools are available to help improve its accessibility [30]. However, it is still a daunting task for many researchers to analyze such datasets, especially those without a strong background in bioinformatics. No existing tools allow for detailed comparisons of EBVaGCs with EBV negative GC types.
We recently developed a suite of tools to compare human papillomavirus (HPV)-positive cancers from the TCGA cervical cancer and head and neck cancer cohorts with their HPV-negative counterparts, providing improved access to these important clinically relevant resources [31]. In this manuscript, we introduce a comparable and expanded web-based suite of computational tools, The EBV Gastric Cancer Resource (EBV-GCR), featuring the ability to query and visualize cellular and viral gene expression, immune landscape, survival, and methylation data. The EBV-GCR has been further refined and features a single-cell dataset obtained from Zhang et al. [32], which allows users to visualize differences in single-cell gene expressions among 6 histopathologically unique GC types, as well as among 11 different cell subpopulations. Such an array of analytic and visualization tools is intended as a resource for researchers active in the field of EBV-associated gastric cancers, without any requirements for computational or bioinformatics expertise. The EBV-GCR was developed as a resource to facilitate rapid biological and medical insights via the exploration of the impact of EBV on cellular gene expression, associations with patient survival and immune landscape features, altered gene methylation, and single-cell analyses from primary stomach adenocarcinomas. The web suite of tools can be accessed at https://mymryklab.ca/EBV-GCR/ebvgcr-home/, and the standalone version can be downloaded from the GitHub depository at https://github.com/msaland/EBV-GCR-Suite (deposited 5 March 2023).

2. Materials and Methods

2.1. Implementation and Software

The web server has been deployed on an Amazon Elastic Compute Cloud (EC2) virtual machine instance running Ubuntu version 22.04, available through Amazon Web Services (AWS). The backend of the server is running Shiny Server version 1.5.20.1002, as well as R version 4.2.2. The server setup was performed in agreement with the methods outlined by Charles Bordet (https://www.charlesbordet.com/en/guide-shiny-aws/, accessed on 25 August 2022). The following packages, along with their respective dependencies, have been installed: corrplot version 0.92, corto version 1.1.11, cowplot version 1.1.1, dplyr version 1.0.10, DT version 0.27, gdata version 2.18.0.1, ggplot2 version 3.4.0, ggpubr version 0.5.0, RColorBrewer version 1.1.3, scales version 1.2.1, Seurat version 4.3.0, shiny version 1.7.4, shinyjqui version 0.4.1, shinyjs version 2.1.0, shinythemes version 1.2.0, survival version 3.5.0, survminer version 0.4.9, and tidyverse version 1.3.2. The service is available 24 h/day, 7 days/week at https://mymryklab.ca/EBV-GCR/ebvgcr-home/, excluding downtime for maintenance and software updates. Tutorial videos for tools are available on the home page, under the section titled “Video Guides”. A standalone version of EBV-GCR for the Windows operating system can be downloaded from https://github.com/msaland/EBV-GCR-Suite.

2.2. Sample Collection and Ethics

All data were downloaded from The Cancer Genome Atlas (TCGA) via the Broad Genome Data Analysis Center’s Firehose server (https://gdac.broadinstitute.org/, accessed on 2 March 2017) or other publicly available sources as noted below; as a result, no ethical approval was needed. Table 1 lists the number of samples used for calculations with each EBV-GCR tool, with the exception of the single-cell analysis tool. Table S1 lists the number and characteristics of samples used for calculations in the single-cell analysis tool.

2.3. Data Sources for Cellular mRNA and miRNA Expression Levels, Patient Cohort Composition, and Analysis Workflow

Level 3 mRNA and miRNA expression data for the TCGA STAD datasets were obtained from the Broad Genome Data Analysis Center’s Firehose server (https://gdac.broadinstitute.org/, accessed on 2 March 2017), with the data normalized using the RSEM algorithm. The mRNA datasets feature expression patterns for 20,531 unique genes, whereas the miRNA datasets feature 1046 unique genes. The mRNA dataset is comprised of 30 EBVaGC, 353 EBVnGC (223 CIN, 73 MSI, 50 GS, and 7 POLE), and 35 normal (noncancerous) control tissues. The miRNA dataset comprises 29 EBVaGC, 315 EBVnGC (203 CIN, 59 MSI, 46 GS, and 7 POLE), and 41 normal control tissues. Boxplots were generated using the ggplot2 package (version 3.4.0). The maximum and minimum boxplot values were calculated as the 1.5× upper and lower quartile ranges, respectively. The correlations between the cellular gene mRNA or miRNA expressions and the GC subtypes were determined by sorting the datasets into their respective subsets, with subsequent calculations performed with R’s built-in wilcox.test function, with the conf.level parameter set to 0.95. Patient cellular gene mRNA and miRNA expressions with >50% zero or null values were marked as nonsignificant regardless of the calculated p-values. q-values were calculated for each comparison group with a false-discovery rate (FDR) of 5%.

2.4. Data Sources for Viral mRNA and miRNA Expression Levels, Patient Cohort Composition, and Analysis Workflow

The EBV viral mRNA expression datasets were obtained from Chakravorty et al. [33]. The EBV viral miRNA expression datasets were obtained from Ungerleider et al. [34]. These datasets build upon the TCGA dataset, featuring expression levels of 93 different viral mRNA genes, as well as the expression of 34 miR-BARTs and 3 miR-BHRF genes. The mRNA dataset features 26 patient observations, whereas the miRNA dataset features 32 patient observations. Correlations between the EBV mRNA or miRNA and cellular gene mRNA or miRNA expressions were determined via R’s built-in cor.test function, with the function being run with the linear relationship and Spearman correlation coefficient arguments and the conf.level parameter set to 0.95. Patient cellular gene mRNA or miRNA and EBV mRNA expressions with >50% zero or null values were marked as nonsignificant regardless of the calculated p-value. q-values were calculated for each comparison group with an FDR of 5%. Boxplots and scatterplots were generated using ggplot2 (version 3.4.0). The maximum and minimum boxplot values were calculated as the 1.5× upper and lower quartile ranges, respectively.

2.5. Data Sources for Immune Landscape Features, Patient Cohort Composition, and Analysis Workflow

Immune landscape features for the TCGA STAD dataset were obtained from Thorsson et al. [26], which included 53 unique features, as listed in Table 2. Samples were then selected for analysis based on the availability of the clinical data for the corresponding TCGA sample. The mRNA dataset features clinical data for 30 EBVaGC and 353 EBVnGC (223 CIN, 73 MSI, 50 GS, and 7 POLE) samples. The miRNA dataset features clinical data for 29 EBVaGC and 353 EBVnGC (201 CIN, 59 MSI, 49 GS, and 7 POLE) samples. The viral mRNA/miRNA dataset only features clinical data for 26 and 29 EBVaGC patient observations for the mRNAs and miRNAs, respectively. Correlations between the immune landscape features and the cellular gene mRNA and miRNA expressions were determined via R’s built-in cor.test function, with the function being run with the linear relationship and Spearman correlation coefficient arguments and the conf.level parameter set to 0.95. Immune landscape features and cellular mRNA and miRNA expressions with >50% zero or null values were marked as nonsignificant regardless of the calculated p-values. q-values were calculated for each comparison group, with an FDR of 5%. Boxplots and scatterplots were generated using ggplot2 (version 3.4.0). The maximum and minimum boxplot values were calculated as the 1.5× upper and lower quartile ranges, respectively.

2.6. Data Sources for Patient Survival, Patient Cohort Composition, and Analysis Workflow

The TCGA STAD overall survival (OS) datasets were obtained from Liu et al. [27]. Based on the availability of the OS datasets, the corresponding mRNA dataset features 30 EBVaGC and 328 EBVnGC (220 CIN, 72 MSI, 29 GS, and 7 POLE) patient observations. The corresponding miRNA dataset features 29 EBVaGC and 328 EBVnGC (199 CIN, 58 MSI, 49 GS, and 7 POLE) patient observations. Correlations between survival and cellular mRNA and miRNA expressions were determined via the pairwise_survdiff and Surv functions, available via the survminer (version 0.4.9) and survival (version 3.5.0) packages, respectively. Users have the option of selecting the number of comparison groups, upon which the subsets are broken down by the number of selected quantiles based on the mRNA and miRNA expression levels. Patient cellular gene mRNA and miRNA expressions with >50% zero or null values were marked as nonsignificant regardless of the calculated p-values. q-values were calculated for each comparison group, with an FDR of 5%. Kaplan–Meier survival plots were generated using the ggsurvplot function available through the survminer package (version 0.4.9).

2.7. Data Sources for DNA Methylation Levels, Patient Cohort Composition, and Analysis Workflow

Level 3 Infinium HumanMethylation450 BeadChip array datasets for the TCGA STAD cohort were obtained from the Broad Genome Data Analysis Centers Firehose server (https://gdac.broadinstitute.org/, accessed on 2 March 2017). The datasets feature the methylation beta values for 395,405 different probes, along with chromosome number and genomic coordinates. The dataset features methylation data for 303 STAD samples, with 29 EBVaGC, 313 EBVnGC (202 CIN, 58 MSI, 46 GS, 7 POLE), and 18 non-cancerous, normal control tissues. Correlations between the probe methylation beta values and the genomic loci were determined via R’s built-in wilcox.test function, with the conf.level parameter set to 0.95. Probe methylation beta with >50% zero or null values were marked as nonsignificant regardless of the calculated p-values. q-values were calculated for each comparison group, with an FDR of 5%. Boxplots and line plots were generated using the ggplot2 package (version 3.4.0). The maximum and minimum boxplot values were calculated as the 1.5× upper and lower quartile ranges, respectively.

2.8. Data Sources for Single-Cell Analysis, Patient Cohort Composition, and Analysis Workflow

The gene expressions of 48,000 cells obtained from newly diagnosed, treatment-naïve patients were obtained from Zhang et al. [32]. The dataset has 1 diffuse GC (DGC), 5 intestinal GC (IGC), 1 of which is EBVaGC, 3 mixed GC (MGC), 1 chronic gastritis (CG), and 2 normal control (NC) histopathological samples, each of which contributes 4000 cells to the overall dataset. The dataset was filtered down to 31,644 cells via the removal of potential doublets and apoptotic cells using a modified method outlined by Zhang et al. [32], with the filtering quality validated against the paper’s results. For each comparison, the log two-fold changes (Log2FC) of the gene expressions and the associated p-values were computed with the FindMarkers function, available through Seurat (version 4.3.0), with the logfc.threshold and min.pct parameters set to 0, and the densify parameter set to true. Violin plots were generated with the VlnPlot function, dimensional reduction plots with the DimPlot function, and feature plots with the FeaturePlot function, all of which are available through Seurat (version 4.3.0). Dimensional reduction plots were generated using the t-distributed stochastic neighbor embedding (t-SNE) reduction algorithm. A total of 12 t-SNE reduced datasets are available: the filtered dataset grouped by the patient histopathological type of the cell subpopulation, and subsets of the filtered dataset for the following 11 cell types: T, epithelial, B, plasma, erythroid, fibroblasts, macrophages/DCs, endothelial, endocrine, granulocyte, and parietal cells. With multiple selected genes, the gene signature was calculated by averaging the transcript levels for each cell, and the p-values were combined via Fisher integration of the p-values using the fisherp function available through the corto package (version 1.1.11).

3. Results

The EBV-GCR web suite is a collection of six unique tools, with each created to explore a variety of molecular or clinical characteristics that may be impacted by the EBV status in GC patients. Such characteristics include differential mRNA and miRNA expression, changes in immune landscape features, overall patient survival, and gene loci methylation. By employing the tools present in the EBV-GCR suite, each of these characteristics can be correlated with EBV status, viral or cellular gene expression, genomic loci, GC histopathological subtype, and cell subpopulations. Table 1 lists the number of samples used for the calculations for each EBV-GCR tool, with the exception of the single-cell analysis tool. Table S1 lists the number of samples used for the computations in the single-cell analysis tool.

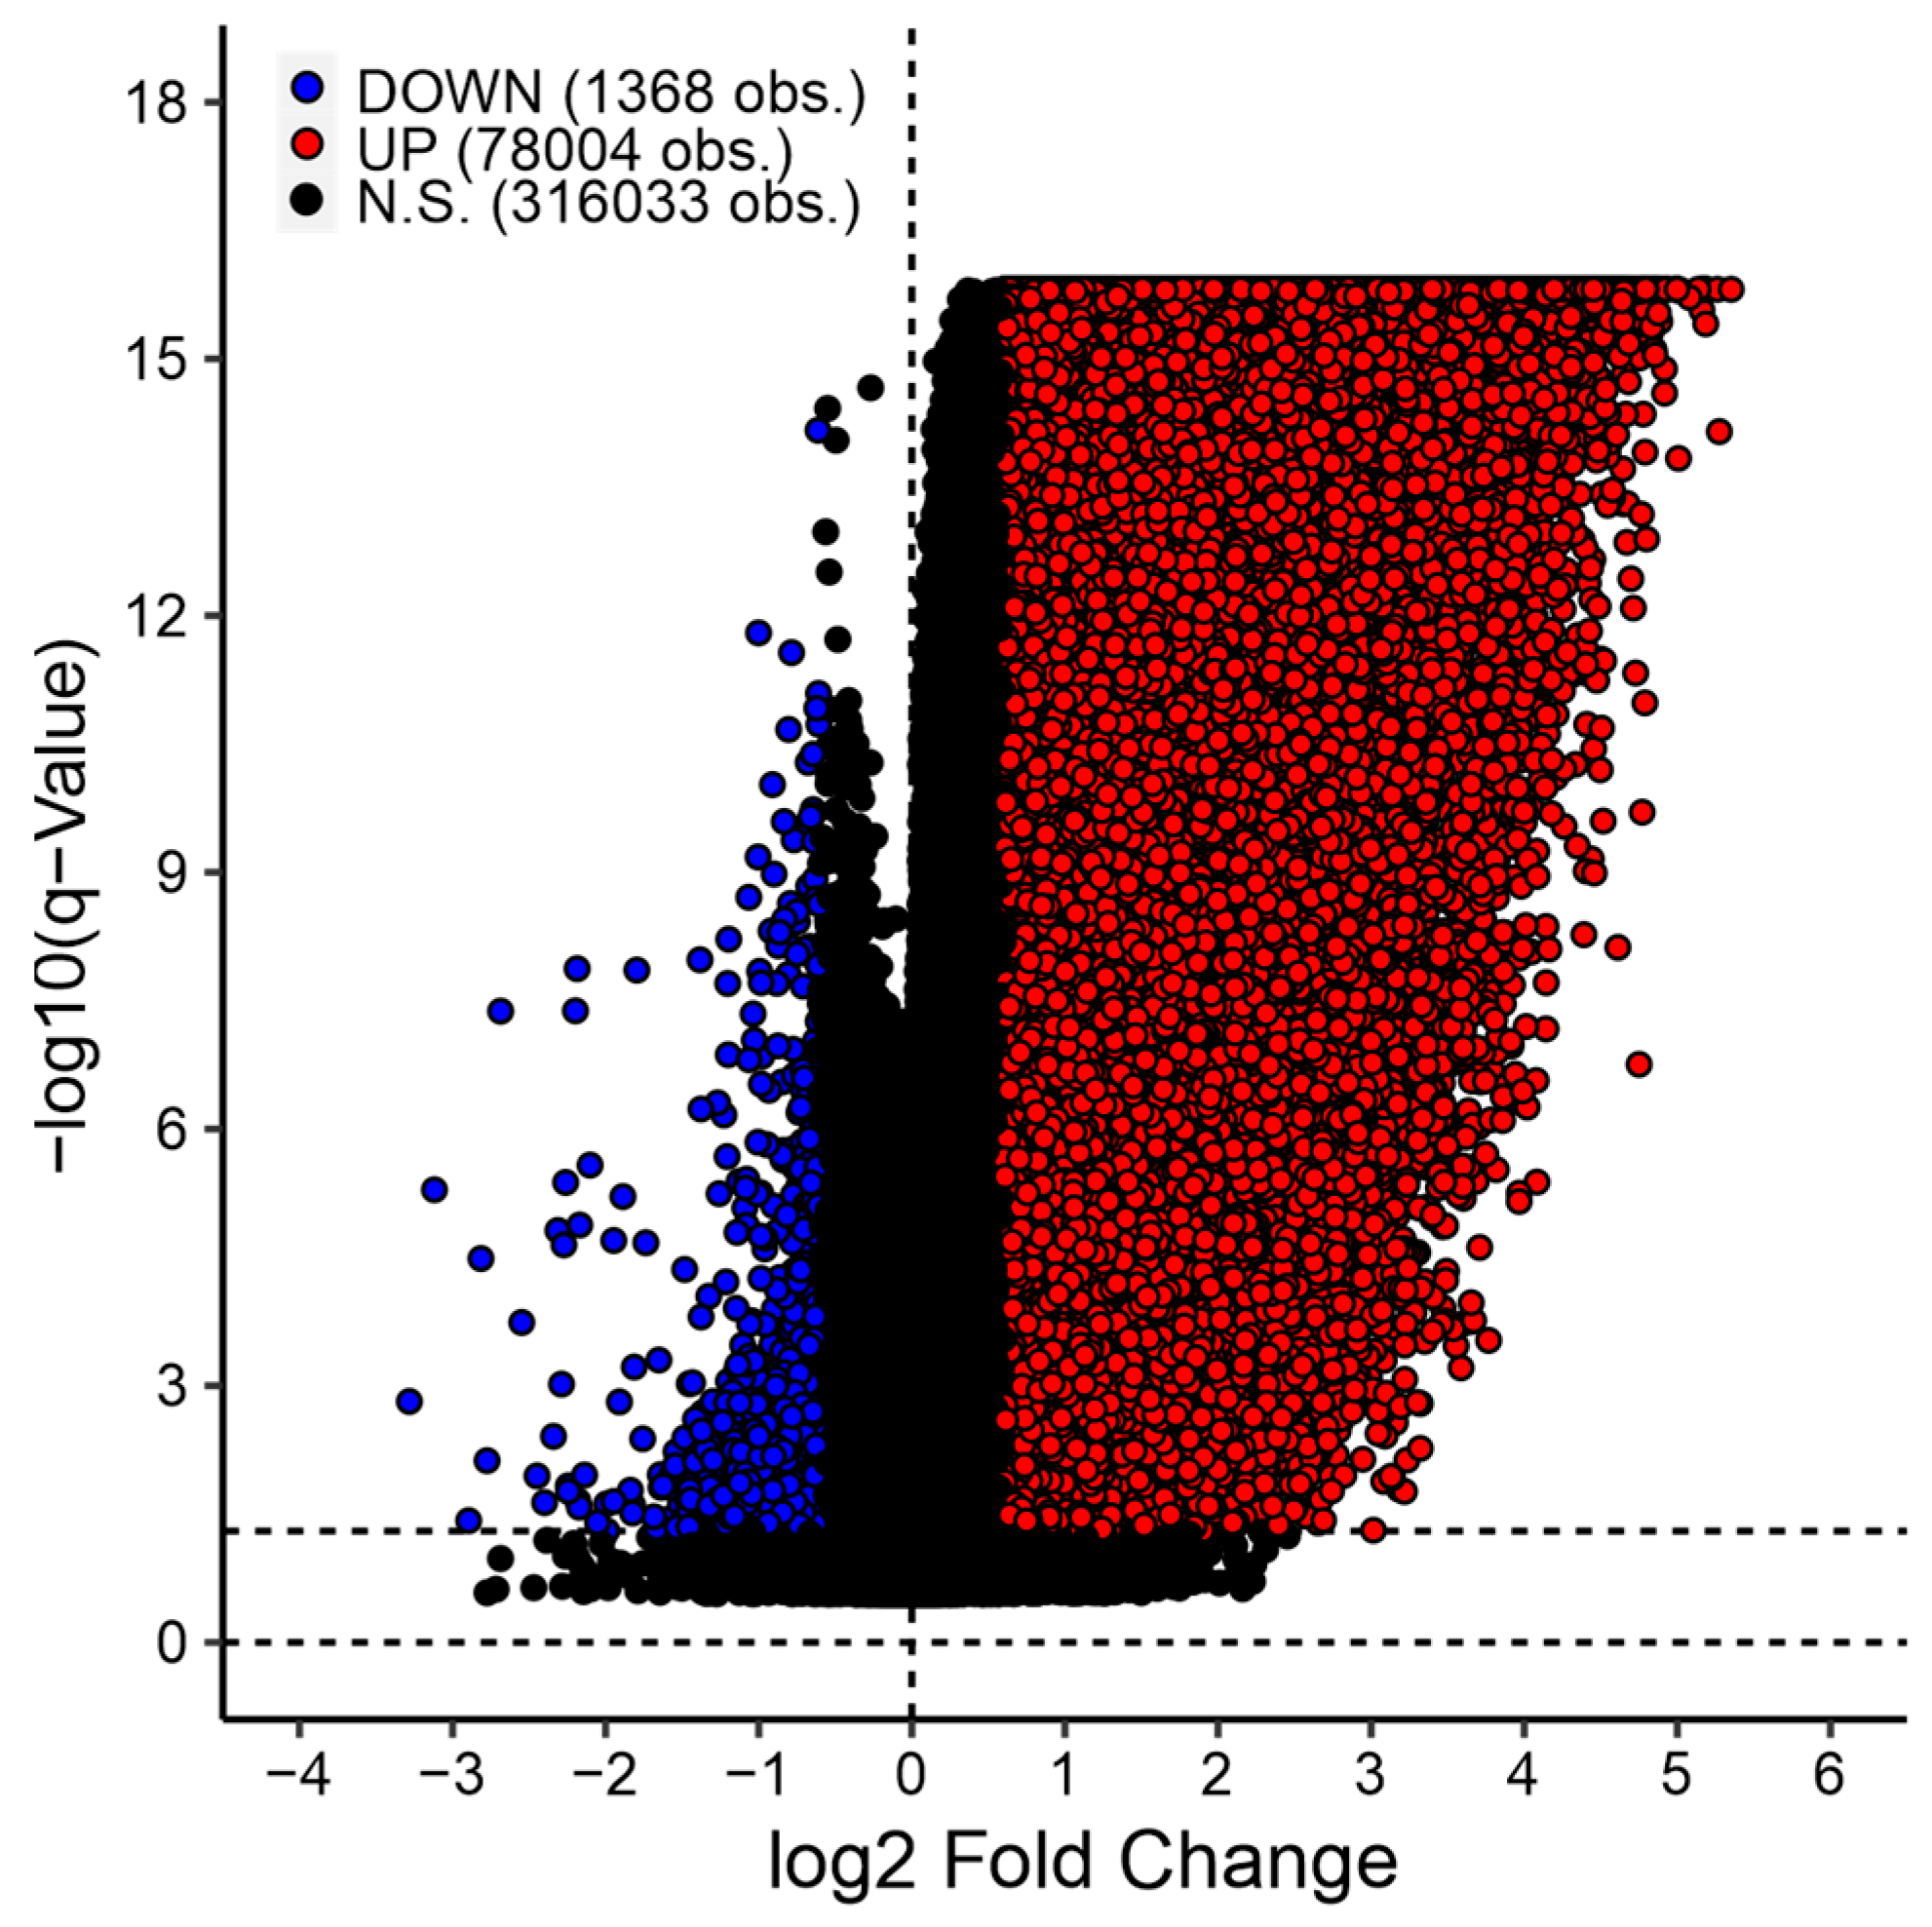
3.1. Differentially Expressed Gene Analysis

A hallmark of EBV is the ability to reprogram gene expression-infected epithelial and B cells, allowing for its prolonged survival within host cells [35]. In a small subset of infections, this leads to oncogenesis and cancer progression. These cancerous cells continue to express EBV proteins and miRNA [36,37]. As a result, thousands of cellular mRNAs and miRNAs are differentially expressed between EBVaGCs and EBVnGCs (Figure 1), many of which may play roles in immune responses, treatment resistance, cell cycle regulation, etc. The first tool in the EBV-GCR suite is the differential gene expression analysis tool. Users select a gene of interest (GOI), and a table of mRNA expression levels of normalized reads with a corresponding figure illustrating mRNA expression levels and a table of gene expression comparisons among STAD subtypes are generated. This allows users to examine differentially expressed genes (DEGs) among EBVaGC, MSI, GS, CIN, POLE, and normal control tissue. These data can be used to rapidly explore the expressions of STAD-related genes to validate experimental results or promote hypothesis generation.
The DEG tool is available in two versions: one for cellular mRNA genes and one for miRNA gene expression. For either tool, users can select a GOI, upon which two different boxplots are generated, showing the distribution of the expression levels of the GOI for EBVaGC, MSI, CIN, GS, POLE, and normal control samples. Pairwise p-values and associated q-values are shown for each comparison, with significant values highlighted. A table containing descriptive statistical information, including the sample size, minimum, maximum, and quartile values, is generated for each of the STAD subtypes. The generated boxplots can be resized via a grey triangle in the corner of the figure, and the figure itself can be downloaded as a raster (PNG) or vector (PDF) graphic. Statistical tables can be downloaded as CSV files, allowing for local data storage and analysis. Comprehensive master lists summarizing the gene expressions of all mRNAs and miRNAs are also downloadable through a link provided on each tool’s webpage.

3.2. Correlations between Cellular and Viral Gene Expressions

The vast number of DEGs observed between EBVaGCs and EBVnGCs may be the result of the interaction between EBV-associated viral factors and human genes. Given the ability of EBV to impact gene expression [17,38], we conducted a comprehensive analysis, in which both viral miRNA and mRNA expression data were correlated against cellular mRNA and miRNA expression data. The expressions of numerous cellular mRNAs and miRNAs were significantly correlated, whether positively or negatively, with EBV-associated mRNA (Table 3) and/or miRNA (Table 4) expression. The frequent presence of such correlations may suggest the existence of direct or indirect relationships between EBV and host-cell gene products, which could be further explored mechanistically.
The EBV-GCR suite has four tools for analyzing the correlations between cellular and viral gene expressions. These include the correlations of cellular mRNA with viral mRNA, cellular miRNA with viral mRNA, cellular mRNA with viral miRNA, and cellular miRNA with viral miRNA. For any of these tools, users select a GOI, for which a heatmap is generated, showing both the Spearman correlations and the significance levels of the GOI’s gene expression against 34 miR-BARTs and 3 miR-BHRF genes for the viral miRNA tools and 19 unique viral genes for the viral mRNA versions of the tool. p-values and the corresponding q-values are also calculated, with significant values highlighted. The generated heatmap can be resized via a grey triangle in the corner of the figure, and the figure itself can be downloaded as a raster (PNG) or vector (PDF) graphic. Tables summarizing the correlations and significance values can be downloaded as CSV files, allowing for local data storage and analysis. Downloadable lists summarizing the correlations of viral and cellular mRNAs/miRNAs are also available through a link provided on each tool’s webpage.

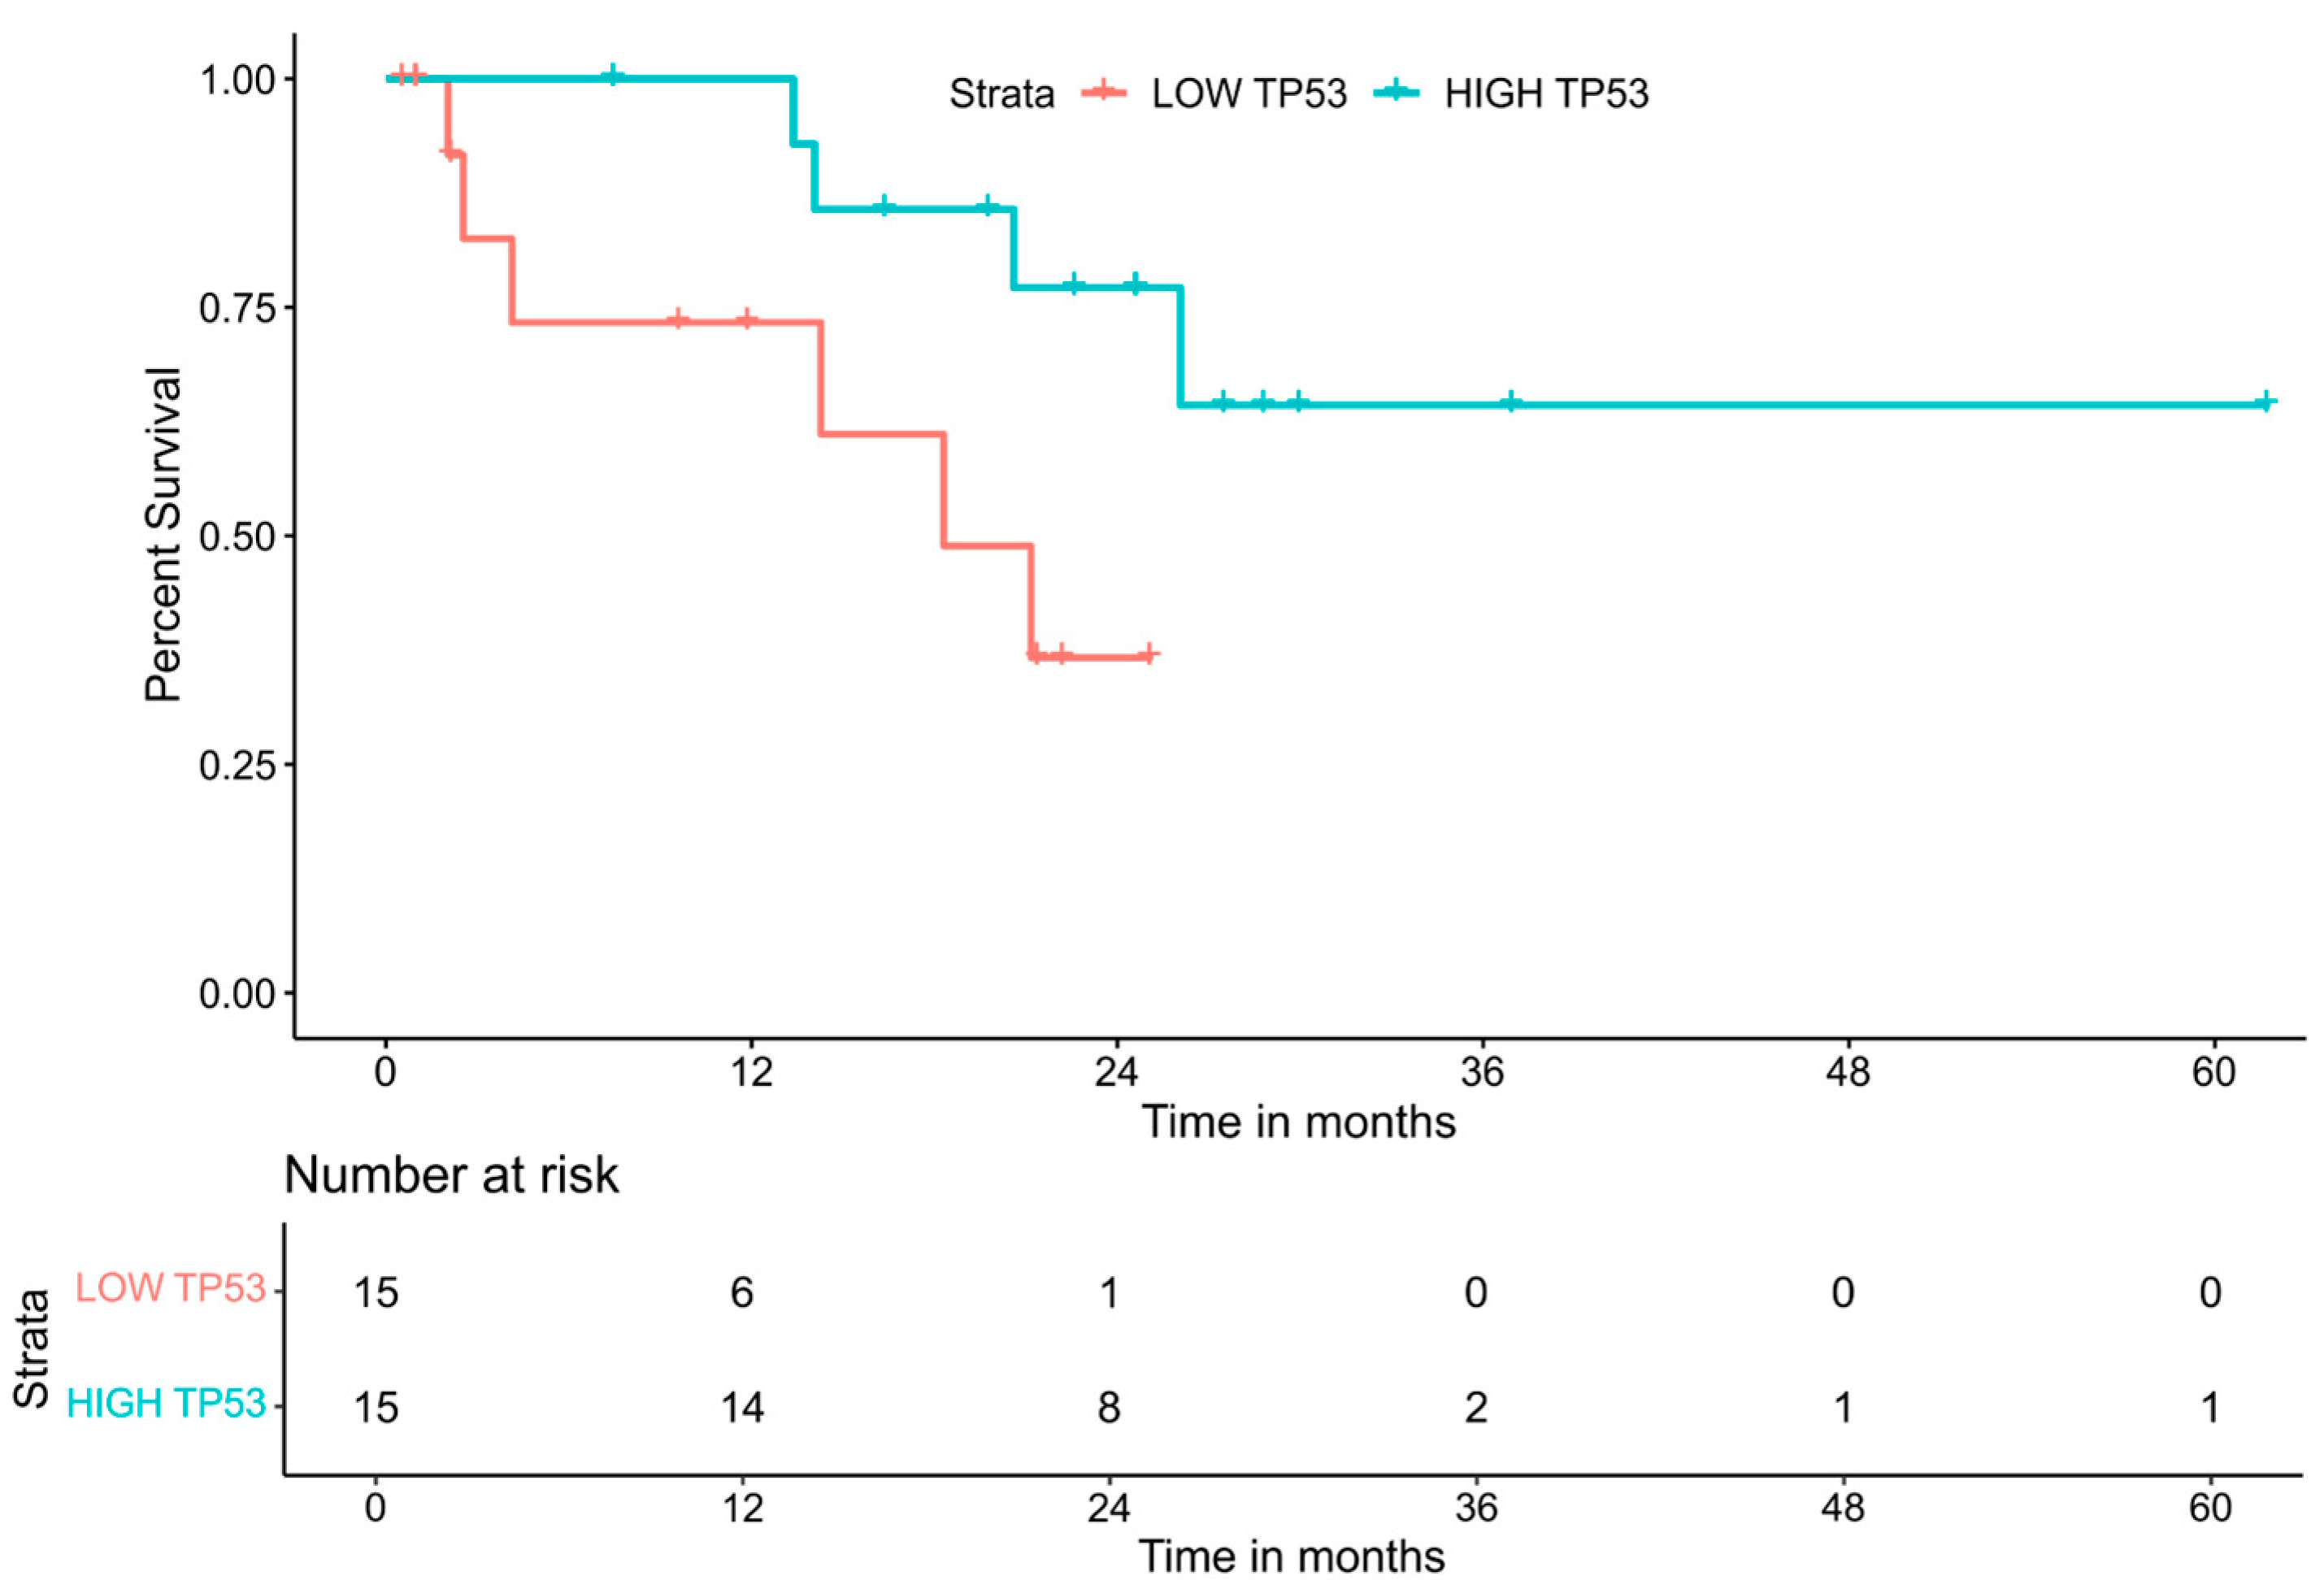
3.3. The Impact of Gene Expression Levels on Overall Survival

The availability of patient outcome data for a number of TCGA cohorts, including STAD [27], provides an excellent opportunity to explore the impact of altered gene expression on GC patient outcomes. A number of studies have previously employed the TCGA datasets for the elucidation of prognostic genes and gene signatures in a variety of cancers [39,40,41,42]. Our web suite of tools can provide a similar level of analysis; an example of a survival curve generated for p53 (TP53) is shown in Figure 2.
There are two versions of the EBV-GCR tool to explore the impact of cellular gene expression on overall patient survival. One explores the impact of cellular mRNA gene expression levels on overall patient survival and the other explores the impact of cellular miRNA gene expression levels on overall patient survival. For either tool, users can select a GOI, as well as the number of comparison groups, with users being limited to 2–4 different comparison groups, and each selection splitting the dataset equally into the number of desired comparison groups. Two comparison groups are titled low and high expression. Three comparison groups are low, mid, and high. Four comparison groups are low, mid-low, high-mid, and high. Upon the selection of both the GOI and the number of comparison groups, a Kaplan–Meier survival curve, along with a risk table, is generated for each of the STAD classifications; EBVaGC, MSI, CIN, GS, and POLE patient groups. Additionally, a table summarizing the pairwise p-values and associated q-values is generated, with significant values highlighted. The generated Kaplan–Meier survival curves can be resized via a grey triangle in the corner of the figure, and the figures can be downloaded as a raster (PNG) or vector (PDF) graphic. Tables summarizing the significance values can be downloaded as CSV files, allowing for local data storage and analysis.

3.4. The Correlation of Gene Expression Levels with Immune Landscape Features

With the rising clinical emphasis on cancer immunology and immunotherapy in the past decade, it is important to understand the interplay between the immune system in cancer progression and its effects on clinical outcomes [43,44]. The tumor immune landscape of the tumor microenvironment has been shown to play a major role in patient outcomes in GCs [45,46]. In particular, EBVaGCs are “immune hot” tumors with higher levels of MHC I and II expression and cytotoxic T cell infiltration and activation when compared to EBVnGCs. [12,13,15,16,47]. Due to their unique immune features, understanding how EBVaGCs differ in relation to EBVnGCs may help elucidate the underlying mechanisms of EBV-mediated changes in the tumor immune landscape and may eventually result in better treatment options for EBVaGC patients.
There are three versions of the tool to correlate cellular and viral gene expressions with the immune landscape. These are: the correlation of cellular mRNA with immune landscape features, the correlation of cellular miRNA with immune landscape features, and the correlation of viral mRNA and miRNA with immune landscape features. For any of the tools, users select a GOI, which generates a table showing both the Spearman correlation and significance level of the GOI’s gene expression with the 53 immune landscape features (Table 2). The tools for cellular genes generate tables and figures for all samples, whereas the tool featuring viral genes only shows data from the EBVaGC sample group. Significant correlations are highlighted. Users also have the option of selecting an immune landscape feature, which generates a scatterplot depicting correlations between the GOI gene expression levels and the selected immune landscape feature. A boxplot depicting differences in the specific immune landscape feature between the comparison group is also generated, along with a table with pairwise p-values. The tool featuring viral genes does not generate either the boxplot or the associated table. Additionally, a table containing descriptive statistics, such as the sample size, minimum, maximum, and quartile values, is generated for each of the subsets exhibited within the correlation plots and boxplots. The generated boxplot and correlation plot can be resized via a grey triangle in the corner of the figure, and the figures can be downloaded as a raster (PNG) or vector (PDF) graphic. Tables summarizing correlations, detailed statistical information, and significance values can be downloaded as CSV files, allowing for local storage and analysis. An example of the sample output of this subset of tools is provided in Figure 3.

3.5. Differential Probe Methylation Analysis

EBVaGCs are considered to be one of the most hypermethylated tumors, with genome-wide hypermethylation of promoters and genes associated with tumor suppressor functions [29,46] likely contributing to oncogenesis. Indeed, many hypermethylated probes are clearly detected in EBVaGCs from the TCGA STAD cohort, but there is also a fraction of probes that are hypomethylated (Figure 4). The relevance of differential methylation in EBVaGCs has previously been shown [48,49,50], but with our comprehensive, user-friendly tool, studying differential methylation in STAD is possible for a wider range of researchers. Furthermore, when this tool is used in conjunction with the differential gene expression tool, genes that are up- or down-regulated as a result of methylation patterns can be identified.
The tool facilitating differential probe methylation analysis can be used for both the mRNA and miRNA STAD datasets. When users select a GOI, the genomic region and 100,000 base pairs 5′ and 3′ around both sides of the GOI are searched for methylation marks across the encompassed probes. A line plot summarizing the average methylation beta values across EBVaGC, MSI, CIN, GS, POLE, and normal control samples is generated. The line plot displays an arrow representing the coding strand for the GOI, with the left-to-right strand representing the forward orientation and the other strand representing the reverse strand orientation. A comparison table with the p-values, q-values, the names of genes associated with the probe, and their chromosomal coordinates is generated, displaying all probes within the selected region. Significant values are highlighted and indicate significant differences in probe methylation. Users then have the option of choosing a probe from the selected region, via an additional dropdown menu, in order to generate a boxplot displaying the methylation beta values across EBVaGC, MSI, CIN, GS, POLE, and normal control samples. The generated line plot and boxplot can be resized via a grey triangle in the corner of the figure, and the figures can be downloaded as a raster (PNG) or vector (PDF) graphic. Tables summarizing the genomic information and significance values can be downloaded as CSV files, allowing for local storage and analysis. A downloadable master list summarizing all differentially methylated probes is also available on each tool’s webpage, which can assist users in identifying DMPs.

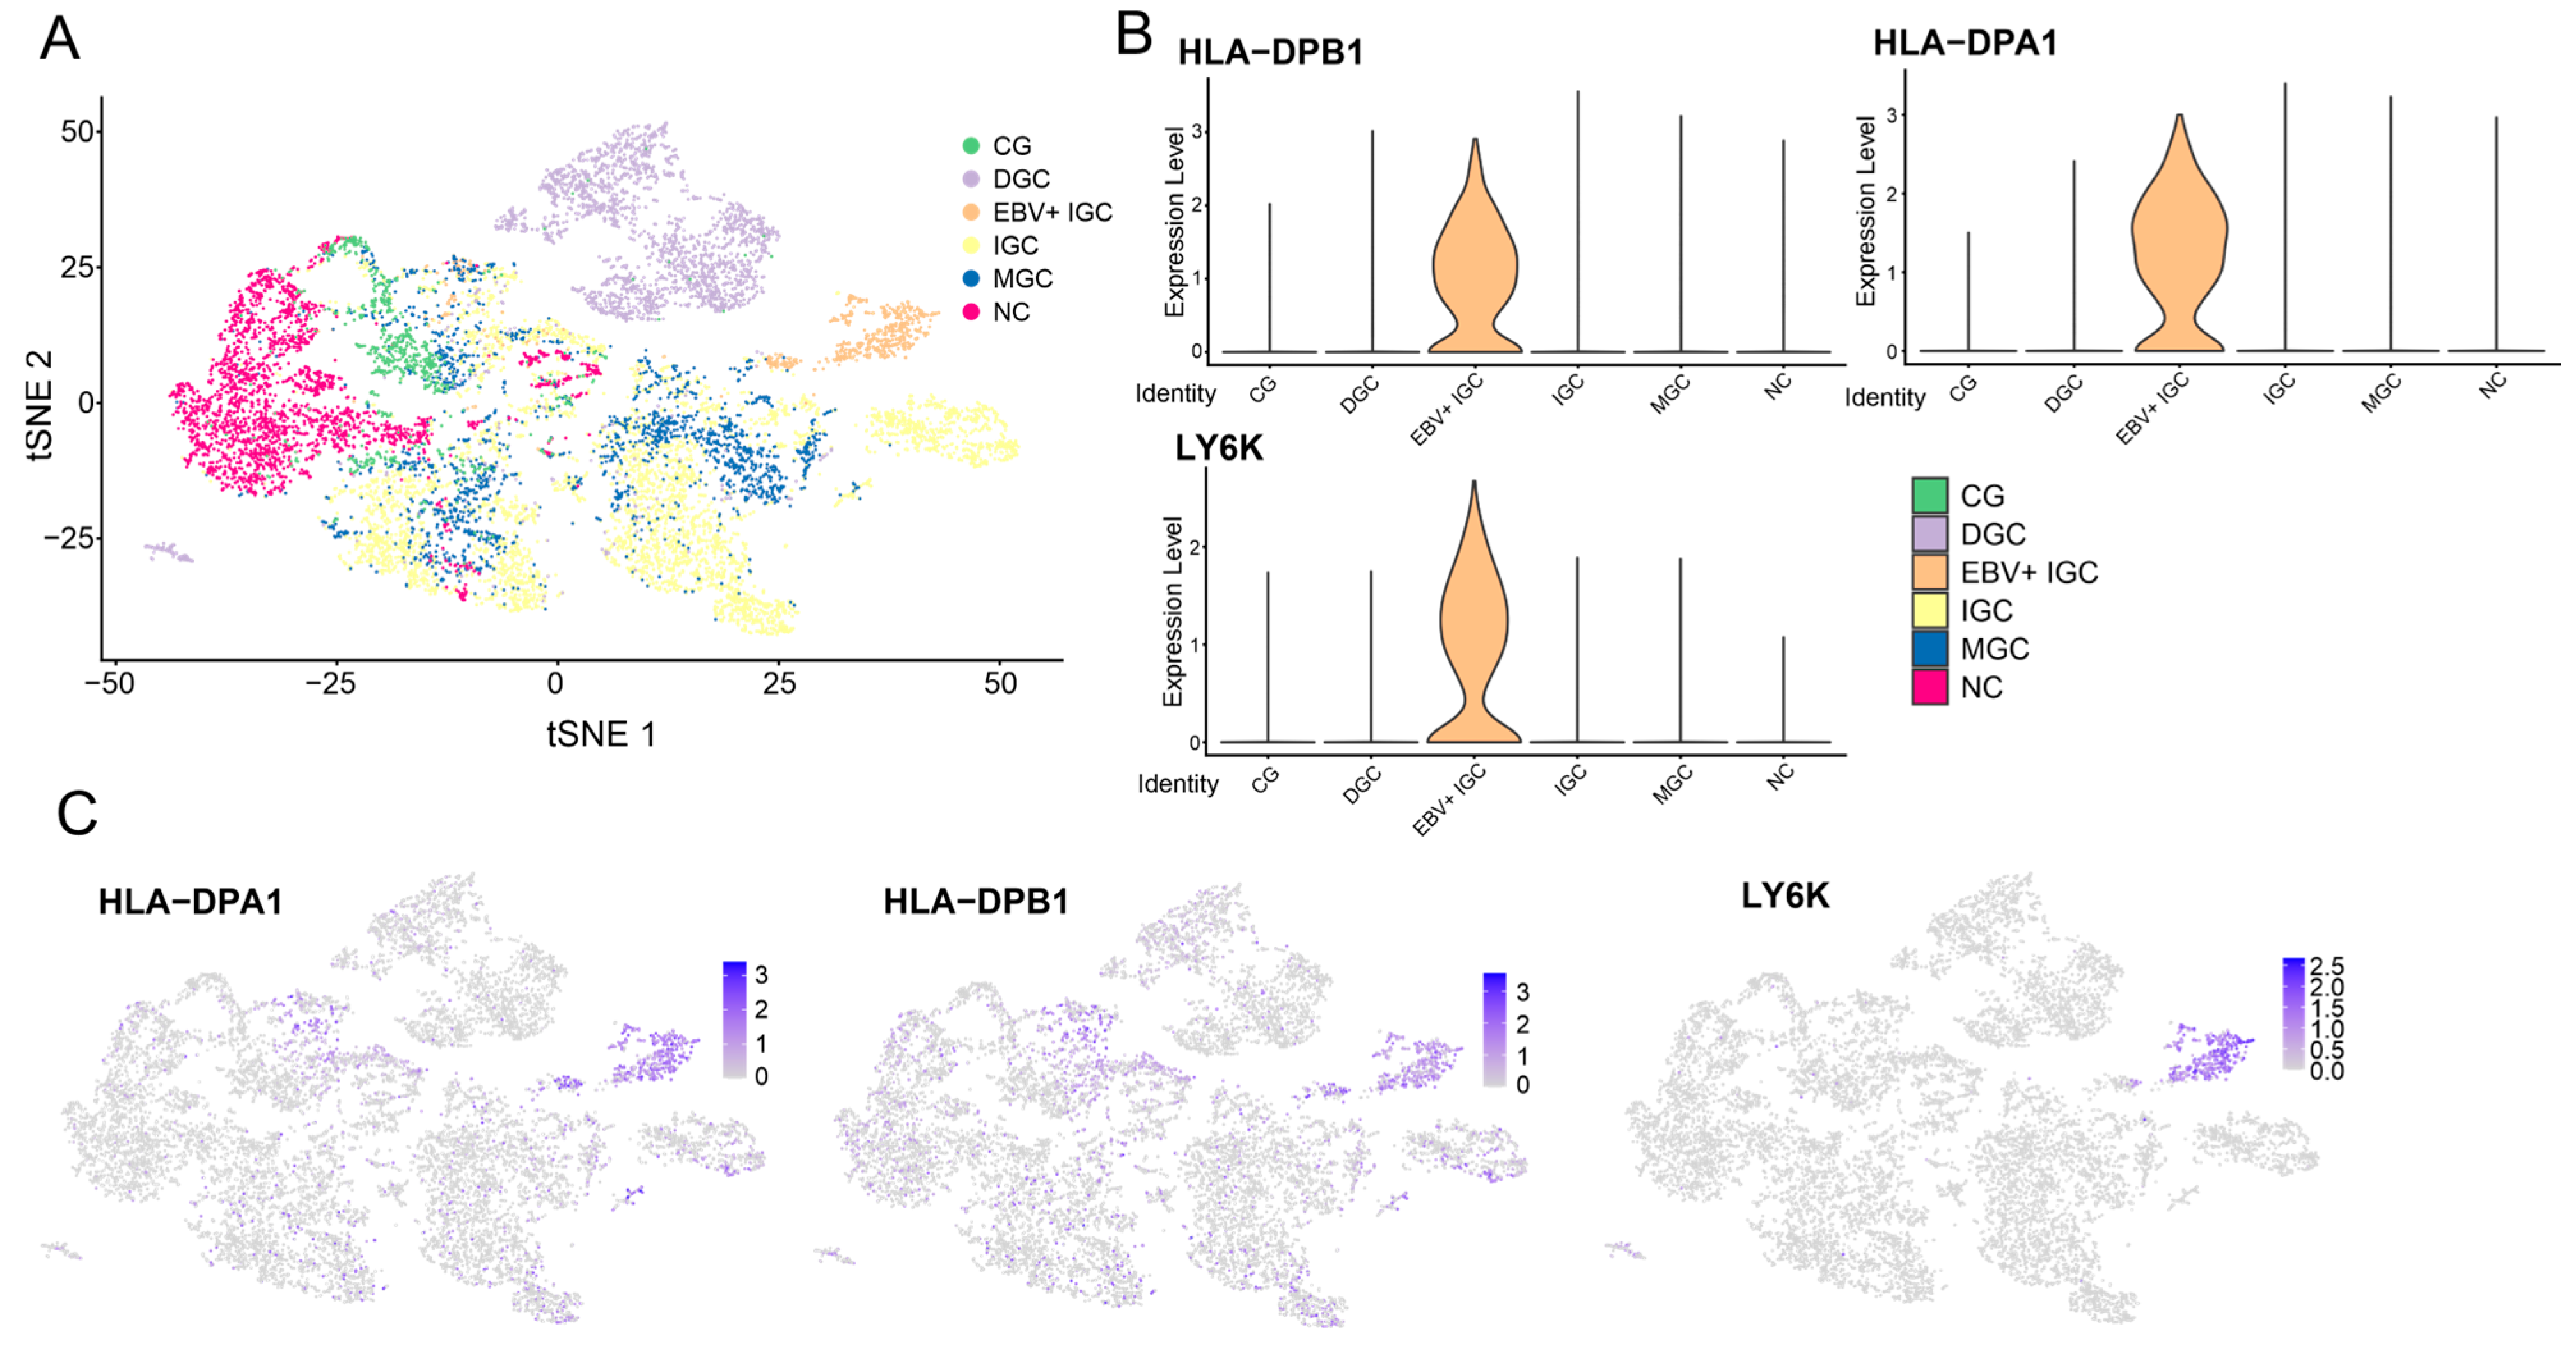
3.6. Single-Cell Analysis

Bulk RNA sequencing is a technology that allows researchers to look at general expression patterns across tumors but suffers from sampling bias due to intra-tumor heterogeneity, lack of data regarding tumor cellular composition, and lower data fidelity [51,52]. Single-cell RNA sequencing (scRNA-seq) and several other RNA-sequencing techniques have been developed to help remedy some of these issues. In particular, scRNA-seq enables the single-cell resolution of thousands of cells, allowing for the identification of various cell populations, increased resolution of intra-tumoral heterogeneity, and co-expression patterns of genes [53]. The scRNA-seq tool in EBV-GCR is a useful tool to validate results from bulk RNA sequencing and provides a more in-depth understanding of the tumor microenvironment.
The single-cell analysis tool is based on our analysis of the raw data available from Zhang et al. [32] to compare the relative gene expression in cells from different cell subpopulations found in GCs, as well as across different histopathological types. This tool allows users to select which grouping to use for the single-cell data, as well as one or more GOIs. If only the grouping is selected, a t-SNE dimensional reduction plot is generated, showing the breakdown by patient histopathology or cell type depending on the option selected. If both the grouping and the GOI(s) are selected, in addition to the dimensional reduction plot, a violin plot depicting the relative expressions across the different groupings and a feature plot depicting the relative gene expressions of cells within the confines of the dimensional reduction plot are generated. Additionally, a table summarizing the pairwise p-values and associated Bonferroni-adjusted p-values is generated, with significant differences in gene expression highlighted. The generated dimensional reduction, violin, and feature plots can be resized via a grey triangle in the corner of the figure, and the figures can be downloaded as a raster (PNG) or vector (PDF) graphic. Tables summarizing the significant values can be downloaded as CSV files, allowing for local storage and analysis. An example of the sample output of this tool is provided in Figure 5.

3.7. Example Case Study

As an example validation of the utility of the EBV-GCR tool suite, we surveyed the existing literature for a target gene reported in multiple independent studies to be deregulated by EBV in cell culture models and non-TCGA GC datasets. We selected TFF1, a trefoil family gene encoding a secretory protein expressed in gastrointestinal mucosa. Multiple reports indicate that TFF1 expression is downregulated by the EBV infection of AGS or MKN7 gastric cells [54,55,56]. TFF1 mRNA levels were similarly reduced in non-TCGA cohort-based EBVaGC samples compared to their EBVnGC counterparts [57]. Using the differential gene expression tool for EBV-GCR, a similar, statistically significant downregulation of TFF1 expression was also observed in the TCGA bulk sequencing data (Figure 6A). Both cell culture infection models and non-TCGA cohort EBVaGC data have identified increased methylation of the TFF1 gene in the presence of EBV [54,57]. The methylation and silencing can be reversed by 5-aza−2′-deoxycytidine treatment in culture, suggesting that EBV-induced hypermethylation is important for this repression [54]. Using the EBVaGC methylation tool, in good agreement with the published data, an increased level of methylation was observed across the promoter and coding region of TFF1 in EBVaGCs compared to the other types of GCs, and this was statistically significant in nearly all cases (Figure 6B). Finally, we used the EBV-GCR scRNA-seq analysis tool to demonstrate that TFF1 expression was significantly reduced in EBV+ IGC epithelial cells vs. EBV-negative gastric epithelial cells (Figure 6C). Thus, the EBV-GCR tools may be helpful for validating experimental results from tissue culture infection models, and they appear to align with the existing clinically derived data.

4. Discussion

The vast scale of data provided by the TCGA is an invaluable resource for cancer research, including the study of viral oncogenesis. Although the processed data is freely available via the Broad GDAC Firehose (https://gdac.broadinstitute.org/ accessed on 2 March 2017), the accessibility of such data to researchers without significant computational and bioinformatics skills is limited without substantial investments in time, money, and resources to make these resources easily usable. To help fill this niche, a number of web-based tools have been developed [31,58,59]. The EBV-GCR has been created to provide a wide array of tools for researchers studying EBV oncogenesis in the TCGA STAD cohort. The tools provided by the EBV-GCR include the impact of EBV status on cellular mRNA, miRNA expression levels, and DNA methylation. The EBV-GCR can also perform correlations between cellular gene expression and viral gene expression. Correlation analysis of cellular and viral gene expression with immune landscape features can also be performed. Patient overall survival outcomes can be correlated with cellular gene expression and EBV status. The user-friendly, interactive interface facilitates the conversion of complex data into easy-to-read and intuitive tables and figures, a feature not shared by all analogous web tools.
EBV-GCR also provides the invaluable opportunity of easily downloading both graphical and tabular interpretations for each tool. At the press of a button, users can either download either a vector or raster version of the generated graphic, which users can resize prior to download. The same applies to tabular data, where users can download an easily readable file, which can be used for further analyses and figure generation. Additionally, comprehensive master list files of DEGs, DMPs, and cellular/viral gene expression correlations can also be downloaded for further analysis or reference and allows for the narrowing down of a GOI for further experimental analysis.
To sum up, the EBV-GCR provides an intuitive and data-rich interface for the exploration and interpretation of EBV-dependent changes in gene expression, immune landscape features, patient outcomes, and DNA methylation using molecularly annotated STAD datasets from the TCGA. Single-cell gene expression data can also be examined by the GC histopathological subtype and/or cell subpopulations using datasets from Zhang et al. [32]. Comparisons among EBVaGC, EBVnGC, and normal control samples are possible via a variety of graphs and comprehensive summary tables. Such data can serve as an excellent resource for the validation of experimental observations in model systems and can facilitate the process of novel hypothesis generation. The EBV-GCR is freely accessible at https://mymryklab.ca/EBV-GCR/ebvgcr-home/.

Supplementary Materials

The following supporting information can be downloaded at: https://www.mdpi.com/article/10.3390/v15040853/s1, Table S1: Number of patient samples and cells analyzed for the single-cell analysis tool using the Zhang et al. scRNA-seq cohort [32].

Author Contributions

Conceptualization, M.Y.S. and J.S.M.; methodology, M.Y.S.; software, M.Y.S., E.W. and E.C.; formal analysis, M.Y.S.; data curation, M.Y.S. and J.S.M.; writing—original draft preparation, M.Y.S. and J.S.M.; writing—review and editing, J.S.M. and M.A.P.; supervision, P.S. and J.S.M.; funding acquisition, J.S.M. All authors have read and agreed to the published version of the manuscript.

Funding

This work was supported by a grant from the Canadian Institutes of Health Research (PJT-173496) to J.S.M.

Institutional Review Board Statement

Not applicable.

Informed Consent Statement

Not applicable.

Data Availability Statement

All data are available via the EBV-GCR website or the downloadable standalone Windows version.

Acknowledgments

We thank Shuofeng Hu for providing access to the raw scRNA-seq gene read values from their previous study.

Conflicts of Interest

The authors declare no conflict of interest.

References

  1. Rowe, M.; Zuo, J. Immune Responses to Epstein-Barr Virus: Molecular Interactions in the Virus Evasion of CD8+ T Cell Immunity. Microbes Infect. 2010, 12, 173–181. [Google Scholar] [CrossRef] [PubMed]
  2. Young, L.S.; Rickinson, A.B. Epstein-Barr Virus: 40 Years On. Nat. Rev. Cancer 2004, 4, 757–768. [Google Scholar] [CrossRef]
  3. Eichelberg, M.R.; Welch, R.; Guidry, J.T.; Ali, A.; Ohashi, M.; Makielski, K.R.; McChesney, K.; Van Sciver, N.; Lambert, P.F.; Keleș, S.; et al. Epstein-Barr Virus Infection Promotes Epithelial Cell Growth by Attenuating Differentiation-Dependent Exit from the Cell Cycle. mBio 2019, 10, e01332-19. [Google Scholar] [CrossRef] [PubMed] [Green Version]
  4. Nishikawa, J.; Imai, S.; Oda, T.; Kojima, T.; Okita, K.; Takada, K. Epstein-Barr Virus Promotes Epithelial Cell Growth in the Absence of EBNA2 and LMP1 Expression. J. Virol. 1999, 73, 1286–1292. [Google Scholar] [CrossRef] [Green Version]
  5. Albanese, M.; Tagawa, T.; Hammerschmidt, W. Strategies of Epstein-Barr Virus to Evade Innate Antiviral Immunity of Its Human Host. Front. Microbiol. 2022, 13, 955603. [Google Scholar] [CrossRef]
  6. Yin, H.; Qu, J.; Peng, Q.; Gan, R. Molecular Mechanisms of EBV-Driven Cell Cycle Progression and Oncogenesis. Med. Microbiol. Immunol. 2019, 208, 573–583. [Google Scholar] [CrossRef] [Green Version]
  7. Prusinkiewicz, M.A.; Mymryk, J.S. Metabolic Control by DNA Tumor Virus-Encoded Proteins. Pathogens 2021, 10, 560. [Google Scholar] [CrossRef]
  8. Shannon-Lowe, C.; Rickinson, A. The Global Landscape of EBV-Associated Tumors. Front. Oncol. 2019, 9, 713. [Google Scholar] [CrossRef] [Green Version]
  9. Han, S.; Tay, J.K.; Loh, C.J.L.; Chu, A.J.M.; Yeong, J.P.S.; Lim, C.M.; Toh, H.C. Epstein-Barr Virus Epithelial Cancers-A Comprehensive Understanding to Drive Novel Therapies. Front. Immunol. 2021, 12, 734293. [Google Scholar] [CrossRef]
  10. Fukayama, M.; Ushiku, T. Epstein-Barr Virus-Associated Gastric Carcinoma. Pathol. Res. Pract. 2011, 207, 529–537. [Google Scholar] [CrossRef]
  11. Akiba, S.; Koriyama, C.; Herrera-Goepfert, R.; Eizuru, Y. Epstein-Barr Virus Associated Gastric Carcinoma: Epidemiological and Clinicopathological Features. Cancer Sci. 2008, 99, 195–201. [Google Scholar] [CrossRef] [PubMed]
  12. Ghasemi, F.; Gameiro, S.F.; Tessier, T.M.; Maciver, A.H.; Mymryk, J.S. High Levels of Class I Major Histocompatibility Complex MRNA Are Present in Epstein-Barr Virus-Associated Gastric Adenocarcinomas. Cells 2020, 9, 499. [Google Scholar] [CrossRef] [PubMed] [Green Version]
  13. Ghasemi, F.; Tessier, T.M.; Gameiro, S.F.; Maciver, A.H.; Cecchini, M.J.; Mymryk, J.S. High MHC-II Expression in Epstein-Barr Virus-Associated Gastric Cancers Suggests That Tumor Cells Serve an Important Role in Antigen Presentation. Sci. Rep. 2020, 10, 14786. [Google Scholar] [CrossRef] [PubMed]
  14. Cho, J.; Kang, M.-S.; Kim, K.-M. Epstein-Barr Virus-Associated Gastric Carcinoma and Specific Features of the Accompanying Immune Response. J. Gastric Cancer 2016, 16, 1–7. [Google Scholar] [CrossRef] [PubMed] [Green Version]
  15. Ma, J.; Li, J.; Hao, Y.; Nie, Y.; Li, Z.; Qian, M.; Liang, Q.; Yu, J.; Zeng, M.; Wu, K. Differentiated Tumor Immune Microenvironment of Epstein-Barr Virus-Associated and Negative Gastric Cancer: Implication in Prognosis and Immunotherapy. Oncotarget 2017, 8, 67094–67103. [Google Scholar] [CrossRef] [Green Version]
  16. Salnikov, M.; Prusinkiewicz, M.A.; Lin, S.; Ghasemi, F.; Cecchini, M.J.; Mymryk, J.S. Tumor-Infiltrating T Cells in EBV-Associated Gastric Carcinomas Exhibit High Levels of Multiple Markers of Activation, Effector Gene Expression, and Exhaustion. Viruses 2023, 15, 176. [Google Scholar] [CrossRef]
  17. Zhang, J.; Huang, T.; Zhou, Y.; Cheng, A.S.L.; Yu, J.; To, K.F.; Kang, W. The Oncogenic Role of Epstein-Barr Virus-Encoded MicroRNAs in Epstein-Barr Virus-Associated Gastric Carcinoma. J. Cell. Mol. Med. 2018, 22, 38–45. [Google Scholar] [CrossRef]
  18. Morales-Sanchez, A.; Fuentes-Panana, E.M. Epstein-Barr Virus-Associated Gastric Cancer and Potential Mechanisms of Oncogenesis. Curr. Cancer Drug Targets 2017, 17, 534–554. [Google Scholar] [CrossRef]
  19. Tavakoli, A.; Monavari, S.H.; Solaymani Mohammadi, F.; Kiani, S.J.; Armat, S.; Farahmand, M. Association between Epstein-Barr Virus Infection and Gastric Cancer: A Systematic Review and Meta-Analysis. BMC Cancer 2020, 20, 493. [Google Scholar] [CrossRef]
  20. Shinozaki-Ushiku, A.; Kunita, A.; Fukayama, M. Update on Epstein-Barr Virus and Gastric Cancer (Review). Int. J. Oncol. 2015, 46, 1421–1434. [Google Scholar] [CrossRef] [Green Version]
  21. Cui, X.; Snapper, C.M. Epstein Barr Virus: Development of Vaccines and Immune Cell Therapy for EBV-Associated Diseases. Front. Immunol. 2021, 12, 734471. [Google Scholar] [CrossRef] [PubMed]
  22. Yoon, S.J.; Kim, J.Y.; Long, N.P.; Min, J.E.; Kim, H.M.; Yoon, J.H.; Anh, N.H.; Park, M.C.; Kwon, S.W.; Lee, S.K. Comprehensive Multi-Omics Analysis Reveals Aberrant Metabolism of Epstein-Barr-Virus-Associated Gastric Carcinoma. Cells 2019, 8, 1220. [Google Scholar] [CrossRef] [PubMed] [Green Version]
  23. Burton, E.M.; Gewurz, B.E. Epstein-Barr Virus Oncoprotein-Driven B Cell Metabolism Remodeling. PLoS Pathog. 2022, 18, e1010254. [Google Scholar] [CrossRef]
  24. Hassani, A.; Khan, G. What Do Animal Models Tell Us about the Role of EBV in the Pathogenesis of Multiple Sclerosis? Front. Immunol. 2022, 13, 1036155. [Google Scholar] [CrossRef] [PubMed]
  25. Ahmed, E.H.; Baiocchi, R.A. Murine Models of Epstein-Barr Virus-Associated Lymphomagenesis. ILAR J. 2016, 57, 55–62. [Google Scholar] [CrossRef] [Green Version]
  26. Thorsson, V.; Gibbs, D.L.; Brown, S.D.; Wolf, D.; Bortone, D.S.; Ou Yang, T.-H.; Porta-Pardo, E.; Gao, G.F.; Plaisier, C.L.; Eddy, J.A.; et al. The Immune Landscape of Cancer. Immunity 2018, 48, 812–830.e14. [Google Scholar] [CrossRef] [Green Version]
  27. Liu, J.; Lichtenberg, T.; Hoadley, K.A.; Poisson, L.M.; Lazar, A.J.; Cherniack, A.D.; Kovatich, A.J.; Benz, C.C.; Levine, D.A.; Lee, A.V.; et al. An Integrated TCGA Pan-Cancer Clinical Data Resource to Drive High-Quality Survival Outcome Analytics. Cell 2018, 173, 400–416.e11. [Google Scholar] [CrossRef] [Green Version]
  28. Liu, Y.; Sethi, N.S.; Hinoue, T.; Schneider, B.G.; Cherniack, A.D.; Sanchez-Vega, F.; Seoane, J.A.; Farshidfar, F.; Bowlby, R.; Islam, M.; et al. Comparative Molecular Analysis of Gastrointestinal Adenocarcinomas. Cancer Cell 2018, 33, 721–735.e8. [Google Scholar] [CrossRef] [Green Version]
  29. Cancer Genome Atlas Research Network. Comprehensive Molecular Characterization of Gastric Adenocarcinoma. Nature 2014, 513, 202–209. [Google Scholar] [CrossRef] [Green Version]
  30. Zhang, Z.; Li, H.; Jiang, S.; Li, R.; Li, W.; Chen, H.; Bo, X. A Survey and Evaluation of Web-Based Tools/Databases for Variant Analysis of TCGA Data. Brief. Bioinform. 2019, 20, 1524–1541. [Google Scholar] [CrossRef]
  31. Salnikov, M.; Gameiro, S.F.; Zeng, P.Y.F.; Barrett, J.W.; Nichols, A.C.; Mymryk, J.S. The HPV Induced Cancer Resource (THInCR): A Suite of Tools for Investigating HPV-Dependent Human Carcinogenesis. mSphere 2022, 7, e0031722. [Google Scholar] [CrossRef] [PubMed]
  32. Zhang, M.; Hu, S.; Min, M.; Ni, Y.; Lu, Z.; Sun, X.; Wu, J.; Liu, B.; Ying, X.; Liu, Y. Dissecting Transcriptional Heterogeneity in Primary Gastric Adenocarcinoma by Single Cell RNA Sequencing. Gut 2021, 70, 464–475. [Google Scholar] [CrossRef]
  33. Chakravorty, S.; Yan, B.; Wang, C.; Wang, L.; Quaid, J.T.; Lin, C.F.; Briggs, S.D.; Majumder, J.; Canaria, D.A.; Chauss, D.; et al. Integrated Pan-Cancer Map of EBV-Associated Neoplasms Reveals Functional Host-Virus Interactions. Cancer Res. 2019, 79, 6010–6023. [Google Scholar] [CrossRef] [PubMed] [Green Version]
  34. Ungerleider, N.; Bullard, W.; Kara, M.; Wang, X.; Roberts, C.; Renne, R.; Tibbetts, S.; Flemington, E.K. EBV MiRNAs Are Potent Effectors of Tumor Cell Transcriptome Remodeling in Promoting Immune Escape. PLoS Pathog. 2021, 17, e1009217. [Google Scholar] [CrossRef] [PubMed]
  35. Scott, R.S. Epstein-Barr Virus: A Master Epigenetic Manipulator. Curr. Opin. Virol. 2017, 26, 74–80. [Google Scholar] [CrossRef] [PubMed]
  36. De Re, V.; Caggiari, L.; De Zorzi, M.; Fanotto, V.; Miolo, G.; Puglisi, F.; Cannizzaro, R.; Canzonieri, V.; Steffan, A.; Farruggia, P.; et al. Epstein-Barr Virus BART MicroRNAs in EBV- Associated Hodgkin Lymphoma and Gastric Cancer. Infect. Agents Cancer 2020, 15, 42. [Google Scholar] [CrossRef]
  37. Polakovicova, I.; Jerez, S.; Wichmann, I.A.; Sandoval-Bórquez, A.; Carrasco-Véliz, N.; Corvalán, A.H. Role of MicroRNAs and Exosomes in Helicobacter Pylori and Epstein-Barr Virus Associated Gastric Cancers. Front. Microbiol. 2018, 9, 636. [Google Scholar] [CrossRef] [Green Version]
  38. Nishikawa, J.; Iizasa, H.; Yoshiyama, H.; Nakamura, M.; Saito, M.; Sasaki, S.; Shimokuri, K.; Yanagihara, M.; Sakai, K.; Suehiro, Y.; et al. The Role of Epigenetic Regulation in Epstein-Barr Virus-Associated Gastric Cancer. Int. J. Mol. Sci. 2017, 18, 1606. [Google Scholar] [CrossRef] [Green Version]
  39. Nagy, Á.; Munkácsy, G.; Győrffy, B. Pancancer Survival Analysis of Cancer Hallmark Genes. Sci. Rep. 2021, 11, 6047. [Google Scholar] [CrossRef]
  40. Chen, X.; Pan, C.; Xu, C.; Sun, Y.; Geng, Y.; Kong, L.; Xiao, X.; Zhao, Z.; Zhou, W.; Huang, L.; et al. Identification of Survival-associated Key Genes and Long Non-coding RNAs in Glioblastoma Multiforme by Weighted Gene Co-expression Network Analysis. Int. J. Mol. Med. 2019, 43, 1709–1722. [Google Scholar] [CrossRef]
  41. Machnik, M.; Cylwa, R.; Kiełczewski, K.; Biecek, P.; Liloglou, T.; Mackiewicz, A.; Oleksiewicz, U. The Expression Signature of Cancer-Associated KRAB-ZNF Factors Identified in TCGA Pan-Cancer Transcriptomic Data. Mol. Oncol. 2019, 13, 701–724. [Google Scholar] [CrossRef] [PubMed] [Green Version]
  42. Prusinkiewicz, M.A.; Gameiro, S.F.; Ghasemi, F.; Dodge, M.J.; Zeng, P.Y.F.; Maekebay, H.; Barrett, J.W.; Nichols, A.C.; Mymryk, J.S. Survival-Associated Metabolic Genes in Human Papillomavirus-Positive Head and Neck Cancers. Cancers 2020, 12, 253. [Google Scholar] [CrossRef] [PubMed] [Green Version]
  43. Zhang, Y.; Zhang, Z. The History and Advances in Cancer Immunotherapy: Understanding the Characteristics of Tumor-Infiltrating Immune Cells and Their Therapeutic Implications. Cell Mol. Immunol. 2020, 17, 807–821. [Google Scholar] [CrossRef] [PubMed]
  44. Galon, J.; Bruni, D. Tumor Immunology and Tumor Evolution: Intertwined Histories. Immunity 2020, 52, 55–81. [Google Scholar] [CrossRef]
  45. Zhang, S.; Lv, M.; Cheng, Y.; Wang, S.; Li, C.; Qu, X. Immune Landscape of Advanced Gastric Cancer Tumor Microenvironment Identifies Immunotherapeutic Relevant Gene Signature. BMC Cancer 2021, 21, 1324. [Google Scholar] [CrossRef]
  46. Zhang, C.; Li, D.; Yu, R.; Li, C.; Song, Y.; Chen, X.; Fan, Y.; Liu, Y.; Qu, X. Immune Landscape of Gastric Carcinoma Tumor Microenvironment Identifies a Peritoneal Relapse Relevant Immune Signature. Front. Immunol. 2021, 12, 651033. [Google Scholar] [CrossRef]
  47. Deng, S.-Z.; Wang, X.-X.; Zhao, X.-Y.; Bai, Y.-M.; Zhang, H.-M. Exploration of the Tumor Immune Landscape and Identification of Two Novel Immunotherapy-Related Genes for Epstein-Barr Virus-Associated Gastric Carcinoma via Integrated Bioinformatics Analysis. Front. Surg. 2022, 9, 898733. [Google Scholar] [CrossRef]
  48. Stanland, L.J.; Luftig, M.A. The Role of EBV-Induced Hypermethylation in Gastric Cancer Tumorigenesis. Viruses 2020, 12, 1222. [Google Scholar] [CrossRef]
  49. Jing, J.-J.; Li, H.; Wang, Z.-Y.; Zhou, H.; Sun, L.-P.; Yuan, Y. Aberrantly Methylated-Differentially Expressed Genes and Pathways in Epstein-Barr Virus-Associated Gastric Cancer. Future Oncol. 2020, 16, 187–197. [Google Scholar] [CrossRef]
  50. Zhu, M.; Liang, Q.; Chen, T.; Kong, Q.; Ye, G.; Yu, S.; Li, X.; He, Q.; Liu, H.; Hu, Y.; et al. Identification and Validation of Methylated Differentially Expressed MiRNAs and Immune Infiltrate Profile in EBV-Associated Gastric Cancer. Clin. Epigenetics 2021, 13, 22. [Google Scholar] [CrossRef]
  51. He, D.; Zhang, Y.; Zhang, N.; Zhou, L.; Chen, J.; Jiang, Y.; Shao, C. Aberrant Gene Promoter Methylation of P16, FHIT, CRBP1, WWOX, and DLC-1 in Epstein-Barr Virus-Associated Gastric Carcinomas. Med. Oncol. 2015, 32, 92. [Google Scholar] [CrossRef]
  52. Chen, G.; Ning, B.; Shi, T. Single-Cell RNA-Seq Technologies and Related Computational Data Analysis. Front. Genet. 2019, 10, 317. [Google Scholar] [CrossRef] [PubMed]
  53. Haque, A.; Engel, J.; Teichmann, S.A.; Lönnberg, T. A Practical Guide to Single-Cell RNA-Sequencing for Biomedical Research and Clinical Applications. Genome Med. 2017, 9, 75. [Google Scholar] [CrossRef] [PubMed]
  54. Ryan, J.L.; Jones, R.J.; Kenney, S.C.; Rivenbark, A.G.; Tang, W.; Knight, E.R.; Coleman, W.B.; Gulley, M.L. Epstein-Barr Virus-Specific Methylation of Human Genes in Gastric Cancer Cells. Infect. Agents Cancer 2010, 5, 27. [Google Scholar] [CrossRef] [PubMed] [Green Version]
  55. Edwards, R.H.; Dekroon, R.; Raab-Traub, N. Alterations in Cellular Expression in EBV Infected Epithelial Cell Lines and Tumors. PLoS Pathog. 2019, 15, e1008071. [Google Scholar] [CrossRef]
  56. Okabe, A.; Funata, S.; Matsusaka, K.; Namba, H.; Fukuyo, M.; Rahmutulla, B.; Oshima, M.; Iwama, A.; Fukayama, M.; Kaneda, A. Regulation of Tumour Related Genes by Dynamic Epigenetic Alteration at Enhancer Regions in Gastric Epithelial Cells Infected by Epstein-Barr Virus. Sci. Rep. 2017, 7, 7924. [Google Scholar] [CrossRef] [Green Version]
  57. Qian, Z.; Jiang, Y.; Shou, C.; Yu, J.; Huang, D.; Xie, H.; Zhou, L.; Chen, D.; Zheng, S. Validation of the DNA Methylation Landscape of TFF1/TFF2 in Gastric Cancer. Cancers 2022, 14, 5474. [Google Scholar] [CrossRef] [PubMed]
  58. Li, Y.; Ge, D.; Lu, C. The SMART App: An Interactive Web Application for Comprehensive DNA Methylation Analysis and Visualization. Epigenetics Chromatin 2019, 12, 71. [Google Scholar] [CrossRef] [PubMed] [Green Version]
  59. Deng, M.; Brägelmann, J.; Schultze, J.L.; Perner, S. Web-TCGA: An Online Platform for Integrated Analysis of Molecular Cancer Data Sets. BMC Bioinform. 2016, 17, 72. [Google Scholar] [CrossRef] [Green Version]
Figure 1. Volcano plots of cellular differentially expressed genes (DEGs) between EBVaGC and EBVnGC samples for the TCGA STAD (A) mRNA and (B) miRNA datasets. Red dots represent cellular genes that are significantly upregulated in EBVaGCs compared to EBVnGCs. Blue dots represent cellular genes that are significantly down-regulated in EBVaGCs compared to EBVnGCs. Black dots represent cellular genes that are not significantly up- or down-regulated or show less than a 1.5-fold decrease or increase in gene expression in EBVaGCs compared to EBVnGCs. Calculations were performed with an FDR of 5%.
Viruses 15 00853 g001
Figure 2. Sample Kaplan–Meier survival curve for p53 (Gene ID: 7157) in the EBVaGC subset of the TCGA STAD cohort. This figure was generated natively by the mRNA version of the overall patient survival tools in the EBV-GCR web suite. The samples are divided into equally sized subsets of high and low expressions of TP53 transcripts at the median level of expression for TP53.
Viruses 15 00853 g002
Figure 3. Sample (A) correlation plot of LAG3 (Gene ID: 3902) with CD8 T cell fraction (T Cells CD8) in the tumor microenvironment, and (B) boxplot representing the distribution of the CD8 T cell fraction across the 5 GC subtypes. This figure was generated natively in the EBV-GCR web suite using the correlation of mRNA gene expression with the immune landscape tool.
Viruses 15 00853 g003
Figure 4. Volcano plot of differentially methylated probes (DMPs) between EBVaGC and EBVnGC samples for the TCGA STAD dataset. Red points represent probes that are significantly up-methylated in EBVaGCs when compared to EBVnGCs. Blue points represent probes that are significantly down-methylated in EBVaGCs when compared to EBVnGCs. Black-colored points represent probes that are not significantly up- or down-methylated or show less than a 1.5-fold decrease or increase in probe methylation in EBVaGC compared to EBVnGC. Calculations were performed with an FDR of 5%.
Viruses 15 00853 g004
Figure 5. Single-cell analysis data for all epithelial cells grouped by histopathological type. (A) Dimensional reduction plot (tSNE) of all epithelial cells, both malignant and healthy. (B) Violin plots showing the expression levels of 3 different GOIs (HLA-DPA1, HLA-DPB1, LY6K). (C) Feature plot (tSNE) showing relative expression levels of 3 different GOIs (HLA-DPA1, HLA-DPB1, LY6K).
Viruses 15 00853 g005
Figure 6. Validation case study for TFF1. (A) Boxplot of TFF1 gene expression across EBVaGC and EBVnGC subgroups. Multiple testing was performed with the Conover–Iman test. (B) Line plot showing methylation of 3 TFF1-associated probes across EBVaGC and EBVnGC subgroups. The line at the bottom of the graph represents gene direction and coverage. (C) Violin plot showing relative expression levels of TFF1 across EBV-positive and EBV-negative histopathological subtypes using the scRNA-seq data.
Viruses 15 00853 g006
Table 1. Number of patient samples analyzed from the TCGA STAD cohort for each EBV-GCR tool, excluding the single-cell analysis tool.
# of Patient Samples Analyzed
Patient SubsetmRNA-seqmiRNA-seqCellular mRNA vs. Viral mRNACellular miRNA vs. Viral mRNACellular mRNA vs. Viral miRNACellular miRNA vs. Viral miRNAImmune Comparisons—Cellular mRNAImmune Comparisons—Cellular miRNAImmune Comparisons—Viral mRNA/miRNAOverall Survival—Cellular mRNAOverall Survival—Cellular miRNAMethylation
EBV302926252930302926 (mRNA) 29 (miRNA)302929
MSI7359NANANANA7359NA725858
CIN223203223201220199202
GS60466046494546
POLE7777777
Normal3541NANANANA18
# Number.
Table 2. List of the 53 immune landscape features available for analysis as part of the EBV-GCR web suite of tools.
Immune Landscape Features *
Aneuploidy scoreMonocytes
B cells memoryNeutrophils
B cells naiveNK cells activated
BCR evennessNK cells resting
BCR richnessNonsilent mutation rate
BCR ShannonNo. of segments
CTA scorePlasma cells
Dendritic cellsProliferation
Dendritic cells activatedSilent mutation rate
Dendritic cells restingSNV neoantigens
EosinophilsStromal fraction
Fraction alteredT cells CD4 memory activated
Homologous recombination defectsT cells CD4 memory resting
IFN gamma responseT cells CD4 Naive
Indel neoantigensT cells CD8
Intratumor heterogeneityT cells follicular helper
Leukocyte fractionT cells gamma delta
Lymphocyte infiltration signature scoreT cells regulatory Tregs
LymphocytesTCR evenness
Macrophage regulationTCR richness
MacrophagesTCR Shannon
Macrophages M0TGF beta response
Macrophages M1Th1 cells
Macrophages M2Th17 cells
Mast cellsTh2 cells
Mast cells activatedWound healing
Mast cells resting
* BCR, B cell receptor; CTA, cancer testis antigens; IFN, interferon; SNV, single nucleotide variant; TCR, T cell receptor; TGF, transforming growth factor.
Table 3. Number of cellular mRNAs and miRNAs positively, negatively, or not significantly correlated with viral EBV mRNAs *.
Cellular mRNAsCellular miRNAs
Viral mRNA# of Positive Correlations# of Negative Correlations# of Non-Significant Correlations# of Positive Correlations# of Negative Correlations# of Non-Significant Correlations
A730420,527001046
BALF12020,529001046
BALF22120,528563978
BALF30020,531061040
BALF41105107718,349071039
BALF585295218,727250994
BARF01020,530001046
BARF11020,530011045
BNRF11020,530001046
EBER11008114018,3833641006
EBNA-14720,520001046
LF210911420,308001046
LMP2B0020,531021044
RPMS174052619,2655161025
* Note that only viral mRNAs with at least one significant correlation with cellular mRNAs/miRNAs were included. Calculations were performed with an FDR of 5%. # Number.
Table 4. Number of cellular mRNAs and miRNAs positively, negatively, or not significantly correlated with viral EBV miRNAs *.
Cellular mRNAsCellular miRNAs
Viral mRNA# of Positive Correlations# of Negative Correlations# of Non-Significant Correlations# of Positive Correlations# of Negative Correlations# of Non-Significant Correlations
ebv-miR-BART10-3p1351437114,80916619861
ebv-miR-BART11-5p61920,506521039
ebv-miR-BART120020,531770969
ebv-miR-BART13-3p9923920,1932001026
ebv-miR-BART13-5p32816920,034031043
ebv-miR-BART14-3p3146720,0331400906
ebv-miR-BART14-5p391186418,2762375804
ebv-miR-BART15939297716,6152096831
ebv-miR-BART1-5p6498819,4791301033
ebv-miR-BART17-3p519297117,0411246916
ebv-miR-BART17-5p0020,531101045
ebv-miR-BART18-3p31521220,004001046
ebv-miR-BART19-3p0920,5222301023
ebv-miR-BART19-5p706317116,6542238815
ebv-miR-BART20-5p420153818,5734301003
ebv-miR-BART21-3p0020,5311174925
ebv-miR-BART22891392815,71212317906
ebv-miR-BART2-3p233109419,2042176823
ebv-miR-BART2-5p506321816,8071555886
ebv-miR-BART3-3p14752419,860710975
ebv-miR-BART4-3p11638820,0271214921
ebv-miR-BART4-5p241130118,9892219816
ebv-miR-BART5-5p815388515,83116216868
ebv-miR-BART6-3p606281217,1131916849
ebv-miR-BART6-5p402106619,0631601030
ebv-miR-BART7-3p17369619,6621210925
ebv-miR-BART7-5p27567219,5841662878
ebv-miR-BART8-3p858355016,12312916901
ebv-miR-BART8-5p570279217,1691877852
ebv-miR-BART9-3p432176618,3332961011
ebv-miR-BART9-5p959321516,3571484894
* Note that only viral miRNAs with at least one significant correlation with cellular mRNAs/miRNAs were included. Calculations were performed with an FDR of 5%. # Number.
Disclaimer/Publisher’s Note: The statements, opinions and data contained in all publications are solely those of the individual author(s) and contributor(s) and not of MDPI and/or the editor(s). MDPI and/or the editor(s) disclaim responsibility for any injury to people or property resulting from any ideas, methods, instructions or products referred to in the content.

