
Identifying Putative Resistance Genes for Barley Yellow Dwarf Virus-PAV in Wheat and Barley


1
Plant Virus and Vector Interactions-Centre for Plant Virus Research, Crop Research Institute, Drnovská 507, 161 06 Prague, Czech Republic
2
Agriculture, Health and Environment Department, Natural Resources Institute, University of Greenwich, Medway Campus, Chatham, Kent ME4 4TB, UK
3
Laboratory of Virology-Centre for Plant Virus Research, Institute of Experimental Botany of the Czech Academy of Sciences, Rozvojová 263, 165 02 Prague, Czech Republic
*
Author to whom correspondence should be addressed.
Viruses 2023, 15(3), 716; https://doi.org/10.3390/v15030716
Submission received: 7 February 2023
/
Revised: 5 March 2023
/
Accepted: 6 March 2023
/
Published: 9 March 2023
(This article belongs to the Section Viruses of Plants, Fungi and Protozoa)
Abstract
:Barley yellow dwarf viruses (BYDVs) are one of the most widespread and economically important plant viruses affecting many cereal crops. Growing resistant varieties remains the most promising approach to reduce the impact of BYDVs. A Recent RNA sequencing analysis has revealed potential genes that respond to BYDV infection in resistant barley genotypes. Together with a comprehensive review of the current knowledge on disease resistance in plants, we selected nine putative barley and wheat genes to investigate their involvement in resistance to BYDV-PAV infection. The target classes of genes were (i) nucleotide binding site (NBS) leucine-rich repeat (LRR), (ii) coiled-coil nucleotide-binding leucine-rich repeat (CC-NB-LRR), (iii) LRR receptor-like kinase (RLK), (iv) casein kinase, (v) protein kinase, (vi) protein phosphatase subunits and the transcription factors (TF) (vii) MYB TF, (viii) GRAS (gibberellic acid-insensitive (GAI), repressor of GAI (RGA) and scarecrow (SCR)), and (ix) the MADS-box TF family. Expression of genes was analysed for six genotypes with different levels of resistance. As in previous reports, the highest BYDV-PAV titre was found in the susceptible genotypes Graciosa in barley and Semper and SGS 27-02 in wheat, which contrast with the resistant genotypes PRS-3628 and Wysor of wheat and barley, respectively. Statistically significant changes in wheat show up-regulation of NBS-LRR, CC-NBS-LRR and RLK in the susceptible genotypes and down-regulation in the resistant genotypes in response to BYDV-PAV. Similar up-regulation of NBS-LRR, CC-NBS-LRR, RLK and MYB TF in response to BYDV-PAV was also observed in the susceptible barley genotypes. However, no significant changes in the expression of these genes were generally observed in the resistant barley genotypes, except for the down-regulation of RLK. Casein kinase and Protein phosphatase were up-regulated early, 10 days after inoculation (dai) in the susceptible wheat genotypes, while the latter was down-regulated at 30 dai in resistant genotypes. Protein kinase was down-regulated both earlier (10 dai) and later (30 dai) in the susceptible wheat genotypes, but only in the later dai in the resistant genotypes. In contrast, GRAS TF and MYB TF were up-regulated in the susceptible wheat genotypes while no significant differences in MADS TF expression was observed. Protein kinase, Casein kinase (30 dai), MYB TF and GRAS TF (10 dai) were all up-regulated in the susceptible barley genotypes. However, no significant differences were found between the resistant and susceptible barley genotypes for the Protein phosphatase and MADS FT genes. Overall, our results showed a clear differentiation of gene expression patterns in both resistant and susceptible genotypes of wheat and barley. Therefore, further research on RLK, NBS-LRR, CC-NBS-LRR, GRAS TF and MYB TF can lead to BYDV-PAV resistance in cereals.
1. Introduction
The barley yellow dwarf viruses (BYDVs) complex causes one of the most economically important viral diseases in cereals worldwide and leads to significant yield losses in cereal crops such as wheat, barley, rice, maize and oats [1,2]. BYDV-PAV (Genus Luteovirus), the most prevalent and damaging species of BYDVs, is transmitted by at least 25 species of aphid vectors and almost all plants of the Poaceae family can be infected, making over 150 species potential sources of infection [2,3]. Several strategies have been proposed to mitigate the devastating impact of BYDV-PAV on all major cereal crops worldwide. Control methods for the phloem-limited luteovirus include spraying insecticides to reduce aphid populations. However, a more economically and environmentally effective approach to control is to grow tolerant or resistant varieties [4]. Resistance is defined as a compatible host–virus interaction in which the virus may or may not replicate to some extent in the host, but invasion is limited compared to a susceptible host and symptoms are localised or absent altogether [5]. Host resistance is either tolerance—when symptoms and yield losses are reduced but virus replication remains unchanged—or resistance—when both virus replication and symptoms are reduced [6]. Resistance to BYDV-PAV has been studied in wheat (Triticum aestivum L.) and barley (Hordeum vulgare L.) [7,8,9]. Several genes for BYDV-PAV tolerance were identified in wheat (Bdv1, Bdv2, Bdv3 and Bdv4) [10,11], and barley (Ryd1 [12], Ryd2 [13], Ryd3 [14] and Ryd4 [15]). However, breeding for resistant varieties has shown that different levels of resistance can be achieved and that not all genes have been effectively introduced so far (reviewed in [16]). The most effective genes that have been successfully introduced are Ryd2 in barley varieties (e.g., Atlas68, Wysor, Wbon, Travira) and Bdv2 in wheat varieties (e.g., Mackellar, Glover), which have shown high levels of resistance to BYDV-PAV [7,8,16]. These resistance phenotypes correspond to a low visual symptom score (VSS), a reduction in green grain weight per spike (GRS -R) and a low virus titre [4,7,8].
Transcriptome analyses of plants in response to viral infections reveal a complex relationship between genes and their regulation [17]. The transcriptome profile and expression of target genes are unique and restricted to specific host-virus interactions [18], depending on pathogenicity determinants of the virus that recognise and interact with host-specific proteins encoded by R genes [19,20] or via signal transduction pathways [21]. Both trigger a plant defence response leading to host susceptibility or resistance. Recently, a meta-analysis of resistance genes (R) distinguished nine direct and indirect molecular mechanisms by which R proteins can promote or trigger disease resistance [22]. These include (i) recognition of pathogenic molecules on the cell surface by receptor-like proteins and receptor-like kinases; (ii) intracellular recognition of pathogenic molecules by nucleotide binding site (NBS) or Leucine-rich receptors (LRR) or by integrated domains; and (iii) perception of transcriptional activator-like effectors. To cover this range, we selected nine genes from the predicted expression patterns of miRNA from barley genotypes associated with resistance to BYDV-PAV [23] to assess their expression in both barley and wheat genotypes. RT-qPCR-based gene expression analysis [24] was also performed on both infected and uninfected genotypes with different levels of resistance. Another factor we focused on was the gene expression profile at early and late stages of virus infection. We compared transcriptome results with the viral titre of each genotype to better correlate gene expression in the context of plant defence and resistance against BYDV-PAV. The gene expression analysis has revealed at least four (NBS, CC-NBS, RLK, MYB TF and GRAS TF) of the investigated genes associated with wheat and barley resistance to BYDV-PAV. These genes could be potential targets in improving BYDV-PAV resistance in cereals. The gene expression profiles and methods described could also be used as an effective tool for assessing the resistance of cereals to BYDV-PAV.
2. Materials and Methods
2.1. Plant Growth and Virus Inoculation
Six barley (H. vulgare) genotypes were selected: Graciosa, as a susceptible control; Wysor, Wbon and Travira, carrying Ryd2, as resistant genotypes; and the breeding lines Vir8:3 and Vir13:8 as crosses between six-row non-malting winter barley genotypes. Similarly, six wheat genotypes (T. aestivum) were included: SGS 27-02 and Semper as susceptible controls; Tobak as a winter-tolerant but drought-sensitive genotype; and Sparta, Elan and PSR 3628 with conferred resistance. Barley and wheat seeds were planted in 10 × 10 cm plastic pots filled with a premixed sterilised substrate, one plant per pot. Aphids (Rhopalospiphum padi) were used for virus transmission [23]. Before the experiment, half the aphids were kept on virus-free plants and the other half were kept on BYDV-PAV- infected (GenBank accession number FJ645745) [25] barley plants for one week to acquire the virus. Fourteen-day-old plants were then inoculated with BYDV-PAV using the viruliferous aphids for 3 days. Plants were treated with a dose of the insecticide acetamiprid (0.25 mL/L H2O) to control the aphids’ vector. Plants were incubated at 21 °C, 16 h of light and 60% humidity in a greenhouse in separate insect-proof net cages for symptom expression. Three leaf samples were collected for each genotype, each treatment (control and infection) and at two time points: 10 and 30 days after inoculation (dai). A total of 72 samples were collected for each genotype, ground in liquid nitrogen and stored in aliquots of 100 mg at −80 °C.
2.2. RNA Isolation and cDNA Preparation
Total RNA was isolated using Trizol-based reagent RNA blue kit (Top-Bio, Vestec, Czech Republic) and purified using RNA Clean and Concentrator-5 (Zymo Research, Ir-vine, CA, USA) according to the manufacturer’s protocol. The concentration and purity of the isolated RNA was measured spectrophotometrically (NanoDrop 2000; Thermo Scientific, Wilmington, DE, USA). Complementary DNA was synthesised using 1 µg of total RNA, RevertAid reverse transcriptase 200 U/µL and oligo(dT)18 (for gene expression analysis) or random hexamer primer (for virus titre analysis) (Thermo Scientific, Waltham, MA, USA) according to the manufacturer’s instructions.
2.3. Analysis of BYDV-PAV Titre in Wheat and Barley Plants by RT-qPCR
Quantification of the BYDV-PAV titre required a 5-fold dilution of the cDNA for the qPCR assays in a LightCycler 480 (Roche, Basel, Switzerland). The BYDV-PAV-positive control sample was prepared according to Jarošová and Kundu [24] and a tenfold diluted clone was used to obtain the standard curve (8 points). The number of viral copies in the standard sample was calculated using the formula: number of copies = (amount of DNA × 6.022 × 10²³)/(length of the plasmid × 1 × 109 × 660) [26,27]. We obtained the Ct values by absolute quantification/2nd derivative maximum (Light Cycler 480 software; Roche, Basel, Switzerland) against the logarithm of the calculated copy numbers for each standard dilution. A linear regression analysis (Microsoft Excel) was performed on the Ct values to determine BYDV-PAV titre in all barley and wheat samples by fitting the Ct values to the standard curve. Standards and samples were measured in triplicate. Cycling conditions were as in [28]: 10 min at 95 °C for initial denaturation; 40 cycles of amplification (5 s at 95 °C, 30 s at 60 °C and 20 s at 72 °C). The PCR reaction consisted of primers PVinterF [24] and YanRA [29] (0.42 μM) (Supplementary Table S1), 6 μL of 2x LightCycler 480 SYBR Green I Master (Roche, Basel, Switzerland), 1 μL cDNA or standard samples and sterile nuclease-free water to reach a final volume of 12 μL. The estimated BYDV-PAV copy number values per μL plant DNA per genotype at 10 and 30 days were analysed using GraphPad Prism 9 software (San Diego, CA, USA).
2.4. Selection of Genes and Analysis of Gene Expression by RT-qPCR
The target genes for this study were selected based on analysis of expression patterns of miRNA in response to BYDV-PAV [23]. Jarošová et al. [23] identified known and novel miRNA associated with defence-related genes or transcription factors regulating the stress response. Based on those findings and according to the current understanding of the disease resistance in plants [9,22,30], we selected nine putative barley and wheat genes that include: (i) NBS-LRR, (ii) CC-NB-LRR class, (iii) RLK, (iv) casein kinase, (v) protein kinase genes, (vi) protein phosphatase subunits and the transcription factors (TF) (vii) MYB superfamily, (viii) GRAS and (ix) MADS -box TF. The sequences of the selected genes are available in the NCBI database (GenBank accession numbers in Supplementary Table S1) for both barley and wheat. Primers for our target genes were designed using primer-BLAST (NCBI; RRID:SCR_003095) with melting temperatures between 59 °C and 61 °C and amplicon lengths between 70 and 190 bp. The other parameters were left at the default setting. We allowed a maximum of two mismatches between the primer and the target sequence and then carefully checked each base in the primer sequence to avoid mismatches, especially in the last five nucleotides of the 3’ end. The final oligos were purchased from Eurofins Genomics (Eurofins, Val Fleuri, Luxemburg). Two primer sets were designed for each gene and the pairs with an efficiency closer to 2 were selected for further analysis. PCR efficiency values (E) were calculated for each gene from the given slope after standard curves (10-fold dilutions of pooled cDNA samples) were generated using the formula E (%) = (−1/(10slope − 1)) × 100 and considering 100% = 2 [31]. Two reference genes proposed by Jarošová et al. [24], TubB and GAPDH, were used in this study. Amplifications were also performed with a LightCycler 480 instrument II (Roche, Basil, Switzerland) in 384-well plates with 12 μL reaction solutions per well using 6 μL LightCycler® 480 SYBR Green I Master 2x concentrated mixture forward and reverse primers (0.42 μM), 5 μL cDNA template (diluted 10-fold). Cycling conditions were: 95 °C for 10 min, followed by 45 cycles of 95 °C for 5 s and 60 °C for 30 s and 72 °C for 10 s. To check reproducibility, each assay was performed with three technical replicates for each of the three biological samples. The resulting Ct values were normalised to the expression of the reference genes to calculate the double delta Ct value (2−ΔΔCT) to obtain the change in gene expression [32]. The expression change for each gene per genotype at 10 and 30 dai was further analysed using GraphPad Prism 9 software (San Diego, CA, USA).
3. Results
3.1. The BYDV-PAV Titre in Wheat and Barley Genotypes
BYDV-PAV was detected in all barley and wheat plants at 10 and 30 dai by RT-qPCR. One-way ANOVA revealed a statistically significant difference [F (11, 16) = 2.695], p = 0.0352 in barley genotypes at 10 dai (Figure 1A). Tukey’s test for multiple comparisons also revealed that the high BYDV-PAV titre seen in the susceptible genotype Graciosa was significantly different to all barley genotypes (p < 0.05, 95% C.I. = 738 to 65,656). At 30 dai, all genotypes had elevated BYDV-PAV titres, but significant differences were still observed in one-way ANOVA [F (11, 23) = 8.2772], p < 0.0001. Graciosa and Travira had the highest titres, but Tukey’s test for multiple comparisons revealed significant differences only between Graciosa and Wysor genotypes (p < 0.05, 95% C.I. = 757 to 336,929); and Travira and Wysor (p < 0.01, 95% C.I. = 36,747 to 372,919) (Supplementary Figure S1).
Between the wheat genotypes, the susceptible Semper and SGS 27-02 had the highest titres while the resistant PSR 3628 consistently registered the lowest BYDV-PAV titre. The one-way ANOVA showed significant differences at both 10 dai [F (11, 21) = 4681], p < 0,001, and 30 dai [F (11, 21) = 7566], p < 0.0001 (Figure 1B). Tukey’s test for multiple comparisons found significantly higher BYDV-PAV titre in Semper compared to Sparta (p < 0.05, 95% C.I. = 763 to 35,974 at 10 dai, and p < 0.05, 95% C.I. = 29,115 to 644,644 at 30 dai) and PSR 3628 (p < 0.01, 95% C.I. = 4594 to 39,804 at 10 dai, and p < 0.01, 95% C.I. = 123,266 to 738,796 at 30 dai). The same test, at 30 dai, also found significantly higher titre in SGS 27-02 compared to Elan (p < 0.05, 95% C.I. = 7065 to 557,611), Sparta (p < 0.05, 95% C.I. = 39,638 to 590,184), and PSR 3628 (p < 0.001, 95% C.I. = 133,789 to 684,335).
3.2. Correlation between Gene Expression and Resistance to BYDV-PAV in Wheat and Barley
To characterise the gene expression profile in response to BYDV-PAV infection between genotypes with different levels of resistance, a heat map was constructed for barley and wheat using expression fold change (EFC) data from RT-qPCR (Figure 2). The maps for barley and wheat show different down-regulation and up-regulation profiles between genotypes and between 10 and 30 dai. The multi-factorial ANOVA analysis revealed a statistically significant interaction between the BYDV-PAV infection of barley genotypes (10 and 30 dai) and the expression fold change of the genes of interest F (88, 189) = 7.15, p < 0.0001, as well as a statistically significant interaction between BYDV-PAV infection in the wheat genotypes (10 and 30 dai) and the expression fold change of the genes of interest F (88, 201) = 12.42, p < 00001. In addition, Supplementary Table S1 shows heat maps with mean EFC, SEM and TTest analyses comparing control and infected samples for each case. The up- and down-regulation observed in the Vir8:13 and Vir13:8 genotypes confirm the involvement of these genes predicated by Jarošová et al. [23].
A more detailed analysis using two-way ANOVA and Tukey’s multiple comparisons test on gene expression showed significant differences for the NBS-LRR resistance genes (NBS), s at both 10 and 30 dai. For barley genotypes, statistically significant interactions were observed between the genotypes and BYDV-PAV infection at both 10 [F (5, 21) = 4.55, p = 0.006] and 30 dai [F (5, 24) = 5.29, p = 0.002]. The analysis also showed statistically significant effect of the genotypes on NBS expression at 10 dai (p = 0.006) and at 30 dai (p = 0.002). BYDV-PAV infection also had a significant effect on NBS expression at 10 (p = 0.03) and at 30 dai (p = 0.002). The susceptible genotype Graciosa mainly contributed to these differences. The high NBS expression was maintained at 10 dai in all genotypes while mainly in the resistant genotypes Wbon, Wysor, V08:3 and V13:8 at 30 dai (Figure 3).Similarly, the analysis revealed a statistically significant interaction between the effects of wheat genotype and BYDV-PAV infection at both 10 [F (5, 22) = 42.37, p < 0.0001] and 30 dai [F (5, 22) = 26.66, p < 0.0001] (Figure 3). As for genotypes, there is a statistically significant effect on NBS expression at 10 dai (p < 0.0001) and at 30 dai (p < 0.0001). Similar results were obtained for the effect of BYDV-PAV infection on NBS expression at 10 and 30 dai (p < 0.0001). At 10 dai, the susceptible lines Semper and SGS 27-02 showed a dramatic increase in NBS expression, but only Semper maintained this increase until day 30.
The selected genes with conserved coil-coil nucleotide-binding site leucine-rich repeat motif (CC-NBS-LRR) also showed increased expression in the susceptible wheat and barley genotypes early after infection, but decreased by 30 days (Figure 4). The wheat genotype Tobak (winter tolerant but drought sensitive) showed a milder but still significant increase in CC-NBS-LRR expression only in the early phase (10 dai). [(Barley 10 dai BYDV-PAV -genotype interaction F (5, 21) = 8.95, p < 0.0001; genotype effect p < 0.0001; and BYDV-PAV effect p < 0.0001), (Barley 30 dai BYDV-PAV -genotype interaction F (5, 24) = 8.14, p < 0.0001; genotype effect p < 0.0001; and BYDV-PAV effect p = 0.004), (wheat 10 dai BYDV-PAV -genotype interaction F (5, 23) = 9.18, p < 0.0001; genotype effect p < 0.0001; and BYDV-PAV effect p < 0.0001) and (wheat 30 dai BYDV-PAV-genotype interaction F (5, 24) = 31.33, p < 0.0001; genotype effect p < 0.0001; and BYDV-PAV effect p = 0.002) according to the two-way test ANOVA with Tukey’s Multiple Comparison Test).
The expression of the LRR receptor-like kinase (Rec-Kin) genes examined in this study was significantly increased by 10 and 30 dai in the susceptible genotypes. In barley lines, two-way ANOVA showed statistically significant interactions between the effects of genotype and BYDV-PAV infection at 10 [F (5, 21) = 5.44, p= 0.002] and at 30 dai [F (5, 24) = 74.43, p< 0.0001]. The analysis also showed a statistically significant effect on the expression of Rec-kin at 10 (p = 0.002) and at 30 dai (p < 0.0001) depending on the genotype. BYDV-PAV infection had a significant effect on Rec Kin expression at 10 (p = 0.003) and 30 dai (p < 0.0001). In the susceptible genotype Graciosa, Rec Kin expression is significantly increased both at 10 dai compared to Wbon, Wysor, V08:3 and V13:8 and at 30 dai compared to all genotypes (Figure 5). Interestingly, the moderately resistant genotype Travira also showed a less pronounced but still significant increase in Rec Kin expression compared to Wysor, V08:3 and V13:8 at 30 dai. For wheat genotypes (Figure 5), the analysis revealed a statistically significant interaction between the effects of genotype and BYDV-PAV infection at 10 dai [F (5, 23) = 17.28, p< 0.0001] and 30 dai [F (5, 23) = 31.80, p< 0.0001]. Regarding genotypes, a statistically significant effect is seen on Rec Kin expression at 10 (p < 0.0001) and 30 dai (p < 0.0001). Similar results were found for the effect of BYDV-PAV infection on Rec-Kin expression at 10 and 30 dai (p < 0.0001). Shortly after inoculation (10 days), the susceptible lines Semper and SGS 27-02 showed a substantial significant increase in Rec-Kin expression, but their expression levels decreased at 30 dai and maintained a significantly high level only in Semper. The decrease was less pronounced in the Tobak genotype compared to some lines, but not compared to its control.
BYDV-PAV infection led to a significant increase in the expression of the Casein kinase gene in the genotypes Graciosa, Travira and Wbon only at 30 dai. However, the up-regulation was more significant in Graciosa and was almost three times higher compared to the infected genotypes Wysor, V08:3 and V13:3. In contrast, expression of the Casein kinase-like protein in the susceptible wheat genotype Semper increased as early at 10 dai but no significant changes were observed at 30 dai (Figure 6). (Barley 10 dai BYDV-PAV -genotype interaction F (5, 21) = 1.78, p = 0.161; genotype effect p = 0.161; and BYDV-PAV effect p = 0.004), (Barley 30 dai BYDV-PAV -genotype interaction F (5, 24) = 7.77, p = 0.0002; genotype effect p = 0.0002; and BYDV-PAV effect p < 0.0001), (wheat 10 dai BYDV-PAV -genotype interaction F (5, 23) = 4.82, p = 0.004; genotype effect p = 0.004; and BYDV-PAV effect p < 0.0001) and (wheat 30 dai BYDV-PAV -genotype interaction F (5, 24) = 1.88, p = 0.14; genotype effect not significant (ns); and BYDV-PAV effect p-value ns according to two-way ANOVA with Tukey’s multiple comparison test).
Protein kinase expression in barley was increased at 10 dai exclusively in the susceptible genotype Graciosa, but by 30 dai, expression had decreased and remained significant compared to the control and infected V13:8 (Figure 7). In wheat, Protein kinase gene expression was affected only slightly. According to Tukey’s test, only the infected Semper differed significantly from infected Tobak. However, at 30 dai the difference is notable, mainly due to significantly decreased expression in Semper as opposed to increased expression in Tobak; this increased expression was also significant compared to the other genotypes and lines (Barley 10 dai BYDV-PAV -genotype interaction F (5, 21) = 7.35, p = 0.0004; genotype effect p = 0.0004; and BYDV-PAV effect p = 0.008), (barley 30 dai BYDV-PAV-genotype interaction F (5, 24) = 2.26, p = 0.081; genotype effect p = 0.081; and BYDV-PAV effect p < 0.0001), (wheat 10 dai BYDV-PAV-genotype interaction F (5, 23) = 2.68, p = 0.047; genotype effect p = 0.047; and BYDV-PAV effect p = 0.19) and (Wheat 30 dai BYDV-PAV-genotype interaction F (5, 24) = 9.81, p < 0.0001; genotype effect p < 0.0001; and BYDV-PAV effect p = 0.002) according to two-way ANOVA with Tukey’s multiple comparison test).
Some significant differences in Protein phosphatase gene expression were found between the infected barley genotypes, at 10 dai between Travira vs. Wbon and Travira vs. V13:8, and at 30 dai between Graciosa vs. V13:8 and V08:3 vs. V13:8 (Figure 8). As in wheat, the expression of the gene Protein phosphatase was significantly increased in the infected Semper samples, but only at 10 dai. (According to two-way ANOVA with Tukey’s test: (barley 10 dai BYDV-PAV -genotype interaction F (5, 21) = 7.35, p = 0.0004; genotype effect p = 0.0004; and BYDV-PAV effect p = 0.008), (barley 30 dai BYDV-PAV -genotype interaction F (5, 24) = 2.26, p = 0.081; genotype effect p = 0.081; and BYDV-PAV effect p < 0.0001), (wheat 10dai BYDV-PAV -genotype interaction F (5, 23) = 2.68, p = 0.047; genotype effect p = 0.047; and BYDV-PAV effect p = 0.19) and (wheat 30 dai BYDV-PAV -genotype interaction F (5, 24) = 9.81, p < 0.0001; genotype effect p < 0.0001; and BYDV-PAV effect p = 0.002).
The MYB transcription factor (TF), i.e., GAMYB for barley, was up-regulated in Graciosa in response to BYDV-PAV infection at 10 dai and less markedly at 30 dai. Expression of this transcription factor in wheat, RIM1, was also strongly increased at 10 dai in the susceptible genotype Semper and remained moderately increased at 30 dai, at which time, however, an opposite effect was observed; for example, a similarly significant increase in the resistant line PSR 3628 (Figure 9). ANOVA with Tukey’s test: (barley 10dai BYDV -genotype interaction F (5, 21) = 5.31, p = 0.003; genotype effect p = 0.003; and BYDV effect p = 0.0001), (barley 30 dai BYDV-PAV -genotype interaction F (5, 24) = 3.93, p = 0.01; genotype effect p = 0.01; and BYDV-PAV effect p = 0.08), (wheat 10 dai BYDV-PAV -genotype interaction F (5, 23) = 80.46, p < 0.0001; genotype effect p < 0.0001; and BYDV-PAV effect p < 0.0001) and (wheat 30 dai BYDV-PAV -genotype interaction F (5, 24) = 12.39, p < 0.0001; genotype effect p < 0.0001; and BYDV-PAV effect p = 0.096)
The expression of the GRAS transcription factor (Gras) in barley was increased only in Graciosa at the beginning of infection, but no significant changes were detected at 30 dai. Expression of Gras in wheat genotypes was dramatically increased 10 dai in the infected Semper and moderately increased in the infected Tobak genotype, but at 30 dai, expression levels decreased back to normal (Figure 10). Two-way ANOVA with Tukey’s test result: (barley 10 dai BYDV-PAV -genotype interaction F (5, 21) = 3.26, p = 0.025; genotype effect p = 0.025; and BYDV-PAV effect p = 0.03), (barley 30 dai BYDV-PAV -genotype interaction F (5, 24) = 1.92, p = 0.13 ns; genotype effect p = 0.13 ns; and BYDV-PAV effect p = 0.49 ns), (wheat 10dai BYDV-PAV -genotype interaction F (5, 23) = 97.78, p < 0.0001; genotype effect p < 0.0001; and BYDV-PAV effect p < 0.0001) and (wheat 30 dai BYDV-PAV -genotype interaction F (5, 24) = 9.59, p < 0.0001; genotype effect p < 0.0001; and BYDV-PAV effect p = 0.0003).
The straight line from on top indicates the same p value when that genotype is compared to the rest in line. The MADS box TF was the only gene for which no significant change in expression was found, either in barley or wheat genotypes (Figure 11). In agreement with the two-way ANOVA and Tukey’s test: (barley 10 dai BYDV-PAV-genotype interaction F (5, 21) = 0.25, p = 0.93 ns; genotype effect p = 0.93 ns; and BYDV-PAV effect p = 0.05), (barley 30 dai BYDV-PAV-genotype interaction F (5, 24) = 1.77, p = 0.16 ns; genotype effect p = 0.16 ns; and BYDV-PAV effect p = 0.24 ns), (wheat 10 dai BYDV-PAV -genotype interaction F (5, 23) = 1.78, p = 0.16 ns; genotype effect p = 0.16 ns; and BYDV-PAV effect p = 0.14 ns) and (wheat 30 dai BYDV-PAV -genotype interaction F (5, 23) = 0.90, p = 0.50 ns; genotype effect p = 0.61 ns; and BYDV-PAV effect p = 0.0013).
3.3. Comparison of Gene Expression Profiles of Highly Resistant versus Highly Susceptible Genotypes of Wheat and Barley
To demonstrate gene expression and resistance of wheat and barley genotypes, we presented here the comparison of gene expression fold changes (EFC) between the highly susceptible genotypes Semper (wheat) and Graciosa (barley) and the highly resistant genotypes PSR 3628 (wheat) and Wysor (barley) (Table 1). A paired sample T-test was performed to compare the infected vs. control and the susceptible vs. resistant. Statistically significant changes were observed in wheat in the up-regulation of NBS, CC-NBS-LRR and RLK in the susceptible genotype and down-regulation in the resistant genotype in response to BYDV-PAV. Similar up-regulation of NBS, CC-NBS-LRR, RLK and MYB TF was also observed in the susceptible barley genotype. However, in the resistant barley genotype, no change in expression was detected except for the down-regulation of RLK. Casein kinase and Protein phosphatase were up-regulated in the susceptible genotype of wheat, and only in the early dai, but in the later dai, Protein phosphatase is down-regulated in the resistant genotype of wheat. Protein kinase was down-regulated both earlier (10 dai) and later (30 dai) in the susceptible wheat genotypes, but only in the later dai in the resistant genotypes. GRAS TF and MYB TF were up-regulated in the susceptible wheat genotype and there were no significant differences in MADS TF expression. Protein kinase, Casein kinase (30 dai), MYB TF and GRAS TF (10 dai) were up-regulated in the susceptible barley genotype. No significant differences were found in the expression of Protein phosphatase and MADS FT genes between the barley genotypes (Table 1). Similar results were found in other genotypes studied with respect to the levels of resistance or susceptibility to BYDV-PAV (Supplementary Table S2). Our results showed a clear differentiation of expression patterns related to resistance and susceptibility in both wheat and barley genotypes. Therefore, RLK, NBS, CC-NBS-LRR, GRAS TF and MYB TF could be potential markers for BYDV-PAV resistance breeding and targets for cereal crop improvement. In particular, the RLK gene, which showed the same expression pattern in both wheat and barley genotypes and specific to resistance or susceptibility, is of note.
4. Discussion
We have studied the gene expression profiles of wheat and barley genotypes to identify novel genes associated with resistance to BYDV-PAV. While some resistance (or tolerance) genes are known to confer resistance (e.g., BYd2 gene) (reviewed in [16]), their introduction into wheat or barley varieties remains limited. Based on our previous transcriptome analysis of miRNAs and their target genes [23], as well as known genes associated with disease resistance to several other pathogens [18,30], the expression profile of several NBS family target genes (e.g., NBS-LRR, CC-NBS-LRR), kinases (e.g., Casein kinase, Protein kinase, Protein phosphatase), receptor-like kinases (LRR-RLKs) and transcription factors (e.g., MYB, GRAS, MADS) was analysed for their possible role in BYDV-PAV resistance. In general, gene expression profiles together with virus titre analyses showed that infection of BYDV-PAV causes significant changes in gene expression depending on genotype resistance and time after virus inoculation. In particular, our results showed that NBS, CC-NBS-LRR, RLK, Protein kinase, MYB TF, GRAS TF were upregulated in susceptible genotypes only at 10 dai and Casein kinase 30 dai, and RLK was down-regulated in resistant barley genotypes (only 30 dai). Similarly, in wheat NBS, CC-NBS-LRR, RLK, MYB TF, GRAS TF, Protein phosphatase, and Casein kinase were upregulated only at 10 dai, in susceptible genotypes, and RLK and Protein kinase were down-regulated 10 dai in resistant genotypes.
4.1. NBS-LRR Family Genes Trigger BYDV-PAV Defense Response in Susceptible Genotypes
Two of the selected genes, NBS and CC-NBS-LRR, belong to the largest family of R genes, which encode proteins characterised by a structurally conserved region, the NBS, usually associated with a leucine-rich repeat LRR [33]. This family can be subdivided based on characteristic N-terminal features of its products [34], such as a CC that enables protein–protein interactions. In our analysis, NBS and CC-NBS-LRR were expressed at relatively low levels in uninfected leaves. However, they were remarkably up-regulated in susceptible genotypes at 10 dai, and the response persisted at least until 30 dai. Increased expression of NBS-LRR genes in response to pathogen infection has also been observed in other plants, e.g., AhRRS5, in peanut in response to Ralstonia solanacearum [35]; Xa1, a bacterial resistance gene from rice [36]; SacMi, triggered by infection with Meloidogyne incognita [33]; and ZmNBS25, associated with Bipolaris maydis resistance in maize [37]. In a report on Vitis vinifera infected with Erysi-phenecator (the causal agent of powdery mildew), 63 powdery mildew-responsive NBS-LRR genes were identified whose expression levels differed between susceptible and partially resistant genotypes and at different time points (1-5 dai). This led to the conclusion that NBS-LRR genes play an important role in activating defence mechanisms as powdery mildew infection progresses and that their expression is conserved in the grape genotypes [38]. In our analysis, the up-regulation of NBS and CC-NBS-LRR in the susceptible genotypes is associated with a significant increase in BYDV-PAV copy number, which might have activated the defence mechanisms early upon BYDV-PAV infection but continued until 30 dai. The fact that expression is maintained at baseline levels in the resistant genotypes could be a consequence of alternative resistance mechanisms that inhibited viral replication (lower BYDV-PAV titre) possibly triggered early in BYDV-PAV infection. In this regard, we are only dissecting part of a complicated network that needs to be further explored in more detail. Previous studies report the completion of host virulence targets with “integrated NBS pairs” (integrated Decoy hypothesis) that function together to confer resistance, for example the rice CC-NBS -LRRs RGA4 and RGA5 that recognise the Magnaporthae oryzae effectors Avr-Pia and Avr-CO39 [39]; barley CC-NBS -LRRs HvRga1 and Rpg5 mediating perception of the stem rust pathogen Puccinia graminis [40,41,42,43,44]; and the wheat pair Lr10 and RGA2 mediating resistance to P. triticina [45]. In particular, the miRNA analysis of Jarošová et al. [23] helped to limit our selection to conserved NBS-LRR gene expression in response to BYDV-PAV, considering that in barley, over 400 NBS-LRR genes have been identified by genome-wide analysis, while hexaploid wheat T. aestivum has over 2000 NBS-LRR genes due to polyploidisation. Only a fraction of the sublines is retained in both T. aestivum and H. vulgare, reflecting a rapid change in NBS-LRR profiles after separation of the species due to species-specific gene loss and duplication [46]. The similarity of the expression profiles of six genotypes each of barley and six wheat suggests that the expression of the selected NBS and CC-NBS-LRR genes are conserved in the genotypes included in our study and also between the two species.
4.2. Casein Kinase, Protein Kinase and Protein Phosphatase as Integrated Domains after BYDV-PAV Infection
In addition to the integrated NBS pairs found in barley and wheat [37,38,39,40,41], unusual domains have been identified in the standard functional NBS-LRR protein domain architectures required for activation of pathogen-induced defence signalling. It has been proposed that these accessory domains be termed ‘Integrated Sensory Domains’ (ISDs) until their function is elucidated [47]. The NBS ISDs allow for functional diversity, as the integration of different ISDs into a conserved NBS-LRR pair enables defence against a broader range of pathogens and subsequently initiates the defence response. In barley, the alleles of Rpg5 contain functionally different C-terminal ISDs. Resistance alleles have a serine-threonine protein kinase ISD, while the major class of susceptible alleles of Rpg5 contains a protein phosphatase 2C ISD [48]. Jarošová et al. [23] identified novel miRNA in barley genotypes infected with BYDV-PAV that could express ISDs; from these we selected Casein kinase, Protein kinase and Protein phosphatase domains for this study. Our results showed different expression patterns between barley and wheat, suggesting that the composite NBS ISDs that respond to BYDV-PAV infection may be species specific. For Casein kinase, a distinct up-regulation was detected in susceptible genotypes, but this was not detected until 30 dai in barley and 10 dai in wheat. For the Protein kinase domain, expression is up-regulated at 10 dai in the susceptible barley genotype Graciosa, but the effect is almost lost by day 30. In contrast, the susceptible wheat genotype Semper is down-regulated at this time, while the winter-tolerant genotype Tobak is up-regulated. As far as Protein Phosphatase expression is concerned, despite the differences between some barley genotypes, there is an obvious effect of BYDV-PAV infection, while in the susceptible wheat genotype Semper, there is a remarkable up-regulation by BYDV-PAV, but this does not last until day 30. To draw a general conclusion about the expression of ISDs in response to BYDV-PAV infection, a more detailed study is needed, following the trail at multiple time points and including other proteins involved in the signalling pathway.
4.3. Receptor like Kinase Gene Defense Response to BYDV-PAV
Many receptor-like kinases (RLK) in plants have been shown to perceive and process signals from invading pathogens. They serve as pattern recognition receptors (PRRs) that are rapidly activated by specific pathogen effectors. LRR-RLKs play an important role in the trade-off between growth and immunity. In the plant immune response, they trigger specific phosphorylation events inside and outside the kinase domain, leading to altered kinase activity and thus to the transmission of immune signals [49,50]. To date, the function of multiple RLKs in pathogen resistance has been extensively studied in model plants with simpler genomes. In contrast, much less is known about the role of RLKs in disease resistance in crops with complex genomes such as wheat and barley [51]. Choudhury et al. [9] identified specific genomic regions for BYDV-PAV resistance in wheat genotypes through a genome-wide association study. Between the annotated genes was a kinase-like receptor gene that mediated disease resistance by activating the cellular defence response and an LRR receptor kinase that functioned as a basal defence against Fusarium head blight and as an upstream component of salicylic acid signalling [52]. Thapa et al. [53] analysed Poaceae-specific LRR-RLKs, especially homologues between H. vulgare and T. aestivum, and found by gene expression studies that TaLRRK-6D is systemically activated by F. graminearum as early as 1 dai in the susceptible wheat genotype Remus and that the expression of TaLRRK-6D was always higher compared to the resistant genotype CM82036. Their virus-induced gene silencing analysis suggests that TaLRRK-6D in wheat and its barley homologue HvLRRK-6H contributed positively to F. graminearum resistance. In response to barley PM resistance, contrasting genotype-specific expression patterns were observed in TaRLK-R1, -R2 and -R2, HvXa21RLK and other closely related RLKs, suggesting that specific RLKs are differentially important for specific Mla-mediated resistance [54,55]. Parrot et al. [56] identified three other (putative) LRR-RLKs that show an inverse pattern in response to the Mla locus (low in the presence of Mla1 and Mla13, but high in the presence of Mla6), while other putative PRRs show low expression in the presence of Mla13, but high expression in the presence of both Mla1 and Mla6. In this regard, to our knowledge, there is no report of viral defence response in genotypes with resistance mediated by Ryd1, Ryd2 or Ryd3 in barley or by Bvd2 in wheat genotypes and their interaction with RLKs. The barley and wheat RLK genes (Rec Kin) examined in this study were up-regulated 10 days after BYDV-PAV infection only in the susceptible genotypes Graciosa (barley), Semper and SGS 27-02 (wheat) in parallel with a higher number of virus copies. In contrast, the resistant wheat genotypes Sparta and PSR 3628 showed down-regulation compared to their respective controls. The up-regulation in Graciosa and Semper continued until day 30 post infection. At this time, the Vir8:13 and Vir13:8 lines with pyramidal resistance genes showed contrasting down-regulation. The clear difference between susceptible and resistant genotypes in the expression of the selected LRR-RLK genes underlines their involvement in BYDV-PAV defence and the relevance of further studies of these genes for the implementation of resistant genotypes (e.g., introduction into new genotypes, gene silencing, pathway analysis, interaction with other RLK, etc.).
4.4. Expression of MYB, GRAS and MADS TFs in Response to BYDV-PAV Infection
Transcription factors are key components in plant adaptation mechanisms and defence signals. Therefore, several studies have functionally characterized TF genes in different plant species to improve their resistance/tolerance to different stresses, especially for crop improvement [57]. In this study, we included wheat and barley genes encoding MYB, GRAS and MADS-box TFs. Plants contain TFs characterized by a DNA-binding MYB domain. Based on the number of adjacent MYB repeats, MYB TFs can be classified into four classes, with most of the identified MYB genes in plants belonging to the R2R3 MYB subfamily and associated with plant defence responses [58]. For example, AtMYB96 in Arabidopsis may increase resistance to bacterial pathogens [59], AtMYB59 plays a role in hormonal signalling pathways in response to biotic stress [60] and BOS1 (AtMYB108) is required to limit the spread of two necrotrophic pathogens, Botrytis cinerea and Alternaria brassicicola [61]. In barley, the MYB TF HvMYB6 functions as a positive regulator of basal and MLA-mediated immunity responses against Blumeria graminis [62]. Similarly, several R2R3-type MYB TFs have been shown to play a role in defence against pathogens in wheat. For example, silencing of the TaMYB4 gene in wheat impaired resistance to Puccinia striiformis, while TaPIMP1-expressing plants showed significantly increased resistance to R. solanacearum in transgenic tobacco [63] and resistance to Bipolaris sorokiniana in transgenic wheat [64]; the TaRIM1 gene was induced by infection with R. cerealis and positively contributed to the resistance response of wheat by regulating the expression of several defence-related genes [57]. In our analysis, MYB TF was up-regulated in the susceptible genotypes Graciosa and Semper in response to BYDV-PAV infection at 10 dai, and the up-regulation remains less pronounced at 30 dai. Nevertheless, a slight up-regulation was also detected at this time in the wheat resistance genotype PSR 3628. The MYB gene we identified for wheat is up-regulated in genotypes with opposite resistance effects, for which we can only assume that the conferred resistance is orchestrated with different players along the way. For example, efficient expression and function of an RLK in wheat powdery mildew defence requires a MYB TF binding site located in the intron [52].
The GRAS TFs family is found throughout the plant kingdom. They perform numerous biological functions in plants, including growth, development, cell signalling, phytochrome signalling, symbiosis, biotic and abiotic stress tolerance, etc. [65,66,67,68]. To et al. [69] identified 62 barley GRAS proteins, while for wheat 183 GRAS genes were found coding for 194 GRAS proteins [70]. In response to BYDV-PAV infection, our data suggest an up-regulation of GRAS TF in the susceptible barley genotype Graciosa only at day 10 post-infection, while in wheat a remarkable up-regulation was shown for the susceptible genotype Semper and to a lesser extent for Tobak, but later, 30 dai, only a slightly increased expression for Semper remained. A more detailed study of the sequence we have targeted should follow to clarify whether the effect as DELLA proteins (members of the GRAS TF family) is related to proteins previously described in Arabidopsis, rice and maize as major growth inhibitors responsible for dwarfism and key components in gibberellic acid signalling [71]. Rong et al. [72] reported up-regulation of gibberellic acid receptor GID1L2 and gibberellic acid-stimulated transcripts and down-regulated transcript encoding gibberellin receptor GID1L3 for the susceptible wheat line Zhong8601, 35 dai of BYDV-GAV infection, suggesting that altered expression of these genes in these phytohormone pathway plants could lead to plant dwarfism. In this respect, our data may suggest that BYDV-PAV infection affects signalling at the TF level in susceptible genotypes.
The MADS box transcription factor family is an important selection target in crop domestication and improvement, as they are key regulators of virtually every aspect of plant reproductive development [73]. Recent findings also link MADS-box genes to disease resistance, e.g., MADS1 regulates the defence response of tobacco to HarpinXoo infections [74], down-regulation of OsMADS26 in transgenic rice increased resistance to rice blast and bacterial wilt [75], OsRDR1 expression is a key component of the antiviral RNA pathway and increased resistance to rice stripe virus (RSV) [76], and GmCAL was significantly induced after inoculation with soybean mosaic virus (SMV) and its overexpression significantly reduced SMV accumulation [77]. However, for the specific times of our analysis, MADS TF was the only target gene for which no significant change in expression was detected after BYDV-PAV, neither in barley nor in wheat genotypes.
5. Conclusions
In wheat and barley, the gene expression profile together with the virus titre analyses revealed that BYDV-PAV infection causes significant changes in eight of the selected genes, depending on both the level of genotype resistance and the post-infection time point. The following conclusions can be drawn from our results: (i) gene expression, together with virus titre analysis, can be used for determining the resistance levels of wheat and barley to BYDV-PAV; (ii) BYDV-PAV infection has little or no effect on the expression of most of the listed genes in resistant wheat and barley genotypes, while they are mostly upregulated in susceptible genotypes; (iii) the NBS, CC-NBS-LRR and RLK genes showed unique expression patterns in response to BYDV-PAV in wheat and barley genotypes, which equally differ in their resistance or susceptibility to the virus and mediate a defence response; (iv) the transcription factors GRAS in wheat and MYB in barley also showed a similar expression pattern and may also contribute to the defence response in wheat and barley, respectively; (v) the RLK gene showed the same expression pattern associated with resistance or susceptibility in both wheat and barley genotypes, indicating a unique candidate gene, conferring resistance.
These target genes thus provide a new avenue for further investigation of the molecular and physiological processes involved in the defence of barley and wheat against BYDV-PAV. They could be particularly useful for monitoring and developing BYDV-PAV-resistant cereal plants using molecular breeding methods, including transgenic breeding and marker-assisted selection of elite alleles. In this sense, finding orthologous resistant genotypes will increase the possibility of selecting superior alleles for breeding. However, additional factors should be taken into account, such as genetic adaptations of barley (a diploid with a genome size of 5.1 Gb) and wheat (a hexaploid with a genome size of 16 Gb) species, different gene expression levels between genotypes, early or late response to infection and interdependence between effector genes or their products in the signalling pathways they trigger.
Supplementary Materials
The following supporting information can be downloaded at: https://www.mdpi.com/article/10.3390/v15030716/s1, Supplementary Table S1. List of primers used in this study; Supplementary Table S2. Expression profile showing the expression fold change mean values, SEM and TTest; Supplementary Figure S1. BYDV-PAV titre for all barley and wheat samples with multifactorial ANOVA values.
Author Contributions
Conceptualization, J.K.K.; methodology, J.K.K.; G.A. and E.I.; software, G.A.; validation, G.A.; formal analysis, G.A.; investigation, J.K.K.; G.A. and E.I.; resources, J.K.K.; data curation, G.A.; and J.K.K.; writing—original draft preparation, G.A. and J.K.K.; writing—review and editing, J.K.K. and M.N.M.; visualization, G.A.; supervision, J.K.K.; project administration, J.K.K.; funding acquisition, J.K.K. All authors have read and agreed to the published version of the manuscript.
Funding
The work was supported by the Ministry of Agriculture of the Czech Republic, project no. Mze RO 0418. J.K.K. was also supported by OP-EU Operational Programme project no. CZ.02.2.69/0.0/0.0/18_053/0016953 (visiting scientist at the Natural Resources Institute, University of Greenwich, UK) from the Ministry of Education, Youth and Sports of the Czech Republic.
Institutional Review Board Statement
Not applicable.
Informed Consent Statement
Not applicable.
Data Availability Statement
Not applicable.
Acknowledgments
We thank MarkétaVítámvásová and Hana Novotná (Plant Virus and Vector Interactions, Crop Research Institute, Czech Republic) for their excellent technical assistance.
Conflicts of Interest
The authors declare no conflict of interest.
Abbreviations
| BYDV-PAV | Barley yellow dwarf virus-PAV |
| RT-qPCR | Reverse transcription-quantitative polymerase chain reaction |
| miRNAs | Micro-Ribonucleic acid |
| PGSB | Plant Genome and Systems Biology |
| LRR | Leucine-rich repeat |
| R | Resistance (used as R gene or R protein) |
| Dai | Days after inoculation |
| Ct | Cycle threshold |
| NCBI | National Center for Biotechnology Information |
| E | Efficiency (primer) |
| ANOVA | Analysis of variance |
| NBS | Nucleotide Binding Site |
| LRR | Leucine-rich repeat |
| CC | Coiled coil |
| TF | Transcription factor |
| ISD | Integrated sensory domains |
| RLK | Receptor-like kinases |
| PRP | Pattern-recognizing receptor |
| MYB | Myeloblastosis (domain of the transcription factor) |
| GRAS | Transcription factor named after the first three members: gibberellic-acid insensitive (GAI), repressor of GAI (RGA) and Scarecrow (SCR) |
| MADS | Acronym is derived from the yeast Minichromosome Maintenance 1 (MCM1), the Arabidopsis agamous (AG), the Antirrhinum deficiens (DEFA), and the mammalian Serum Response Factor (SRF) |
References
- Perry, K.L.; Kolb, F.L.; Sammons, B.; Lawson, C.; Cisar, G.; Ohm, H. Yield effects of barley yellow dwarf virus in soft red winter wheat. Phytopathology 2000, 90, 1043–1048. [Google Scholar] [CrossRef] [PubMed] [Green Version]
- Hewings, A.D. Purification and virion characterization of barley yellow dwarf viruses. In Barley Yellow Dwarf, 40 Years of Progress; D’Arcy, C.J., Burnett, P.A., Eds.; APS Press: St. Paul, MN, USA, 1995; pp. 165–179. [Google Scholar]
- Power, A.; Gray, S. Aphid transmission of barley yellow dwarf viruses interactions between viruses, vectors, and host plants. In Barley Yellow Dwarf, 40 Years of Progress; D’Arcy, J.C., Burnett, P.A., Eds.; APS Press: Saint Paul, MN, USA, 1995; pp. 255–291. [Google Scholar]
- Burnett, P.A.; Comeau, A.; Qualset, C.O. Host plant tolerance or resistance for control of barley yellow dwarf. In Barley Yellow Dwarf, 40 Years of Progress; D’Arcy, C.J., Burnett, P.A., Eds.; APS Press: St. Paul, MN, USA, 1995; pp. 321–344. [Google Scholar]
- Kang, C.B.; Yeam, I.; Jahn, M.M. Genetics of plant virus resistance. Annu. Rev. Phytopathol. 2005, 43, 581–621. [Google Scholar] [CrossRef] [PubMed] [Green Version]
- Cooper, J.I.; Jones, A.T. Responses of plants to viruses: Proposals for the use of terms. Phytopathology 1983, 73, 127–128. [Google Scholar] [CrossRef] [Green Version]
- Jarošová, J.; Chrpová, J.; Šíp, V.; Kundu, J.K. A comparative study of the Barley yellow dwarf virus species PAV and PAS: Distribution, accumulation and host resistance. Plant Pathol. 2013, 62, 436–443. [Google Scholar] [CrossRef]
- Beoni, E.; Chrpová, J.; Jarošová, J.; Kundu, J.K. Survey of barley yellow dwarf virus incidence in winter cereals crops, and assessment of wheat and barley resistance to the virus. Crop Pasture Sci. 2016, 67, 1054–1063. [Google Scholar] [CrossRef]
- Choudhury, S.; Hu, H.; Larkin, P.; Meinke1, H.; Shabala, S.; Ahmed, I.; Zhou, M. Agronomical, biochemical and histological response of resistant and susceptible wheat and barley under BYDV stress. Peer J. 2018, 6, e4833. [Google Scholar] [CrossRef]
- Singh, R.P.; Burnett, P.A.; Albarran, M.; Rajaram, S. Bdv1: A gene for tolerance to barley yellow dwarf virus in bread wheats. Crop Sci. 1993, 33, 231–234. [Google Scholar] [CrossRef]
- Ayala, L.; Henry, M.; van Ginkel, M.; Singh, R.; Keller, B.; Khairallah, M. Identification of QTLs for BYDV tolerance in bread wheat. Euphytica 2002, 128, 249–259. [Google Scholar] [CrossRef]
- Suneson, C.A. Breeding for resistance to barley yellow dwarf virus in barley. Agron. J. 1955, 47, 283. [Google Scholar] [CrossRef]
- Rasmusson, D.C.; Schaller, C.W. The inheritance of resistance in barley to the yellow-dwarf virus. Agron. J. 1959, 51, 661–664. [Google Scholar] [CrossRef]
- Niks, R.E.; Habekuss, A.; Bekele, B.; Ordon, F. A novel major gene on chromosome 6H for resistance of barley against the barley yellow dwarf virus. Theor. Appl. Genet. 2004, 109, 1536–1543. [Google Scholar] [CrossRef]
- Scholz, M.; Ruge-Wehling, B.; Habekuß, A.; Schrader, O.; Pendinen, G.; Fischer, K.; Wehling, P. Ryd4Hb: A novel resistance gene introgressed from Hordeumbulbosum into barley and conferring complete and dominant resistance to the barley yellow dwarf virus. Theor. Appl. Genet. 2009, 119, 837–849. [Google Scholar] [CrossRef]
- Jarošová, J.; Beoni, E.; Kundu, J.K. Barley yellow dwarf virus resistance in cereals: Approaches, strategies and prospects. Field Crop Res. 2016, 198, 200–214. [Google Scholar] [CrossRef]
- Zhang, T.; Liang, Q.; Li, C.; Fu, S.; Kundu, J.K.; Zhou, X.; Wu, J. Transcriptome Analysis of Rice Reveals the lncRNA–mRNA Regulatory Network in Response to Rice Black-Streaked Dwarf Virus Infection. Viruses 2020, 12, 951. [Google Scholar] [CrossRef]
- Postnikova, O.A.; Nemchinov, L.G. Comparative analysis of microarray data in Arabidopsis transcriptome during compatible interactions with plant viruses. Virol. J. 2012, 9, 101. [Google Scholar] [CrossRef] [Green Version]
- Durrant, W.E.; Dong, X. Systemic acquired resistance. Annu. Rev. Phytopathol. 2004, 42, 185–209. [Google Scholar] [CrossRef]
- Jones, J.D.; Dangl, J.L. The plant immune system. Nature 2006, 444, 323–329. [Google Scholar] [CrossRef] [Green Version]
- Carr, J.P.; Lewsey, M.G.; Palukaitis, P. Signaling in induced resistance. Adv. Virus Res. 2010, 76, 57–121. [Google Scholar]
- Kourelis, J.; van der Hoorn, R.A.L. Defended to the Nines: 25 Years of Resistance Gene Cloning Identifies Nine Mechanisms for R Protein Function. Plant Cell 2018, 30, 285–299. [Google Scholar] [CrossRef] [Green Version]
- Jarošová, J.; Singh, K.; Chrpová, J.; Kundu, J.K. Analysis of Small RNAs of Barley Genotypes Associated with Resistance to Barley Yellow Dwarf Virus. Plants 2020, 9, 60. [Google Scholar] [CrossRef] [Green Version]
- Jarosová, J.; Kundu, J.K. Validation of reference genes as internal control for studying viral infections in cereals by quantitative real-time RT-PCR. BMC Plant Biol. 2010, 10, 146. [Google Scholar] [CrossRef] [PubMed] [Green Version]
- Kundu, J.K.; Jarošová, J.; Gadiou, S.; Červená, G. Discrimination of three BYDV species by one-step RT-PCR-RFLP and sequence based methods in cereal plants from the Czech Republic. Cereal Res. Commun. 2009, 37, 541–550. [Google Scholar] [CrossRef]
- Jarošová, J.; Ripl, J.; Fousek, J.; Kundu, J.K. TaqMan Multiplex Real-Time qPCR assays for the detection and quantification of Barley yellow dwarf virus, Wheat dwarf virus and Wheat streak mosaic virus and the study of their interactions. Crop Pasture Sci. 2018, 69, 755–764. [Google Scholar] [CrossRef] [Green Version]
- Lee, C.; Kim, J.; Shin, G.S.; Hwang, S. Absolute and relative QPCR quantification of plasmid copy number in Escherichia coli. J. Biotechnol. 2006, 123, 273–280. [Google Scholar] [CrossRef] [Green Version]
- Cejnar, P.; Ohnoutková, L.; Ripl, J.; Vlčko, T.; Kundu, J.K. Two mutations in the truncated Rep gene RBR domain delayed the Wheat dwarf virus infection in transgenic barley plants. J. Integr. Agric. 2018, 17, 2492–2500. [Google Scholar] [CrossRef] [Green Version]
- Malmstrom, C.M.; Shu, R. Multiplexed RT-PCR for streamlined detection and separation of barley and cereal yellow dwarf viruses. J. Virol. Methods 2004, 120, 69–78. [Google Scholar] [CrossRef]
- Krattinger, S.G.; Keller, B. Molecular genetics and evolution of disease resistance in cereals. New Phytol. 2016, 212, 320–332. [Google Scholar] [CrossRef] [Green Version]
- Radonić, A.; Thulke, S.; Mackay, I.M.; Landt, O.; Siegert, W.; Nitsche, A. Guideline to reference gene selection for quantitative real-time PCR. Biochem. Biophys. Res. Commun. 2004, 313, 856–862. [Google Scholar] [CrossRef]
- Livak, K.J.; Schmittgen, T.D. Analysis of relative gene expression data using real-time quantitative PCR and the 2(-Delta Delta C(T)) method. Methods 2001, 25, 402–408. [Google Scholar] [CrossRef]
- Madsen, L.H.; Collins, N.C.; Rakwalska, M.; Backes, G.; Sandal, N.; Krusell, L.; Jensen, J.; Waterman, E.H.; Jahoor, A.; Ayliffe, M.; et al. Barley disease resistance gene analogs of the NBS-LRR class: Identification and mapping. Mol. Genet. Genom. 2003, 269, 150–161. [Google Scholar] [CrossRef]
- Liu, Y.; Zeng, Z.; Li, Q.; Jiang, X.M.; Jiang, Z.; Tang, J.H.; Chen, D.; Wang, Q.; Chen, J.Q.; Shao, Z.Q. An angiosperm NLR atlas reveals that NLR gene reduction is associated with ecological specialization and signal transduction component deletion. Mol. Plant 2021, 14, 2015–2031. [Google Scholar] [CrossRef]
- Zhang, C.; Chen, H.; Cai, T.; Deng, Y.; Zhuang, R.; Zhang, N.; Zeng, Y.; Zheng, Y.; Tang, R.; Pan, R.; et al. Overexpression of a novel peanut NBS-LRR gene AhRRS5 enhances disease resistance to Ralstonia solanacearum in tobacco. Plant Biotechnol. J. 2017, 15, 39–55. [Google Scholar] [CrossRef]
- Yoshimura, S.; Yamanouchi, U.; Katayose, Y.; Toki, S.; Wang, Z.X.; Kono, I.; Kurata, N.; Yano, M.; Iwata, N.; Sasaki, T. Expression of Xa1, a bacterial blight-resistance gene in rice, is induced by bacterial inoculation. Proc. Nat. Acad. Sci. USA 1998, 95, 1663–1668. [Google Scholar] [CrossRef] [Green Version]
- Zhou, X.; Liu, J.; Bao, S.; Yang, Y.; Zhuang, Y. Molecular cloning and characterization of a wild eggplant Solanum aculeatissimum NBS-LRR gene, involved in plant resistance to Meloidogyne incognita. Int. J. Mol. Sci. 2018, 19, 583. [Google Scholar] [CrossRef] [Green Version]
- Xu, Y.; Liu, F.; Zhu, S.; Li, X. The Maize NBS-LRR Gene ZmNBS25Enhances Disease Resistance in Rice and Arabidopsis. Front. Plant Sci. 2018, 9, 1033. [Google Scholar] [CrossRef]
- Goyala, N.; Bhatiaa, G.; Sharmab, S.; Garewala, N.; Upadhyayc, A.; Upadhyayd, K.S.; Singha, K. Genome-wide characterization revealed role of NBS-LRR genes during powdery mildew infection in Vitis vinifera. Genomics 2020, 112, 312–322. [Google Scholar] [CrossRef]
- Césari, S.; Kanzaki, H.; Fujiwara, T.; Bernoux, M.; Chalvon, V.; Kawano, Y.; Shimamoto, K.; Dodds, P.; Terauchi, R.; Kroj, T. The NB-LRR proteins RGA4 and RGA5 interact functionally and physically to confer disease resistance. EMBO J. 2014, 33, 1941–1959. [Google Scholar] [CrossRef] [Green Version]
- Brueggeman, R.; Druka, A.; Nirmala, J.; Cavileer, T.; Drader, T.; Rostoks, N.; Mirlohi, A.; Bennypaul, H.; Gill, U.; Kudrna, D.; et al. The stem rust resistance gene Rpg5 encodes a protein with nucleotide-binding-site, leucine-rich, and protein kinase domains. Proc. Nat. Acad. Sci. USA 2008, 105, 14970–14975. [Google Scholar] [CrossRef] [Green Version]
- Wang, X.; Richards, J.; Gross, T.; Druka, A.; Kleinhofs, A.; Steffenson, B.; Acevedo, M.; Brueggeman, R. The rpg4-mediated resistance to wheat stem rust (Puccinia graminis) in barley (Hordeum vulgare) requires Rpg5, a second NBS-LRR gene, and an actin depolymerization factor. Mol. Plant-Microbe Interact. 2013, 26, 407–418. [Google Scholar] [CrossRef] [Green Version]
- Wang, G.; Roux, B.; Feng, F.; Guy, E.; Li, L.; Li, N.; Zhang, X.; Lautier, M.; Jardinaud, M.F.; Chabannes, M.; et al. The decoy substrate of a pathogen effector and a pseudokinase specify pathogen-induced modified-self recognition and immunity in plants. Cell Host Microbe 2015, 18, 285–295. [Google Scholar] [CrossRef] [Green Version]
- Arora, D.; Gross, T.; Brueggeman, R. Allele characterization of genes required for rpg4-mediated wheat stem rust resistance identifies Rpg5 as the R gene. Phytopathology 2013, 103, 1153–1161. [Google Scholar] [CrossRef] [PubMed] [Green Version]
- Loutre, C.; Wicker, T.; Travella, S.; Galli, P.; Scofield, S.; Fahima, T.; Feuillet, C.; Keller, B. Two different CC-NBS-LRR genes are required for Lr10-mediated leaf rust resistance in tetraploid and hexaploid wheat. Plant J. 2009, 60, 1043–1054. [Google Scholar] [CrossRef] [Green Version]
- Li, Q.; Jiang, X.M.; Shao, Z.Q. Genome-Wide Analysis of NLR Disease Resistance Genes in an Updated Reference Genome of Barley. Front. Genet. 2021, 12, 694682. [Google Scholar] [CrossRef] [PubMed]
- Wu, C.H.; Krasileva, K.V.; Banfield, M.J.; Terauchi, R.; Kamoun, S. The “sensor domains” of plant NLR proteins: More than decoys? Front. Plant Sci. 2015, 6, 134. [Google Scholar] [CrossRef] [PubMed] [Green Version]
- Solanki, S. Dissecting the Mystery Behind Rpg5 Mediated Puccinia graminis Resistance in Barley Using Genetics, Molecular And Bioinformatics Approaches. Ph.D. Thesis, North Dakota State University of Agriculture and Applied Science, Fargo, ND, USA, 2017. [Google Scholar]
- Dardick, C.; Schwessinger, B.; Ronald, P. Non-arginine-aspartate (non-RD) kinases are associated with innate immune receptors that recognize conserved microbial signatures. Cur. Opin. Plant Biol. 2012, 15, 358–366. [Google Scholar] [CrossRef]
- Tang, D.Z.; Wang, G.X.; Zhou, J.M. Receptor kinases in plant-pathogen interactions: More than pattern recognition. Plant Cell 2017, 29, 618–637. [Google Scholar] [CrossRef] [Green Version]
- Zhou, J.M.; Zhang, Y.L. Plant immunity: Danger perception and signalling. Cell 2020, 181, 978–989. [Google Scholar] [CrossRef]
- Xia, T.; Yang, V.; Zheng, H.; Han, X.; Jin, H.; Xiong, Z.; Qian, W.; Xia, L.; Ji1, X.; Li, G.; et al. Efficient expression and function of a receptor-like kinase in wheat powdery mildew defence require an intron-located MYB binding site. Plant Biotechnol. J. 2021, 19, 897–909. [Google Scholar] [CrossRef]
- Thapa, G.; Gunupuru, L.R.; Heir, J.G.; Kahla, A.; Mullins, E.; Doohan, F.M. A pathogen-responsive leucine rich receptor like kinase contributes to Fusarium resistance in cereals. Front. Plant Sci. 2018, 9, 867. [Google Scholar] [CrossRef] [Green Version]
- Zhou, H.B.; Li, S.F.; Deng, Z.Y.; Wang, X.P.; Chen, T.; Zhang, J.S.; Chen, S.Y.; Ling, H.; Zhang, A.; Wang, D.; et al. Molecular analysis of three new receptor-like kinase genes from hexaploid wheat and evidence for their participation in the wheat hypersensitive response to stripe rust fungus infection. Plant J. 2007, 52, 420–434. [Google Scholar] [CrossRef]
- Hu, P.; Wise, R.P. Diversification of Lrk/Tak kinase gene clusters is associated with subfunctionalization and cultivar-specific transcript accumulation in barley. Funct. Integr. Genom. 2008, 8, 199–209. [Google Scholar] [CrossRef]
- Parrott, D.L.; Huang, L.; Fischer, M.A. Downregulation of a barley (Hordeum vulgare) leucine-rich repeat, non-arginine-aspartate receptor-like protein kinase reduces expression of numerous genes involved in plant pathogen defense. Plant Physiol. Biochem. 2016, 100, 130–140. [Google Scholar] [CrossRef] [Green Version]
- Javed, T.; Shabbir, R.; Ali, A.; Afzal, I.; Zaheer, U.; Gao, S.J. Transcription factors in plant stress responses: Challenges and potential for sugarcane improvement. Plants 2020, 9, 491. [Google Scholar] [CrossRef]
- Shan, T.; Rong, V.; Xu, H.; Du, L.; Liu, X.; Zhang, Z. The wheat R2R3-MYB transcription factor TaRIM1 participates in resistance response against the pathogen Rhizoctonia cerealis infection through regulating defense genes. Sci. Rep. 2016, 6, 28777. [Google Scholar] [CrossRef] [Green Version]
- Seo, P.J.; Park, C.M. MYB96-mediated abscisic acid signals induce pathogen resistance response by promoting salicylic acid biosynthesis in Arabidopsis. New Phytol. 2010, 186, 471–483. [Google Scholar] [CrossRef]
- Libault, M.; Wan, J.; Czechowski, T.; Udvardi, M.; Stacey, G. Identification of 118 Arabidopsis transcription factor and 30 ubiquitin-ligase genes responding to chitin, a plant-defense elicitor. Mol. Plant-Microbe Interact. 2007, 20, 900–911. [Google Scholar] [CrossRef] [Green Version]
- Mengiste, T.; Chen, X.; Salmeron, J.; Dietrich, R. The BOTRYTIS SUSCEPTIBLE1 gene encodes an R2R3MYB transcription factor protein that is required for biotic and abiotic stress responses in Arabidopsis. Plant Cell 2003, 15, 2551–2565. [Google Scholar] [CrossRef] [Green Version]
- Chang, C.; Yu, D.; Jiao, J.; Jing, S.; Schulze-Lefert, P.; Shen, Q.H. Barley MLA immune receptors directly interfere with antagonistically acting transcription factors to initiate disease resistance signalling. Plant Cell 2013, 25, 1158–1173. [Google Scholar] [CrossRef] [Green Version]
- Liu, H.; Zhou, X.; Dong, N.; Liu, X.; Zhang, H.; Zhang, Z. Expression of a wheat MYB gene in transgenic tobacco enhances resistance to Ralstonia solanacearum, and to drought and salt stresses. Funct. Integr. Genom. 2011, 11, 431–443. [Google Scholar] [CrossRef]
- Zhang, Z.; Liu, X.; Wang, X.; Zhou, M.; Zhou, X.; Ye, X.; Wei, X. An R2R3 MYB transcription factor in wheat, Ta PIMP 1, mediates host resistance to Bipolaris sorokiniana and drought stresses through regulation of defense-and stress-related genes. New Phytol. 2012, 196, 1155–1170. [Google Scholar] [CrossRef]
- Di Laurenzio, L.; Wysocka-Diller, J.; Malamy, J.E.; Pysh, L.; Helariutta, Y.; Freshour, G.; Hahn, M.G.; Feldmann, K.A.; Benfey, P.N. The SCARECROW gene regulates an asymmetric cell division that is essential for generating the radial organization of the Arabidopsis root. Cell 1996, 86, 423–433. [Google Scholar] [CrossRef] [PubMed] [Green Version]
- Bolle, C. The role of GRAS proteins in plant signal transduction and development. Planta 2004, 218, 683–692. [Google Scholar] [CrossRef] [PubMed]
- Fode, B.; Siemsen, T.; Thurow, C.; Weigel, R.; Gatz, C. The Arabidopsis GRAS protein SCL14 interacts with class II TGA transcription factors and is essential for the activation of stress inducible promoters. Plant Cell 2008, 20, 3122–3135. [Google Scholar] [CrossRef] [PubMed] [Green Version]
- Zhang, S.; Li, X.; Fan, S.; Zhou, L.; Wang, Y. Overexpression of HcSCL13, a Halostachys caspica GRAS transcription factor, enhances plant growth and salt stress tolerance in transgenic Arabidopsis. Plant Physiol. Biochem. 2020, 151, 243–254. [Google Scholar] [CrossRef]
- To, V.T.; Shi, Q.; Zhang, Y.; Shi, J.; Shen, C.; Zhang, D.; Cai, W. Genome-Wide Analysis of the GRAS Gene Family in Barley (Hordeum vulgare L.). Genes 2020, 11, 553. [Google Scholar] [CrossRef]
- Kumar, B.; Bhalothia, P. Evolutionary analysis of GRAS gene family for functional and structural insights into hexaploid bread wheat (Triticum aestivum). J. Biosci. 2021, 45, 46. [Google Scholar] [CrossRef]
- Claeys, H.; De Bodt, S.; Inzé, D. Gibberellins and DELLAs: Central nodes in growth regulatory networks. Trends Plant Sci. 2014, 19, 231–239. [Google Scholar] [CrossRef]
- Rong, W.; Wang, X.; Wang, X.; Massart, S.; Zhang, Z. Molecular and Ultrastructural Mechanisms Underlying Yellow Dwarf Symptom Formation in Wheat after Infection of Barley Yellow Dwarf Virus. Int. J. Mol. Sci. 2018, 19, 1187. [Google Scholar] [CrossRef] [Green Version]
- Schilling, S.; Pan, S.; Kennedy, A.; Melzer, R. MADS-Box genes and crop domestication: The jack of all traits. J. Exp. Bot. 2018, 69, 1447–1469. [Google Scholar] [CrossRef]
- Zhang, H.; Teng, W.; Liang, J.; Liu, X.; Zhang, H.; Zhang, Z.; Zheng, X. MADS1, a novel MADS-box protein, is involved in the response of Nicotiana benthamiana to bacterial harpinXoo. J. Exp. Bot. 2016, 67, 131–141. [Google Scholar] [CrossRef] [Green Version]
- Li, W.; Zhu, Z.; Chern, M.; Yin, J.; Yang, C.; Ran, L.I.; Cheng, M.; He, M.; Wang, K.; Wang, J.; et al. A natural allele of a transcription factor in rice confers broad-spectrum blast resistance. Cell 2017, 170, 114–126. [Google Scholar] [CrossRef] [Green Version]
- Wang, H.; Jiao, X.; Kong, X.; Hamera, S.; Wu, Y.; Chen, X.; Fang, R.; Yan, Y. A signalling cascade from miR444 to RDR1 in rice antiviral RNA silencing pathway. Plant Physiol. 2016, 170, 2365–2377. [Google Scholar] [CrossRef] [Green Version]
- Ren, Q.; Jiang, H.; Xiang, W.; Nie, Y.; Xue, S.; Zhi, H.; Li, K.; Gai, J. A MADS-box gene is involved in soybean resistance to multiple Soybean mosaic virus strains. Crop J. 2022, 10, 802–808. [Google Scholar] [CrossRef]
Figure 1.
BYDV-PAV titre (virus copy number) in barley genotypes (A) and wheat genotypes (B). Significant differences are shown after one-way ANOVA and Tukey’s multiple comparison test, (* = p < 0.05 ** = p < 0.01 and *** = p < 0.001). Bars represent the means and standard errors of three biological replicates.

Figure 2.
Heat map showing expression profile of genes associated with resistance to BYDV-PAV infection in barley genotypes (A) and wheat genotypes (B). The blue colour stands for upregulation, the green for downregulation and the grey for control values (1). Up-regulation is mainly observed in susceptible genotypes (left), while down-regulation is more common in resistant genotypes (right). These patterns are particularly consistent for NBS, CC-NBS-LRR and Rec Kin in the inoculated samples of barley and wheat. Slight differences between 10 dai and 30 dai are also observed. The maps were generated with Graphpad Prism software using expression fold change values obtained from qPCR, followed by statistical analysis using two-way ANOVA.

Figure 3.
Box plots showing fold change in NBS-LRR resistance genes expression in different barley and wheat genotypes at 10 and 30 dai. The horizontal line in each box represents the mean expression fold change, and the lower and upper box limits the minimum and maximum values, respectively. Two-way ANOVA and Tukey’s multiple comparison test revealed significant differences * = p < 0.05, ** = p < 0.01, *** = p < 0.001, and **** = p < 0.0001. The straight arrow from Semper to PSR 3628 indicates the samepvalue when Semper is compared to all genotypes.

Figure 4.
Box plots showing the expression fold change of CC-NBS-LRR in different barley wheat genotypes at 10 and 30 dai. The horizontal line in each box represents the mean expression fold change, and the lower and upper box limits the minimum and maximum values, respectively. Two-way ANOVA and Tukey’s multiple comparison test revealed significant differences * = p < 0.05, ** = p < 0.01, *** = p < 0.001, and **** = p < 0.0001.

Figure 5.
Box plots showing the expression fold change of LRR receptor-like kinase in different barley and wheat genotypes at 10 and 30 dai. The horizontal line in each box represents the mean expression fold change, and the lower and upper box limits the minimum and maximum values, respectively. Two-way ANOVA and Tukey’s multiple comparison test revealed significant differences * = p < 0.05, ** = p < 0.01, *** = p < 0.001, and **** = p < 0.0001. The straight line at the top indicates the samepvalue when that genotype is compared to the rest in line.

Figure 6.
Box plots showing the expression fold change of Casein kinase in different barley and wheat genotypes at 10 and 30 dai. The horizontal line in each box represents the mean expression fold change, and the lower and upper box limits the minimum and maximum values, respectively. Two-way ANOVA and Tukey’s multiple comparison test revealed significant differences * = p < 0.05, ** = p < 0.01, *** = p < 0.001, and **** = p < 0.0001.

Figure 7.
Box plots showing the expression fold change of Protein kinase in different barley and wheat genotypes at 10 and 30 dai. The horizontal line in each box represents the mean expression fold change, and the lower and upper box limits the minimum and maximum values, respectively. Two-way ANOVA and Tukey’s multiple comparison test revealed significant differences * = p < 0.05, ** = p < 0.01, *** = p < 0.001, and **** = p < 0.0001.

Figure 8.
Box plots showing the expression fold change of Protein phosphatase in different barley and wheat genotypes at 10 and 30 dai. The horizontal line in each box represents the mean expression fold change, and the lower and upper limits the minimum and maximum values, respectively. Two-way ANOVA and Tukey’s multiple comparison test revealed significant differences * = p < 0.05 ** = p < 0.01 and **** = p < 0.0001.

Figure 9.
Box plots showing the expression fold change of MYB TF in different barley wheat genotypes at 10 and 30 dai. The horizontal line in each box represents the mean expression fold change, and the lower and upper box limits the minimum and maximum values, respectively. Two-way ANOVA and Tukey’s multiple comparison test revealed significant differences * = p < 0.05, ** = p < 0.01, *** = p < 0.001, and **** = p < 0.0001.

Figure 10.
Box plots showing the expression fold change of GRAS TF in different barley and wheat genotypes at 10 and 30 dai. The horizontal line in each box represents the mean expression fold change, and the lower and upper box limits the minimum and maximum values, respectively. Two-way ANOVA and Tukey’s multiple comparison test revealed significant differences * = p < 0.05, ** = p < 0.01, *** = p < 0.001, and **** = p < 0.0001.

Figure 11.
Box plots showing the expression fold change of MADS box transcription factor in different barley and wheat genotypes at 10 and 30 dai. The horizontal line in each box represents the mean expression fold change, and the lower and upper box limits the minimum and maximum values, respectively. Two-way ANOVA and Tukey’s multiple comparison test did not revealed any significant differences.


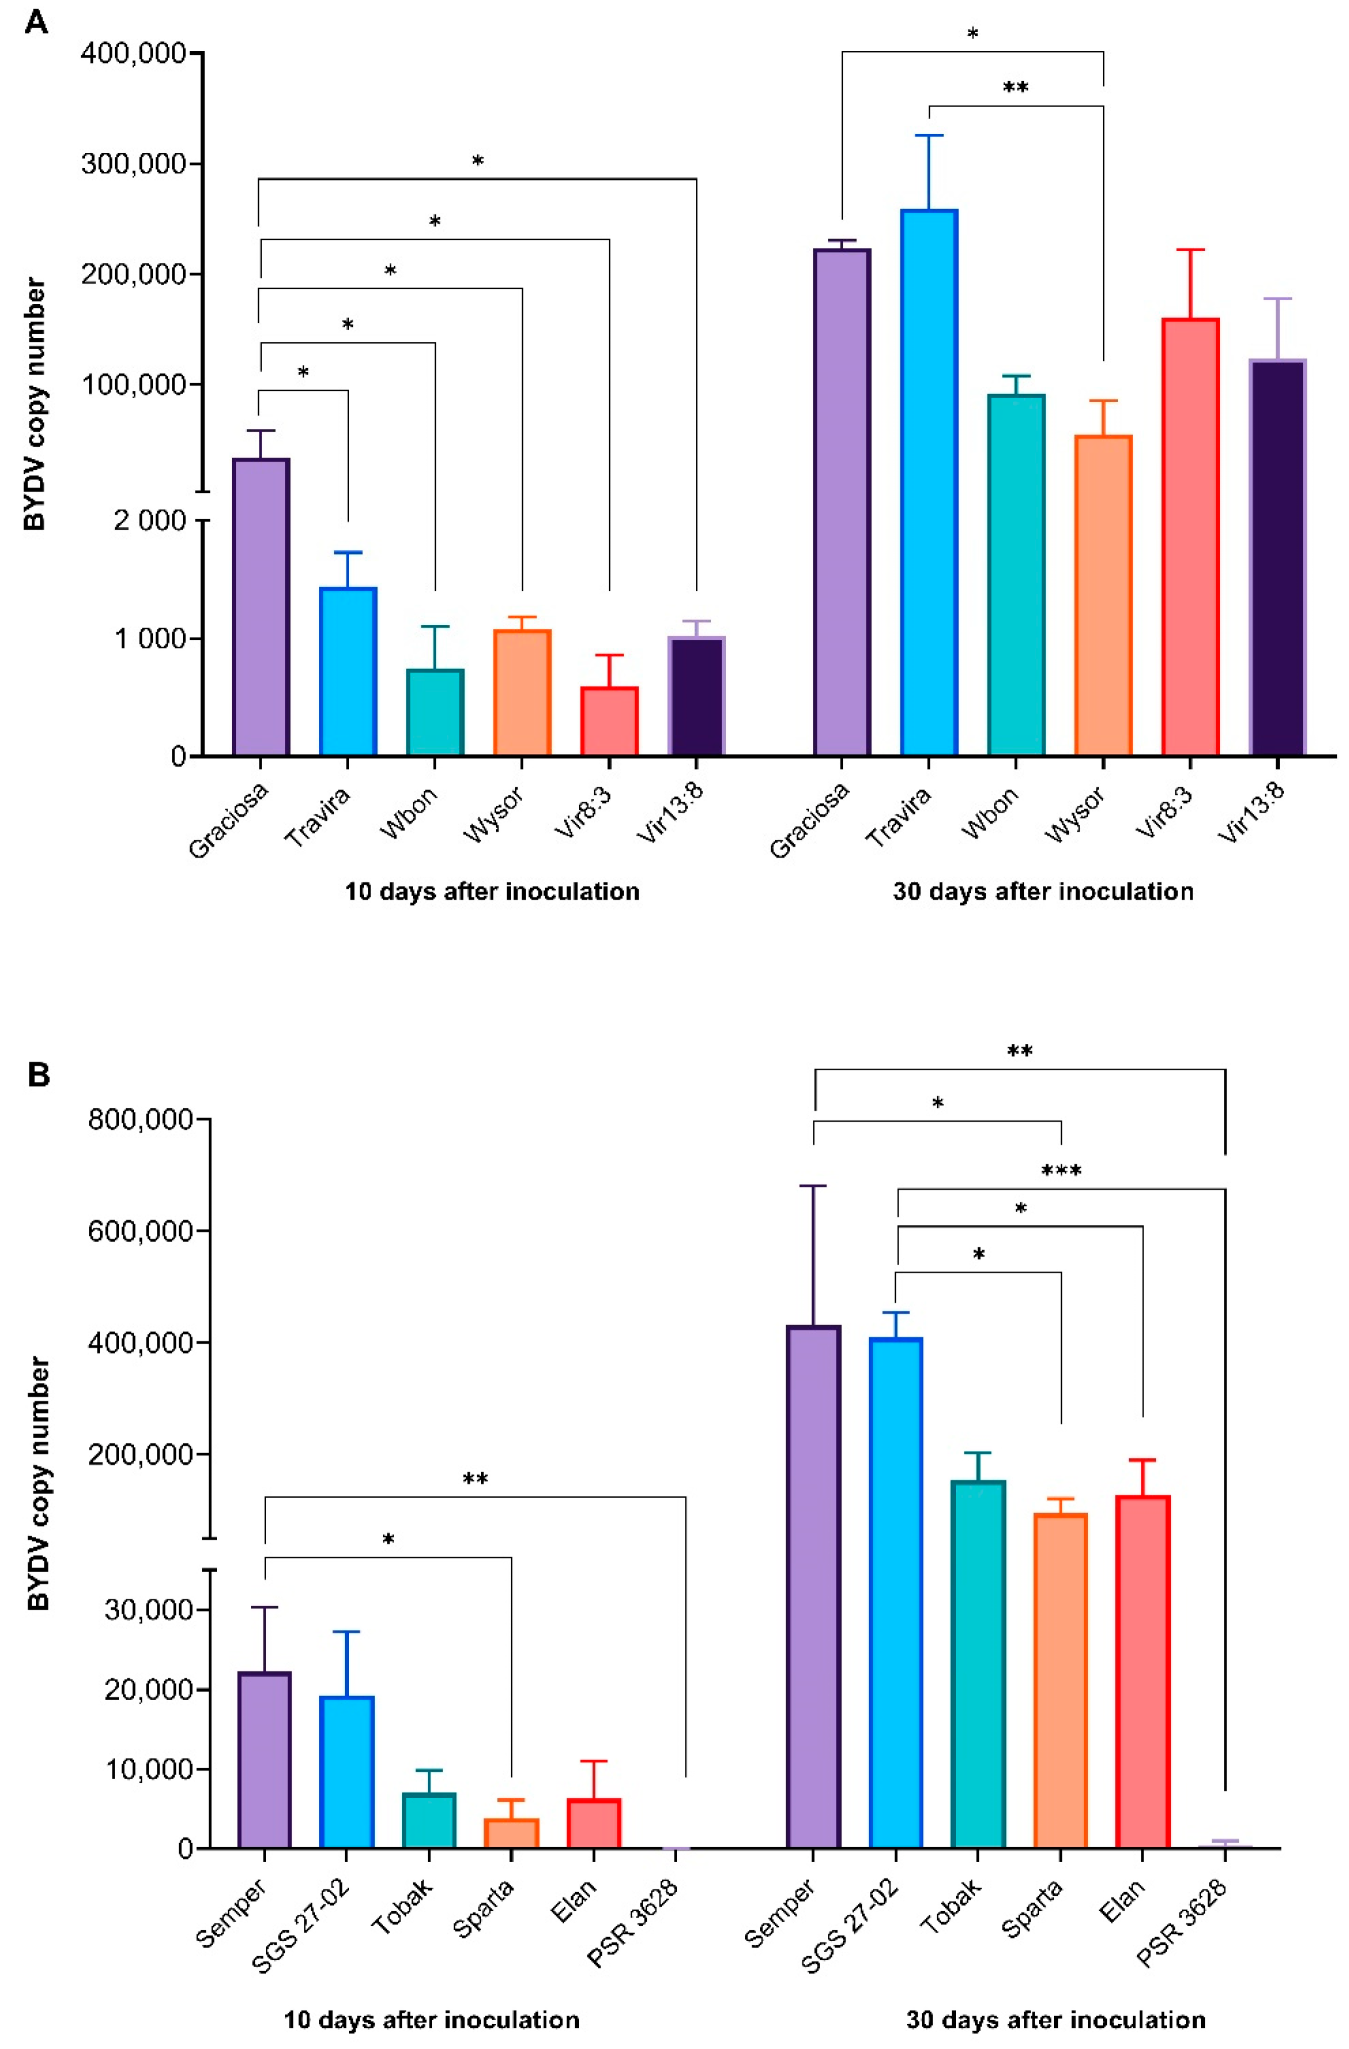
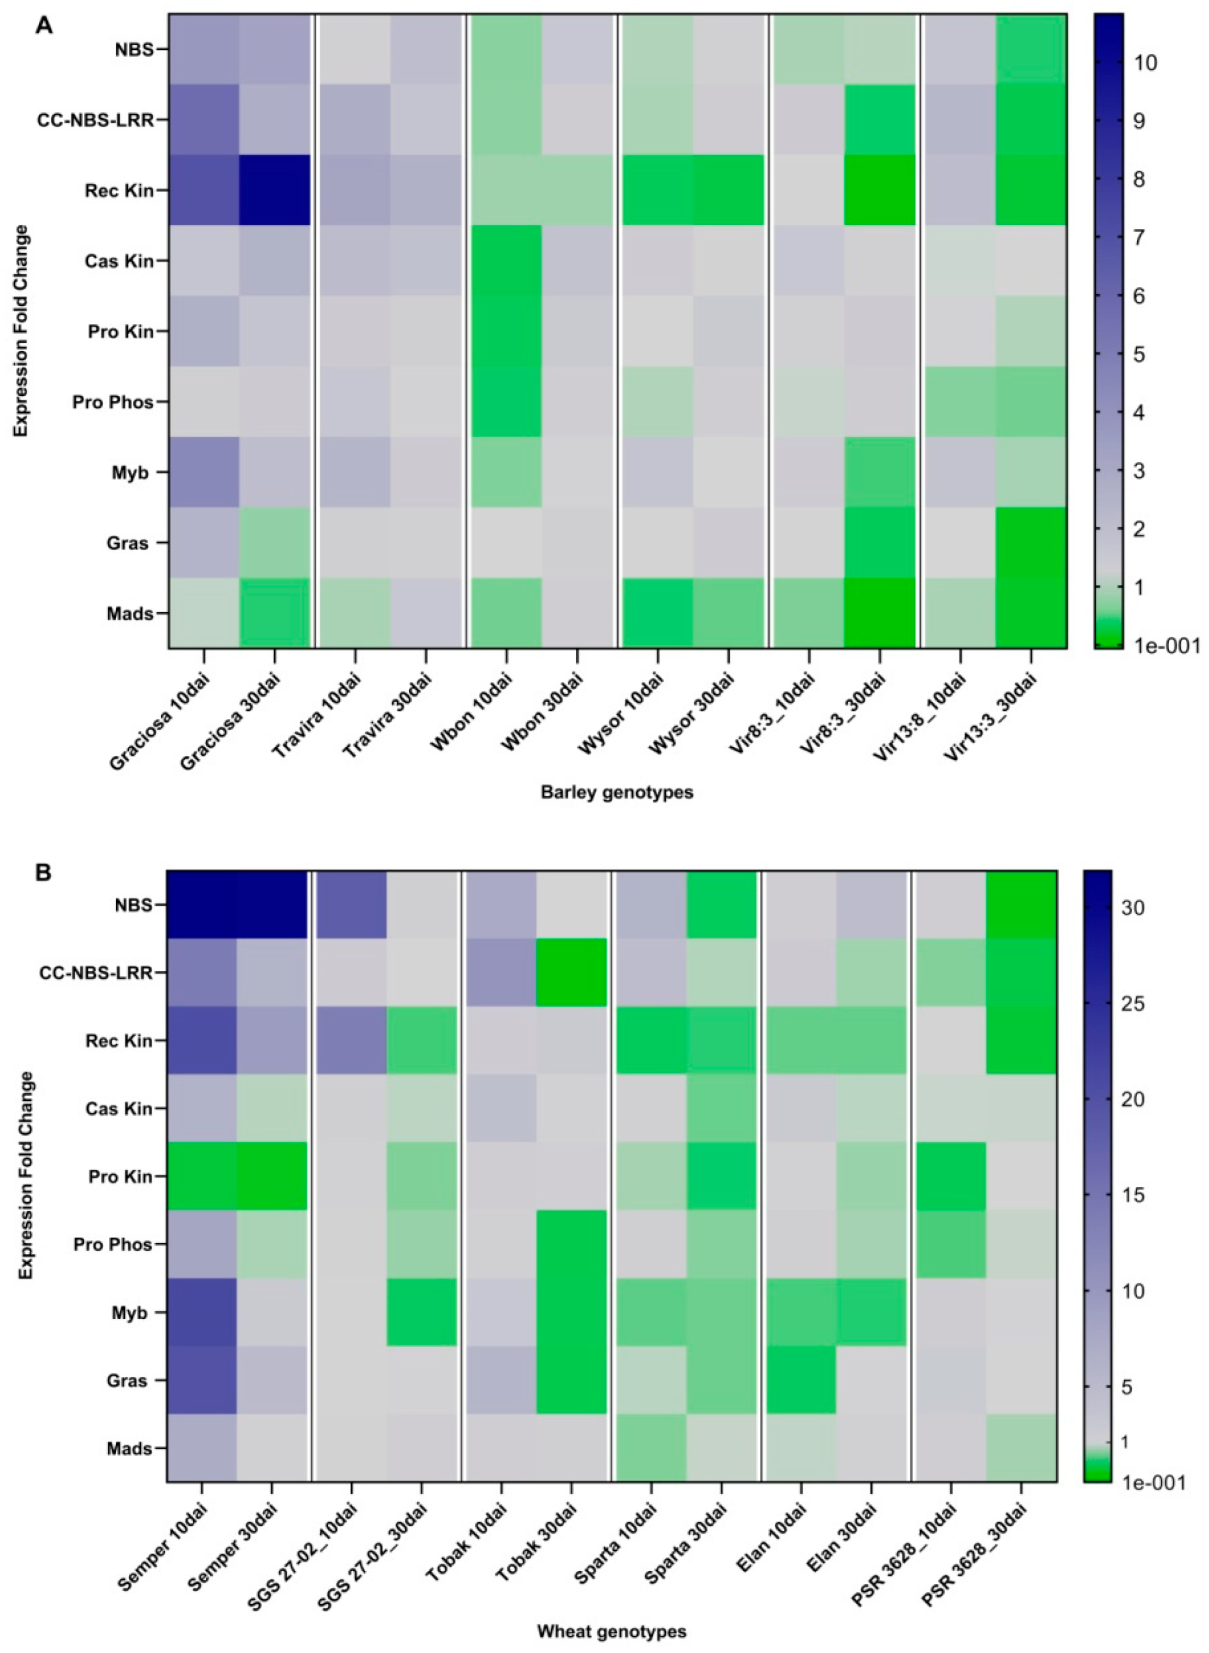
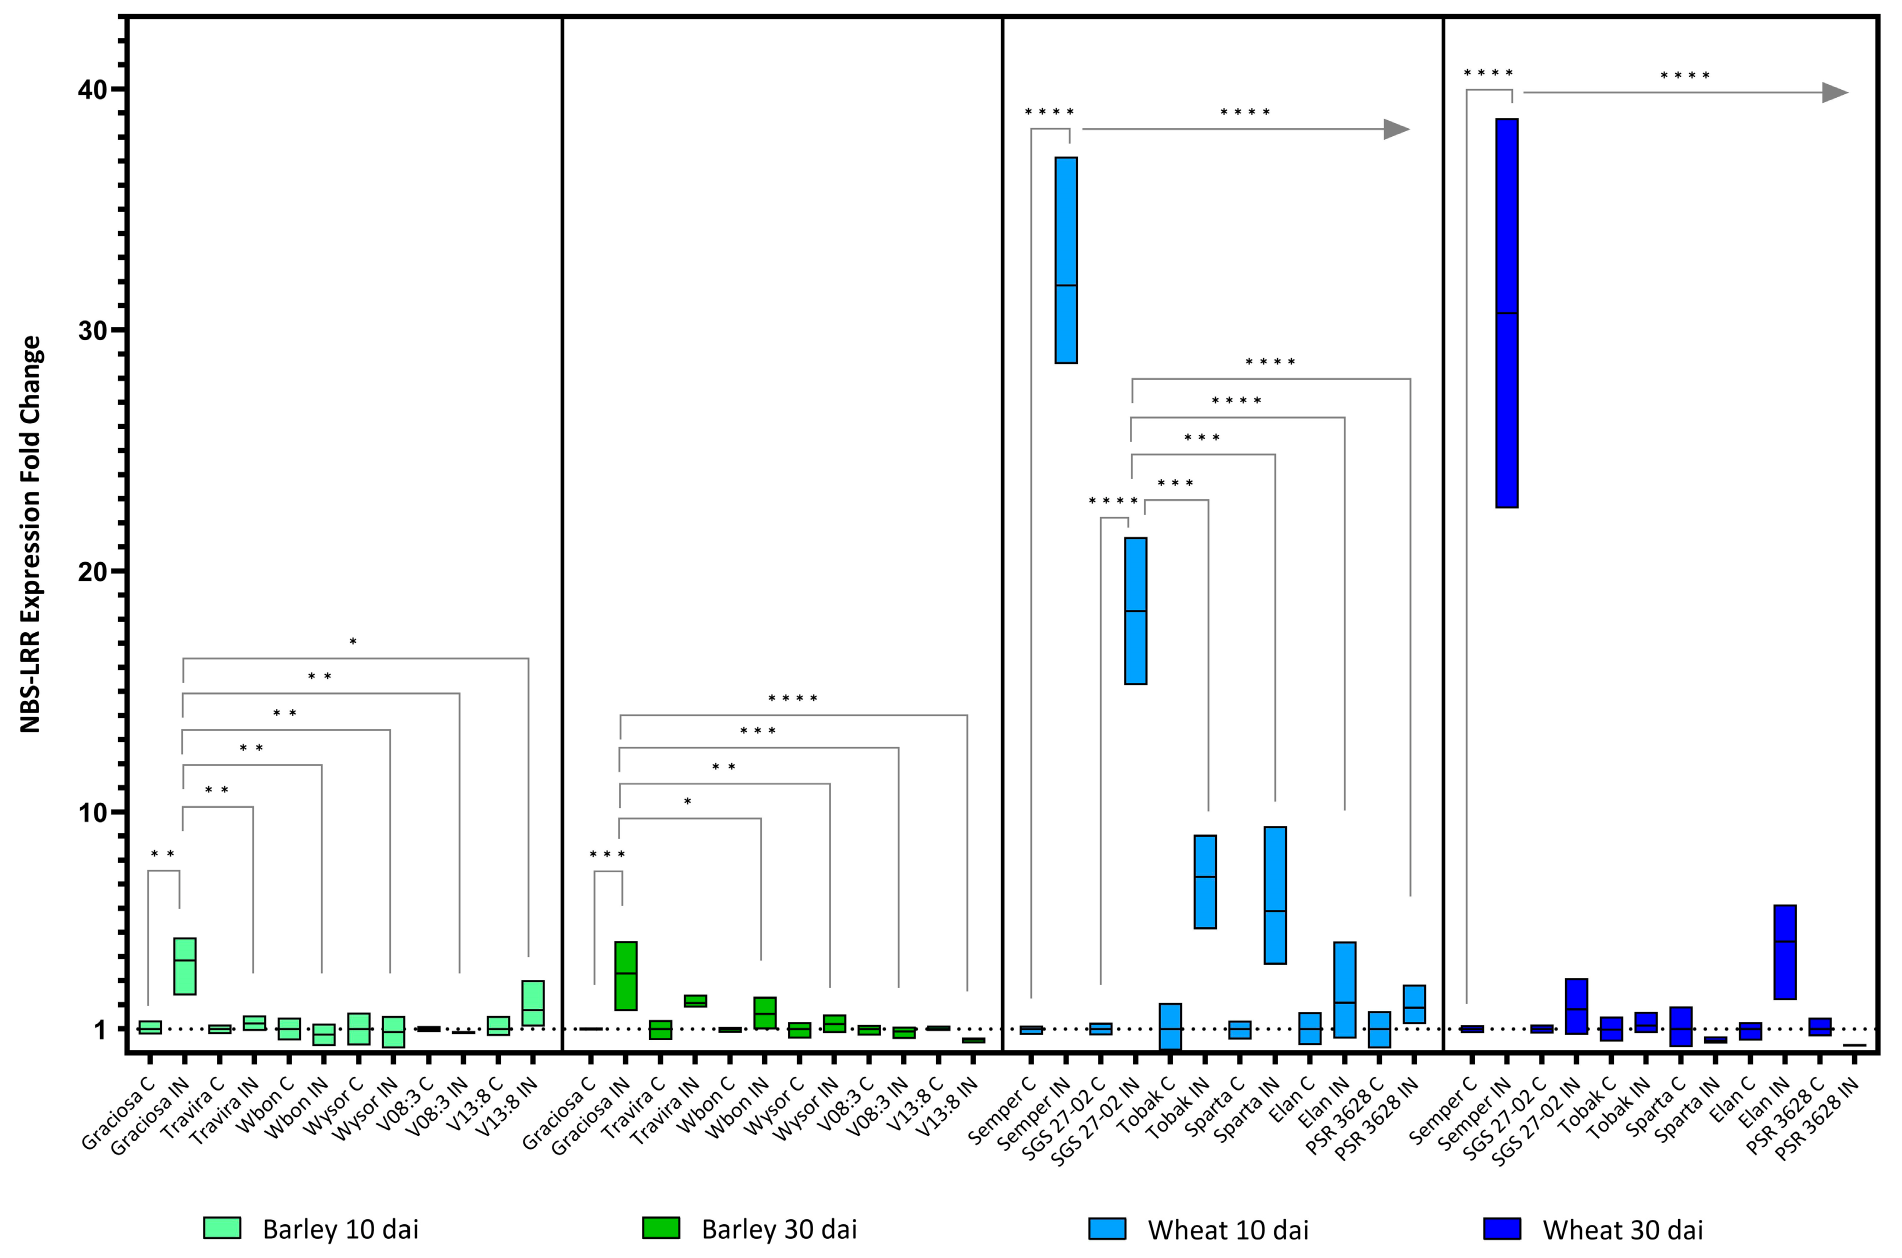
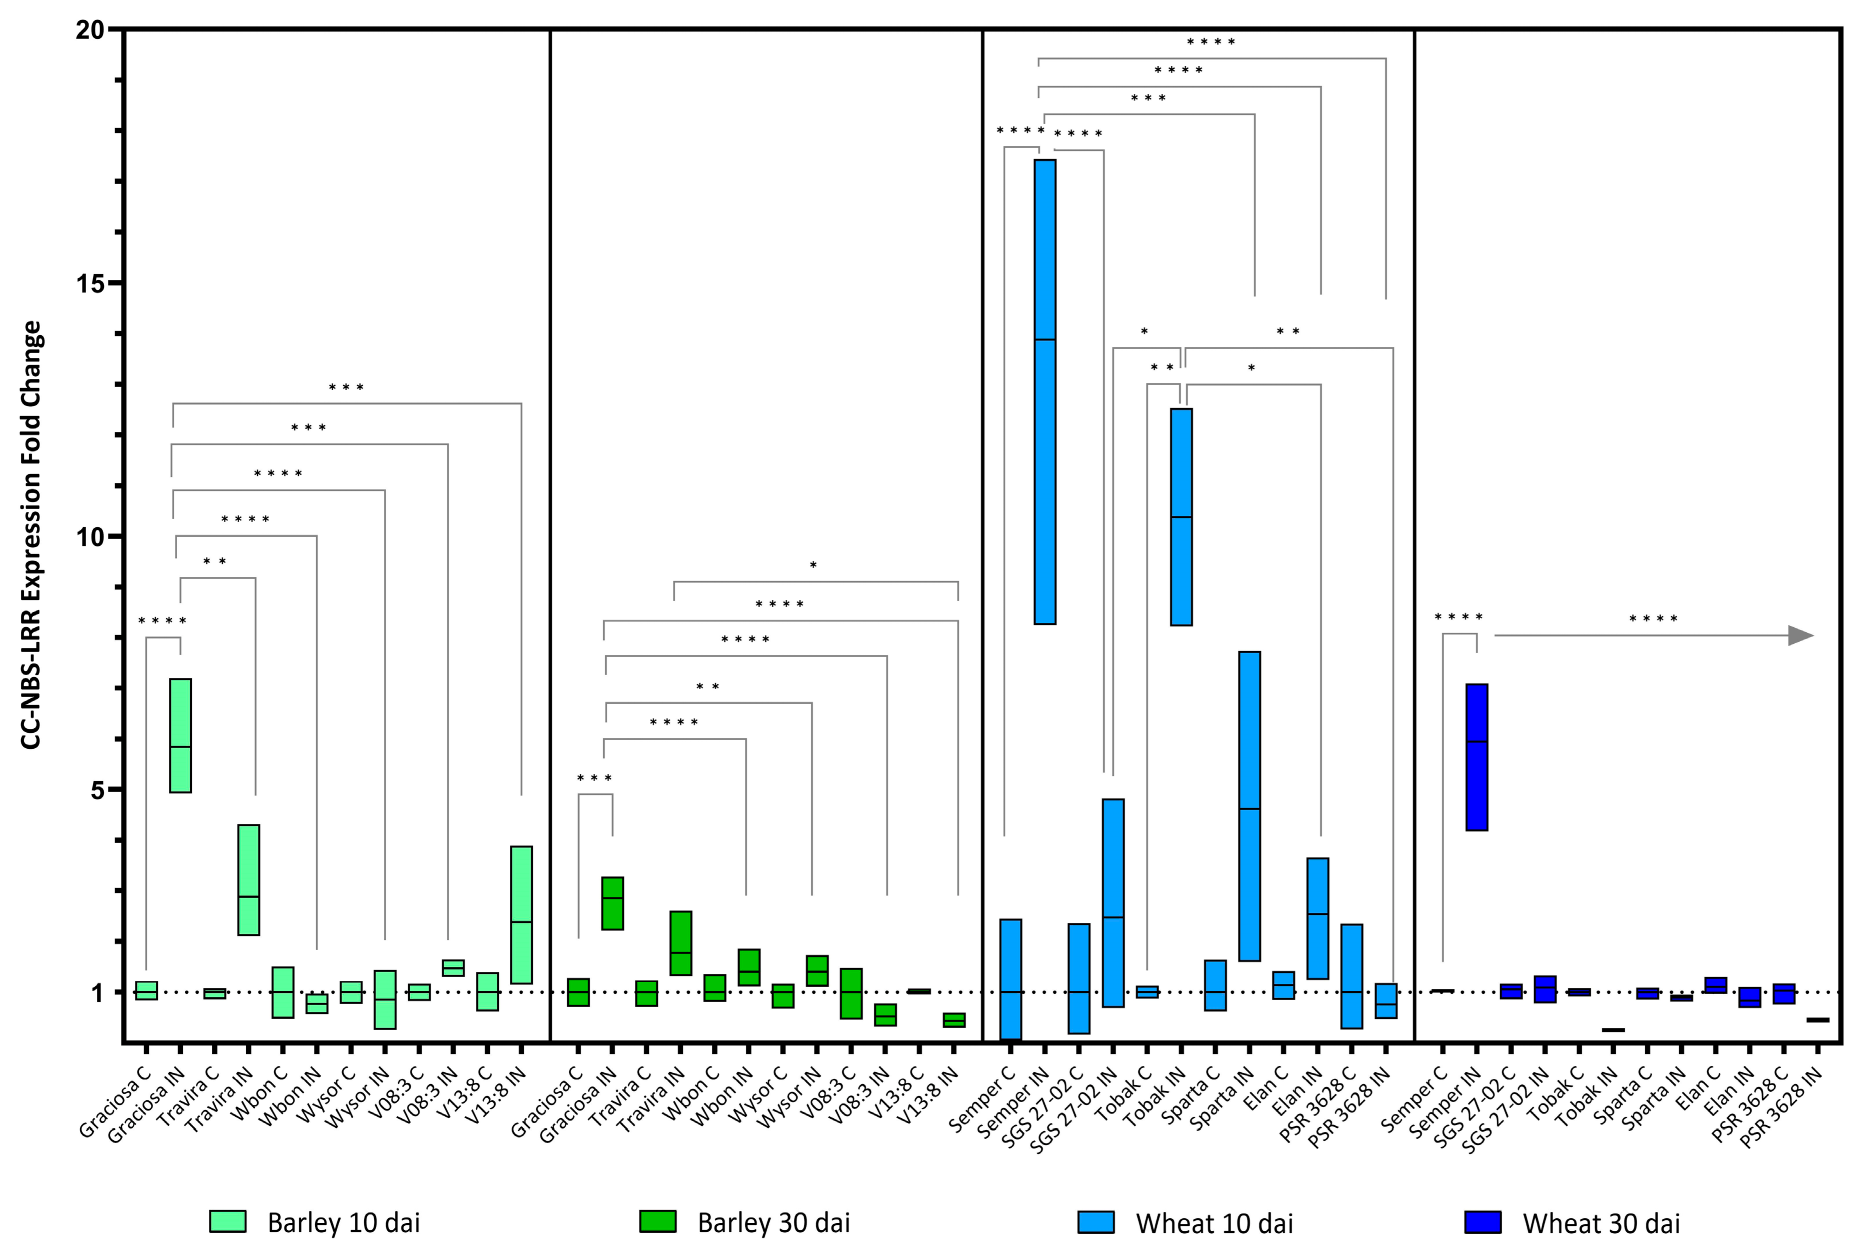
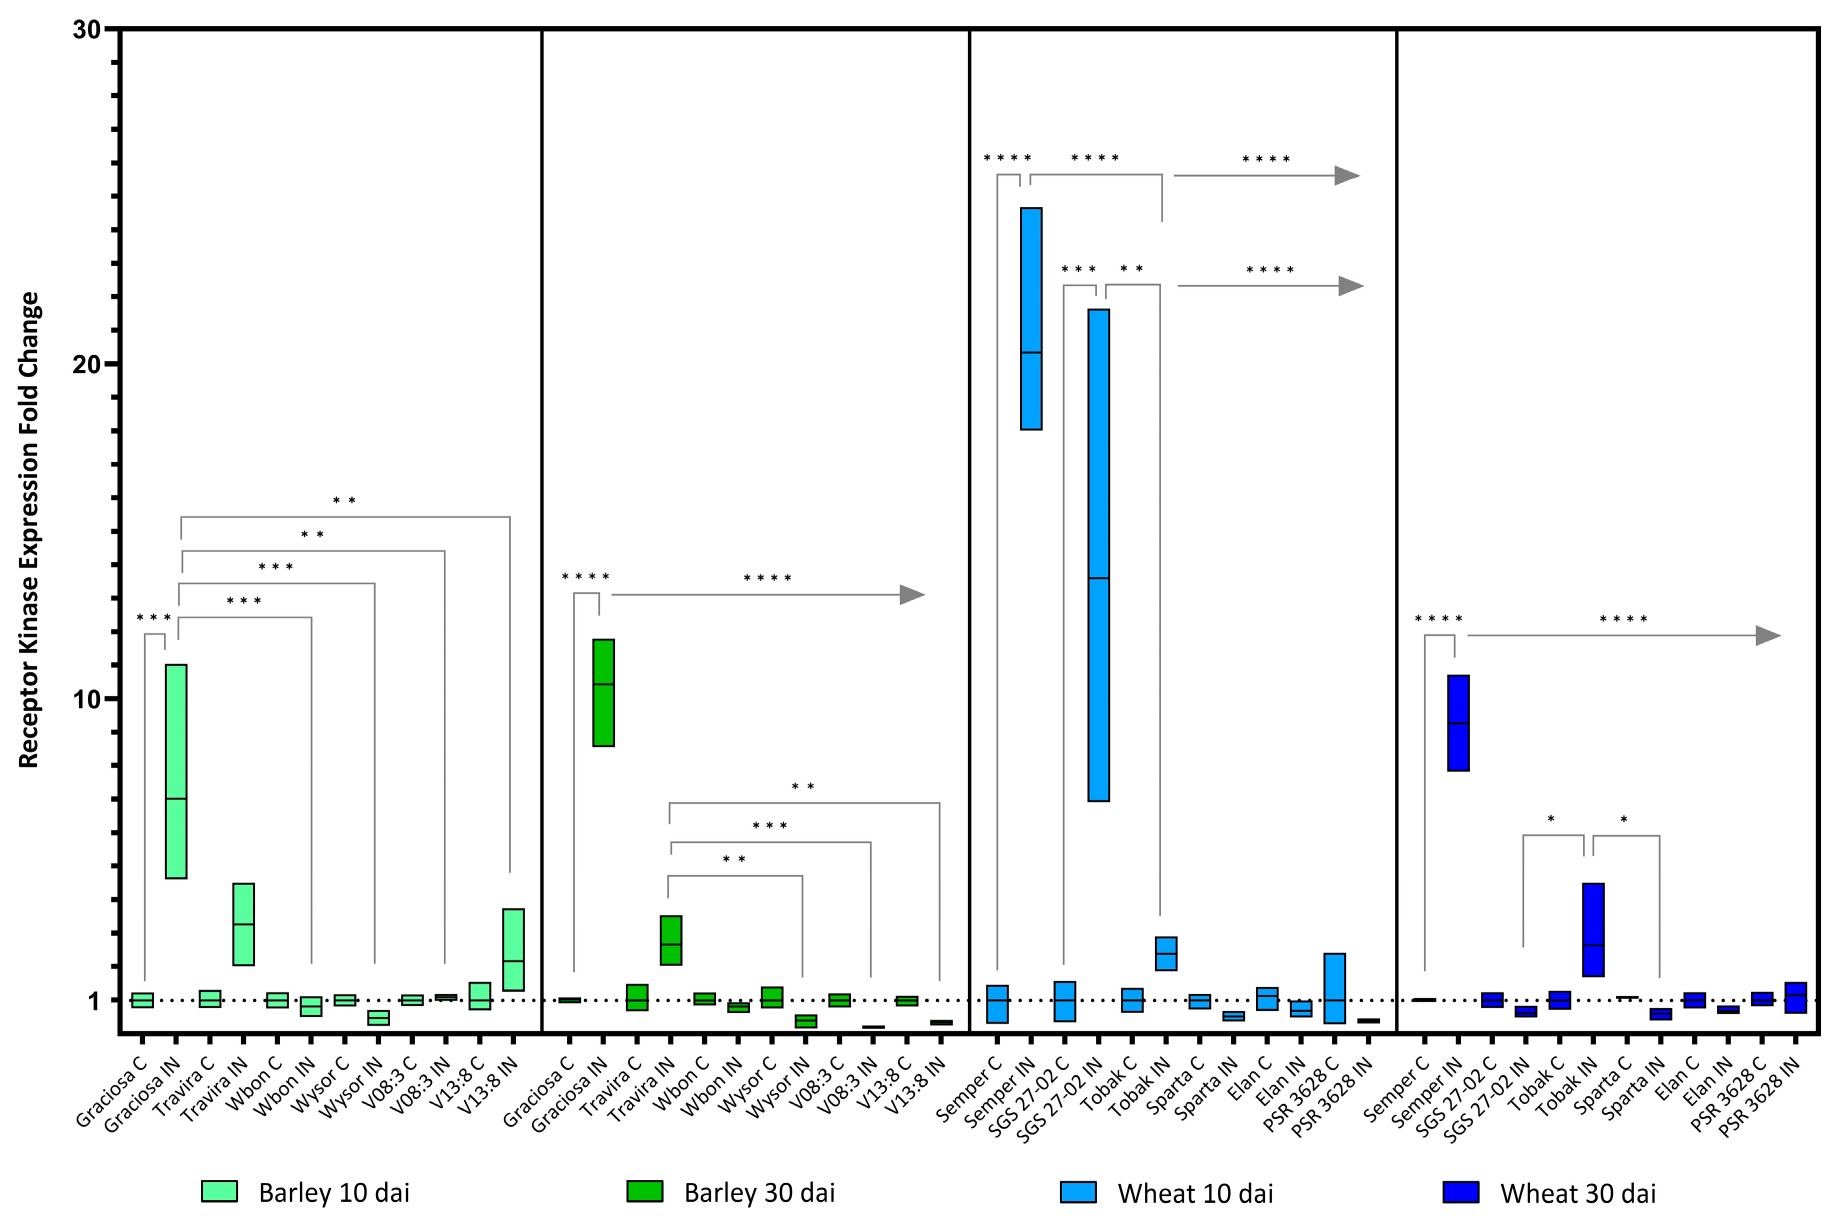
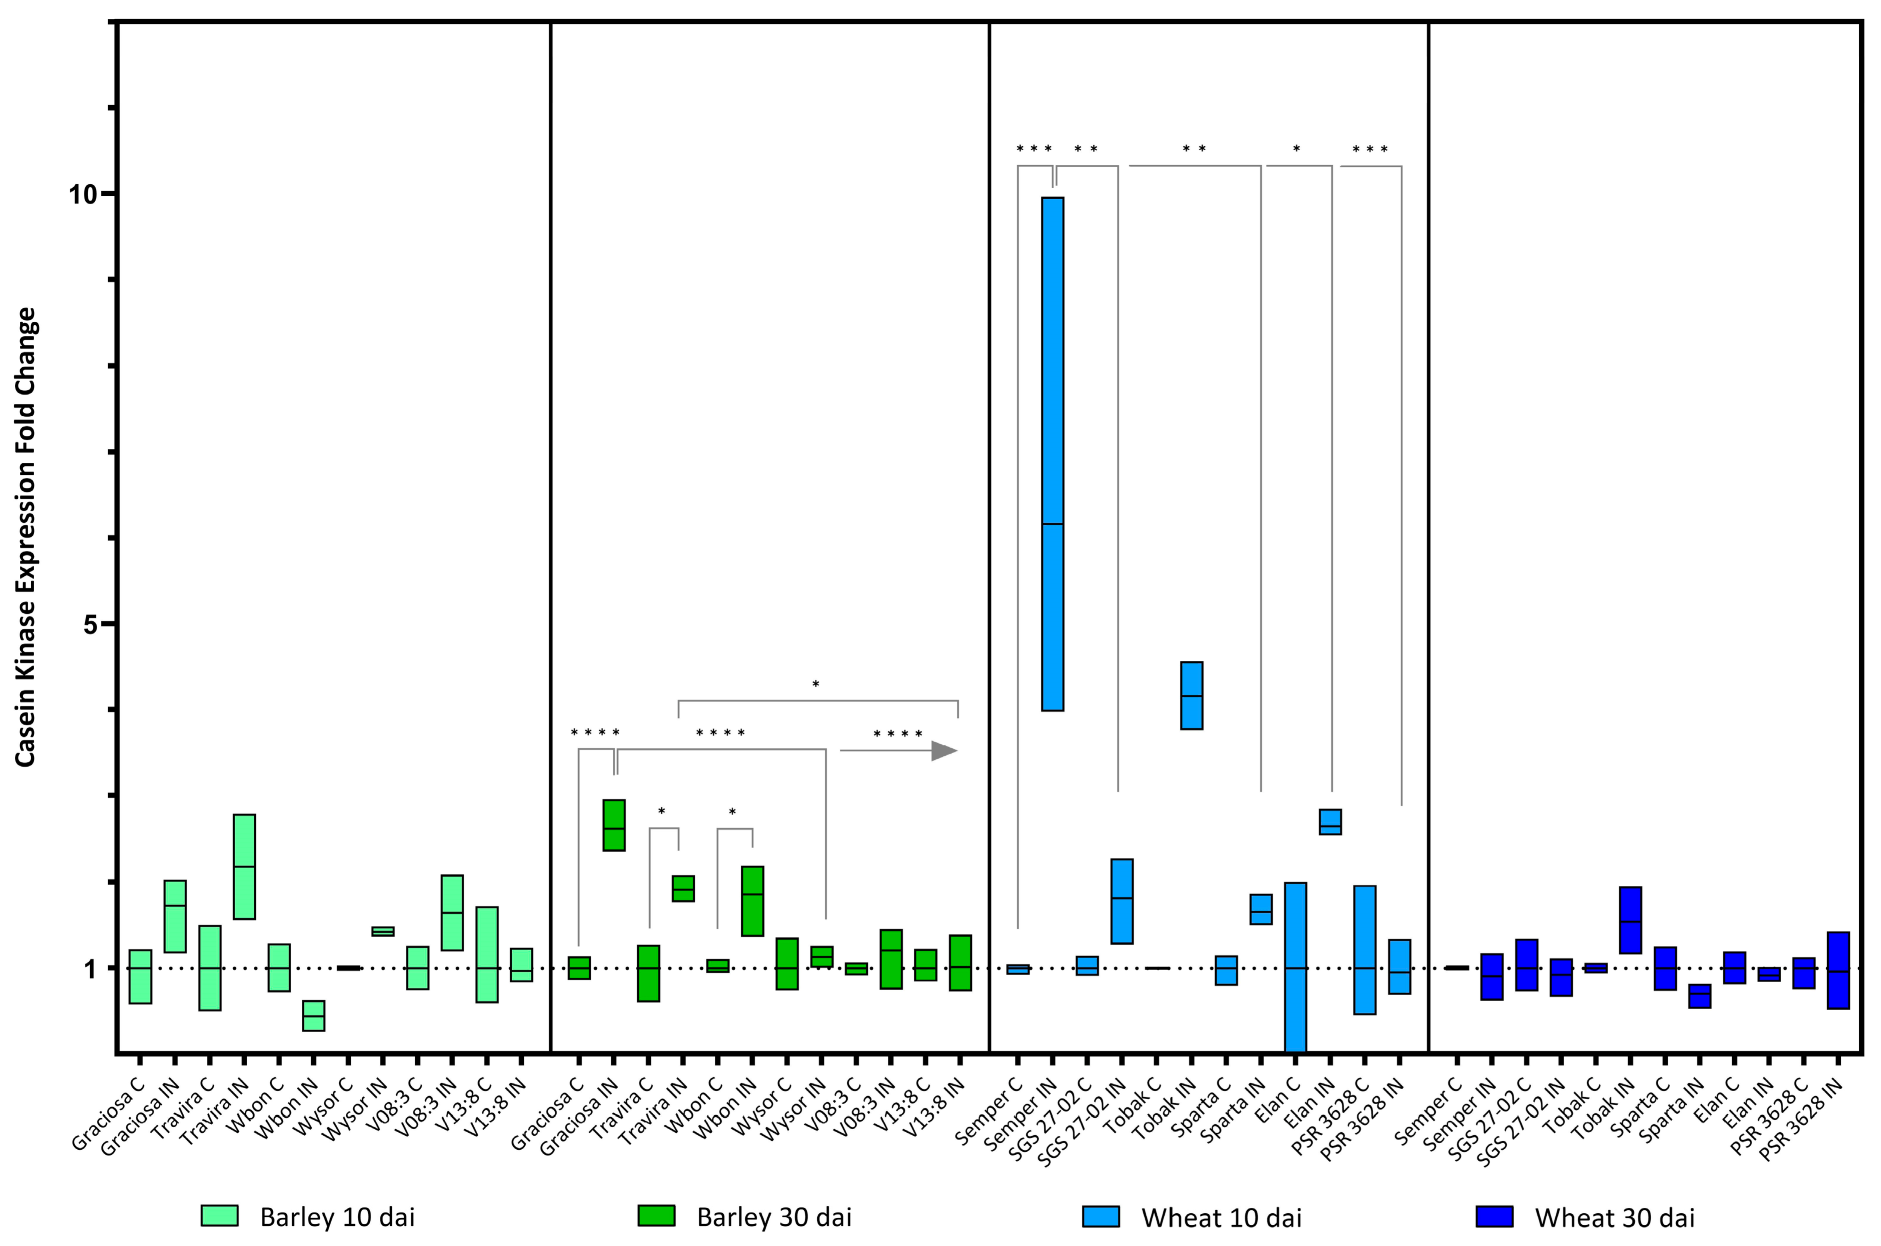
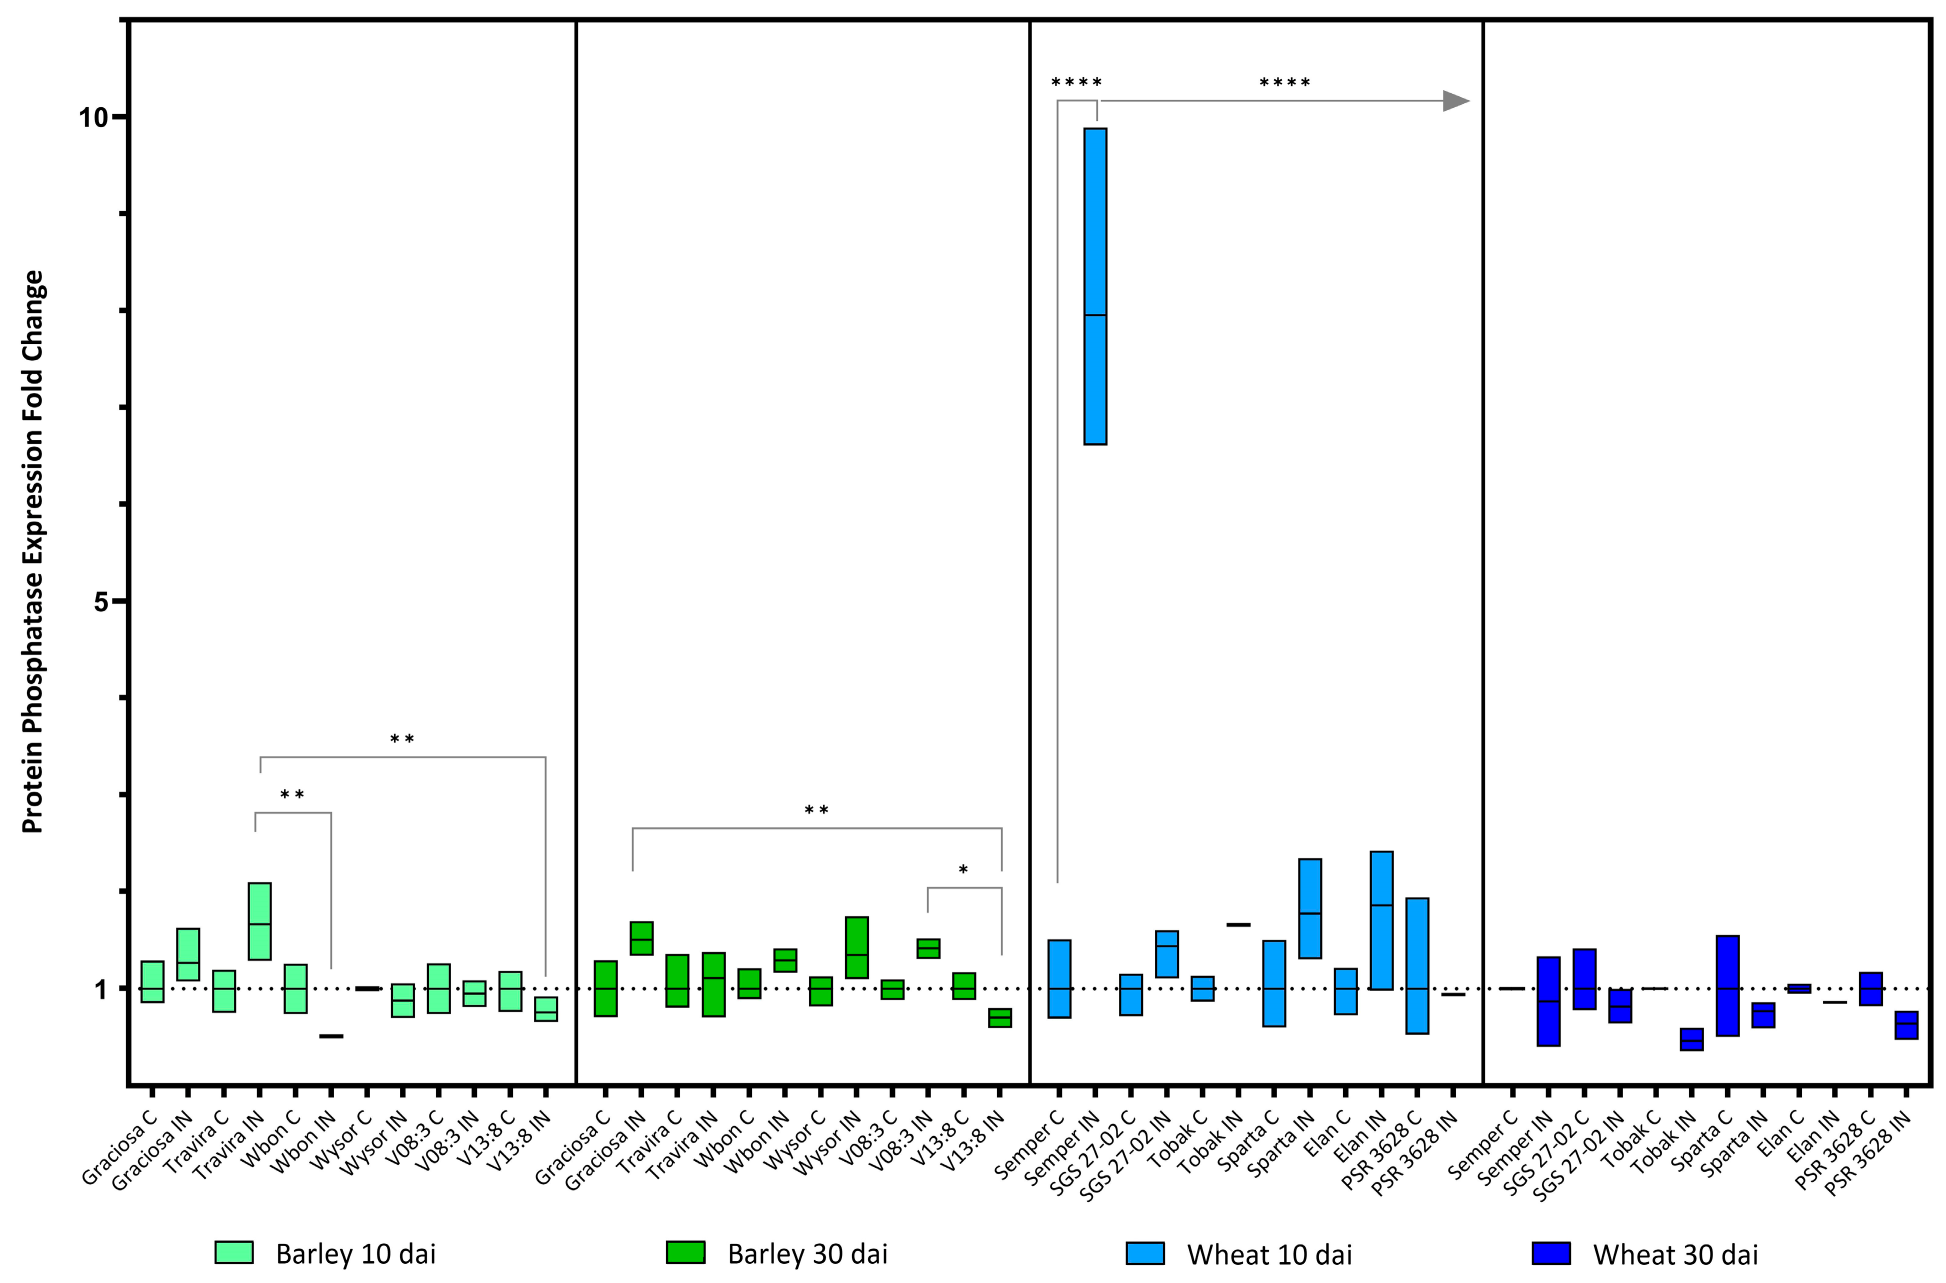
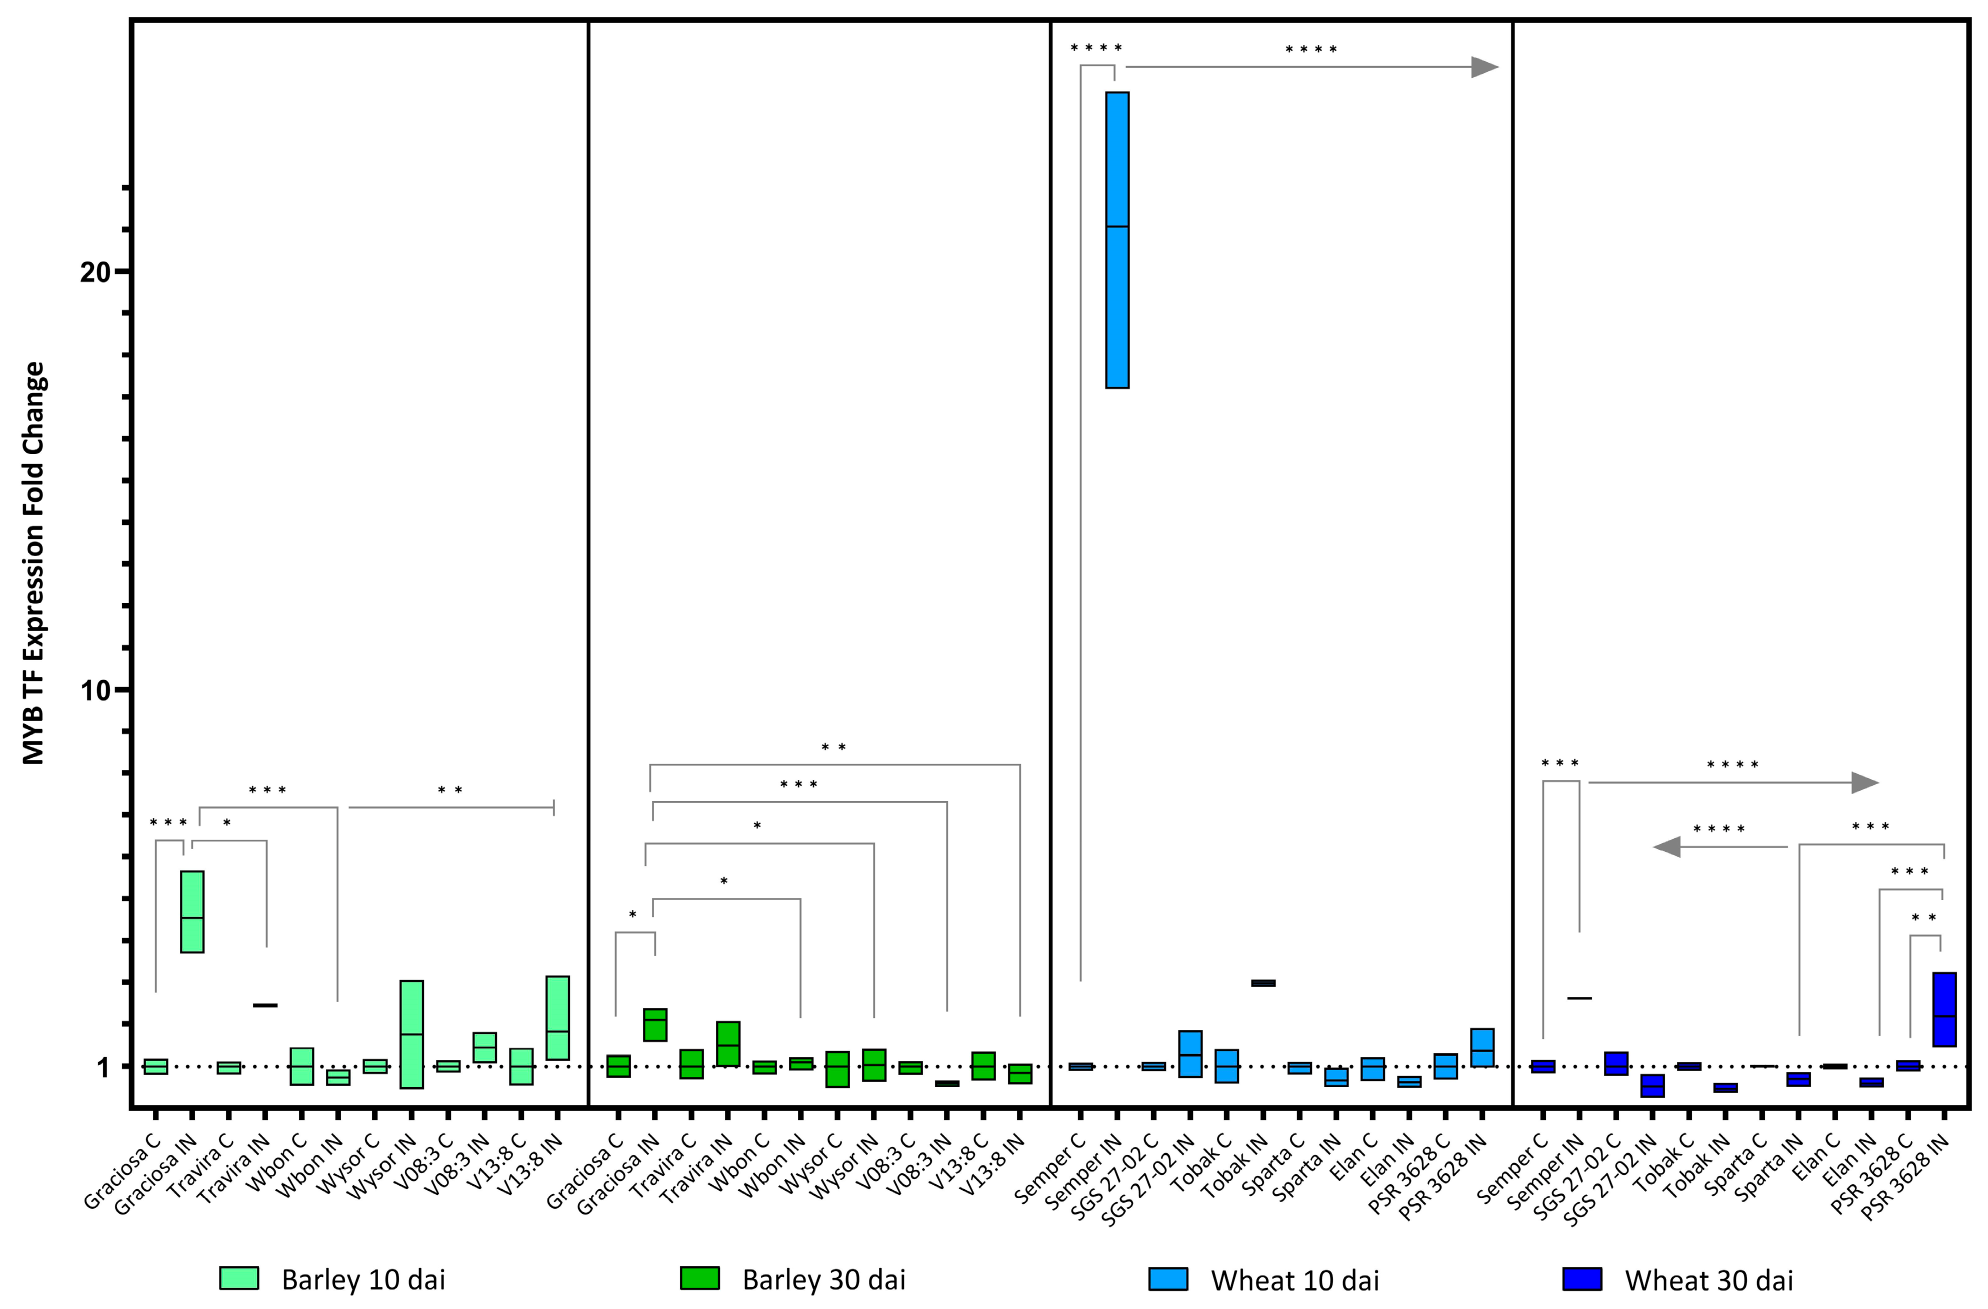
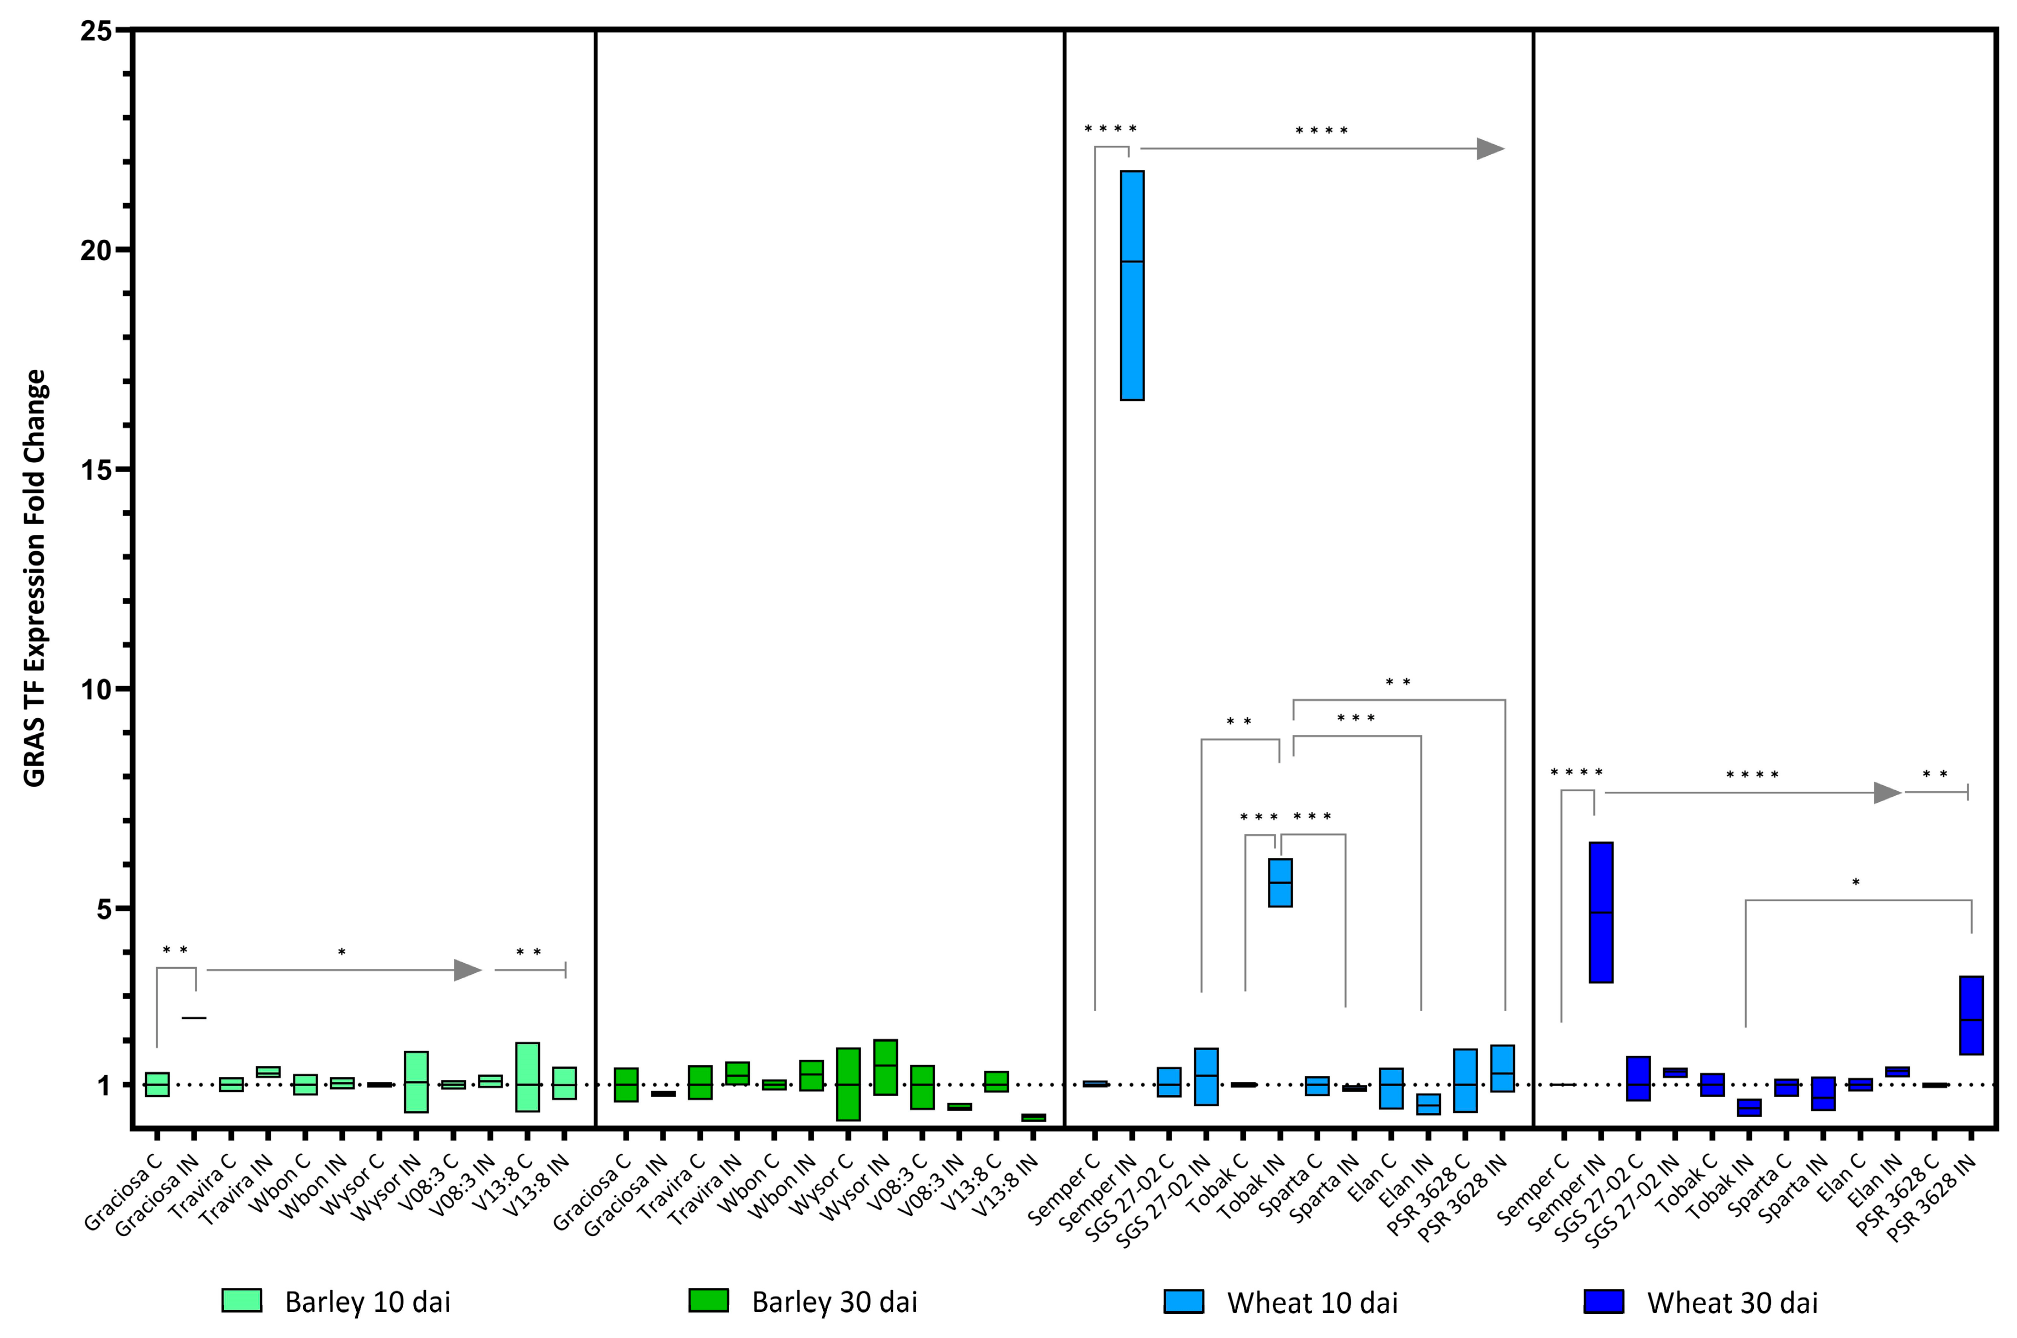
Table 1.
Gene expression in highly resistant versus highly susceptible genotypes of wheat and barley. The values include mean of the expression fold change (EFC), standard error of mean (SEM) and T-test p values. EFC above 1 shows up-regulation (blue) of the gene relative to the control; values below 1 are indicative of gene down-regulation (green) relative to the control. Yellow highlights p < 0.05.
| Susceptible Wheat Genotype | Resistance Wheat Genotype | Susceptible Barley Genotype | Resistance Barley Genotype | ||||||
|---|---|---|---|---|---|---|---|---|---|
| Target Gene | DAI | Semper Control vs. Infected EFC | PSR 3628 Control vs. Infected EFC | Semper In vs. PSR 3628 In | Graciosa Control vs. Infected EFC | Wysor Control vs. Infected EFC | Graciosa In vs. Wysor In | ||
| NBS-LRR | 10 dai | mean | 31.864 | 1.887 | mean | 3.843 | 0.874 | ||
| SEM | 2.684 | 0.491 | SEM | 0.734 | 0.173 | ||||
| TTEST | 0.0003 | 0.251 | 0.0013 | TTEST | 0.020 | 0.635 | 0.050 | ||
| 30 dai | mean | 30.701 | 0.310 | mean | 3.314 | 1.208 | |||
| SEM | 8.088 | 0.034 | SEM | 0.835 | 0.222 | ||||
| TTEST | 0.016 | 0.043 | 0.0153 | TTEST | 0.050 | 0.450 | 0.0714 | ||
| CC-NBS-LRR | 10 dai | mean | 13.875 | 0.765 | mean | 5.845 | 0.857 | ||
| SEM | 2.846 | 0.213 | SEM | 0.691 | 0.190 | ||||
| TTEST | 0.012 | 0.757 | 0.0508 | TTEST | 0.002 | 0.561 | 0.012 | ||
| 30 dai | mean | 5.949 | 0.443 | mean | 2.857 | 1.439 | |||
| SEM | 0.899 | 0.030 | SEM | 0.324 | 0.103 | ||||
| TTEST | 0.005 | 0.013 | 0.0049 | TTEST | 0.007 | 0.044 | 0.0140 | ||
| Receptor-like Kinase | 10 dai | mean | 20.345 | 0.396 | mean | 7.021 | 0.472 | ||
| SEM | 2.165 | 0.042 | SEM | 2.019 | 0.129 | ||||
| TTEST | 0.001 | 0.044 | 0.0008 | TTEST | 0.041 | 0.050 | 0.087 | ||
| 30 dai | mean | 9.030 | 1.152 | mean | 10.429 | 0.402 | |||
| SEM | 0.868 | 0.282 | SEM | 0.964 | 0.122 | ||||
| TTEST | 0.001 | 0.650 | 0.0006 | TTEST | 0.0006 | 0.038 | 0.0005 | ||
| Casein Kinase | 10 dai | mean | 6.161 | 0.949 | mean | 1.723 | 1.158 | ||
| SEM | 1.907 | 0.196 | SEM | 0.277 | 0.269 | ||||
| TTEST | 0.054 | 0.927 | 0.0776 | TTEST | 0.106 | 0.589 | 0.676 | ||
| 30 dai | mean | 0.905 | 0.962 | mean | 2.621 | 1.129 | |||
| SEM | 0.158 | 0.262 | SEM | 0.179 | 0.072 | ||||
| TTEST | 0.550 | 0.901 | 0.3249 | TTEST | 0.001 | 0.546 | 0.0015 | ||
| Protein Phosphatase | 10 dai | mean | 7.951 | 0.941 | mean | 1.268 | 0.877 | ||
| SEM | 0.992 | 0.001 | SEM | 0.180 | 0.177 | ||||
| TTEST | 0.002 | 0.906 | 0.0040 | TTEST | 0.309 | 0.424 | 0.239 | ||
| 30 dai | mean | 0.868 | 0.639 | mean | 1.504 | 1.348 | |||
| SEM | 0.467 | 0.088 | SEM | 0.103 | 0.201 | ||||
| TTEST | 0.729 | 0.055 | 0.8054 | TTEST | 0.063 | 0.191 | 0.5278 | ||
| Protein Kinase | 10 dai | mean | 0.397 | 1.012 | mean | 2.769 | 1.027 | ||
| SEM | 0.063 | 0.056 | SEM | 0.124 | 0.685 | ||||
| TTEST | 0.003 | 0.978 | 0.0354 | TTEST | 0.002 | 0.962 | 0.047 | ||
| 30 dai | mean | 0.326 | 0.484 | mean | 1.775 | 1.524 | |||
| SEM | 0.045 | 0.027 | SEM | 0.212 | 0.148 | ||||
| TTEST | 0.0001 | 0.025 | 0.0085 | TTEST | 0.026 | 0.168 | 0.3862 | ||
| MYB TF | 10 dai | mean | 21.074 | 1.361 | mean | 4.540 | 0.549 | ||
| SEM | 2.078 | 0.282 | SEM | 0.592 | 0.041 | ||||
| TTEST | 0.001 | 0.338 | 0.0006 | TTEST | 0.004 | 0.066 | 0.110 | ||
| 30 dai | mean | 2.617 | 2.195 | mean | 2.106 | 1.038 | |||
| SEM | 0.035 | 0.539 | SEM | 0.261 | 0.222 | ||||
| TTEST | 0.001 | 0.093 | 0.0007 | TTEST | 0.022 | 0.917 | 0.0355 | ||
| GRAS TF | 10 dai | mean | 19.726 | 1.258 | mean | 2.510 | 1.062 | ||
| SEM | 1.612 | 0.333 | SEM | 0.013 | 0.710 | ||||
| TTEST | 0.0003 | 0.663 | 0.0003 | TTEST | 0.001 | 0.914 | 0.072 | ||
| 30 dai | mean | 4.910 | 2.463 | mean | 0.786 | 1.437 | |||
| SEM | 1.614 | 0.530 | SEM | 0.039 | 0.371 | ||||
| TTEST | 0.047 | 0.051 | 0.0430 | TTEST | 0.408 | 0.514 | 0.1557 | ||
| MADS TF | 10 dai | mean | 7.112 | 0.844 | mean | 4.540 | 1.764 | ||
| SEM | 4.337 | 0.046 | SEM | 0.592 | 1.296 | ||||
| TTEST | 0.233 | 0.702 | 0.2169 | TTEST | 0.888 | 0.490 | 0.524 | ||
| 30 dai | mean | 1.674 | 2.064 | mean | 0.569 | 0.658 | |||
| SEM | 0.617 | 0.735 | SEM | 0.047 | 0.169 | ||||
| TTEST | 0.244 | 0.221 | 0.3046 | TTEST | 0.157 | 0.629 | 0.6372 | ||
Disclaimer/Publisher’s Note: The statements, opinions and data contained in all publications are solely those of the individual author(s) and contributor(s) and not of MDPI and/or the editor(s). MDPI and/or the editor(s) disclaim responsibility for any injury to people or property resulting from any ideas, methods, instructions or products referred to in the content. |
© 2023 by the authors. Licensee MDPI, Basel, Switzerland. This article is an open access article distributed under the terms and conditions of the Creative Commons Attribution (CC BY) license (https://creativecommons.org/licenses/by/4.0/).
Share and Cite
MDPI and ACS Style
Alquicer, G.; Ibrahim, E.; Maruthi, M.N.; Kundu, J.K. Identifying Putative Resistance Genes for Barley Yellow Dwarf Virus-PAV in Wheat and Barley. Viruses 2023, 15, 716. https://doi.org/10.3390/v15030716
AMA Style
Alquicer G, Ibrahim E, Maruthi MN, Kundu JK. Identifying Putative Resistance Genes for Barley Yellow Dwarf Virus-PAV in Wheat and Barley. Viruses. 2023; 15(3):716. https://doi.org/10.3390/v15030716
Chicago/Turabian StyleAlquicer, Glenda, Emad Ibrahim, Midatharahally N. Maruthi, and Jiban Kumar Kundu. 2023. "Identifying Putative Resistance Genes for Barley Yellow Dwarf Virus-PAV in Wheat and Barley" Viruses 15, no. 3: 716. https://doi.org/10.3390/v15030716
Note that from the first issue of 2016, this journal uses article numbers instead of page numbers. See further details here.