
Regional Association between Mean Air Temperature and Case Numbers of Multiple SARS-CoV-2 Lineages throughout the Pandemic


Abstract
:1. Introduction
2. Materials and Methods
3. Results
4. Discussion
5. Conclusions
Author Contributions
Funding
Institutional Review Board Statement
Informed Consent Statement
Data Availability Statement
Conflicts of Interest
References
- Sampath, S.; Khedr, A.; Qamar, S.; Tekin, A.; Singh, R.; Green, R.; Kashyap, R. Pandemics Throughout the History. Cureus 2021, 13, e18136. [Google Scholar] [CrossRef] [PubMed]
- Shi, Q.; Dorling, D.; Cao, G.; Liu, T. Changes in population movement make COVID-19 spread differently from SARS. Soc. Sci. Med. 2020, 255, 113036. [Google Scholar] [CrossRef] [PubMed]
- Lembo, R.; Landoni, G.; Cianfanelli, L.; Frontera, A. Air pollutants and SARS-CoV-2 in 33 European countries. Acta Biomed. 2021, 92, e2021166. [Google Scholar] [CrossRef] [PubMed]
- Martins-Filho, P.R. Relationship between population density and COVID-19 incidence and mortality estimates: A county-level analysis. J. Infect. Public Health 2021, 14, 1087–1088. [Google Scholar] [CrossRef] [PubMed]
- Wu, Z.; Harrich, D.; Li, Z.; Hu, D.; Li, D. The unique features of SARS-CoV-2 transmission: Comparison with SARS-CoV, MERS-CoV and 2009 H1N1 pandemic influenza virus. Rev. Med. Virol. 2021, 31, e2171. [Google Scholar] [CrossRef]
- Delgado, J.M.; Duro, N.; Rogers, D.M.; Tkatchenko, A.; Pandit, S.A.; Varma, S. Molecular basis for higher affinity of SARS-CoV-2 spike RBD for human ACE2 receptor. Proteins 2021, 89, 1134–1144. [Google Scholar] [CrossRef]
- Gandhi, M.; Yokoe, D.S.; Havlir, D.V. Asymptomatic Transmission, the Achilles’ Heel of Current Strategies to Control Covid-19. N. Engl. J. Med. 2020, 382, 2158–2160. [Google Scholar] [CrossRef]
- Abdelghany, T.M.; Ganash, M.; Bakri, M.M.; Qanash, H.; Al-Rajhi, A.M.H.; Elhussieny, N.I. SARS-CoV-2, the other face to SARS-CoV and MERS-CoV: Future predictions. Biomed. J. 2021, 44, 86–93. [Google Scholar] [CrossRef]
- Park, S.; Lee, Y.; Michelow, I.C.; Choe, Y.J. Global Seasonality of Human Coronaviruses: A Systematic Review. Open Forum Infect. Dis. 2020, 7, ofaa443. [Google Scholar] [CrossRef]
- Mattiuzzi, C.; Henry, B.M.; Sanchis-Gomar, F.; Lippi, G. Association between climate and new daily diagnoses of COVID-19. J. Hosp. Manag. Health Policy 2021, 5, 6. [Google Scholar] [CrossRef]
- Chien, L.C.; Chen, L.A.; Lin, R.T. Lagged meteorological impacts on COVID-19 incidence among high-risk counties in the United States-a spatiotemporal analysis. J. Expo. Sci. Environ. Epidemiol. 2021, 1, 1–8. [Google Scholar] [CrossRef] [PubMed]
- Han, Y.; Zhao, W.; Pereira, P. Global COVID-19 pandemic trends and their relationship with meteorological variables, air pollutants and socioeconomic aspects. Environ. Res. 2022, 204 Pt C, 112249. [Google Scholar] [CrossRef]
- Guo, L.; Yang, Z.; Zhang, L.; Wang, S.; Bai, T.; Xiang, Y.; Long, E. Systematic review of the effects of environmental factors on virus inactivation: Implications for coronavirus disease 2019. Int. J. Environ. Sci. Technol. 2021, 18, 2865–2878. [Google Scholar] [CrossRef] [PubMed]
- Nicastro, F.; Sironi, G.; Antonello, E.; Bianco, A.; Biasin, M.; Brucato, J.R.; Ermolli, I.; Pareschi, G.; Salvati, M.; Tozzi, P.; et al. Solar UV-B/A radiation is highly effective in inactivating SARS-CoV-2. Sci. Rep. 2021, 11, 14805. [Google Scholar] [CrossRef] [PubMed]
- Ulloa, S.; Bravo, C.; Ramirez, E.; Fasce, R.; Fernandez, J. Inactivation of SARS-CoV-2 isolates from lineages B.1.1.7 (Alpha), P.1 (Gamma) and B.1.110 by heating and UV irradiation. J. Virol. Methods 2021, 295, 114216. [Google Scholar] [CrossRef] [PubMed]
- Kupferschmidt, K. As Omicron rages on, virus’ path remains unpredictable. Science 2022, 377, 352–353. [Google Scholar] [CrossRef]
- Wikipedia. 2022 European Heat Waves. Available online: https://en.wikipedia.org/wiki/2022_European_heat_waves (accessed on 1 August 2022).
- Regione del Veneto. Nuovo Coronavirus. Available online: https://www.regione.veneto.it/web/sanita/nuovo-coronavirus (accessed on 1 August 2022).
- Agenzia Regionale per la Prevenzione e Protezione Ambientale del Veneto. Available online: https://www.arpa.veneto.it/previsioni/it/html/index.php (accessed on 1 August 2022).
- Istituto Superiore di Sanità. Monitoraggio delle Varianti del Virus SARS-CoV-2 di Interesse in Sanità Pubblica in Italia. Available online: https://www.epicentro.iss.it/coronavirus/sars-cov-2-monitoraggio-varianti-rapporti-periodici (accessed on 1 August 2022).
- Desingu, P.A.; Nagarajan, K. The emergence of Omicron lineages BA.4 and BA.5, and the global spreading trend. J. Med. Virol. 2022. Online ahead of print. [Google Scholar] [CrossRef]
- Hewins, B.; Richardson, C.; Rubino, S.; Kelvin, A.; Toloue Ostadgavahi, A.; Kelvin, D.J. Molecular mechanisms responsible for SARS-CoV-2 antibody waning and vaccine escape in Omicron sublineages BA.4 and BA.5. J. Infect. Dev. Ctries. 2022, 16, 1122–1125. [Google Scholar] [CrossRef]
- Callaway, E. What Omicron’s BA.4 and BA.5 variants mean for the pandemic. Nature 2022, 606, 848–849. [Google Scholar] [CrossRef]
- Lippi, G.; Mattiuzzi, C.; Henry, B.M. Updated picture of SARS-CoV-2 variants and mutations. Diagnosis 2021, 9, 11–17. [Google Scholar] [CrossRef]
- Hirose, R.; Itoh, Y.; Ikegaya, H.; Miyazaki, H.; Watanabe, N.; Yoshida, T.; Bandou, R.; Daidoji, T.; Nakaya, T. Differences in environmental stability among SARS-CoV-2 variants of concern: Both Omicron BA.1 and BA.2 have higher stability. Clin. Microbiol. Infect. 2022. Online ahead of print. [Google Scholar] [CrossRef] [PubMed]
- Chin, A.W.H.; Lai, A.M.Y.; Peiris, M.; Man Poon, L.L. Increased Stability of SARS-CoV-2 Omicron Variant over Ancestral Strain. Emerg. Infect. Dis. 2022, 28, 1515–1517. [Google Scholar] [CrossRef] [PubMed]
- Reicher, S.; Michie, S.; West, R. The UK government’s “personal responsibility” policy for covid is hypocritical and unsustainable. BMJ 2022, 378, o1903. [Google Scholar] [CrossRef]
- Lin, S.; Luo, M.; Walker, R.J.; Liu, X.; Hwang, S.A.; Chinery, R. Extreme high temperatures and hospital admissions for respiratory and cardiovascular diseases. Epidemiology 2009, 20, 738–746. [Google Scholar] [CrossRef]
- Lippi, G.; Mattiuzzi, C.; Henry, B.M. Neutralizing potency of COVID-19 vaccines against the SARS-CoV-2 Omicron (B.1.1.529) variant. J. Med. Virol. 2022, 94, 1799–1802. [Google Scholar] [CrossRef] [PubMed]


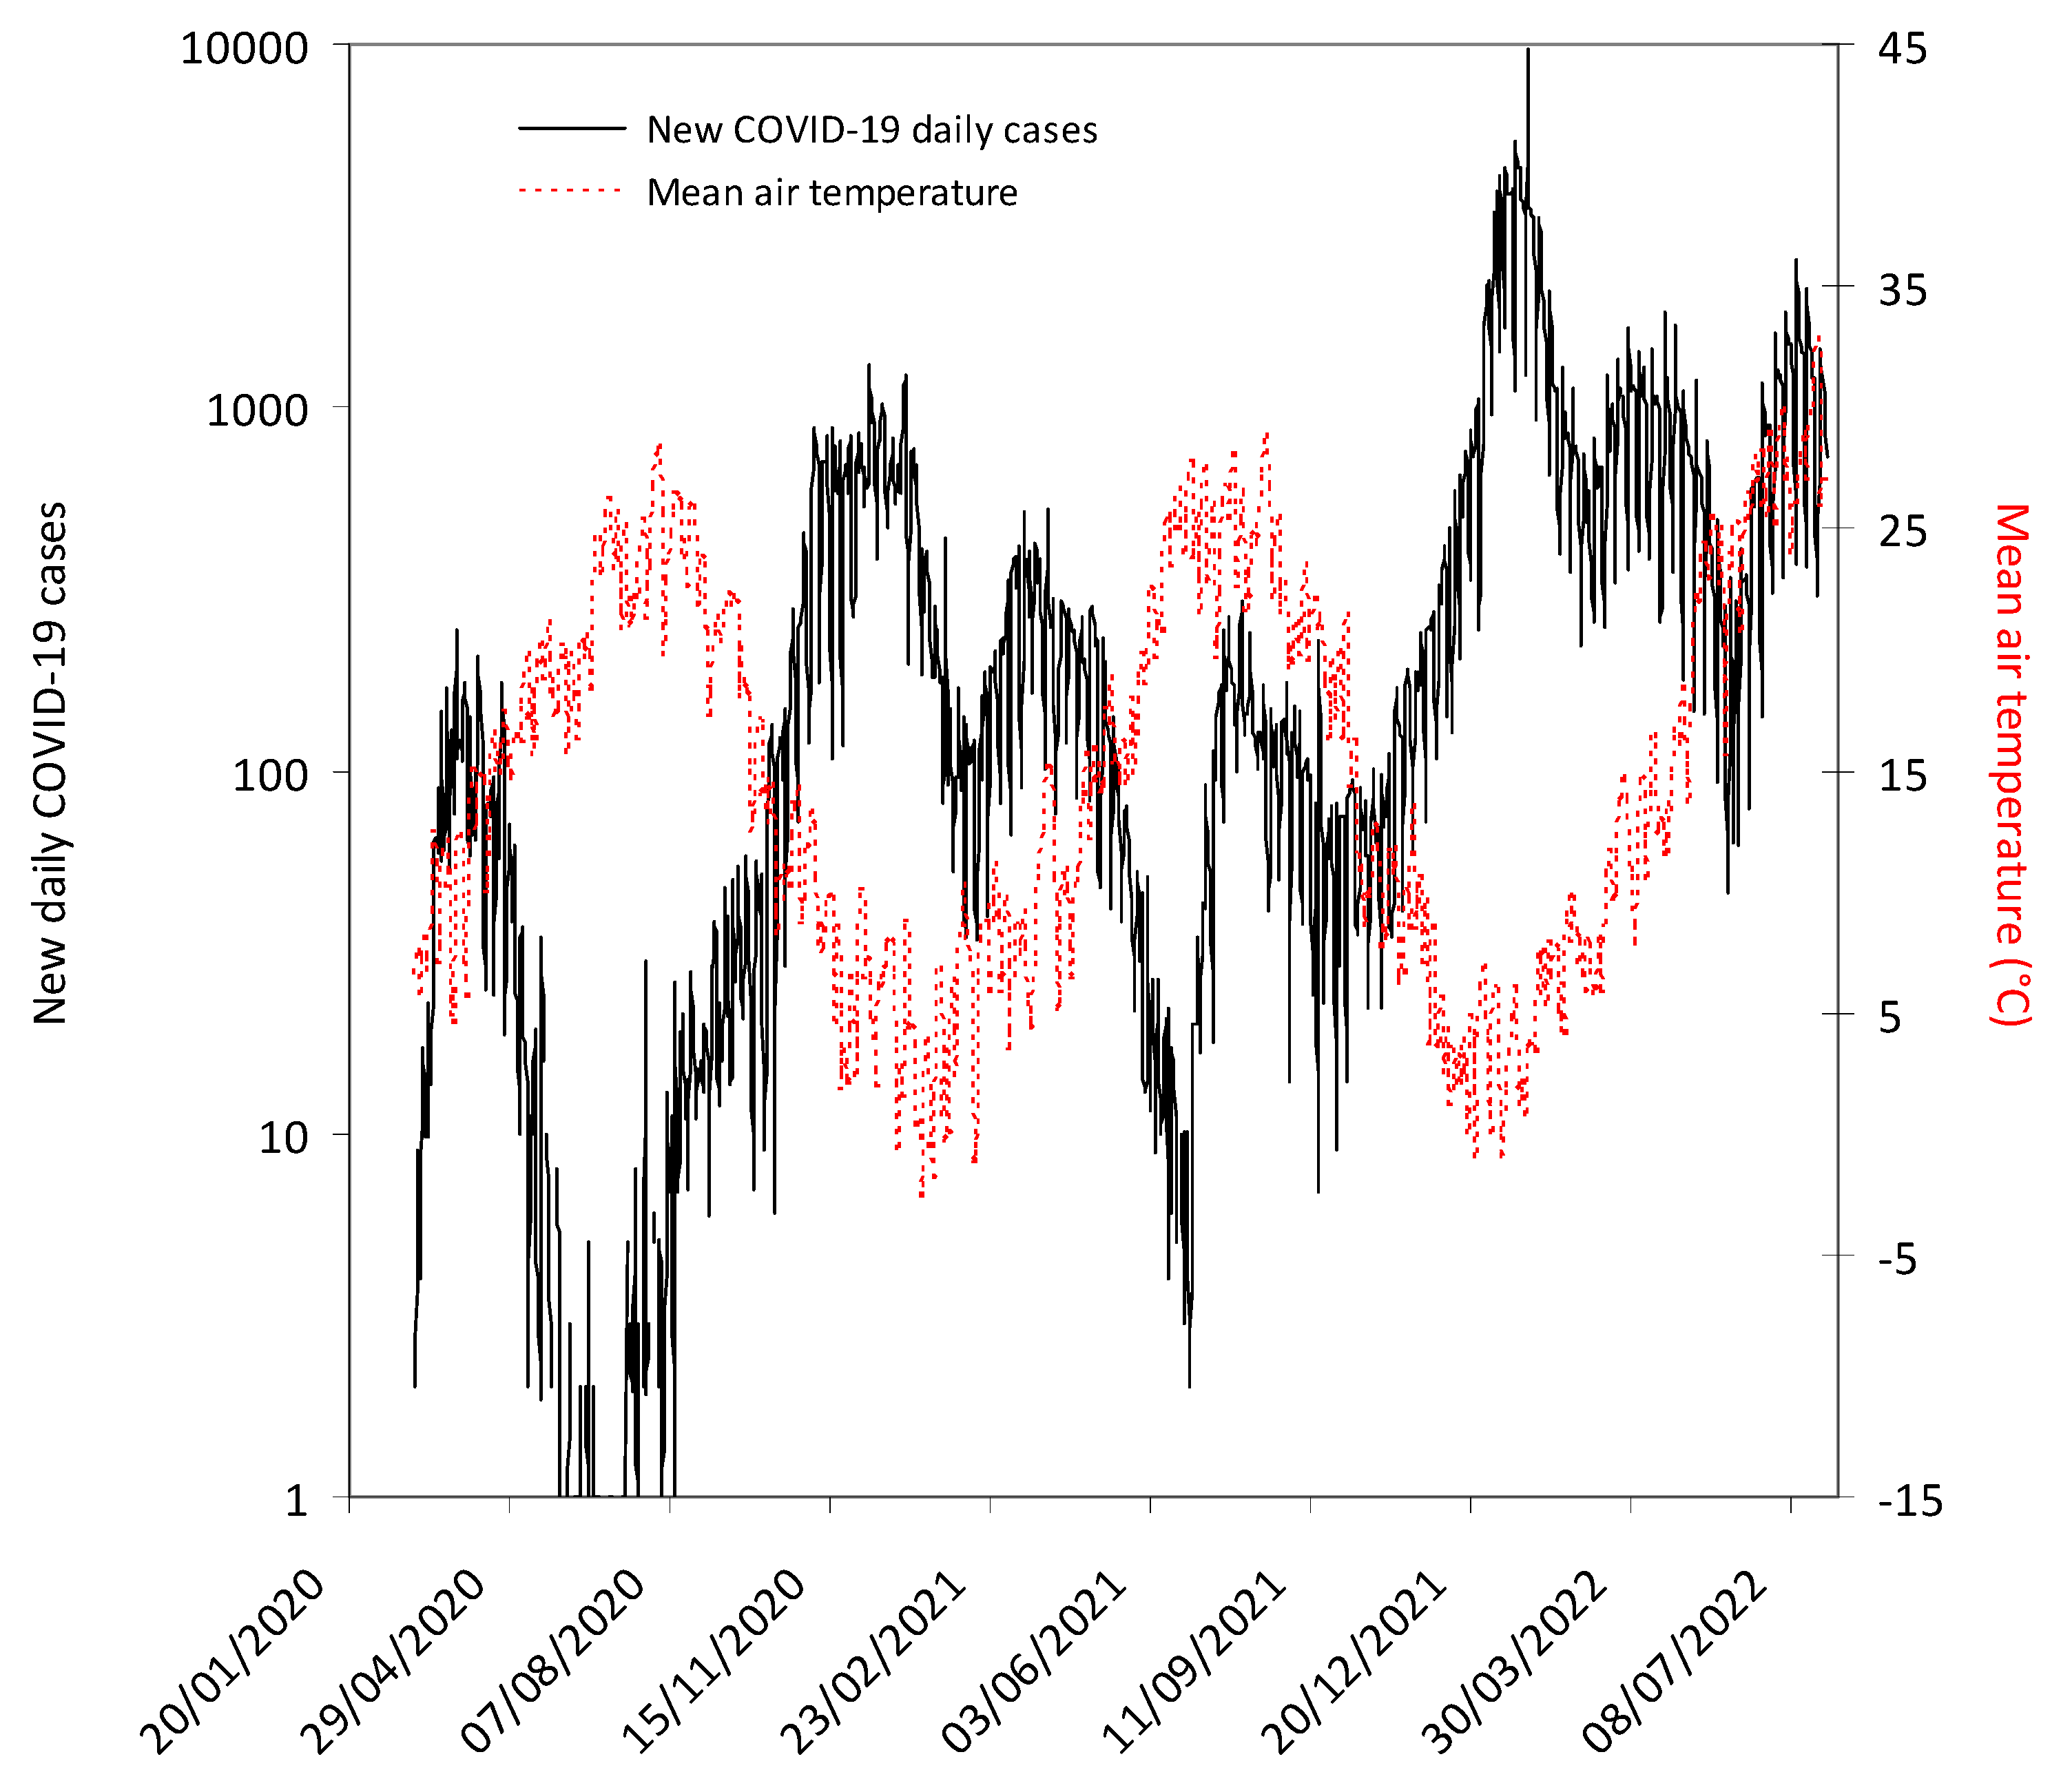
| SARS-CoV-2 Variant | Period | New COVID-19 Daily Cases (IQR) | Mean Air Temperature (IQR) |
|---|---|---|---|
| Ancestral | March 2020–January 2021 | 44 (7–208) | 14.6 (7.5–20.4) °C |
| Alpha | February 2021–June 2021 | 111 (37–228) | 12.4 (7.9–17.5) °C |
| Delta | July 2021–December 2021 | 114 (70–191) | 17.4 (8.4–22.7) °C |
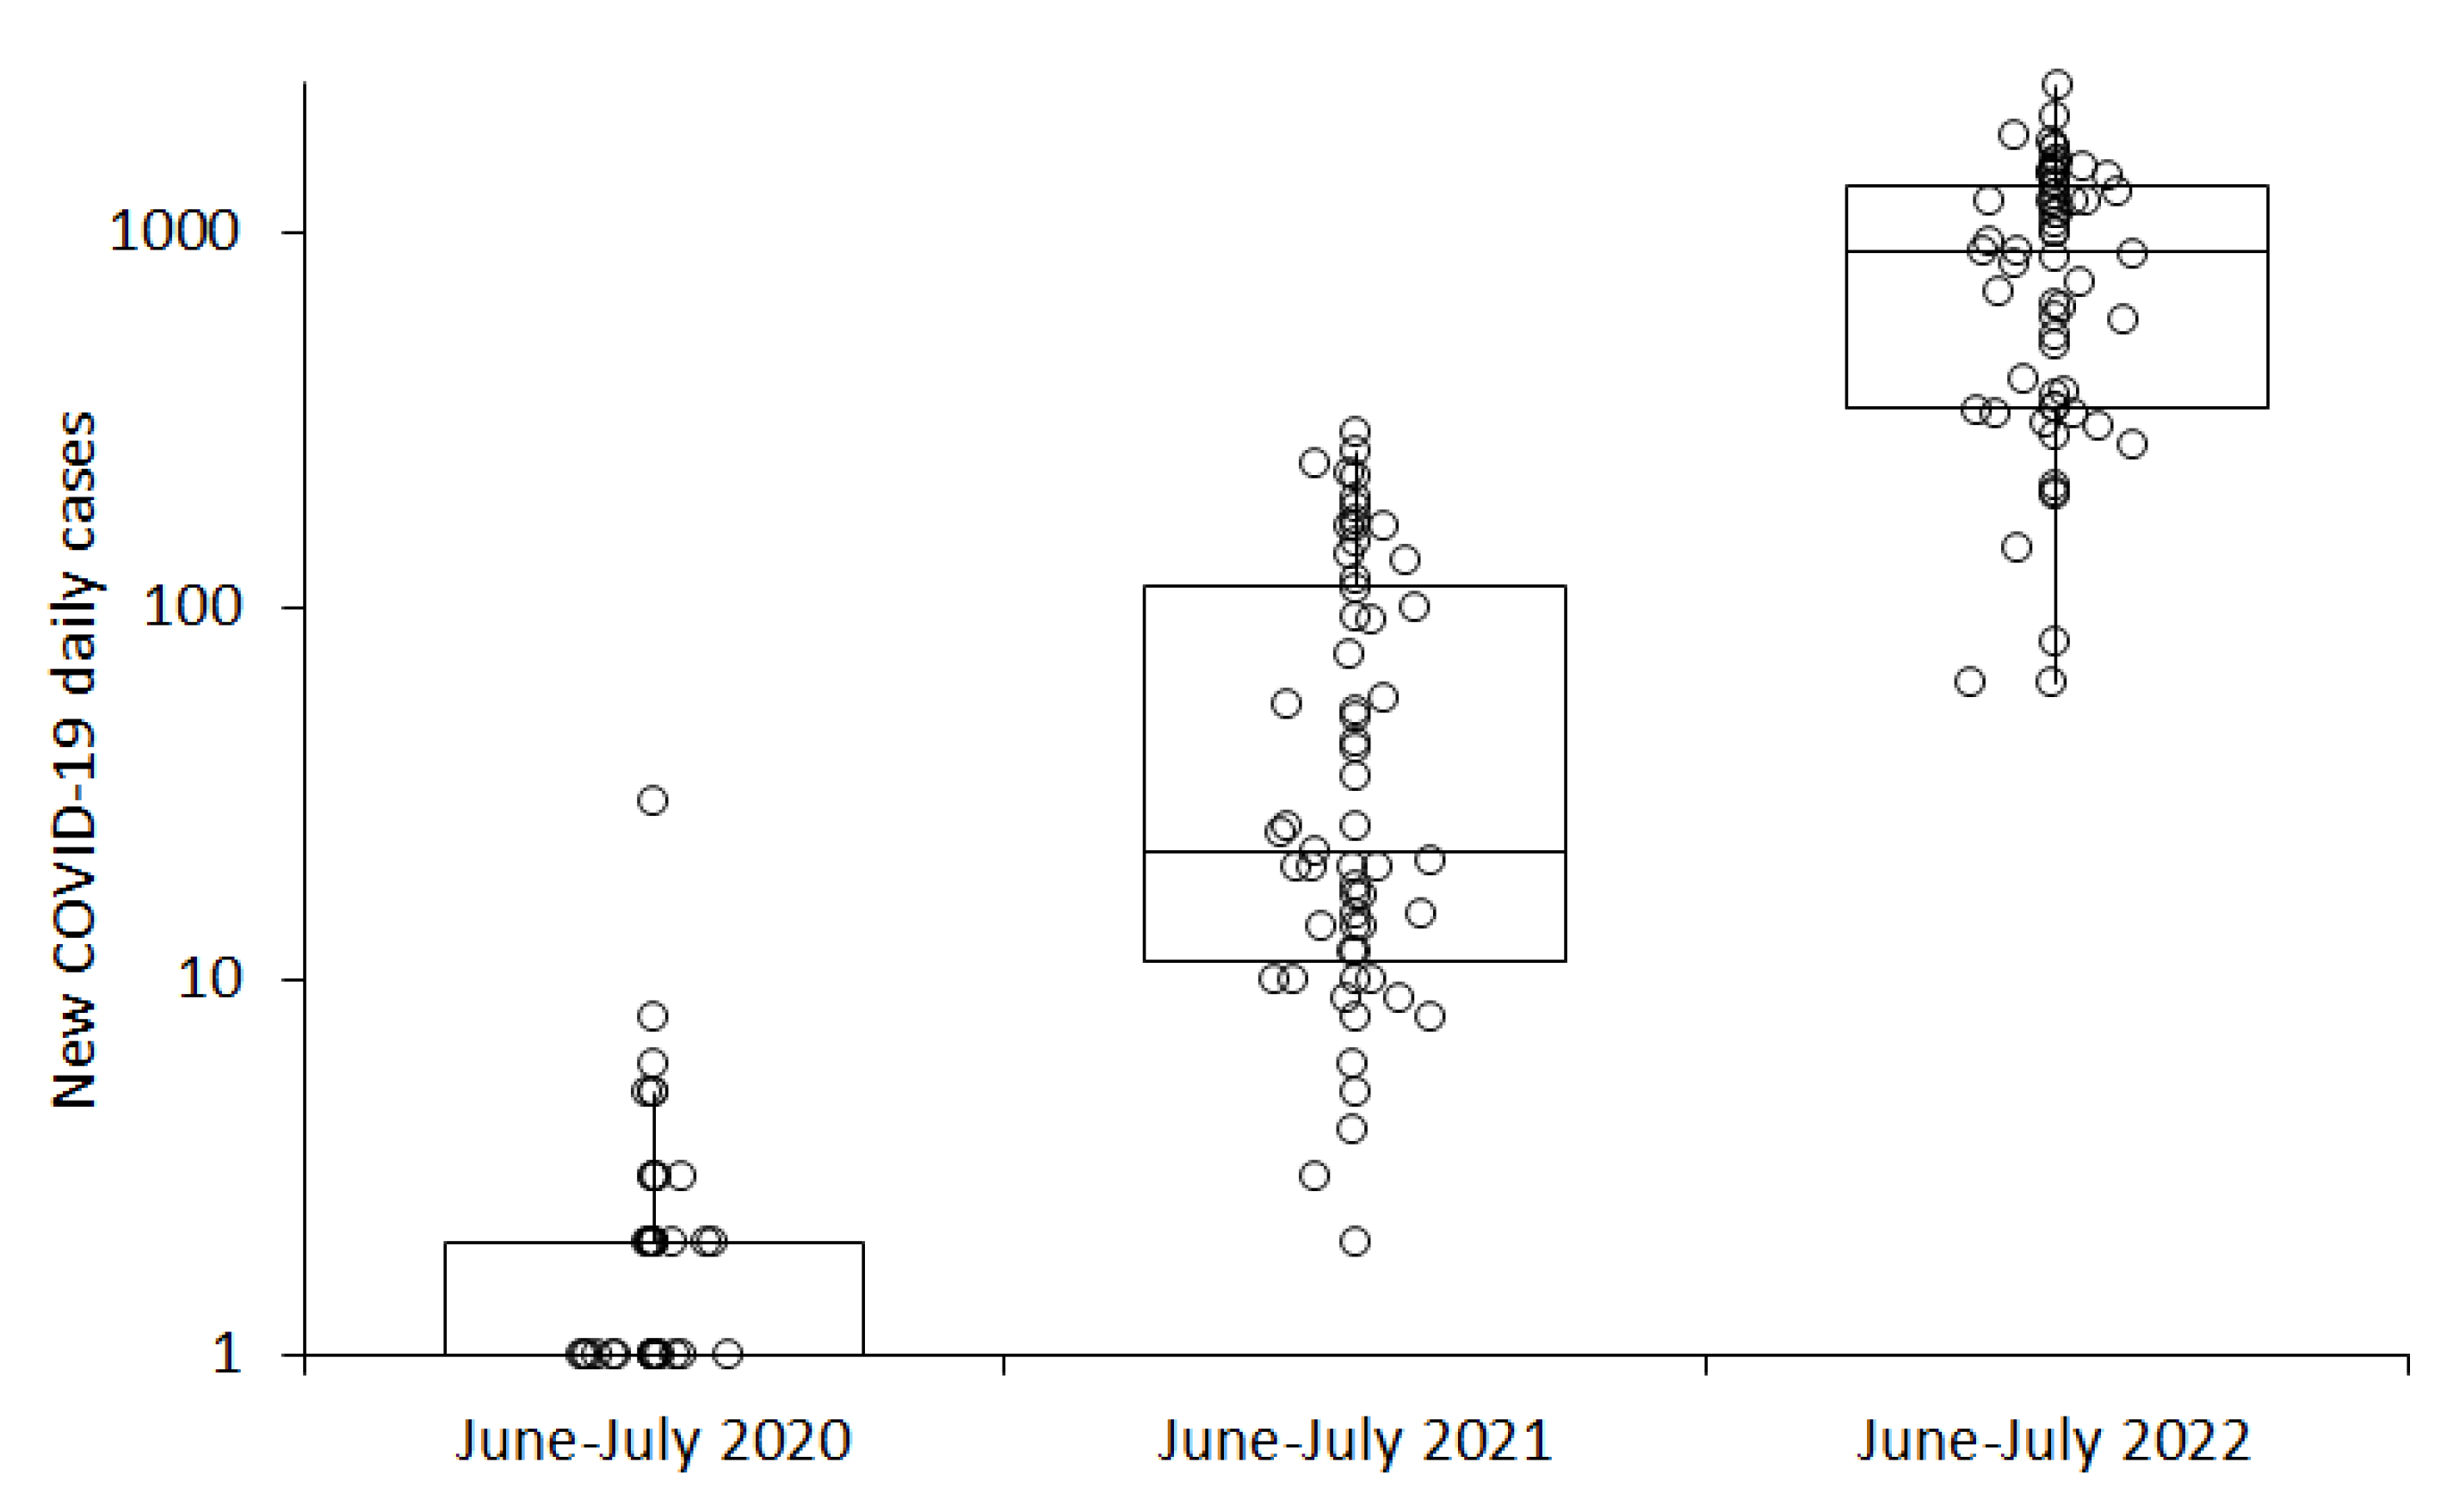
| Omicron BA.1/BA.2 | January 2022–May 2022 | 943 (572–1385) | 9.6 (5.9–14.8) °C |
| Omicron BA.4/BA.5 | June 2022–July 2022 | 890 (343–1345) | 27.0 (25.8–28.0) °C |
| SARS-CoV-2 Variant | Spearman’s Correlation (95% CI) |
|---|---|
| Ancestral | −0.79 (−0.83 to −0.75; p < 0.001) |
| Alpha | −0.63 (−0.72 to −0.52; p < 0.001) |
| Delta | −0.41 (−0.52 to −0.28; p < 0.001) |
| Omicron BA.1/BA.2 | −0.58 (−0.68 to −0.47; p < 0.001) |
| Omicron BA.4/BA.5 | 0.32 (0.08 to 0.53; p = 0.011) |
Publisher’s Note: MDPI stays neutral with regard to jurisdictional claims in published maps and institutional affiliations. |
© 2022 by the authors. Licensee MDPI, Basel, Switzerland. This article is an open access article distributed under the terms and conditions of the Creative Commons Attribution (CC BY) license (https://creativecommons.org/licenses/by/4.0/).
Share and Cite
Mattiuzzi, C.; Henry, B.M.; Lippi, G. Regional Association between Mean Air Temperature and Case Numbers of Multiple SARS-CoV-2 Lineages throughout the Pandemic. Viruses 2022, 14, 1913. https://doi.org/10.3390/v14091913
Mattiuzzi C, Henry BM, Lippi G. Regional Association between Mean Air Temperature and Case Numbers of Multiple SARS-CoV-2 Lineages throughout the Pandemic. Viruses. 2022; 14(9):1913. https://doi.org/10.3390/v14091913
Chicago/Turabian StyleMattiuzzi, Camilla, Brandon M. Henry, and Giuseppe Lippi. 2022. "Regional Association between Mean Air Temperature and Case Numbers of Multiple SARS-CoV-2 Lineages throughout the Pandemic" Viruses 14, no. 9: 1913. https://doi.org/10.3390/v14091913