
Organic Electrochemical Transistors as Versatile Tool for Real-Time and Automatized Viral Cytopathic Effect Evaluation

 , , , , , , , , and
Abstract
:1. Introduction
2. Materials and Methods
2.1. OECT Device Fabrication
2.2. OECT Integrated System and Electrical Characterization Set-Up
2.3. OECT Data Analysis
2.4. Viruses and Cell Lines
2.5. Cell Plating and Infection
2.6. Cell Viability Evaluation
3. Results
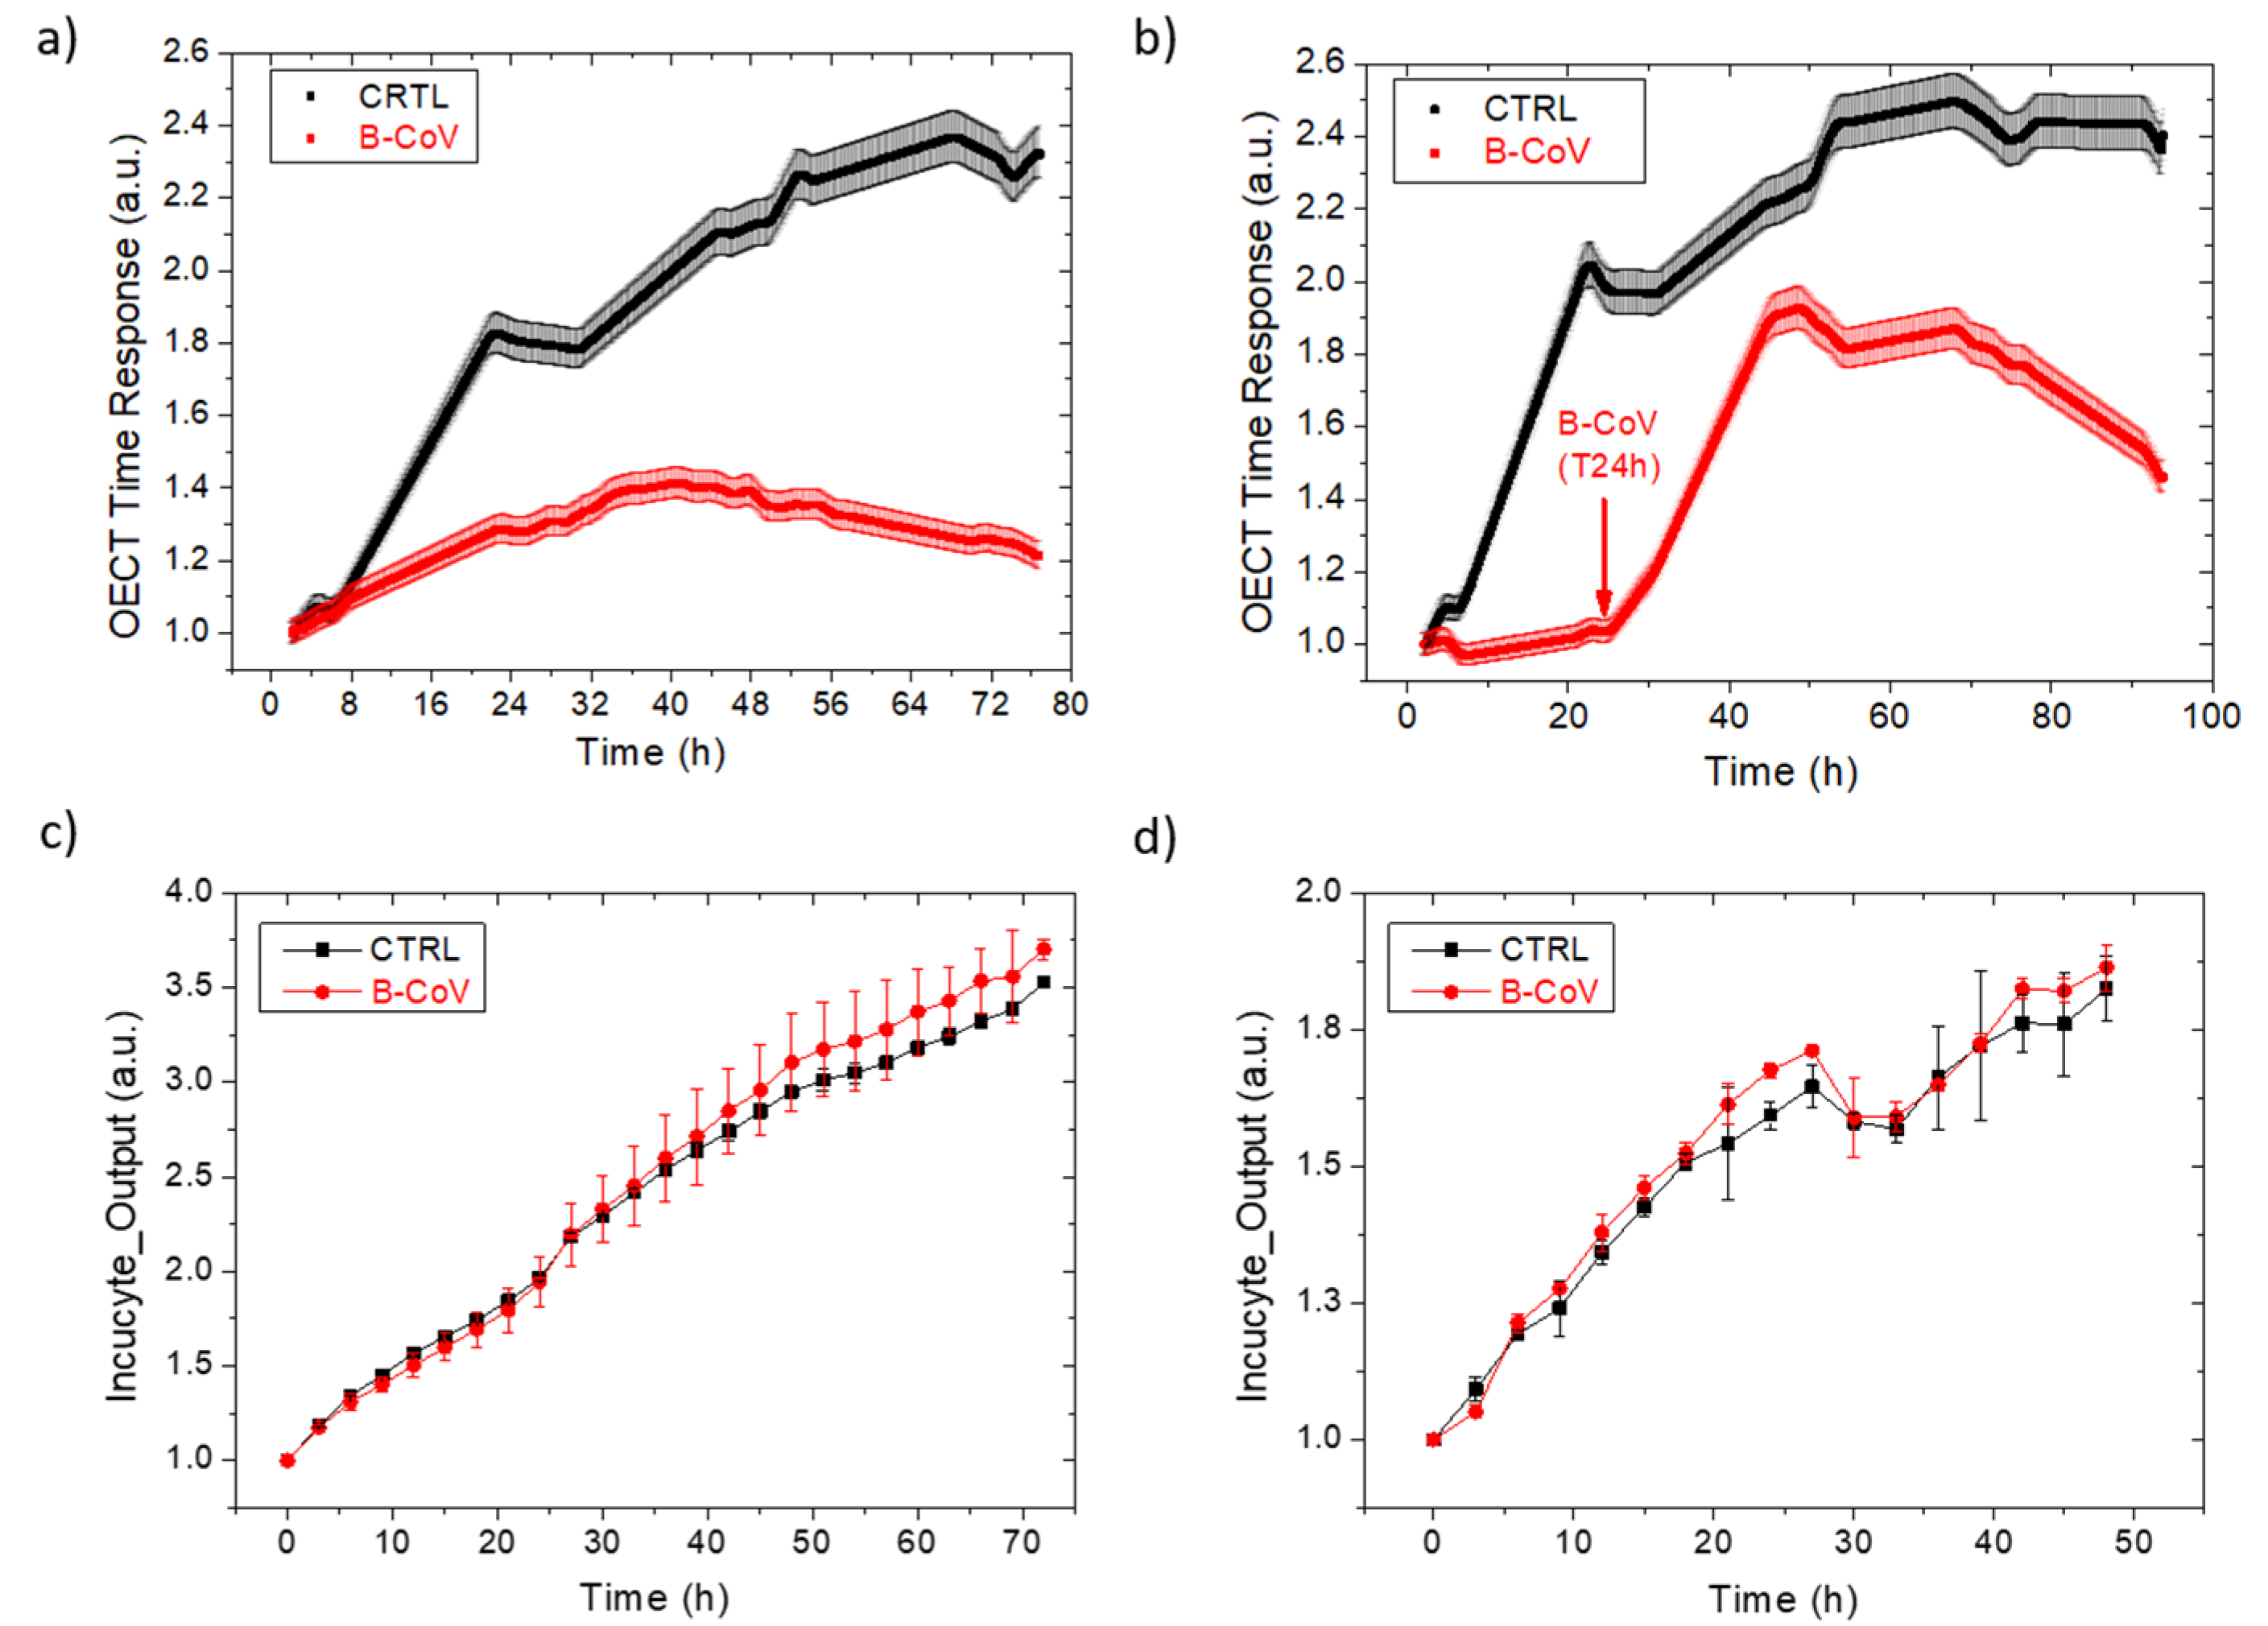
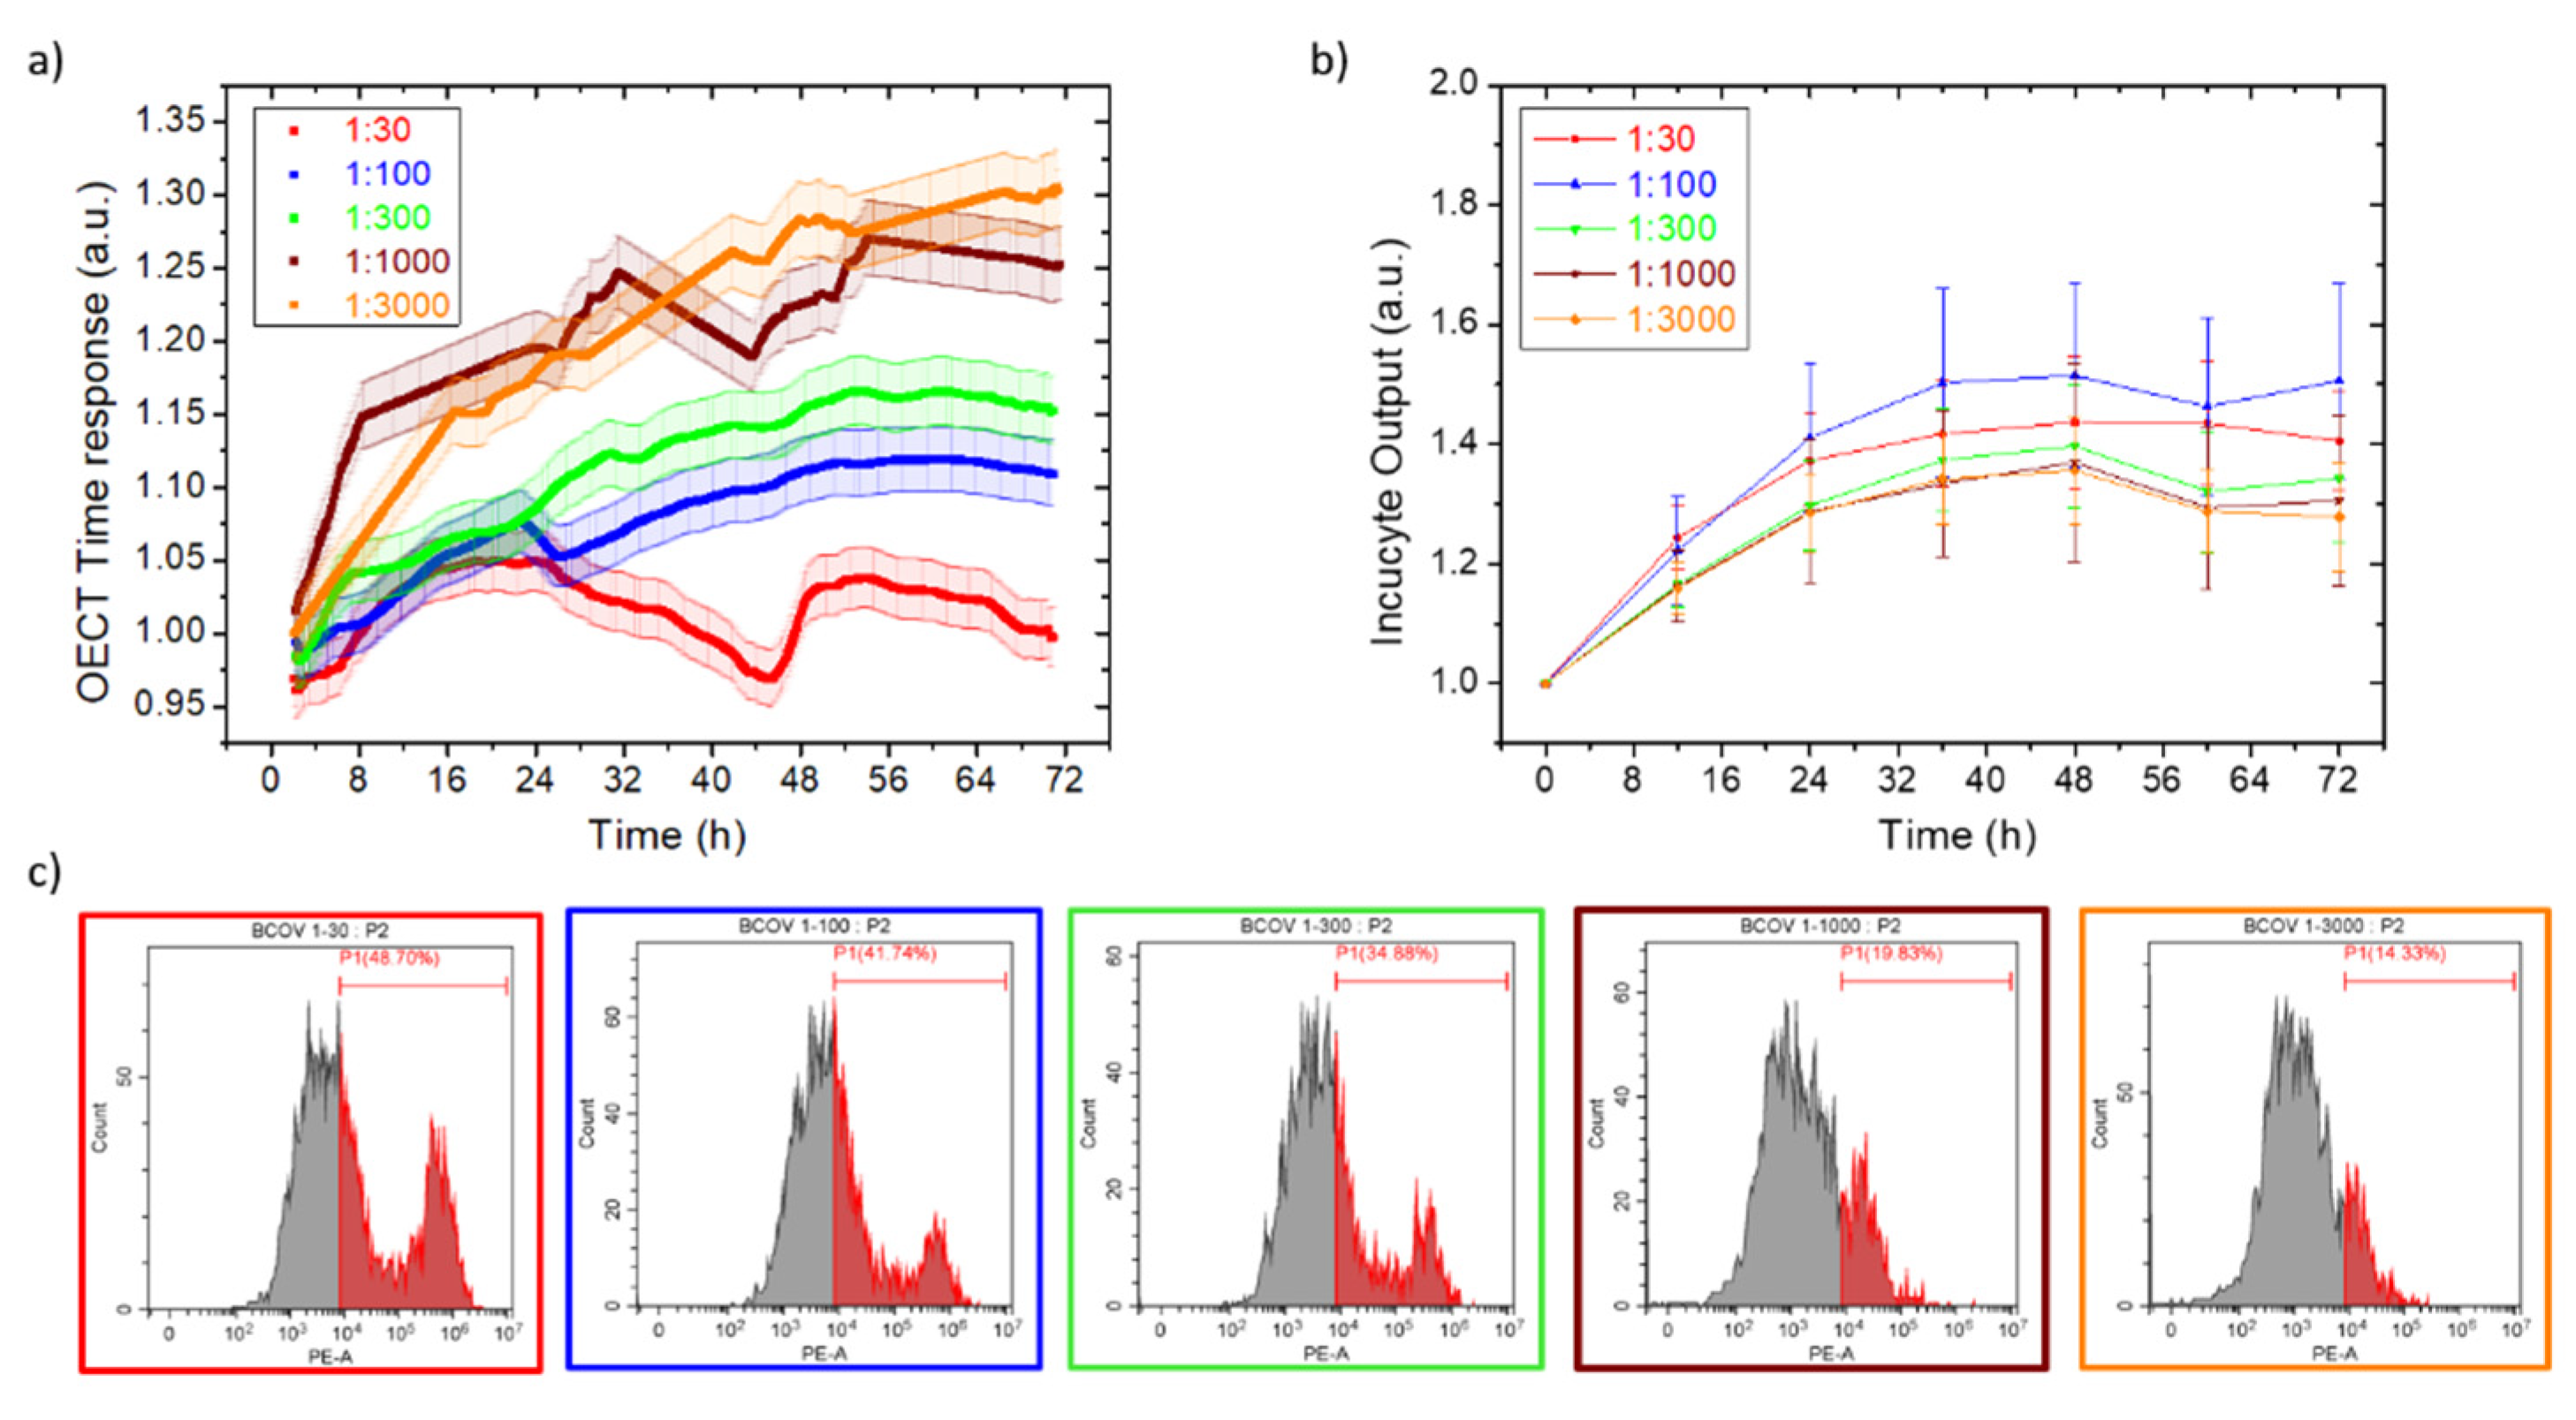
3.1. B-CoV
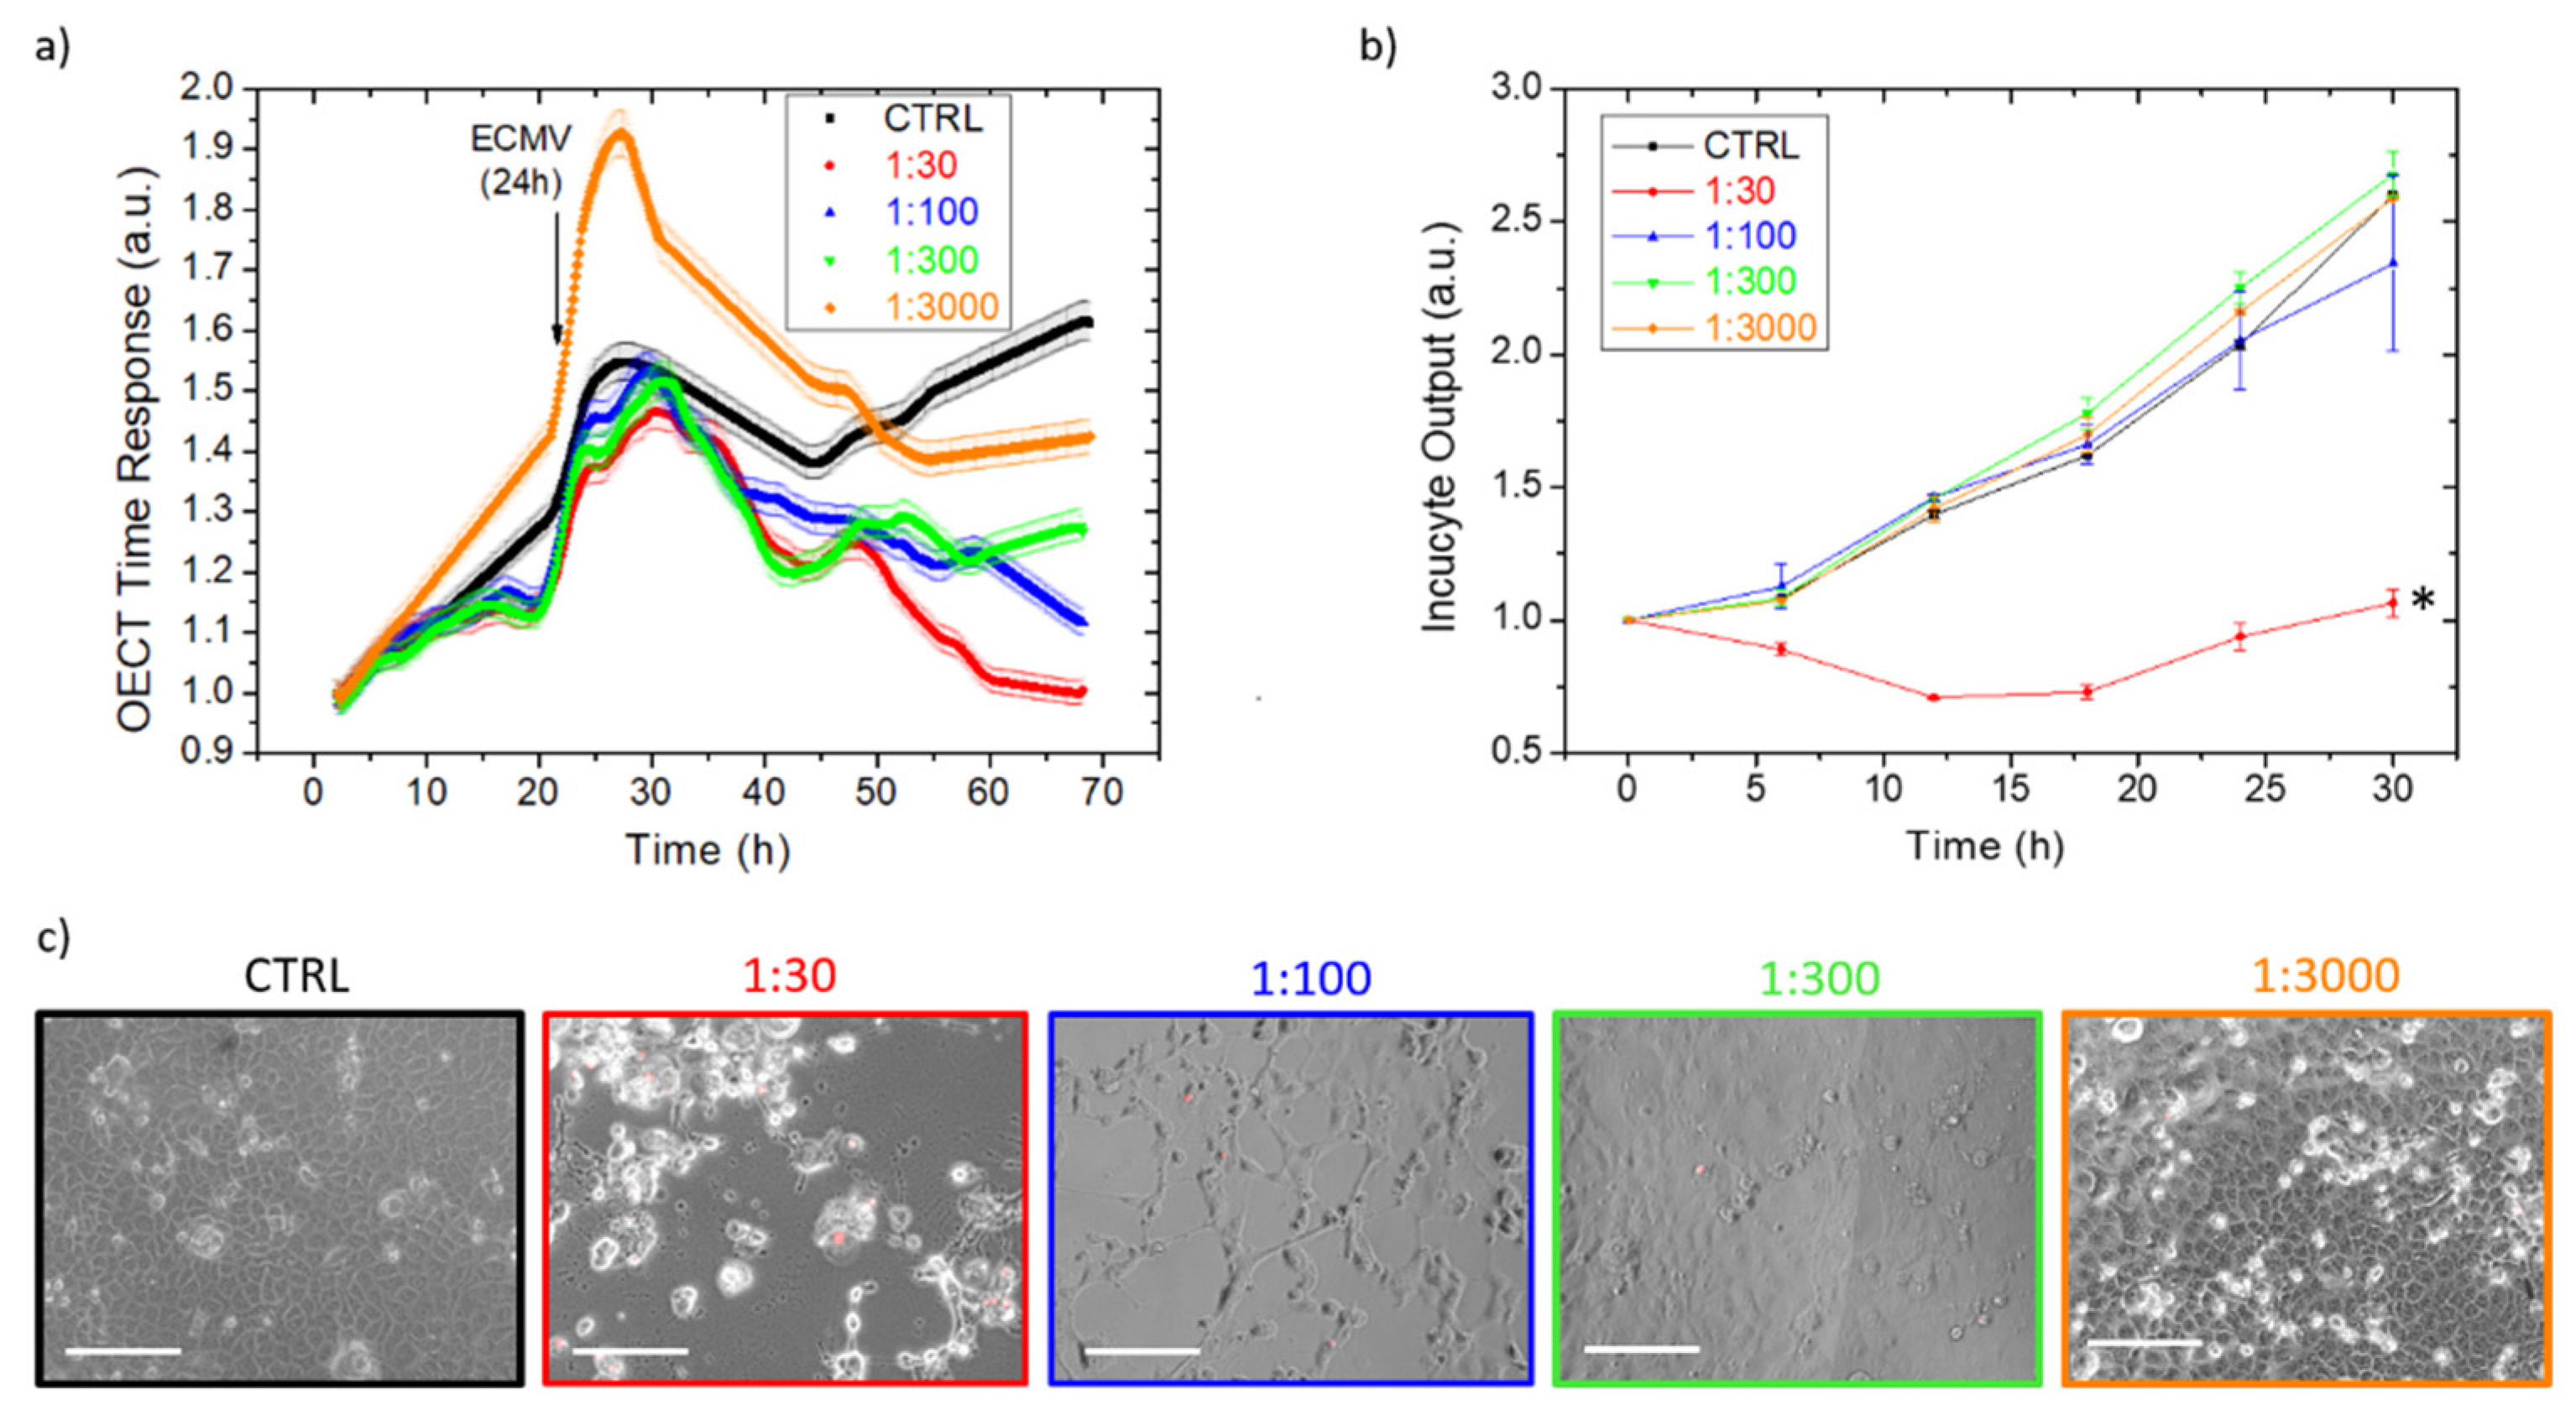
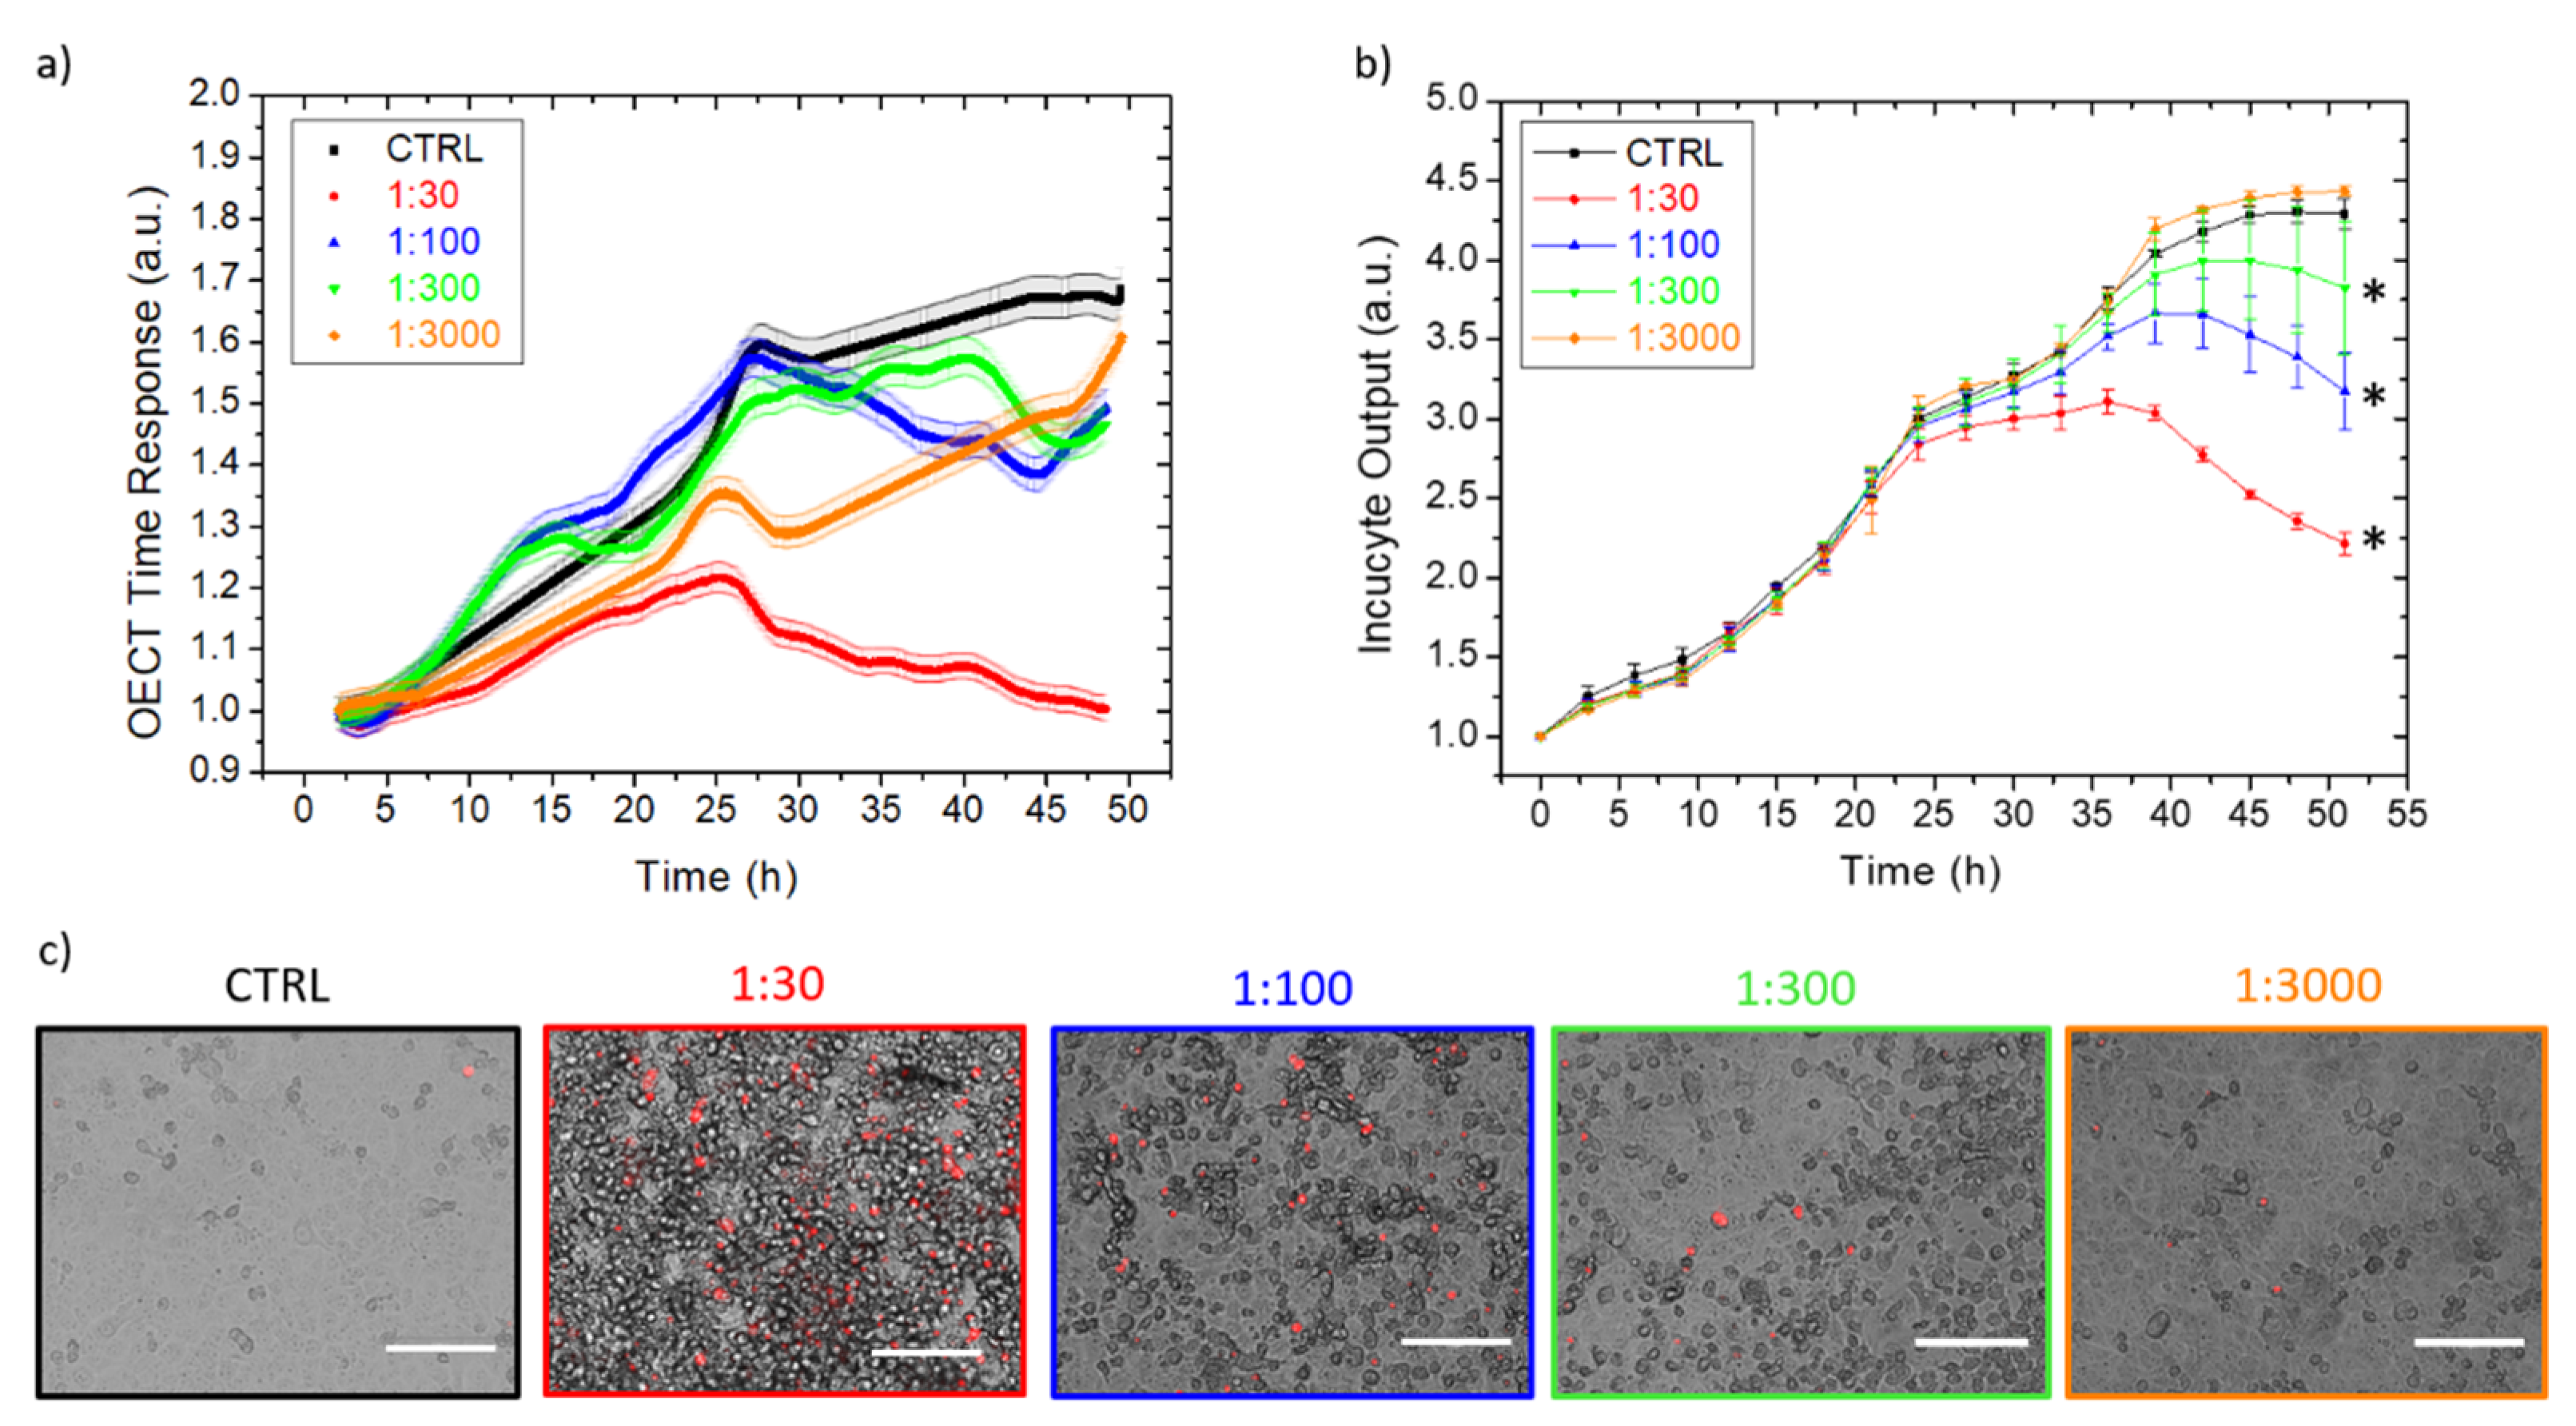
3.2. EMCV
4. Discussion
5. Patents
Supplementary Materials
Author Contributions
Funding
Data Availability Statement
Conflicts of Interest
References
- Kim, J.W.; Murphy, J.; Chang, A.L.; Spencer, D.A.; Kane, J.R.; Kanojia, D.; Rashidi, A.; Young, J.S.; Lesniak, M.S. All Aboard: Mesenchymal Stem/Stromal Cells as Cell Carriers for Virotherapy. Mesenchymal Stromal Cells Tumor Stromal Modul. 2017, 19, 475–499. [Google Scholar] [CrossRef]
- Robbins, P.D.; Ghivizzani, S.C. Viral Vectors for Gene Therapy. Pharmacol. Ther. 1998, 80, 35–47. [Google Scholar] [CrossRef]
- Ylösmäki, E.; Cerullo, V. Design and application of oncolytic viruses for cancer immunotherapy. Curr. Opin. Biotechnol. 2020, 65, 25–36. [Google Scholar] [CrossRef]
- Purtscher, M.; Rothbauer, M.; Kratz, S.R.A.; Bailey, A.; Lieberzeit, P.; Ertl, P. A microfluidic impedance-based extended infectivity assay: Combining retroviral amplification and cytopathic effect monitoring on a single lab-on-a-chip platform. Lab Chip 2021, 21, 1364–1372. [Google Scholar] [CrossRef] [PubMed]
- Ergünay, K.; Ergünay, E. New viruses on the rise: A One Health and ecosystem-based perspective on emerging viruses. Future Virol. 2021, 16, 711–715. [Google Scholar] [CrossRef] [PubMed]
- Agol, V.I. Cytopathic effects: Virus-modulated manifestations of innate immunity? Trends Microbiol. 2012, 20, 570–576. [Google Scholar] [CrossRef]
- Maestro Pro|Axion Biosystems. Available online: https://www.axionbiosystems.com/products/systems/maestro-pro?camp=techEU&gclid=Cj0KCQjw5JSLBhCxARIsAHgO2ScGZCPAk270jRfNh8BfOZansrMKX0wk9i8P86-CkMwmVEhXoyZhXKAaAr9PEALw_wcB (accessed on 12 October 2021).
- Real-Time, Quantitative Cell Analysis, xCELLigence|Agilent. Available online: https://www.agilent.com/en/product/cell-analysis/real-time-cell-analysis (accessed on 22 October 2021).
- Lebourgeois, S.; Fraisse, A.; Hennechart-Collette, C.; Guillier, L.; Perelle, S.; Martin-Latil, S. Development of a Real-Time Cell Analysis (RTCA) Method as a Fast and Accurate Method for Detecting Infectious Particles of the Adapted Strain of Hepatitis A Virus. Front. Cell. Infect. Microbiol. 2018, 8, 335. [Google Scholar] [CrossRef]
- Bernardo, L.; Corallo, L.; Caterini, J.; Su, J.; Gisonni-Lex, L.; Gajewska, B. Application of xCELLigence real-time cell analysis to the microplate assay for pertussis toxin induced clustering in CHO cells. PLoS ONE 2021, 16, e0248491. [Google Scholar] [CrossRef]
- Ke, N.; Wang, X.; Xu, X.; Abassi, Y.A. The xCELLigence System for Real-Time and Label-Free Monitoring of Cell Viability. Methods Mol. Biol. 2011, 740, 33–43. [Google Scholar] [CrossRef]
- Charretier, C.; Saulnier, A.; Benair, L.; Armanet, C.; Bassard, I.; Daulon, S.; Bernigaud, B.; Rodrigues de Sousa, E.; Gonthier, C.; Zorn, E.; et al. Robust real-time cell analysis method for determining viral infectious titers during development of a viral vaccine production process. J. Virol. Methods 2018, 252, 57–64. [Google Scholar] [CrossRef]
- Pollock, N.R. Ultrasensitive detection and quantification of toxins for optimized diagnosis of clostridium difficile infection. J. Clin. Microbiol. 2016, 54, 259–264. [Google Scholar] [CrossRef] [PubMed] [Green Version]
- Hayes, H.B.; Logun, M.T.; Chvatal, S.A.; Mueller, K.; Piscopo, N.; Das, A.; Saha, K.; Millard, D.C.; Karumbaiah, L. Abstract 1552: Kinetics and potency of T cell and CAR-T cell mediated cytolysis of glioma stem cells. Cancer Res. 2021, 81, 1552. [Google Scholar] [CrossRef]
- Decataldo, F.; Grumiro, L.; Michela Marino, M.; Faccin, F.; Giovannini, C.; Brandolini, M.; Dirani, G.; Taddei, F.; Lelli, D.; Tessarolo, M.; et al. Fast and real-time electrical transistor assay for quantifying SARS-CoV-2 neutralizing antibodies. Commun. Mater. 2022, 3, 5. [Google Scholar] [CrossRef]
- Carocci, M.; Bakkali-Kassimi, L. The encephalomyocarditis virus. Virulence 2012, 3, 351–367. [Google Scholar] [CrossRef] [PubMed] [Green Version]
- Vlasova, A.N.; Saif, L.J. Bovine Coronavirus and the Associated Diseases. Front. Vet. Sci. 2021, 8, 293. [Google Scholar] [CrossRef]
- Saif, L.J.; Heckert, R.A.; Miller, K.L.; Tarek, M.M. Cell culture propagation of bovine coronavirus. J. Tissue Cult. Methods 1988, 11, 139–145. [Google Scholar] [CrossRef]
- Decataldo, F.; Barbalinardo, M.; Tessarolo, M.; Vurro, V.; Calienni, M.; Gentili, D.; Valle, F.; Cavallini, M.; Fraboni, B. Organic Electrochemical Transistors: Smart Devices for Real-Time Monitoring of Cellular Vitality. Adv. Mater. Technol. 2019, 4, 1900207. [Google Scholar] [CrossRef]
- Faria, G.C.; Duong, D.T.; Salleo, A. On the transient response of organic electrochemical transistors. Org. Electron. 2017, 45, 215–221. [Google Scholar] [CrossRef] [Green Version]
- Dea, S.; Roy, R.S.; Begin, M.E. Bovine coronavirus isolation and cultivation in continuous cell lines. Am. J. Vet. Res. 1980, 41, 30–38. [Google Scholar]
- Benfield, D.A.; Saif, L.J. Cell culture propagation of a coronavirus isolated from cows with winter dysentery. J. Clin. Microbiol. 1990, 28, 1454–1457. [Google Scholar] [CrossRef] [Green Version]
- Cassedy, A.; Parle-McDermott, A.; O’Kennedy, R. Virus Detection: A Review of the Current and Emerging Molecular and Immunological Methods. Front. Mol. Biosci. 2021, 8, 637559. [Google Scholar] [CrossRef] [PubMed]
- Ramuz, M.; Hama, A.; Huerta, M.; Rivnay, J.; Leleux, P.; Owens, R.M. Combined Optical and Electronic Sensing of Epithelial Cells Using Planar Organic Transistors. Adv. Mater. 2014, 26, 7083–7090. [Google Scholar] [CrossRef] [PubMed] [Green Version]
- Decataldo, F.; Barbalinardo, M.; Gentili, D.; Tessarolo, M.; Calienni, M.; Cavallini, M.; Fraboni, B. Organic Electrochemical Transistors for Real-Time Monitoring of In Vitro Silver Nanoparticle Toxicity. Adv. Biosyst. 2020, 4, 1900204. [Google Scholar] [CrossRef] [PubMed]


Publisher’s Note: MDPI stays neutral with regard to jurisdictional claims in published maps and institutional affiliations. |
© 2022 by the authors. Licensee MDPI, Basel, Switzerland. This article is an open access article distributed under the terms and conditions of the Creative Commons Attribution (CC BY) license (https://creativecommons.org/licenses/by/4.0/).
Share and Cite
Decataldo, F.; Giovannini, C.; Grumiro, L.; Marino, M.M.; Faccin, F.; Brandolini, M.; Dirani, G.; Taddei, F.; Lelli, D.; Tessarolo, M.; et al. Organic Electrochemical Transistors as Versatile Tool for Real-Time and Automatized Viral Cytopathic Effect Evaluation. Viruses 2022, 14, 1155. https://doi.org/10.3390/v14061155
Decataldo F, Giovannini C, Grumiro L, Marino MM, Faccin F, Brandolini M, Dirani G, Taddei F, Lelli D, Tessarolo M, et al. Organic Electrochemical Transistors as Versatile Tool for Real-Time and Automatized Viral Cytopathic Effect Evaluation. Viruses. 2022; 14(6):1155. https://doi.org/10.3390/v14061155
Chicago/Turabian StyleDecataldo, Francesco, Catia Giovannini, Laura Grumiro, Maria Michela Marino, Francesca Faccin, Martina Brandolini, Giorgio Dirani, Francesca Taddei, Davide Lelli, Marta Tessarolo, and et al. 2022. "Organic Electrochemical Transistors as Versatile Tool for Real-Time and Automatized Viral Cytopathic Effect Evaluation" Viruses 14, no. 6: 1155. https://doi.org/10.3390/v14061155