
Near-Native Visualization of SARS-CoV-2 Induced Membrane Remodeling and Virion Morphogenesis

 , , and
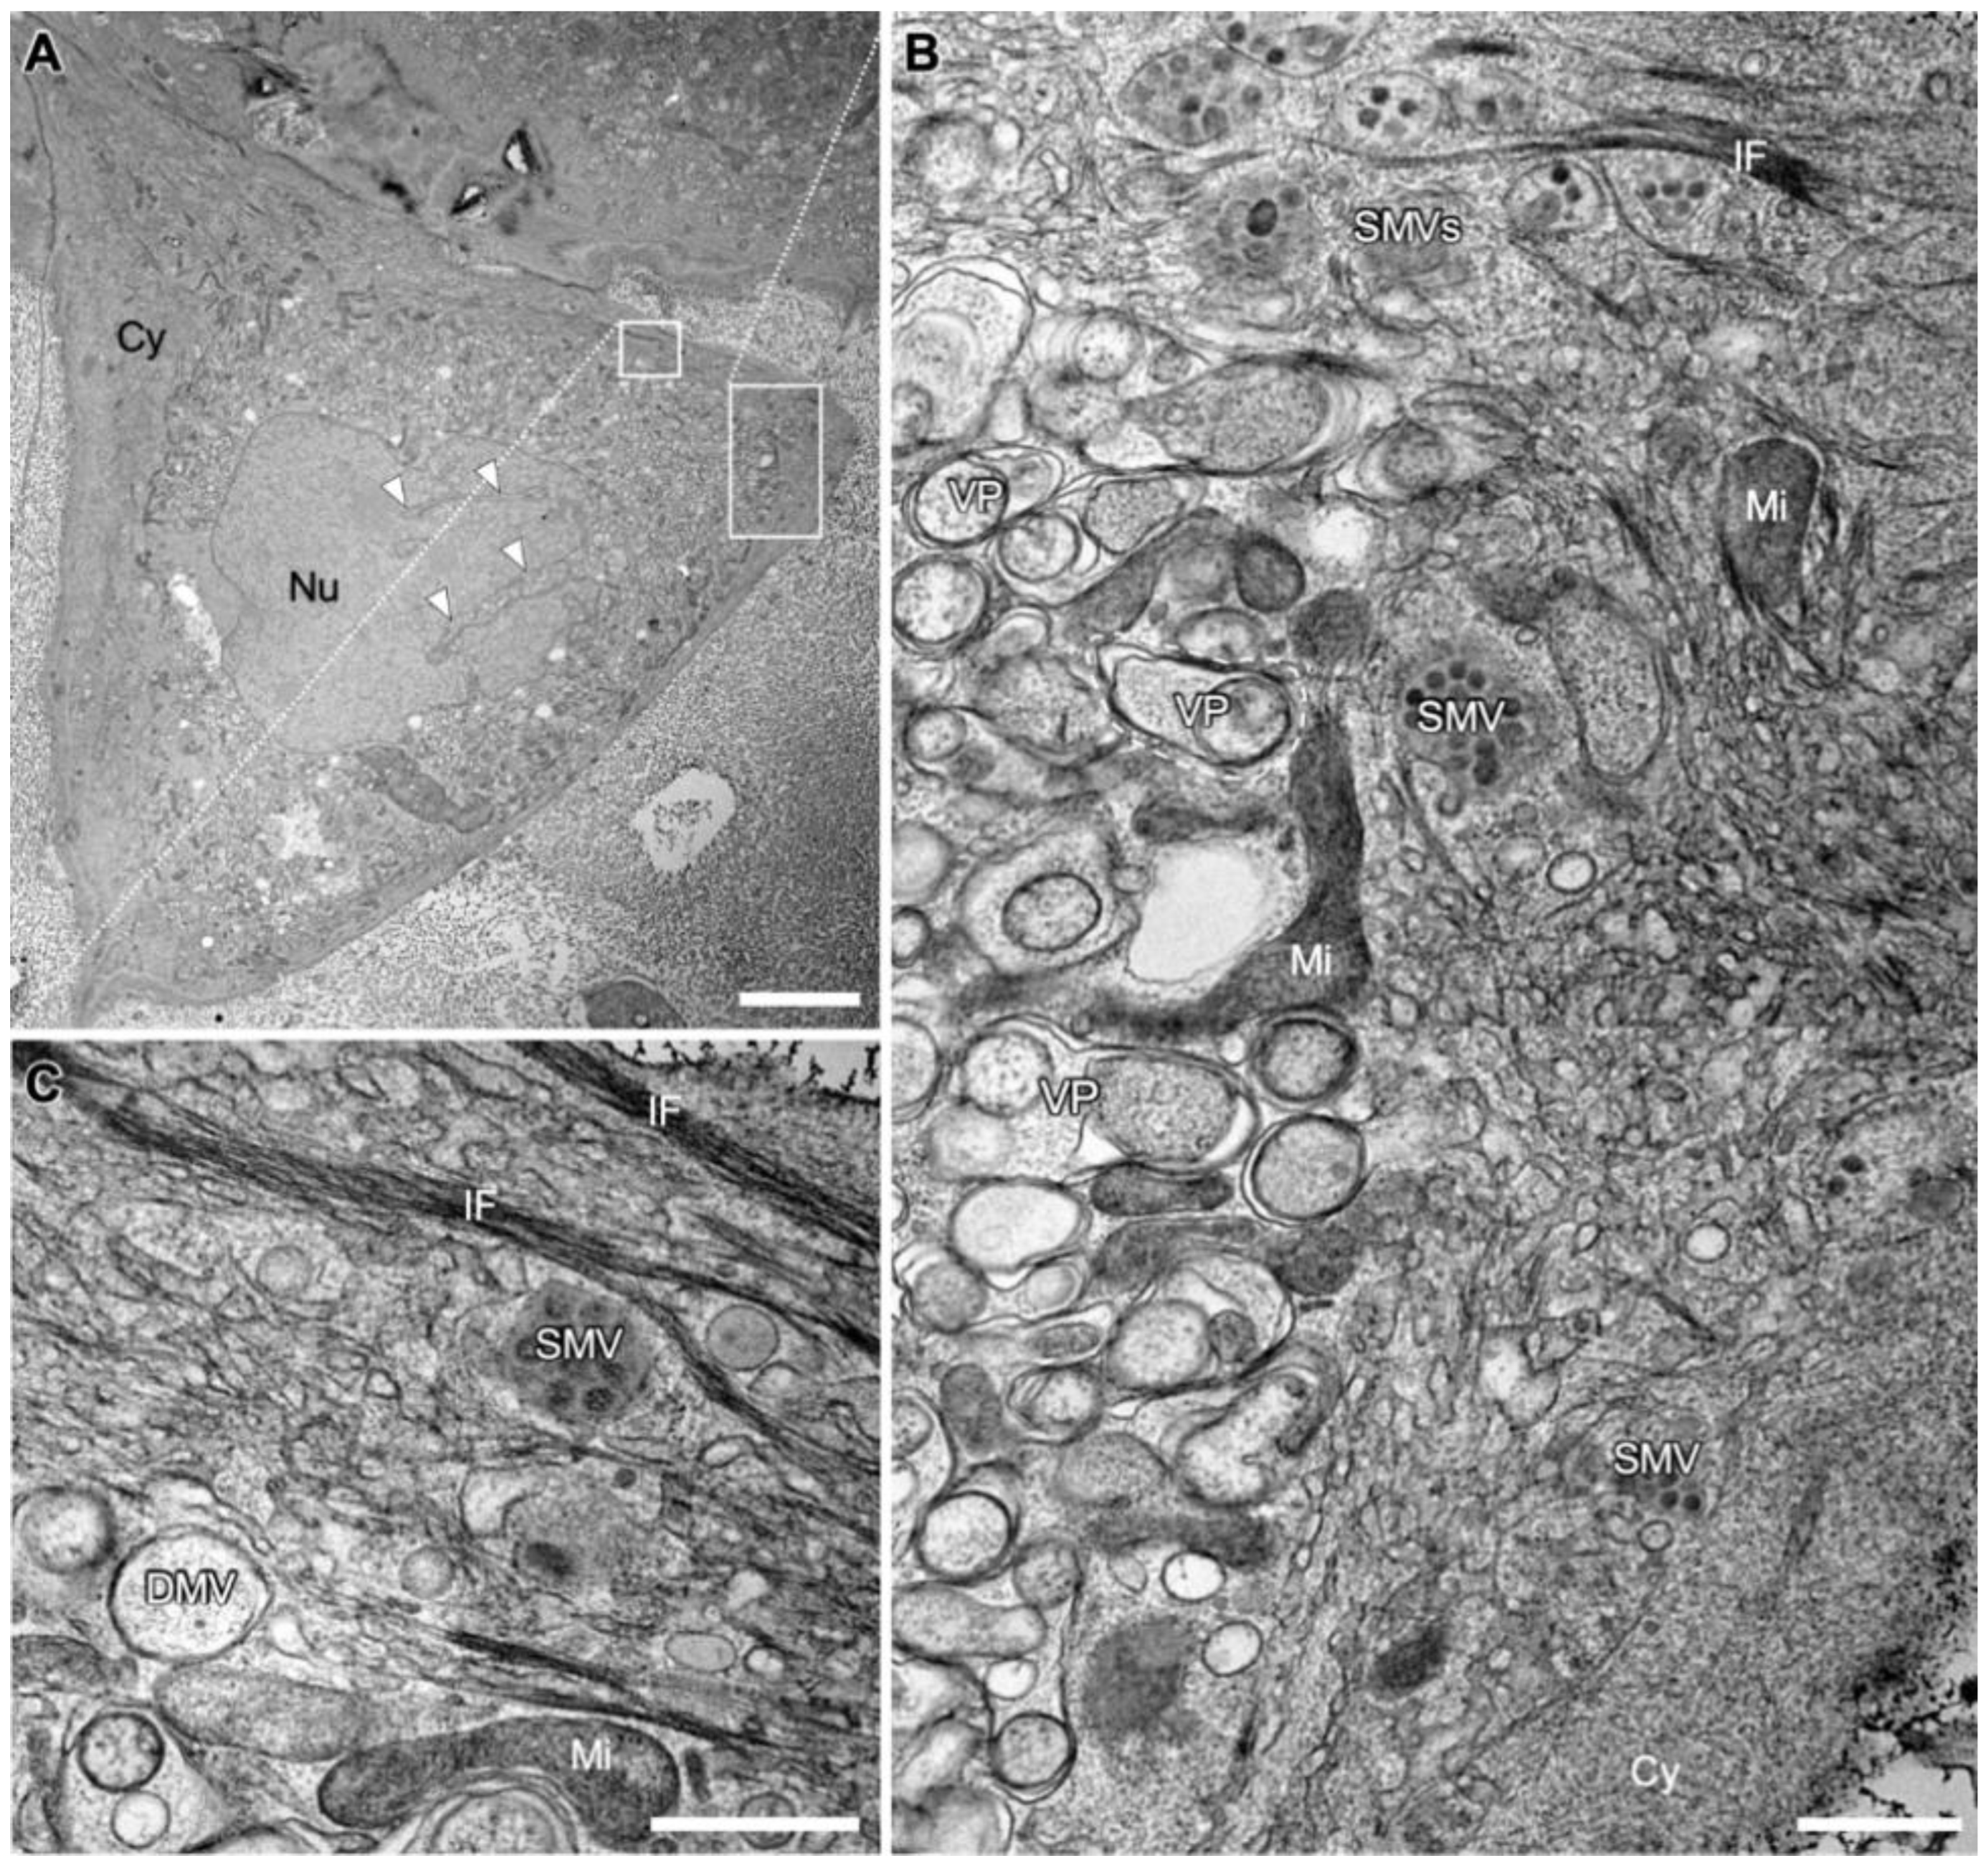
Abstract
:1. Introduction
2. Methods
2.1. Cell Culture and Viruses
2.2. Sample Preparation for Transmission Electron Microscopy and Scanning Transmission Electron Microscopy
2.3. Transmission Electron Microscopy
2.4. Scanning Transmission Electron Microscopy Tomography
3. Results
3.1. Overview of a SARS-CoV-2 Infected Cell Shows Prominent Compartmentation
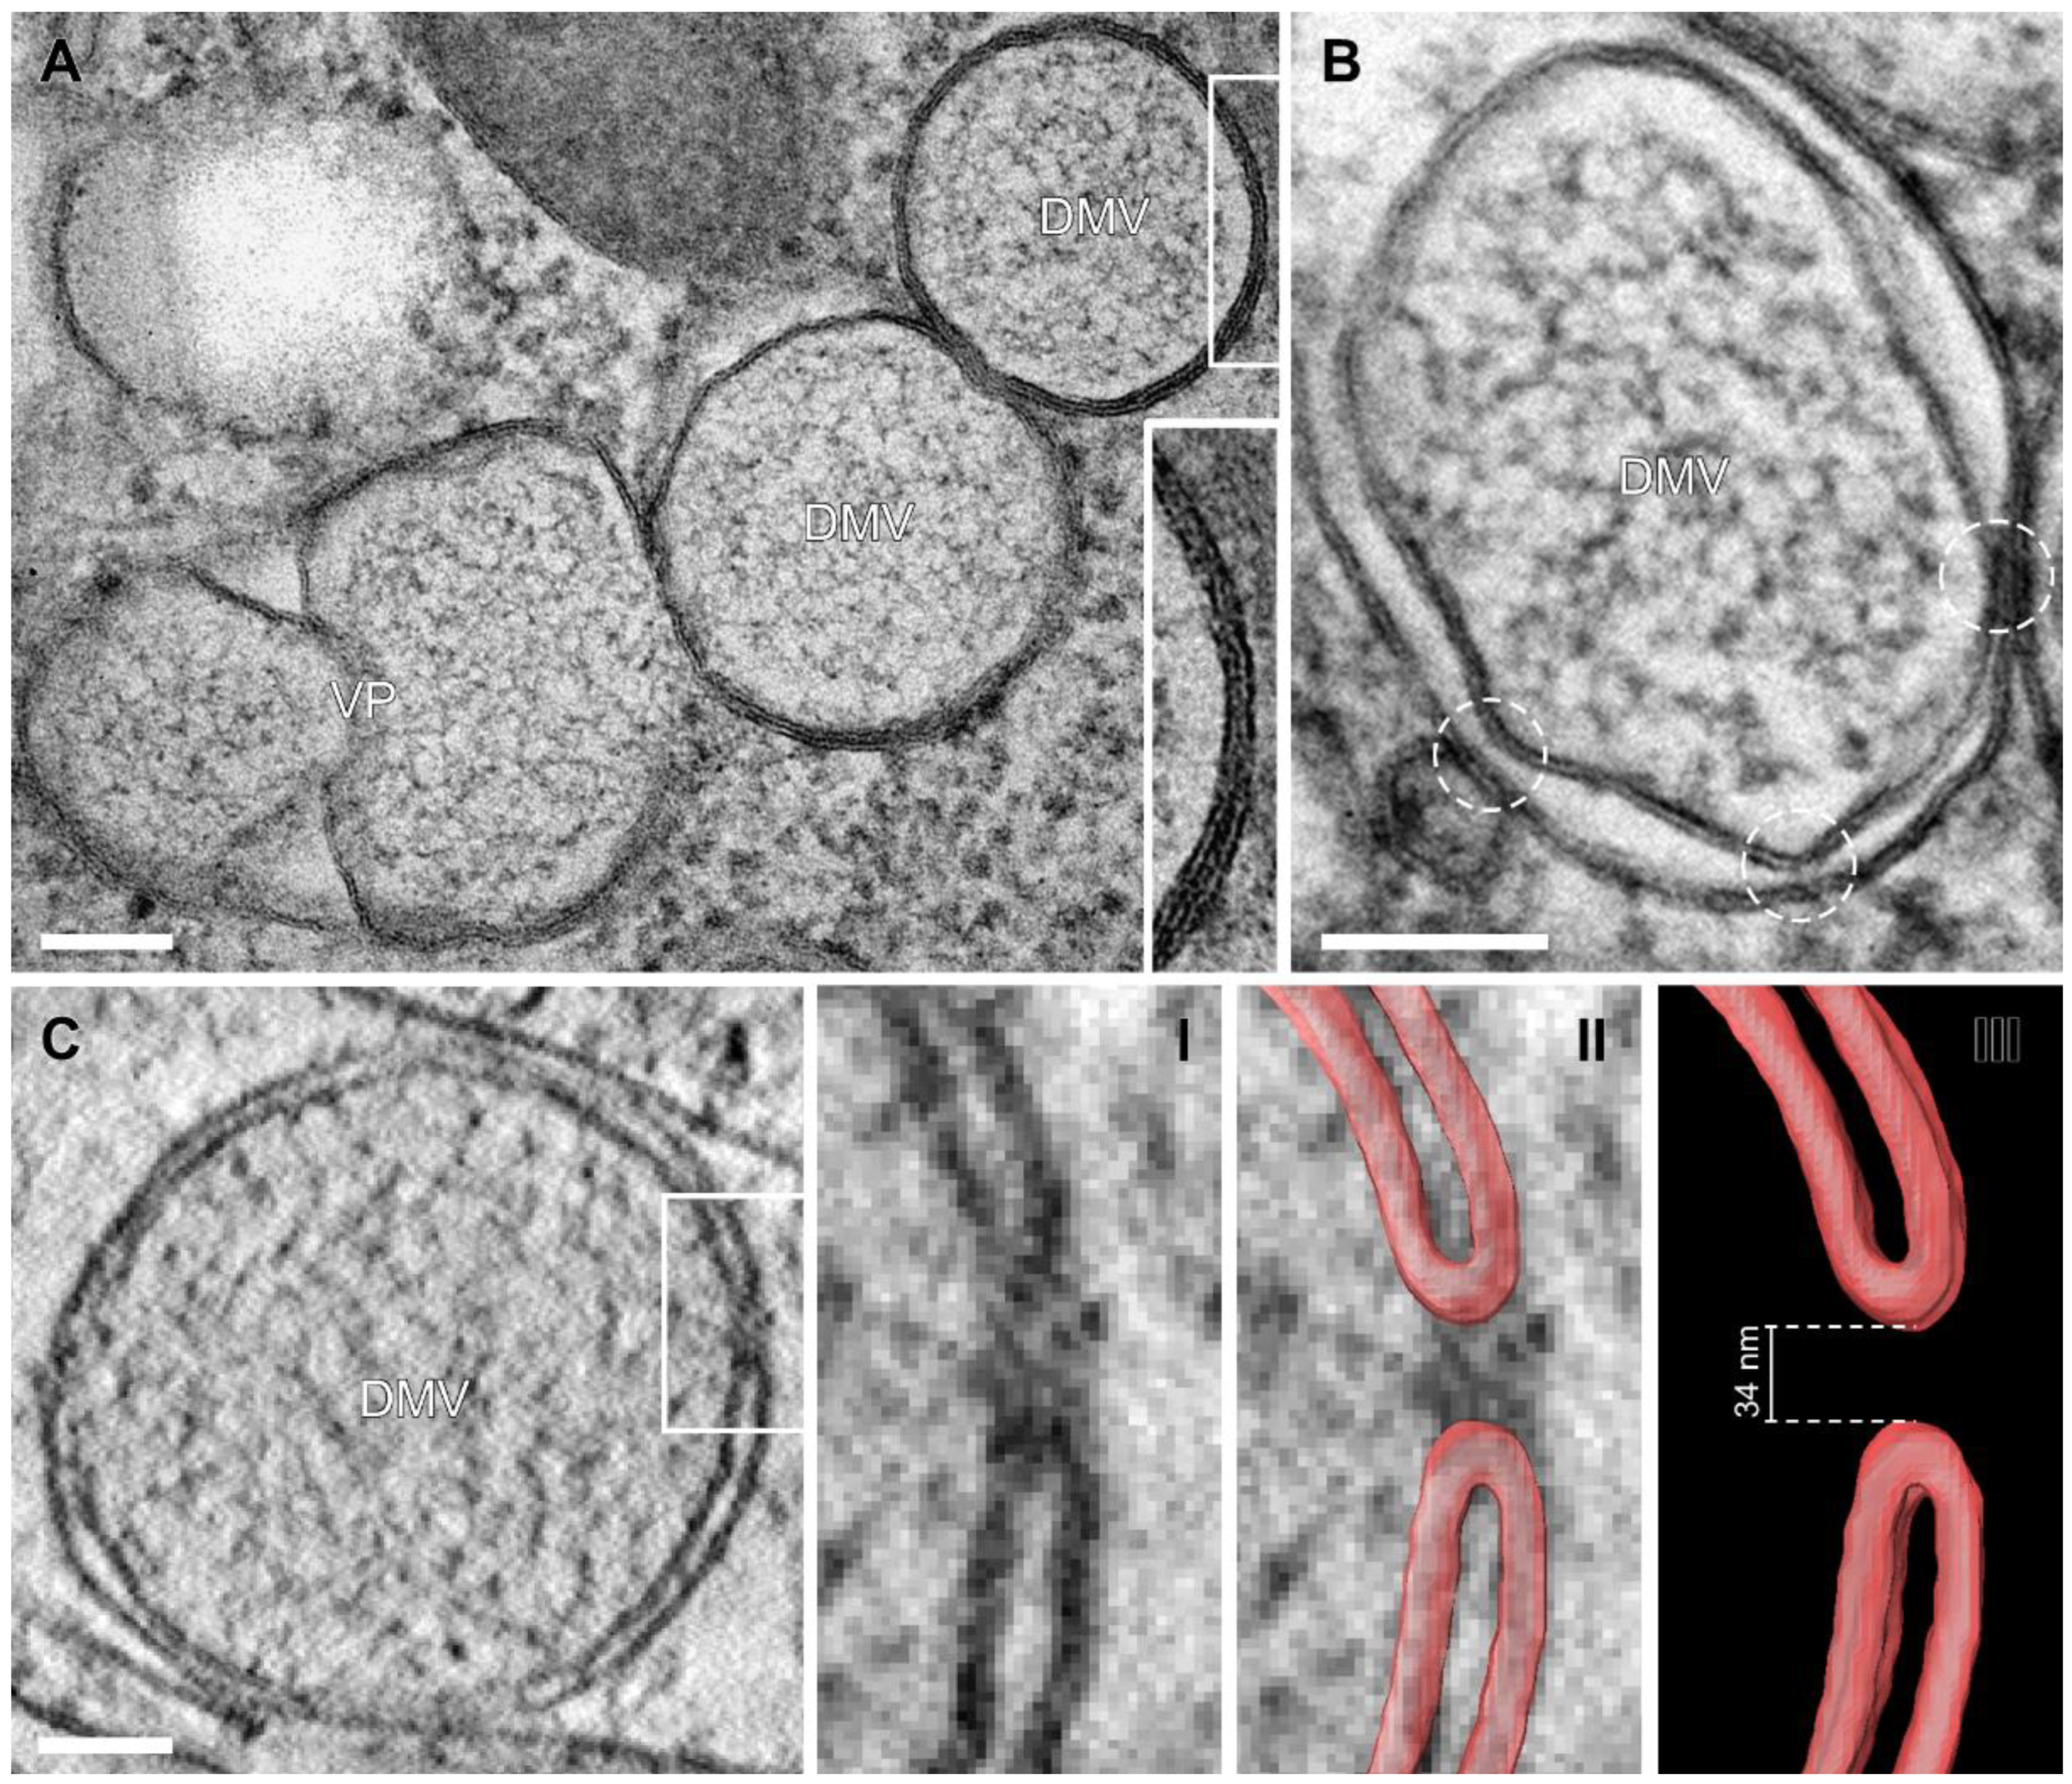
3.2. Near-Native Visualization of SARS-CoV-2 Induced DMVs
3.3. Visualization of the DMV Pore in Room Temperature EM Samples
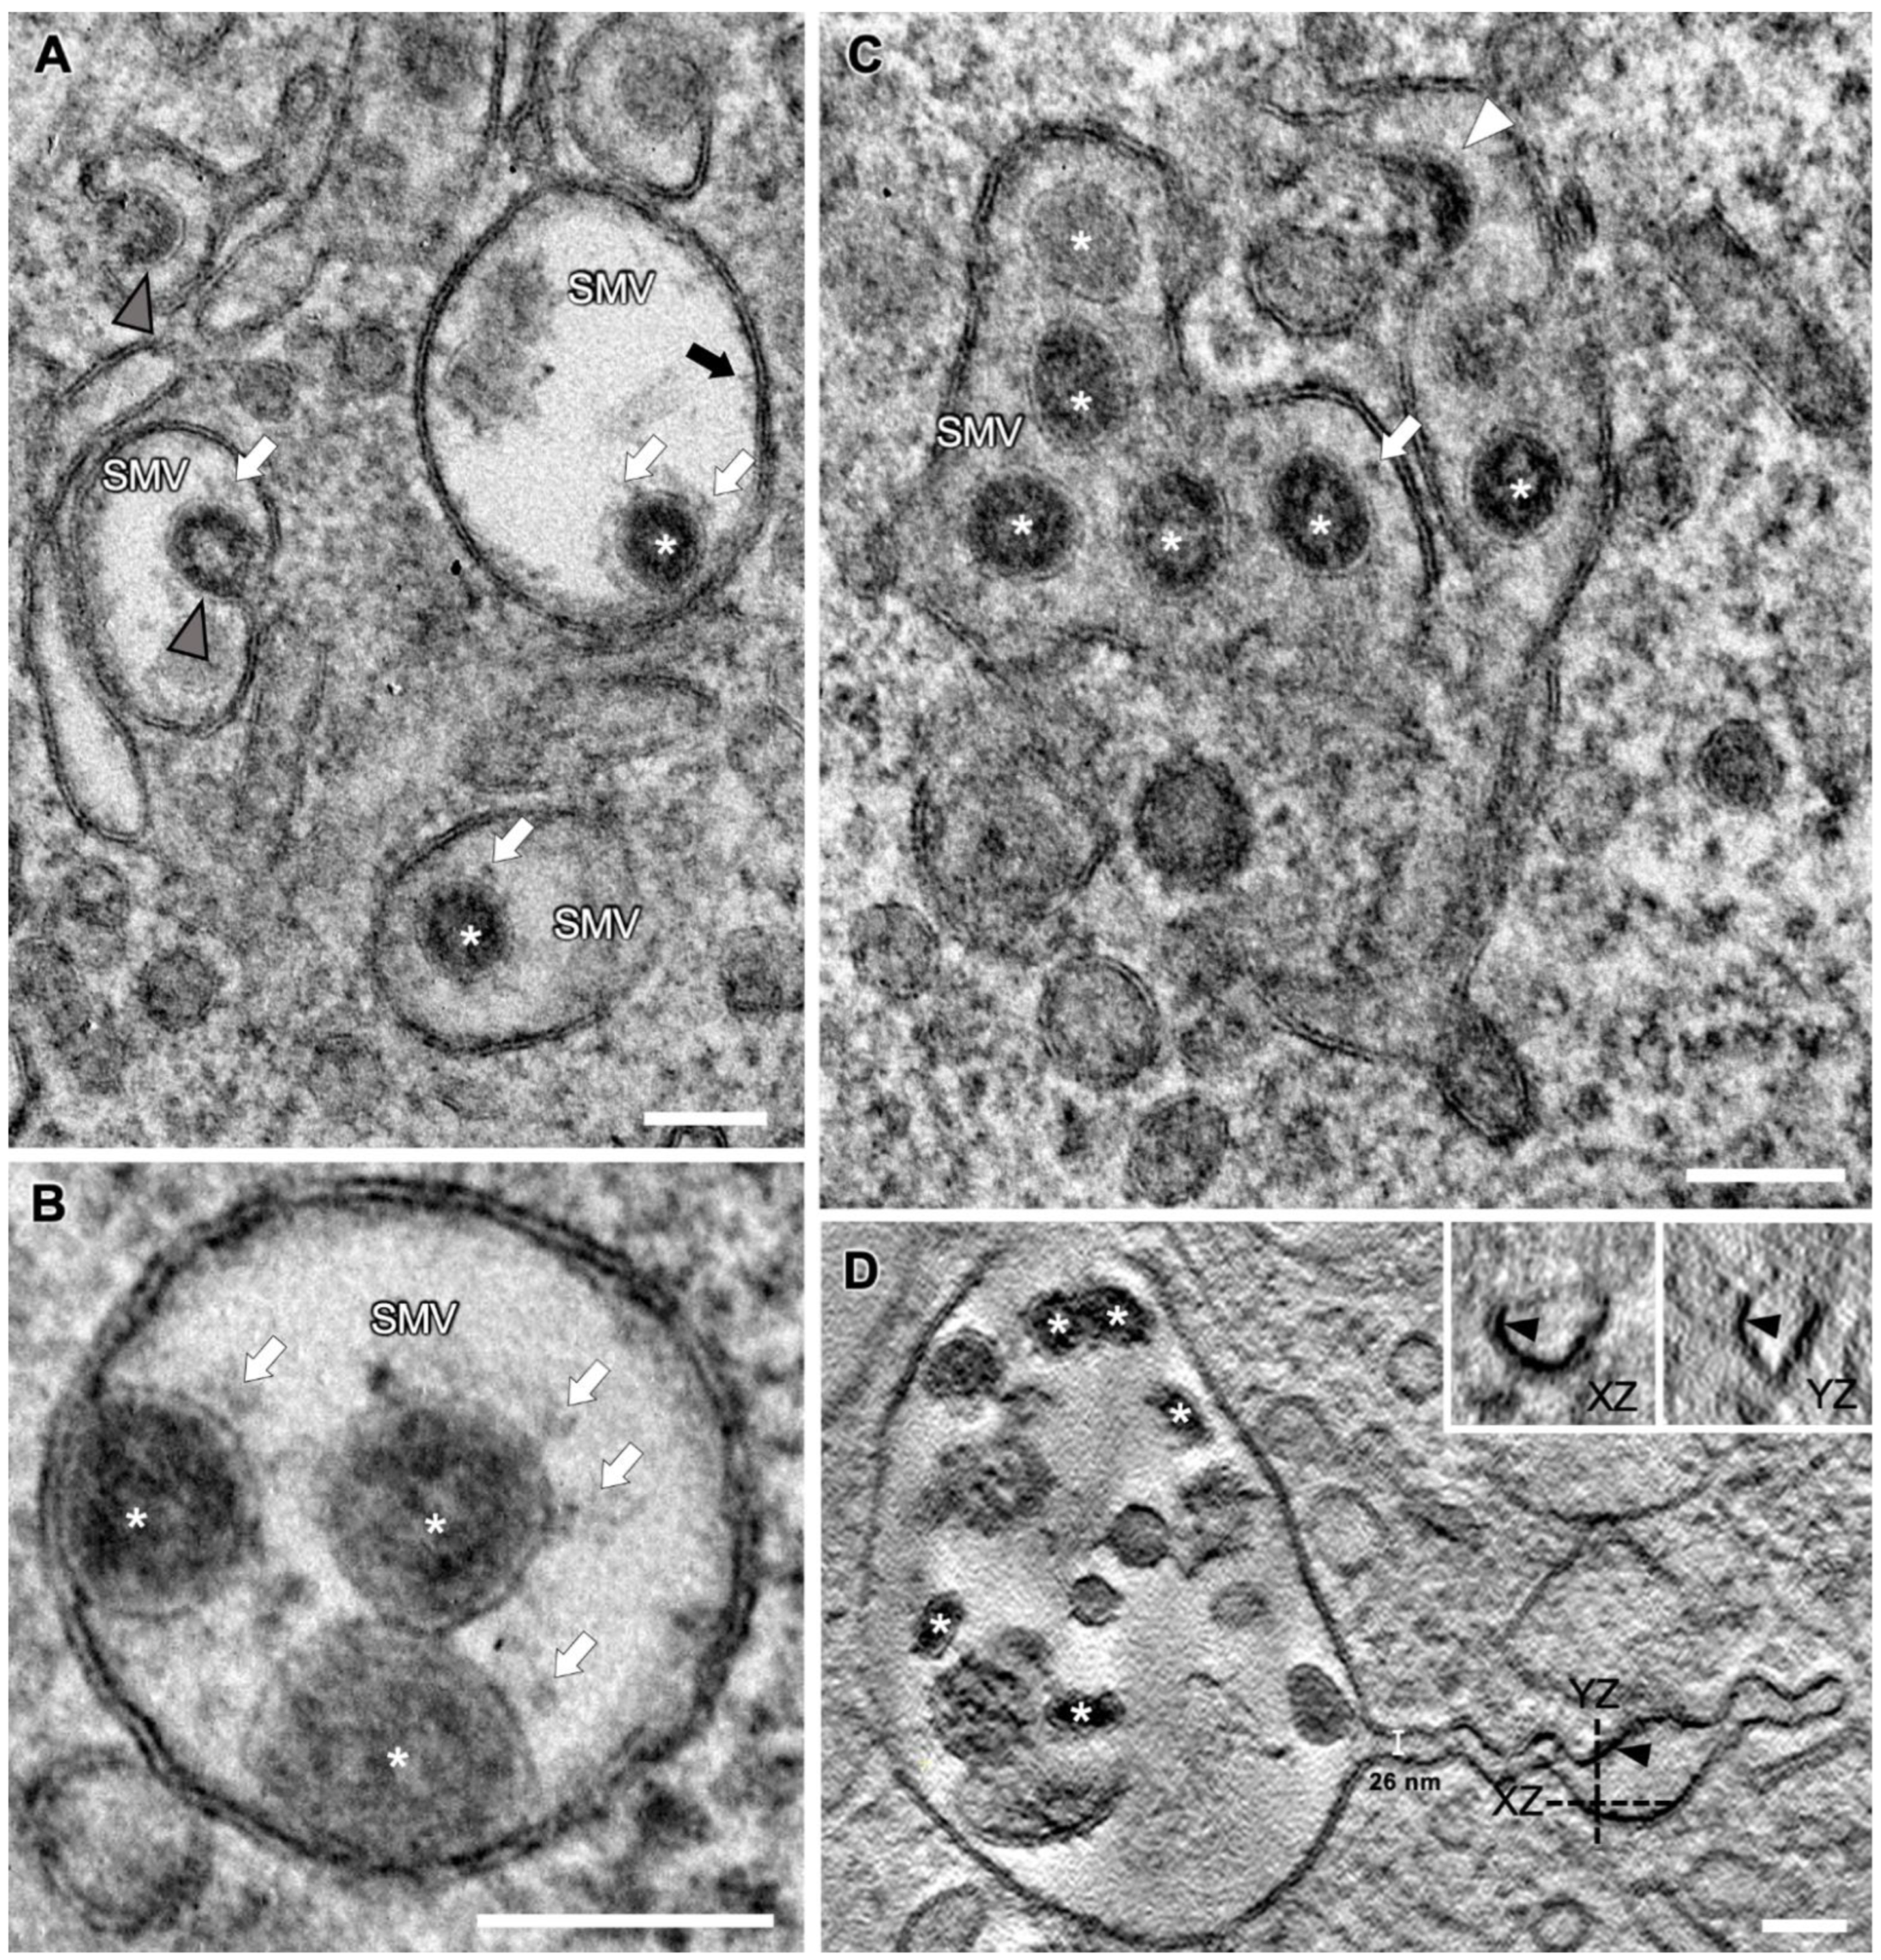
3.4. SARS-CoV-2 Virion Assembly
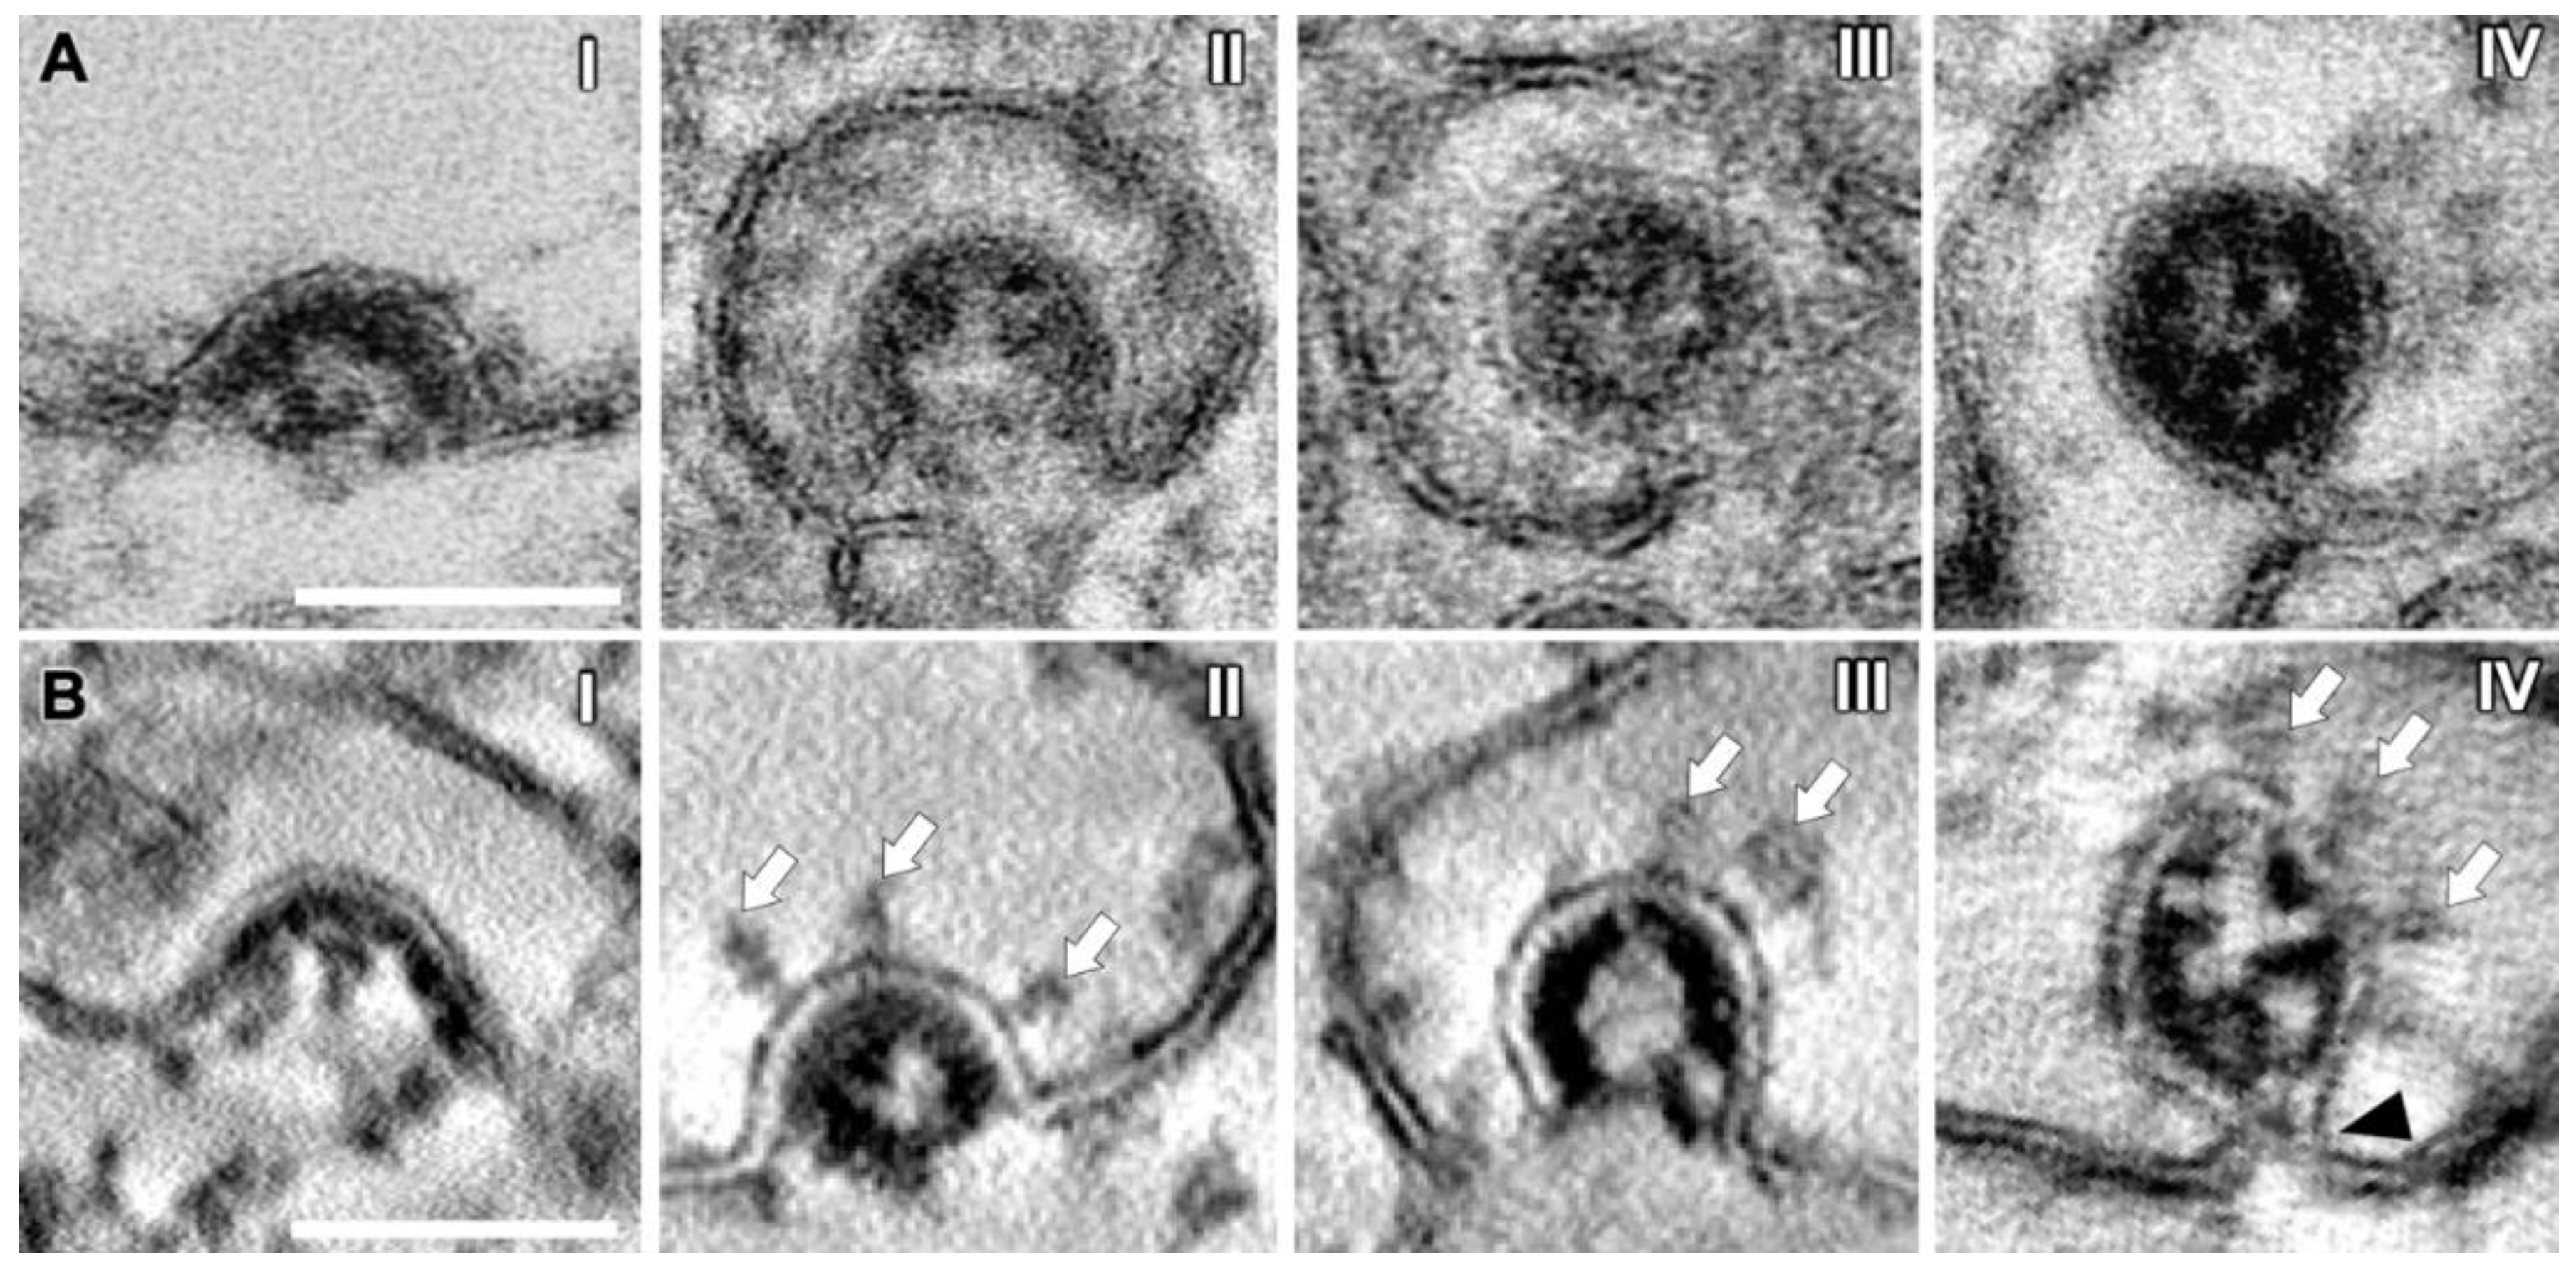
3.5. SMV Membrane Curving and Nucleocapsid Assembly Occur Gradually and Simultaneously
3.6. SARS-CoV-2 Virion Tethering
3.7. Cellular Degradation of SARS-CoV-2 Virions
4. Discussion
Supplementary Materials
Author Contributions
Funding
Institutional Review Board Statement
Informed Consent Statement
Data Availability Statement
Acknowledgments
Conflicts of Interest
References
- van Doremalen, N.; Bushmaker, T.; Morris, D.H.; Holbrook, M.G.; Gamble, A.; Williamson, B.N.; Tamin, A.; Harcourt, J.L.; Thornburg, N.J.; Gerber, S.I.; et al. Aerosol and Surface Stability of SARS-CoV-2 as Compared with SARS-CoV-1. N. Engl. J. Med. 2020, 382, 1177–1179. [Google Scholar] [CrossRef] [PubMed]
- Ke, Z.; Oton, J.; Qu, K.; Cortese, M.; Zila, V.; McKeane, L.; Nakane, T.; Zivanov, J.; Neufeldt, C.J.; Cerikan, B.; et al. Structures and Distributions of SARS-CoV-2 Spike Proteins on Intact Virions. Nature 2020, 588, 498–502. [Google Scholar] [CrossRef] [PubMed]
- Yao, H.; Song, Y.; Chen, Y.; Wu, N.; Xu, J.; Sun, C.; Zhang, J.; Weng, T.; Zhang, Z.; Wu, Z.; et al. Molecular Architecture of the SARS-CoV-2 Virus. Cell 2020, 183, 730–738.e13. [Google Scholar] [CrossRef] [PubMed]
- Eymieux, S.; Rouillé, Y.; Terrier, O.; Seron, K.; Blanchard, E.; Rosa-Calatrava, M.; Dubuisson, J.; Belouzard, S.; Roingeard, P. Ultrastructural Modifications Induced by SARS-CoV-2 in Vero Cells: A Kinetic Analysis of Viral Factory Formation, Viral Particle Morphogenesis and Virion Release. Cell. Mol. Life Sci. 2021, 78, 3565–3576. [Google Scholar] [CrossRef] [PubMed]
- Rastogi, M.; Pandey, N.; Shukla, A.; Singh, S.K. SARS Coronavirus 2: From Genome to Infectome. Respir. Res. 2020, 21, 318. [Google Scholar] [CrossRef]
- Lee, J.G.; Huang, W.; Lee, H.; van de Leemput, J.; Kane, M.A.; Han, Z. Characterization of SARS-CoV-2 Proteins Reveals Orf6 Pathogenicity, Subcellular Localization, Host Interactions and Attenuation by Selinexor. Cell Biosci 2021, 11, 58. [Google Scholar] [CrossRef]
- Gordon, D.E.; Jang, G.M.; Bouhaddou, M.; Xu, J.; Obernier, K.; White, K.M.; O’Meara, M.J.; Rezelj, V.V.; Guo, J.Z.; Swaney, D.L.; et al. A SARS-CoV-2 Protein Interaction Map Reveals Targets for Drug Repurposing. Nature 2020, 583, 459–468. [Google Scholar] [CrossRef] [PubMed]
- Yoshimoto, F.K. The Proteins of Severe Acute Respiratory Syndrome Coronavirus-2 (SARS CoV-2 or n-COV19), the Cause of COVID-19. Protein J. 2020, 39, 198–216. [Google Scholar] [CrossRef]
- Lan, J.; Ge, J.; Yu, J.; Shan, S.; Zhou, H.; Fan, S.; Zhang, Q.; Shi, X.; Wang, Q.; Zhang, L.; et al. Structure of the SARS-CoV-2 Spike Receptor-Binding Domain Bound to the ACE2 Receptor. Nature 2020, 581, 215–220. [Google Scholar] [CrossRef]
- Hoffmann, M.; Kleine-Weber, H.; Schroeder, S.; Krüger, N.; Herrler, T.; Erichsen, S.; Schiergens, T.S.; Herrler, G.; Wu, N.H.; Nitsche, A.; et al. SARS-CoV-2 Cell Entry Depends on ACE2 and TMPRSS2 and Is Blocked by a Clinically Proven Protease Inhibitor. Cell 2020, 181, 271–280.e8. [Google Scholar] [CrossRef]
- Shang, J.; Ye, G.; Shi, K.; Wan, Y.; Luo, C.; Aihara, H.; Geng, Q.; Auerbach, A.; Li, F. Structural Basis of Receptor Recognition by SARS-CoV-2. Nature 2020, 581, 221–224. [Google Scholar] [CrossRef] [PubMed]
- Wang, Q.; Zhang, Y.; Wu, L.; Niu, S.; Song, C.; Zhang, Z.; Lu, G.; Qiao, C.; Hu, Y.; Yuen, K.Y.; et al. Structural and Functional Basis of SARS-CoV-2 Entry by Using Human ACE2. Cell 2020, 181, 894–904.e9. [Google Scholar] [CrossRef] [PubMed]
- Song, W.; Gui, M.; Wang, X.; Xiang, Y. Cryo-EM Structure of the SARS Coronavirus Spike Glycoprotein in Complex with Its Host Cell Receptor ACE2. PLoS Pathog. 2018, 14, e1007236. [Google Scholar] [CrossRef] [PubMed]
- Simmons, G.; Reeves, J.D.; Rennekamp, A.J.; Amberg, S.M.; Piefer, A.J.; Bates, P. Characterization of Severe Acute Respiratory Syndrome-Associated Coronavirus (SARS-CoV) Spike Glycoprotein-Mediated Viral Entry. Proc. Natl. Acad. Sci. USA 2004, 101, 4240–4245. [Google Scholar] [CrossRef]
- Welsch, S.; Miller, S.; Romero-Brey, I.; Merz, A.; Bleck, C.K.E.; Walther, P.; Fuller, S.D.; Antony, C.; Krijnse-Locker, J.; Bartenschlager, R. Composition and Three-Dimensional Architecture of the Dengue Virus Replication and Assembly Sites. Cell Host Microbe 2009, 5, 365–375. [Google Scholar] [CrossRef]
- Wieland, J.; Frey, S.; Rupp, U.; Essbauer, S.; Groß, R.; Münch, J.; Walther, P. Zika Virus Replication in Glioblastoma Cells: Electron Microscopic Tomography Shows 3D Arrangement of Endoplasmic Reticulum, Replication Organelles, and Viral Ribonucleoproteins. Histochem. Cell Biol. 2021, 156, 527–538. [Google Scholar] [CrossRef]
- Maier, H.J.; Neuman, B.W.; Bickerton, E.; Keep, S.M.; Alrashedi, H.; Hall, R.; Britton, P. Extensive Coronavirus-Induced Membrane Rearrangements Are Not a Determinant of Pathogenicity. Sci. Rep. 2016, 6, 27126. [Google Scholar] [CrossRef] [PubMed]
- Knoops, K.; Kikkert, M.; van den Worm, S.H.E.; Zevenhoven-Dobbe, J.C.; van der Meer, Y.; Koster, A.J.; Mommaas, A.M.; Snijder, E.J. SARS-Coronavirus Replication Is Supported by a Reticulovesicular Network of Modified Endoplasmic Reticulum. PLoS Biol. 2008, 6, e226. [Google Scholar] [CrossRef] [PubMed]
- Snijder, E.J.; Limpens, R.W.A.L.; de Wilde, A.H.; de Jong, A.W.M.; Zevenhoven-Dobbe, J.C.; Maier, H.J.; Faas, F.F.G.A.; Koster, A.J.; Bárcena, M. A Unifying Structural and Functional Model of the Coronavirus Replication Organelle: Tracking down RNA Synthesis. PLoS Biol. 2020, 18, e3000715. [Google Scholar] [CrossRef]
- Klein, S.; Cortese, M.; Winter, S.L.; Wachsmuth-Melm, M.; Neufeldt, C.J.; Cerikan, B.; Stanifer, M.L.; Boulant, S.; Bartenschlager, R.; Chlanda, P. SARS-CoV-2 Structure and Replication Characterized by in Situ Cryo-Electron Tomography. Nat. Commun. 2020, 11, 5885. [Google Scholar] [CrossRef]
- Cortese, M.; Lee, J.Y.; Cerikan, B.; Neufeldt, C.J.; Oorschot, V.M.J.; Köhrer, S.; Hennies, J.; Schieber, N.L.; Ronchi, P.; Mizzon, G.; et al. Integrative Imaging Reveals SARS-CoV-2-Induced Reshaping of Subcellular Morphologies. Cell Host Microbe 2020, 28, 853–866.e5. [Google Scholar] [CrossRef] [PubMed]
- Wolff, G.; Limpens, R.W.A.L.; Zevenhoven-Dobbe, J.C.; Laugks, U.; Zheng, S.; de Jong, A.W.M.; Koning, R.I.; Agard, D.A.; Grünewald, K.; Koster, A.J.; et al. A Molecular Pore Spans the Double Membrane of the Coronavirus Replication Organelle. Science 2020, 369, 1395–1398. [Google Scholar] [CrossRef] [PubMed]
- Goldsmith, C.S.; Tatti, K.M.; Ksiazek, T.G.; Rollin, P.E.; Comer, J.A.; Lee, W.W.; Rota, P.A.; Bankamp, B.; Bellini, W.J.; Zaki, S.R. Ultrastructural Characterization of SARS Coronavirus. Emerg. Infect. Dis. 2004, 10, 320. [Google Scholar] [CrossRef] [PubMed]
- Ogando, N.S.; Dalebout, T.J.; Zevenhoven-Dobbe, J.C.; Limpens, R.W.A.L.; van der Meer, Y.; Caly, L.; Druce, J.; de Vries, J.J.C.; Kikkert, M.; Barcena, M.; et al. SARS-Coronavirus-2 Replication in Vero E6 Cells: Replication Kinetics, Rapid Adaptation and Cytopathology. J. Gen. Virol. 2020, 101, 925–940. [Google Scholar] [CrossRef] [PubMed]
- Stertz, S.; Reichelt, M.; Spiegel, M.; Kuri, T.; Martínez-Sobrido, L.; García-Sastre, A.; Weber, F.; Kochs, G. The Intracellular Sites of Early Replication and Budding of SARS-Coronavirus. Virology 2007, 361, 304–315. [Google Scholar] [CrossRef] [PubMed]
- Mendonça, L.; Howe, A.; Gilchrist, J.B.; Sheng, Y.; Sun, D.; Knight, M.L.; Zanetti-Domingues, L.C.; Bateman, B.; Krebs, A.S.; Chen, L.; et al. Correlative Multi-Scale Cryo-Imaging Unveils SARS-CoV-2 Assembly and Egress. Nat. Commun. 2021, 12, 4629. [Google Scholar] [CrossRef] [PubMed]
- Ghosh, S.; Dellibovi-Ragheb, T.A.; Kerviel, A.; Pak, E.; Qiu, Q.; Fisher, M.; Takvorian, P.M.; Bleck, C.; Hsu, V.W.; Fehr, A.R.; et al. β-Coronaviruses Use Lysosomes for Egress Instead of the Biosynthetic Secretory Pathway. Cell 2020, 183, 1520. [Google Scholar] [CrossRef]
- Barreto-Vieira, D.F.; da Silva, M.A.N.; de Almeida, A.L.T.; Rasinhas, A.D.C.; Monteiro, M.E.; Miranda, M.D.; Motta, F.C.; Siqueira, M.M.; Girard-Dias, W.; Archanjo, B.S.; et al. SARS-CoV-2: Ultrastructural Characterization of Morphogenesis in an In Vitro System. Viruses 2022, 14, 201. [Google Scholar] [CrossRef]
- Laue, M.; Kauter, A.; Hoffmann, T.; Möller, L.; Michel, J.; Nitsche, A. Morphometry of SARS-CoV and SARS-CoV-2 Particles in Ultrathin Plastic Sections of Infected Vero Cell Cultures. Sci. Rep. 2021, 11, 3515. [Google Scholar] [CrossRef]
- Sabatini, D.D.; Bensch, K.; Barrnett, R.J. Cytochemistry and Electron Microscopy. The Preservation of Cellular Ultrastructure and Enzymatic Activity by Aldehyde Fixation. J. Cell Biol. 1963, 17, 19–58. [Google Scholar] [CrossRef]
- Kellenberger, E. The Potential of Cryofixation and Freeze Substitution: Observations and Theoretical Considerations. J. Microsc. 1991, 161, 183–203. [Google Scholar] [CrossRef] [PubMed]
- Mahamid, J.; Schampers, R.; Persoon, H.; Hyman, A.A.; Baumeister, W.; Plitzko, J.M. A Focused Ion Beam Milling and Lift-out Approach for Site-Specific Preparation of Frozen-Hydrated Lamellas from Multicellular Organisms. J. Struct. Biol. 2015, 192, 262–269. [Google Scholar] [CrossRef] [PubMed]
- Hayles, M.F.; Matthijs de Winter, D.A.; Schneijdenberg, C.T.W.M.; Meeldijk, J.D.; Luecken, U.; Persoon, H.; de Water, J.; de Jong, F.; Humbel, B.M.; Verkleij, A.J. The Making of Frozen-Hydrated, Vitreous Lamellas from Cells for Cryo-Electron Microscopy. J. Struct. Biol. 2010, 172, 180–190. [Google Scholar] [CrossRef] [PubMed]
- Quemin, E.R.J.; MacHala, E.A.; Vollmer, B.; Pražák, V.; Vasishtan, D.; Rosch, R.; Grange, M.; Franken, L.E.; Baker, L.A.; Grünewald, K. Cellular Electron Cryo-Tomography to Study Virus-Host Interactions. Annu. Rev. Virol. 2020, 7, 239–262. [Google Scholar] [CrossRef] [PubMed]
- Saibil, H.R. Cryo-EM in Molecular and Cellular Biology. Mol. Cell 2022, 82, 274–284. [Google Scholar] [CrossRef]
- Weissenberger, G.; Henderikx, R.J.M.; Peters, P.J. Understanding the Invisible Hands of Sample Preparation for Cryo-EM. Nat. Methods 2021, 18, 463–471. [Google Scholar] [CrossRef]
- Kuba, J.; Mitchels, J.; Hovorka, M.; Erdmann, P.; Berka, L.; Kirmse, R.; König, J.; de Bock, J.; Goetze, B.; Rigort, A. Advanced Cryo-Tomography Workflow Developments—Correlative Microscopy, Milling Automation and Cryo-Lift-Out. J. Microsc. 2021, 281, 112–124. [Google Scholar] [CrossRef]
- Adrian, M.; Dubochet, J.; Lepault, J.; McDowall, A.W. Cryo-Electron Microscopy of Viruses. Nature 1984, 308, 32–36. [Google Scholar] [CrossRef]
- Shepherd, D.C.; Dalvi, S.; Ghosal, D. From Cells to Atoms: Cryo-EM as an Essential Tool to Investigate Pathogen Biology, Host–Pathogen Interaction, and Drug Discovery. Mol. Microbiol. 2022, 117, 610–617. [Google Scholar] [CrossRef]
- Read, C.; Schauflinger, M.; Nikolaenko, D.; Walther, P.; von Einem, J. Regulation of Human Cytomegalovirus Secondary Envelopment by a C-Terminal Tetralysine Motif in PUL71. J. Virol. 2019, 93, e02244-18. [Google Scholar] [CrossRef]
- Read, C.; Walther, P.; von Einem, J. Quantitative Electron Microscopy to Study HCMV Morphogenesis. Methods Mol. Biol. 2021, 2244, 265–289. [Google Scholar] [CrossRef] [PubMed]
- Walther, P.; Ziegler, A. Freeze Substitution of High-Pressure Frozen Samples: The Visibility of Biological Membranes Is Improved When the Substitution Medium Contains Water. J. Microsc. 2002, 208, 3–10. [Google Scholar] [CrossRef] [PubMed]
- Schindelin, J.; Arganda-Carreras, I.; Frise, E.; Kaynig, V.; Longair, M.; Pietzsch, T.; Preibisch, S.; Rueden, C.; Saalfeld, S.; Schmid, B.; et al. Fiji: An Open-Source Platform for Biological-Image Analysis. Nat. Methods 2012, 9, 676–682. [Google Scholar] [CrossRef] [PubMed]
- Kremer, J.R.; Mastronarde, D.N.; McIntosh, J.R. Computer Visualization of Three-Dimensional Image Data Using IMOD. J. Struct. Biol. 1996, 116, 71–76. [Google Scholar] [CrossRef] [PubMed]
- Snijder, E.J.; van der Meer, Y.; Zevenhoven-Dobbe, J.; Onderwater, J.J.M.; van der Meulen, J.; Koerten, H.K.; Mommaas, A.M. Ultrastructure and Origin of Membrane Vesicles Associated with the Severe Acute Respiratory Syndrome Coronavirus Replication Complex. J. Virol. 2006, 80, 5927–5940. [Google Scholar] [CrossRef] [PubMed]
- Schlegel, A.; Giddings, T.H.; Ladinsky, M.S.; Kirkegaard, K. Cellular Origin and Ultrastructure of Membranes Induced during Poliovirus Infection. J. Virol. 1996, 70, 6576–6588. [Google Scholar] [CrossRef]
- Romero-Brey, I.; Bartenschlager, R. Viral Infection at High Magnification: 3D Electron Microscopy Methods to Analyze the Architecture of Infected Cells. Viruses 2015, 7, 6316–6345. [Google Scholar] [CrossRef]
- Szczesny, P.J.; Walther, P.; Müller, M. Light Damage in Rod Outer Segments: The Effects of Fixation on Ultrastructural Alterations. Curr. Res. 2009, 15, 807–814. [Google Scholar] [CrossRef]
- Tang, T.; Bidon, M.; Jaimes, J.A.; Whittaker, G.R.; Daniel, S. Coronavirus Membrane Fusion Mechanism Offers a Potential Target for Antiviral Development. Antivir. Res. 2020, 178, 104792. [Google Scholar] [CrossRef]
- Scherer, K.M.; Mascheroni, L.; Carnell, G.W.; S Wunderlich, L.C.; Makarchuk, S.; Brockhoff, M.; Mela, I.; Fernandez-Villegas, A.; Barysevich, M.; Stewart, H.; et al. SARS-CoV-2 Nucleocapsid Protein Adheres to Replication Organelles before Viral Assembly at the Golgi/ERGIC and Lysosome-Mediated Egress. Sci. Adv. 2022, 8, 4895. [Google Scholar] [CrossRef]
- Gorshkov, K.; Chen, C.Z.; Bostwick, R.; Rasmussen, L.; Tran, B.N.; Cheng, Y.S.; Xu, M.; Pradhan, M.; Henderson, M.; Zhu, W.; et al. The SARS-CoV-2 Cytopathic Effect Is Blocked by Lysosome Alkalizing Small Molecules. ACS Infect. Dis. 2021, 7, 1389–1408. [Google Scholar] [CrossRef]
- Chen, D.; Zheng, Q.; Sun, L.; Ji, M.; Li, Y.; Deng, H.; Zhang, H. ORF3a of SARS-CoV-2 Promotes Lysosomal Exocytosis-Mediated Viral Egress. Dev. Cell 2021, 56, 3250–3263.e5. [Google Scholar] [CrossRef]
- Stewart, H.; Johansen, K.H.; McGovern, N.; Palmulli, R.; Carnell, G.W.; Heeney, J.L.; Okkenhaug, K.; Firth, A.E.; Peden, A.A.; Edgar, J.R. SARS-CoV-2 Spike Downregulates Tetherin to Enhance Viral Spread. bioRxiv 2021. [Google Scholar] [CrossRef]
- Taylor, J.K.; Coleman, C.M.; Postel, S.; Sisk, J.M.; Bernbaum, J.G.; Venkataraman, T.; Sundberg, E.J.; Frieman, M.B. Severe Acute Respiratory Syndrome Coronavirus ORF7a Inhibits Bone Marrow Stromal Antigen 2 Virion Tethering through a Novel Mechanism of Glycosylation Interference. J. Virol. 2015, 89, 11820–11833. [Google Scholar] [CrossRef]
- Neil, S.J.D.; Zang, T.; Bieniasz, P.D. Tetherin Inhibits Retrovirus Release and Is Antagonized by HIV-1 Vpu. Nature 2008, 451, 425–430. [Google Scholar] [CrossRef]
- Hammonds, J.; Wang, J.J.; Yi, H.; Spearman, P. Immunoelectron Microscopic Evidence for Tetherin/BST2 as the Physical Bridge between HIV-1 Virions and the Plasma Membrane. PLoS Pathog. 2010, 6, e1000749. [Google Scholar] [CrossRef]
- Martin-Sancho, L.; Lewinski, M.K.; Pache, L.; Stoneham, C.A.; Yin, X.; Becker, M.E.; Pratt, D.; Churas, C.; Rosenthal, S.B.; Liu, S.; et al. Functional Landscape of SARS-CoV-2 Cellular Restriction. Mol. Cell 2021, 81, 2656–2668.e8. [Google Scholar] [CrossRef]
- Brahim Belhaouari, D.; Fontanini, A.; Baudoin, J.P.; Haddad, G.; le Bideau, M.; Bou Khalil, J.Y.; Raoult, D.; la Scola, B. The Strengths of Scanning Electron Microscopy in Deciphering SARS-CoV-2 Infectious Cycle. Front. Microbiol. 2020, 11, 2014. [Google Scholar] [CrossRef]
- Fawcett, D. An Atlas of Fine Structure: The Cell, Its Organelles, and Inclusions; Saunders: London, UK, 1967. [Google Scholar]
- Livanos, A.E.; Jha, D.; Cossarini, F.; Gonzalez-Reiche, A.S.; Tokuyama, M.; Aydillo, T.; Parigi, T.L.; Ladinsky, M.S.; Ramos, I.; Dunleavy, K.; et al. Intestinal Host Response to SARS-CoV-2 Infection and COVID-19 Outcomes in Patients with Gastrointestinal Symptoms. Gastroenterology 2021, 160, 2435–2450.e34. [Google Scholar] [CrossRef]
- Studer, D.; Muller, M.; Michel, M. High Pressure Freezing Comes of Age. Scanning Microsc. Suppl. 1989, 3, 253–268; discussion 268. [Google Scholar]
- Buser, C.; Walther, P. Freeze-Substitution: The Addition of Water to Polar Solvents Enhances the Retention of Structure and Acts at Temperatures around –60 °C. J. Microsc. 2008, 230, 268–277. [Google Scholar] [CrossRef]
- Shimoni, K.; Müller, M. On Optimizing High-Pressure Freezing: From Heat Transfer Theory to a New Microbiopsy Device. J. Microsc. 1998, 192, 236–247. [Google Scholar] [CrossRef]
- Villinger, C.; Schauflinger, M.; Gregorius, H.; Kranz, C.; Höhn, K.; Nafeey, S.; Walther, P. Three-Dimensional Imaging of Adherent Cells Using FIB/SEM and STEM. Methods Mol. Biol. 2014, 1117, 617–638. [Google Scholar] [CrossRef]
- Hartenian, E.; Nandakumar, D.; Lari, A.; Ly, M.; Tucker, J.M.; Glaunsinger, B.A. The Molecular Virology of Coronaviruses. J. Biol. Chem. 2020, 295, 12910–12934. [Google Scholar] [CrossRef]
- Zhang, Z.; Nomura, N.; Muramoto, Y.; Ekimoto, T.; Uemura, T.; Liu, K.; Yui, M.; Kono, N.; Aoki, J.; Ikeguchi, M.; et al. Structure of SARS-CoV-2 Membrane Protein Essential for Virus Assembly. Nat. Commun. 2022, 13, 1–12. [Google Scholar] [CrossRef]


Publisher’s Note: MDPI stays neutral with regard to jurisdictional claims in published maps and institutional affiliations. |
© 2022 by the authors. Licensee MDPI, Basel, Switzerland. This article is an open access article distributed under the terms and conditions of the Creative Commons Attribution (CC BY) license (https://creativecommons.org/licenses/by/4.0/).
Share and Cite
Bergner, T.; Zech, F.; Hirschenberger, M.; Stenger, S.; Sparrer, K.M.J.; Kirchhoff, F.; Read, C. Near-Native Visualization of SARS-CoV-2 Induced Membrane Remodeling and Virion Morphogenesis. Viruses 2022, 14, 2786. https://doi.org/10.3390/v14122786
Bergner T, Zech F, Hirschenberger M, Stenger S, Sparrer KMJ, Kirchhoff F, Read C. Near-Native Visualization of SARS-CoV-2 Induced Membrane Remodeling and Virion Morphogenesis. Viruses. 2022; 14(12):2786. https://doi.org/10.3390/v14122786
Chicago/Turabian StyleBergner, Tim, Fabian Zech, Maximilian Hirschenberger, Steffen Stenger, Konstantin M. J. Sparrer, Frank Kirchhoff, and Clarissa Read. 2022. "Near-Native Visualization of SARS-CoV-2 Induced Membrane Remodeling and Virion Morphogenesis" Viruses 14, no. 12: 2786. https://doi.org/10.3390/v14122786