
Evolutionary Pattern Comparisons of the SARS-CoV-2 Delta Variant in Countries/Regions with High and Low Vaccine Coverage
 , and
, and 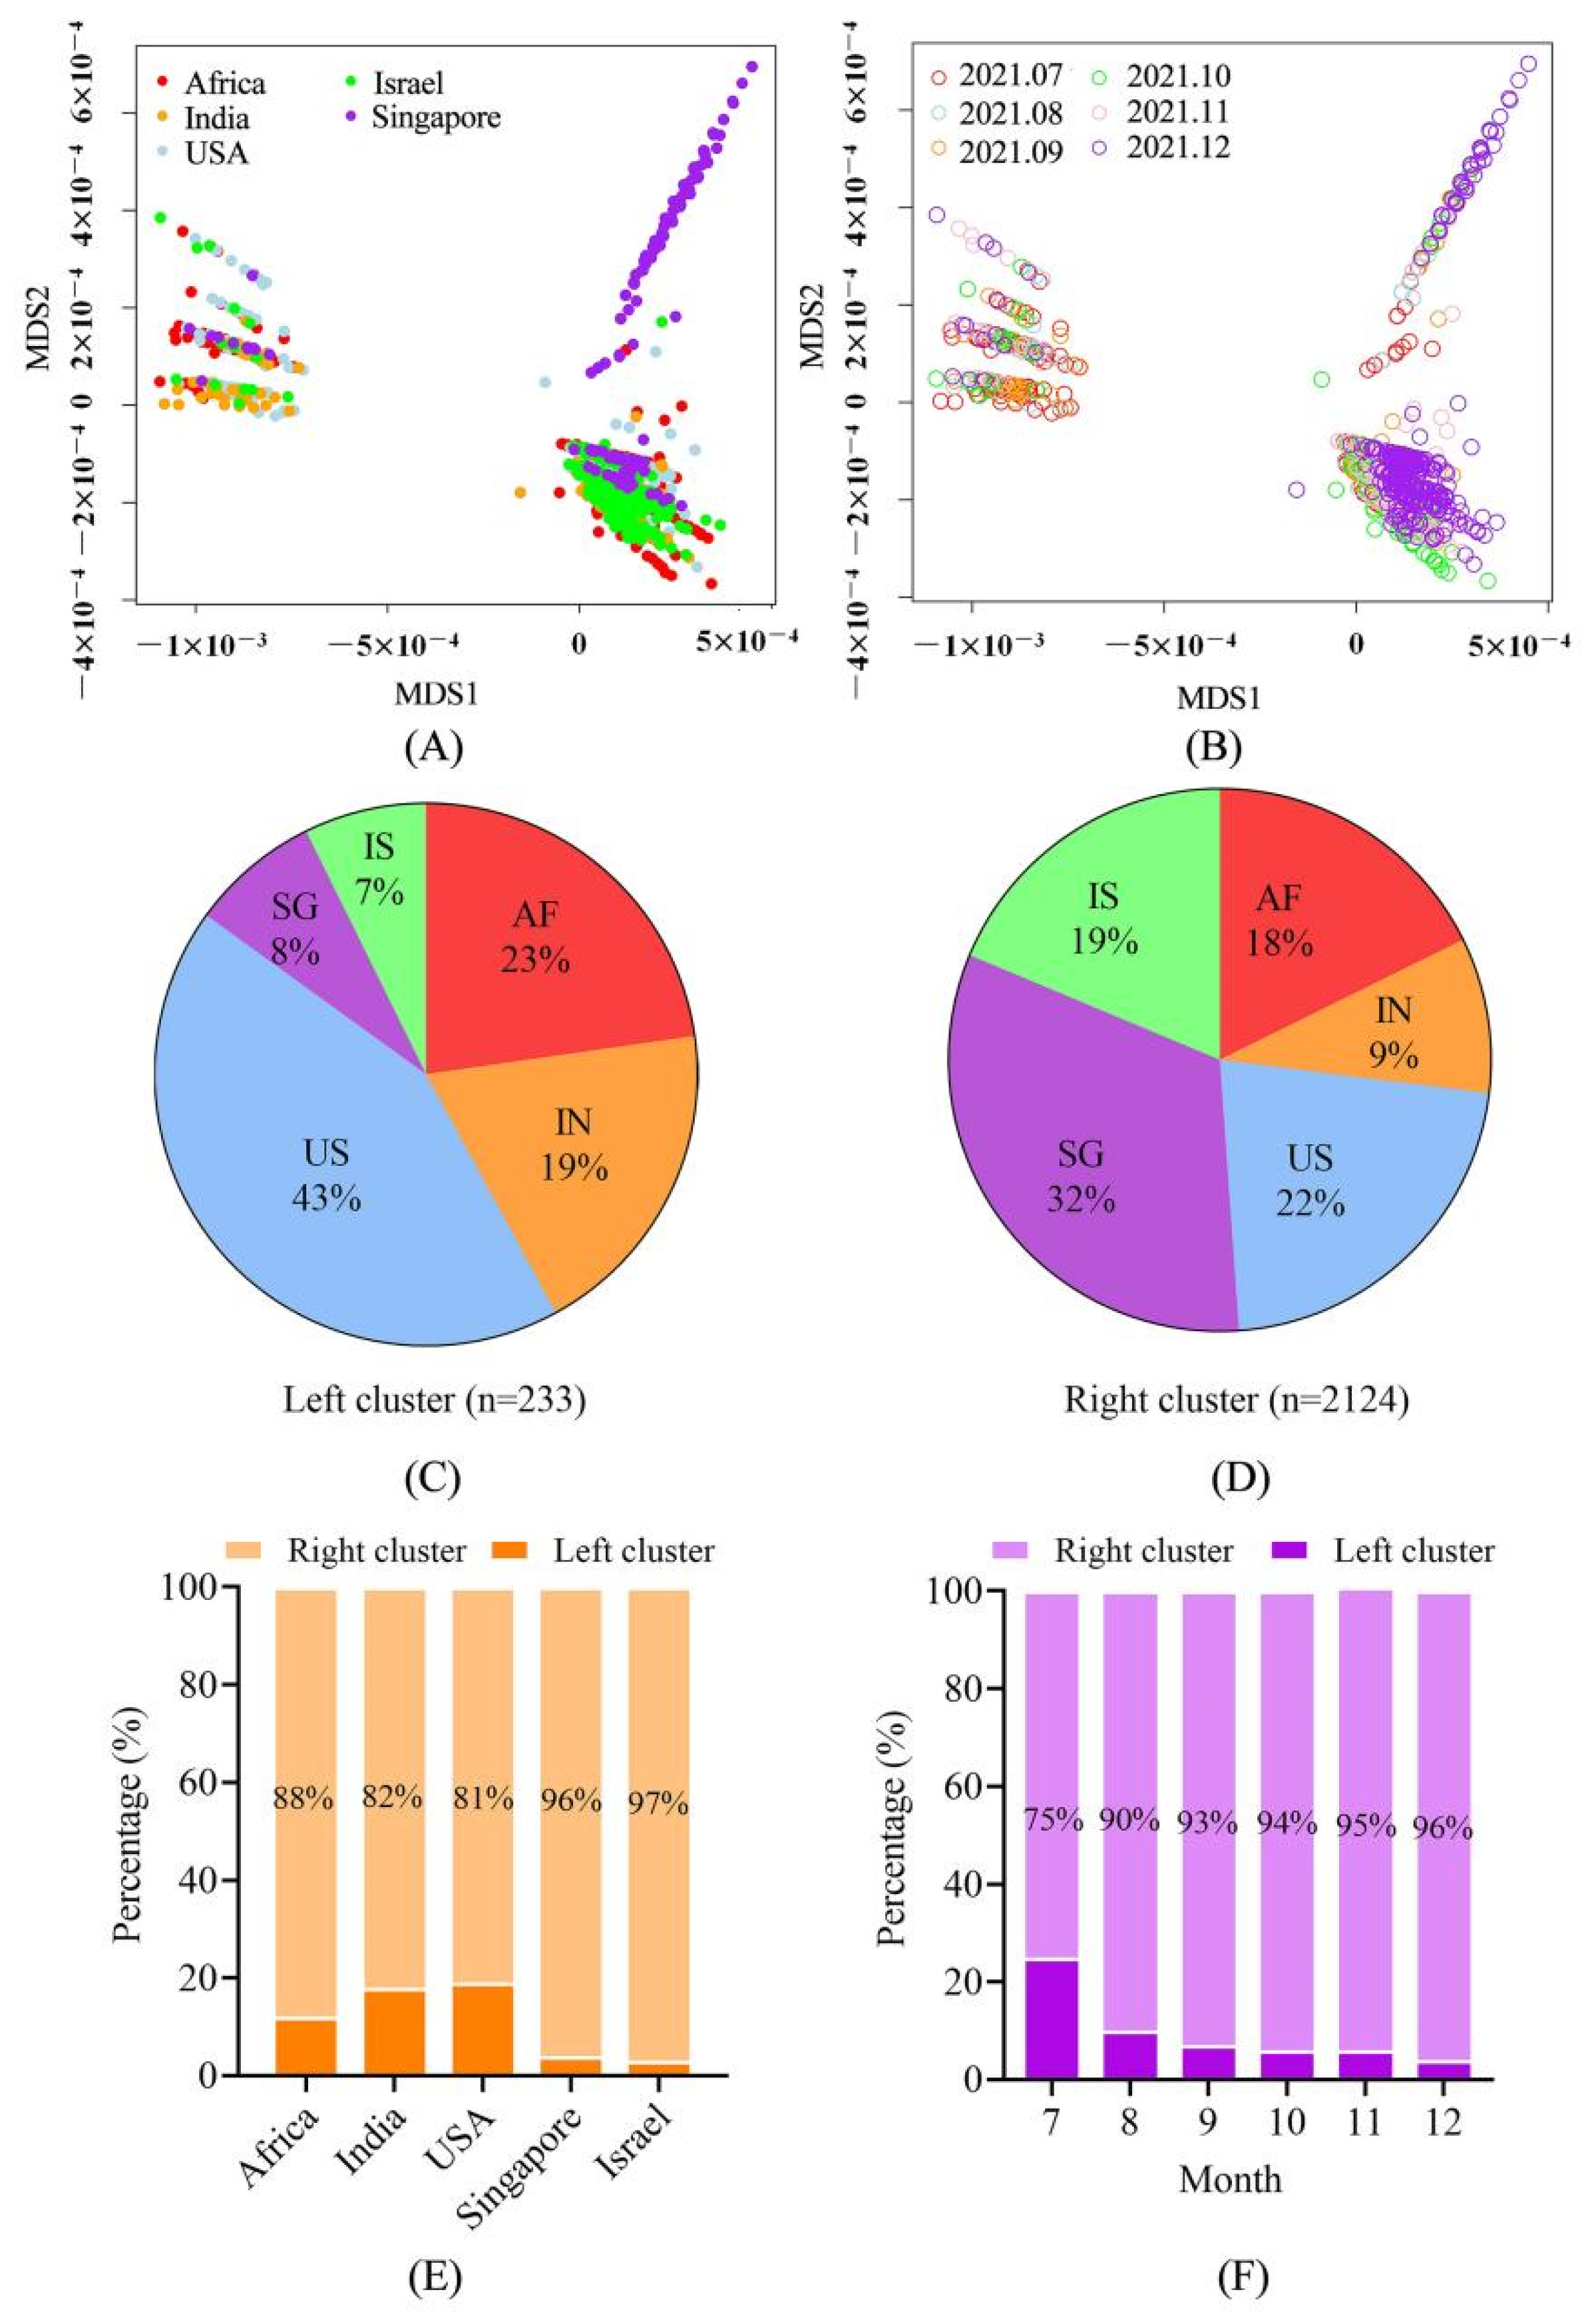
Abstract
:1. Author Summary
2. Introduction
3. Materials and Methods
3.1. Sequence Retrieval and Selection
3.2. Sequence Alignment and Data Set Clustering
3.3. Root-to-Tip Divergence
3.4. Shannon Entropy Calculation
3.5. SNP Calling and Co-Mutation Analysis
3.6. Selective Pressure Analysis
3.7. Structure-Based Affinity Prediction
4. Results
4.1. Sequence Information
4.2. The Sequences Were Grouped into Two Large Clusters and the R Cluster Was Dominant
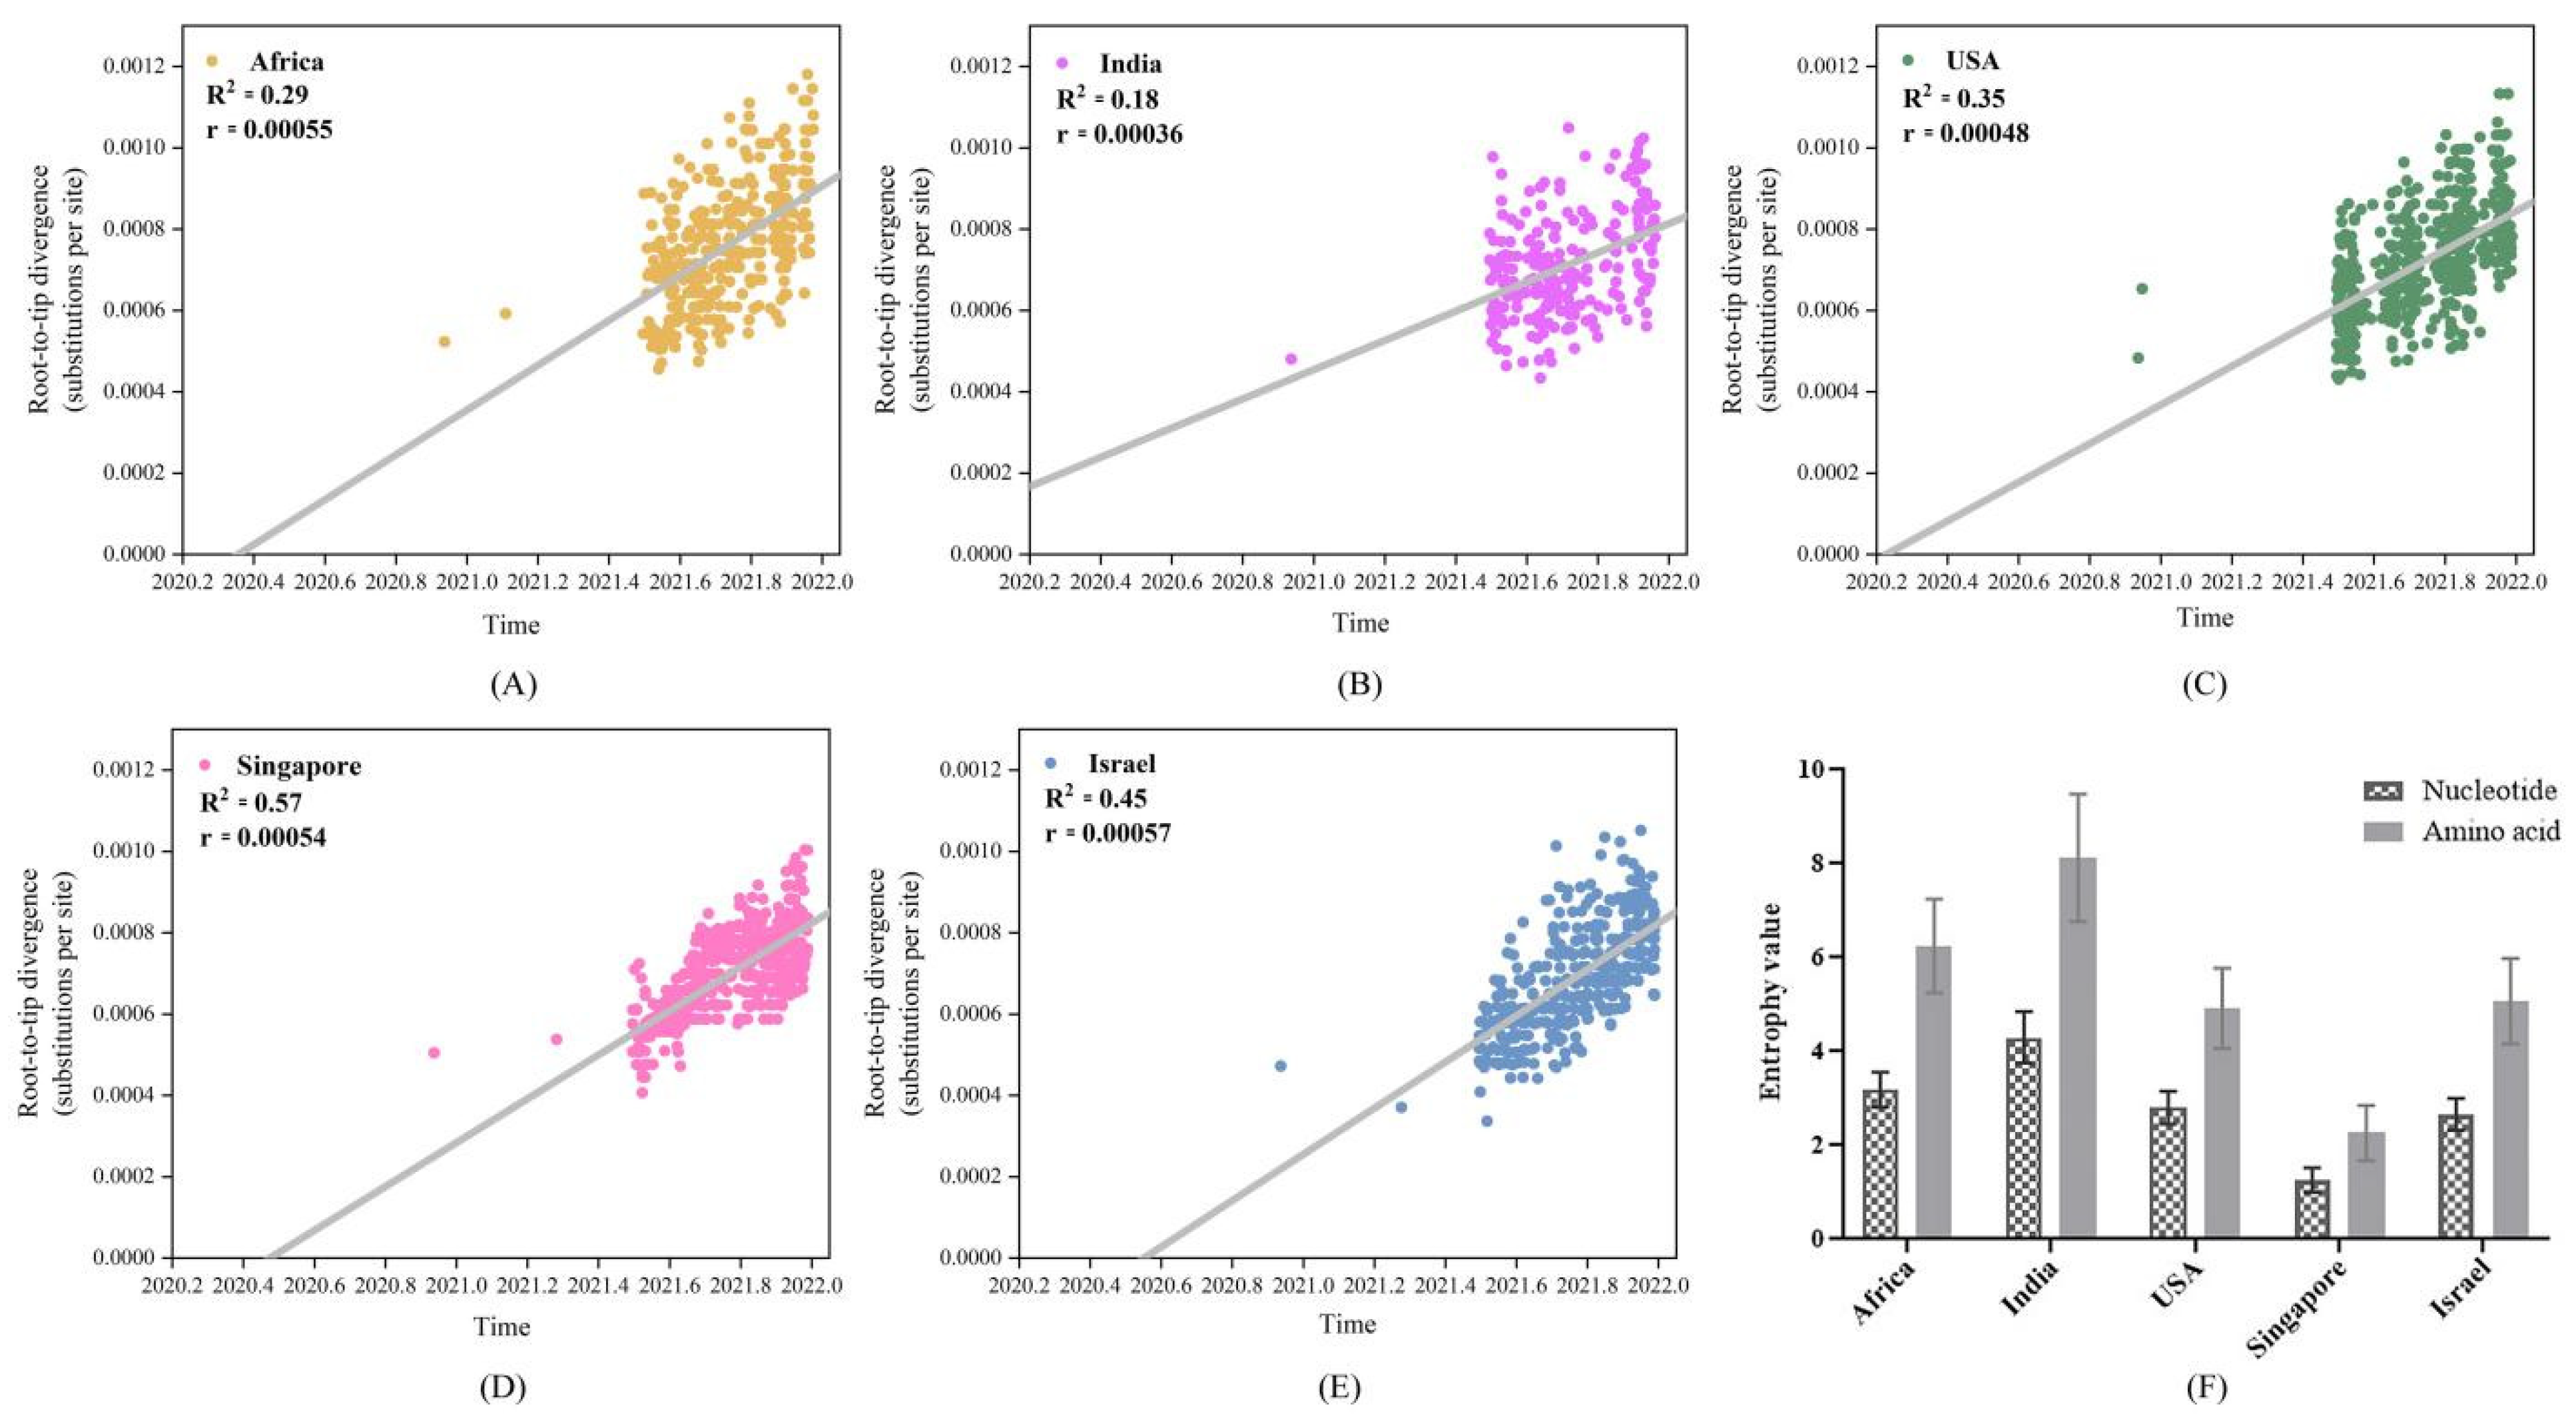
4.3. Low Vaccinated Countries/Regions Sequences Exhibited High Genetic Divergence
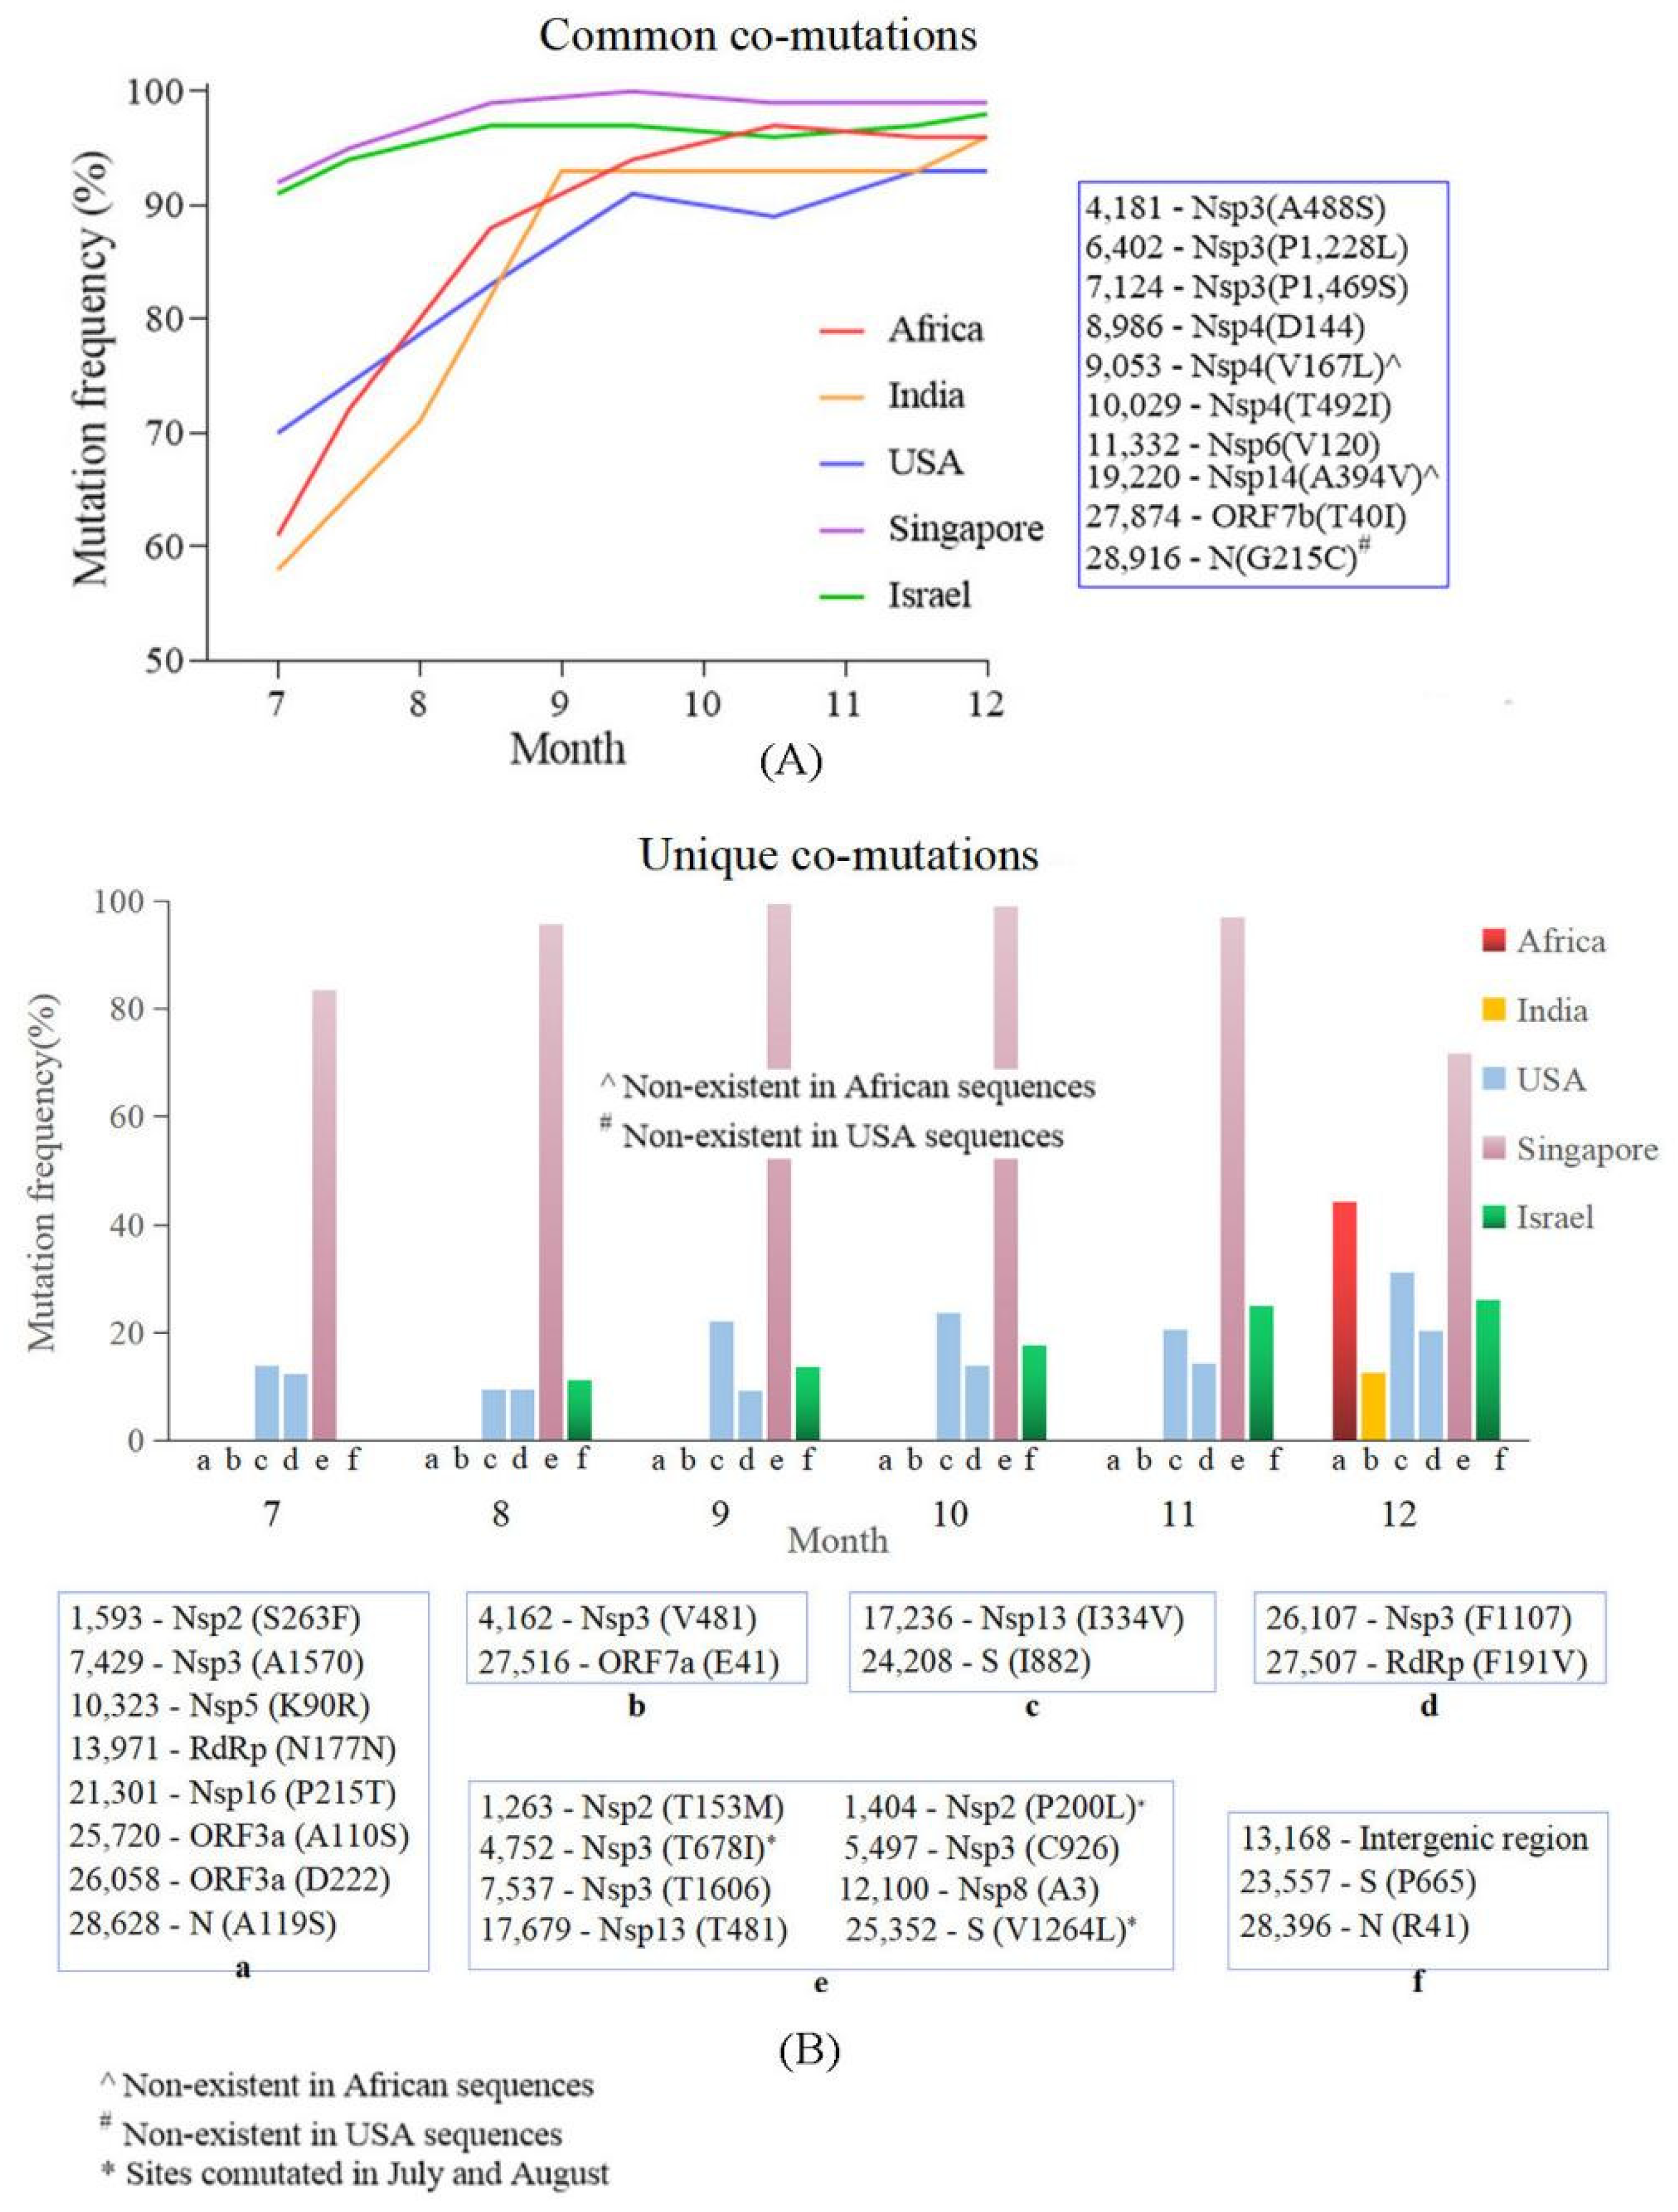
4.4. Common Co-Mutation and Region Unique Co-Mutations Were Detected in the Countries/Regions with High and Low Vaccine Coverage
4.5. Distribution of Positively Selected Sites and Mutations in m6a Sites May Reflect Population Immunized Status
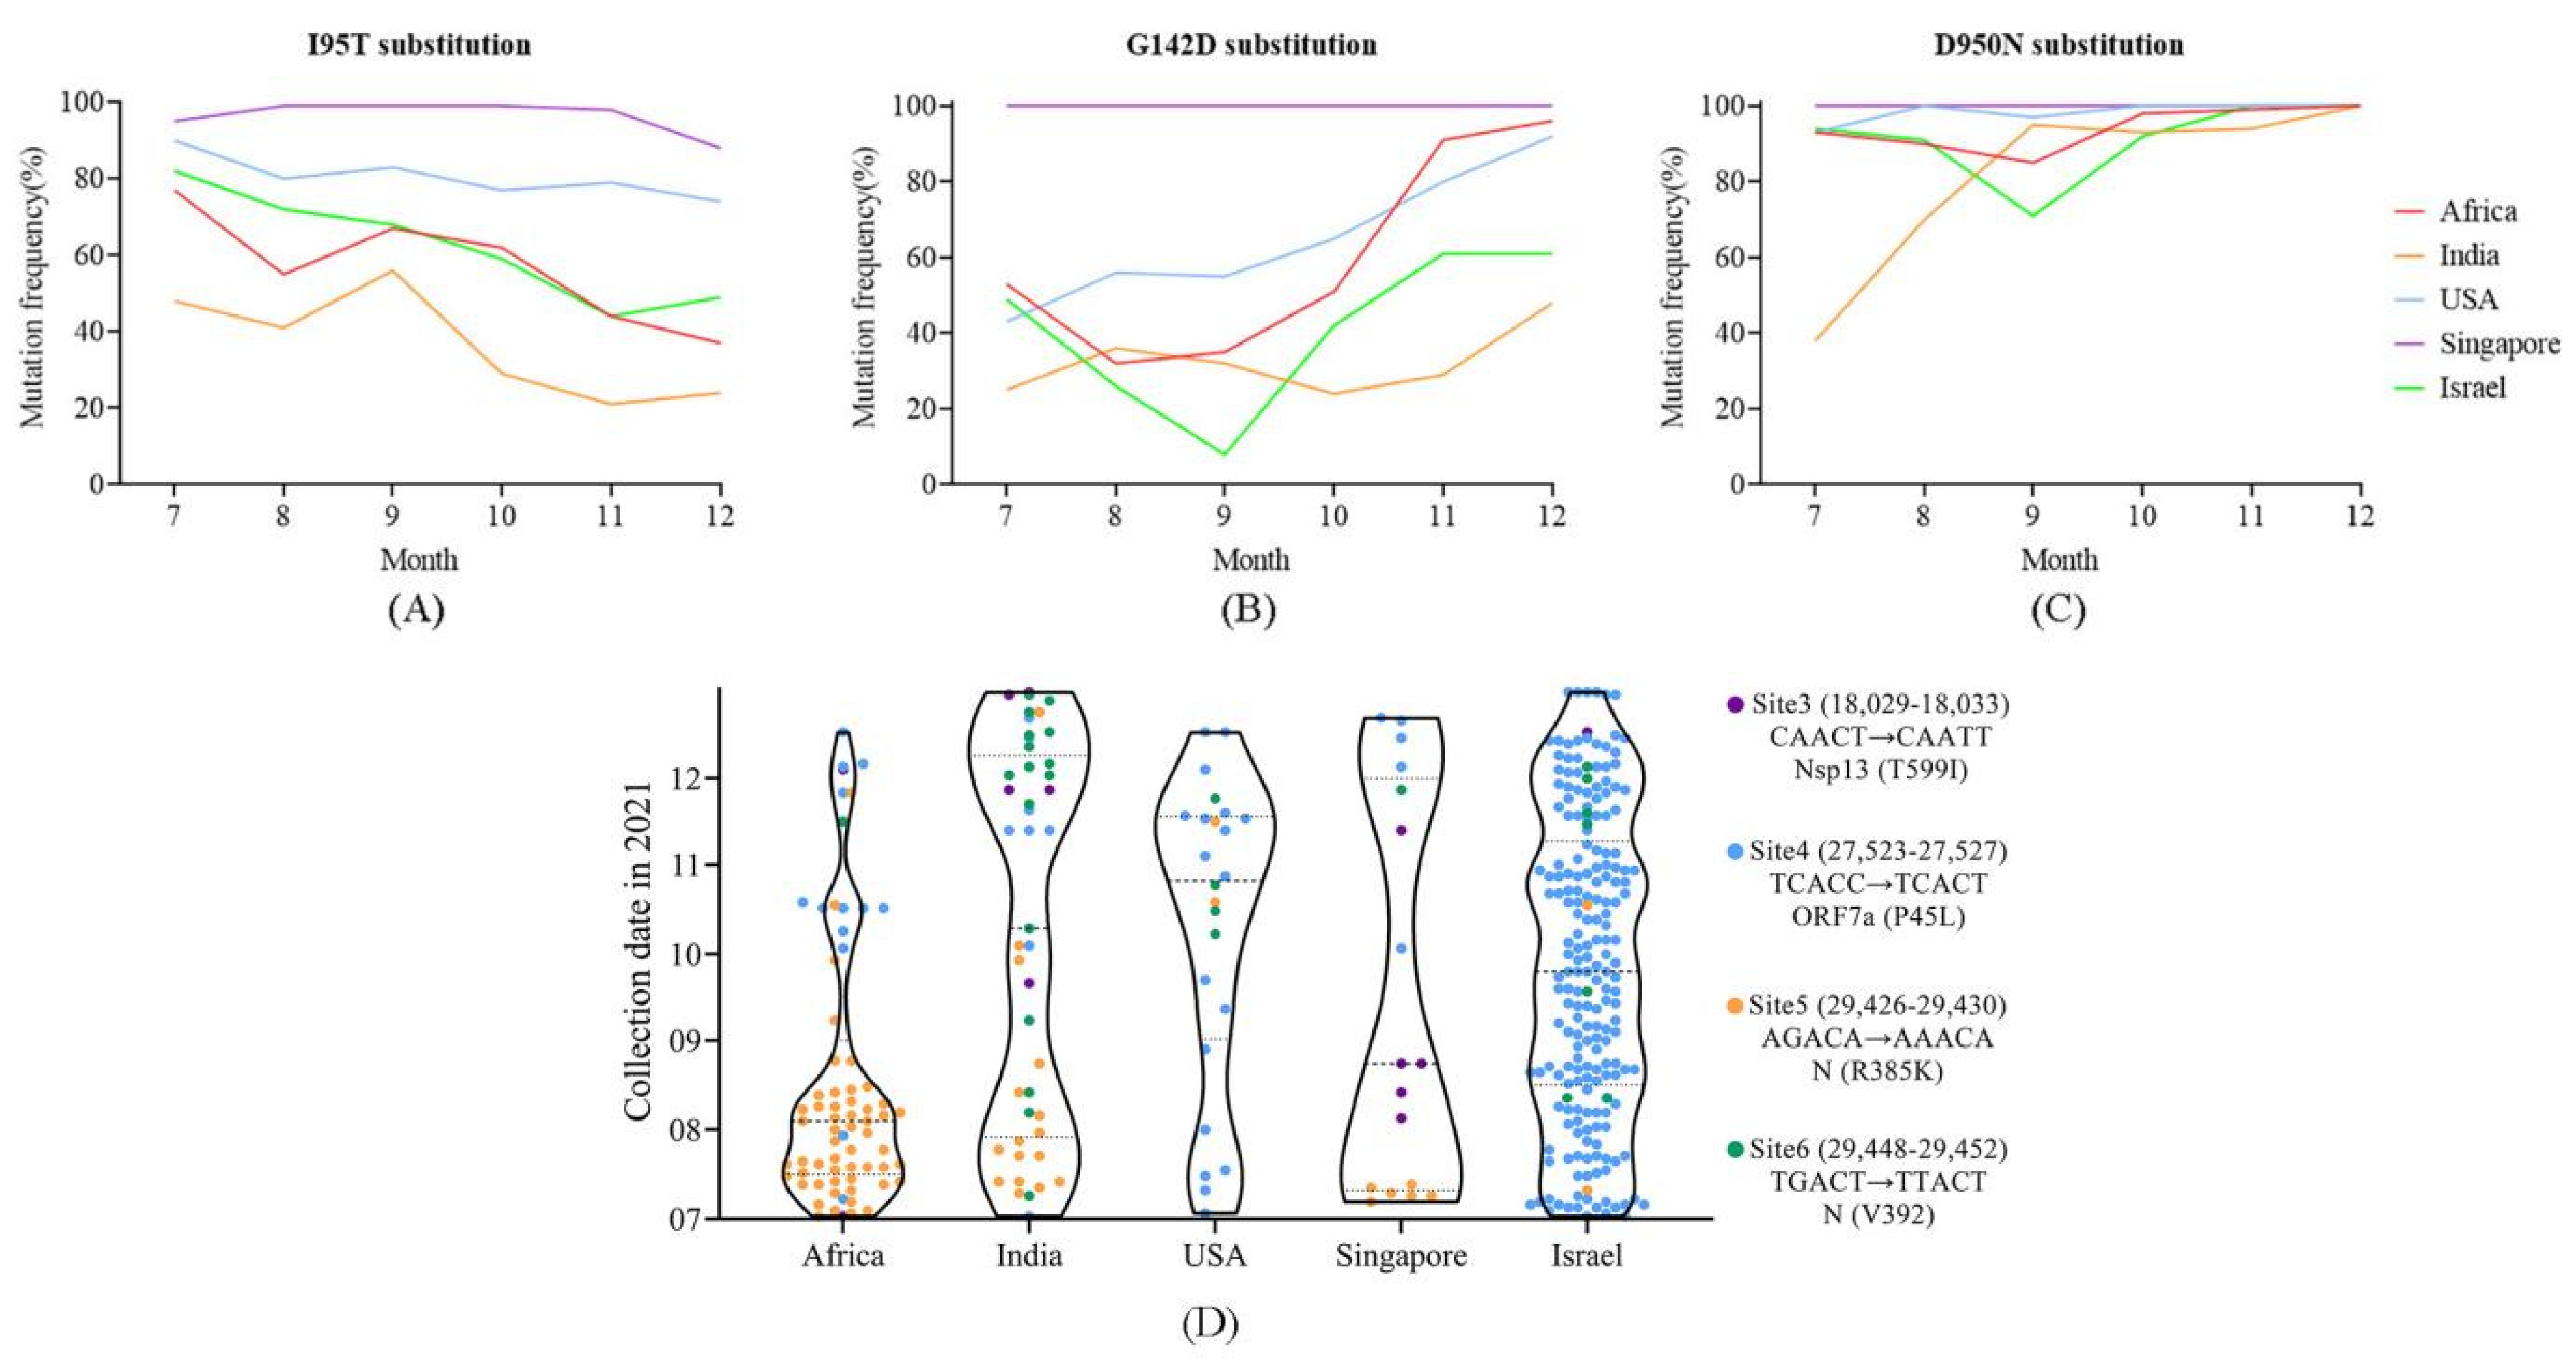
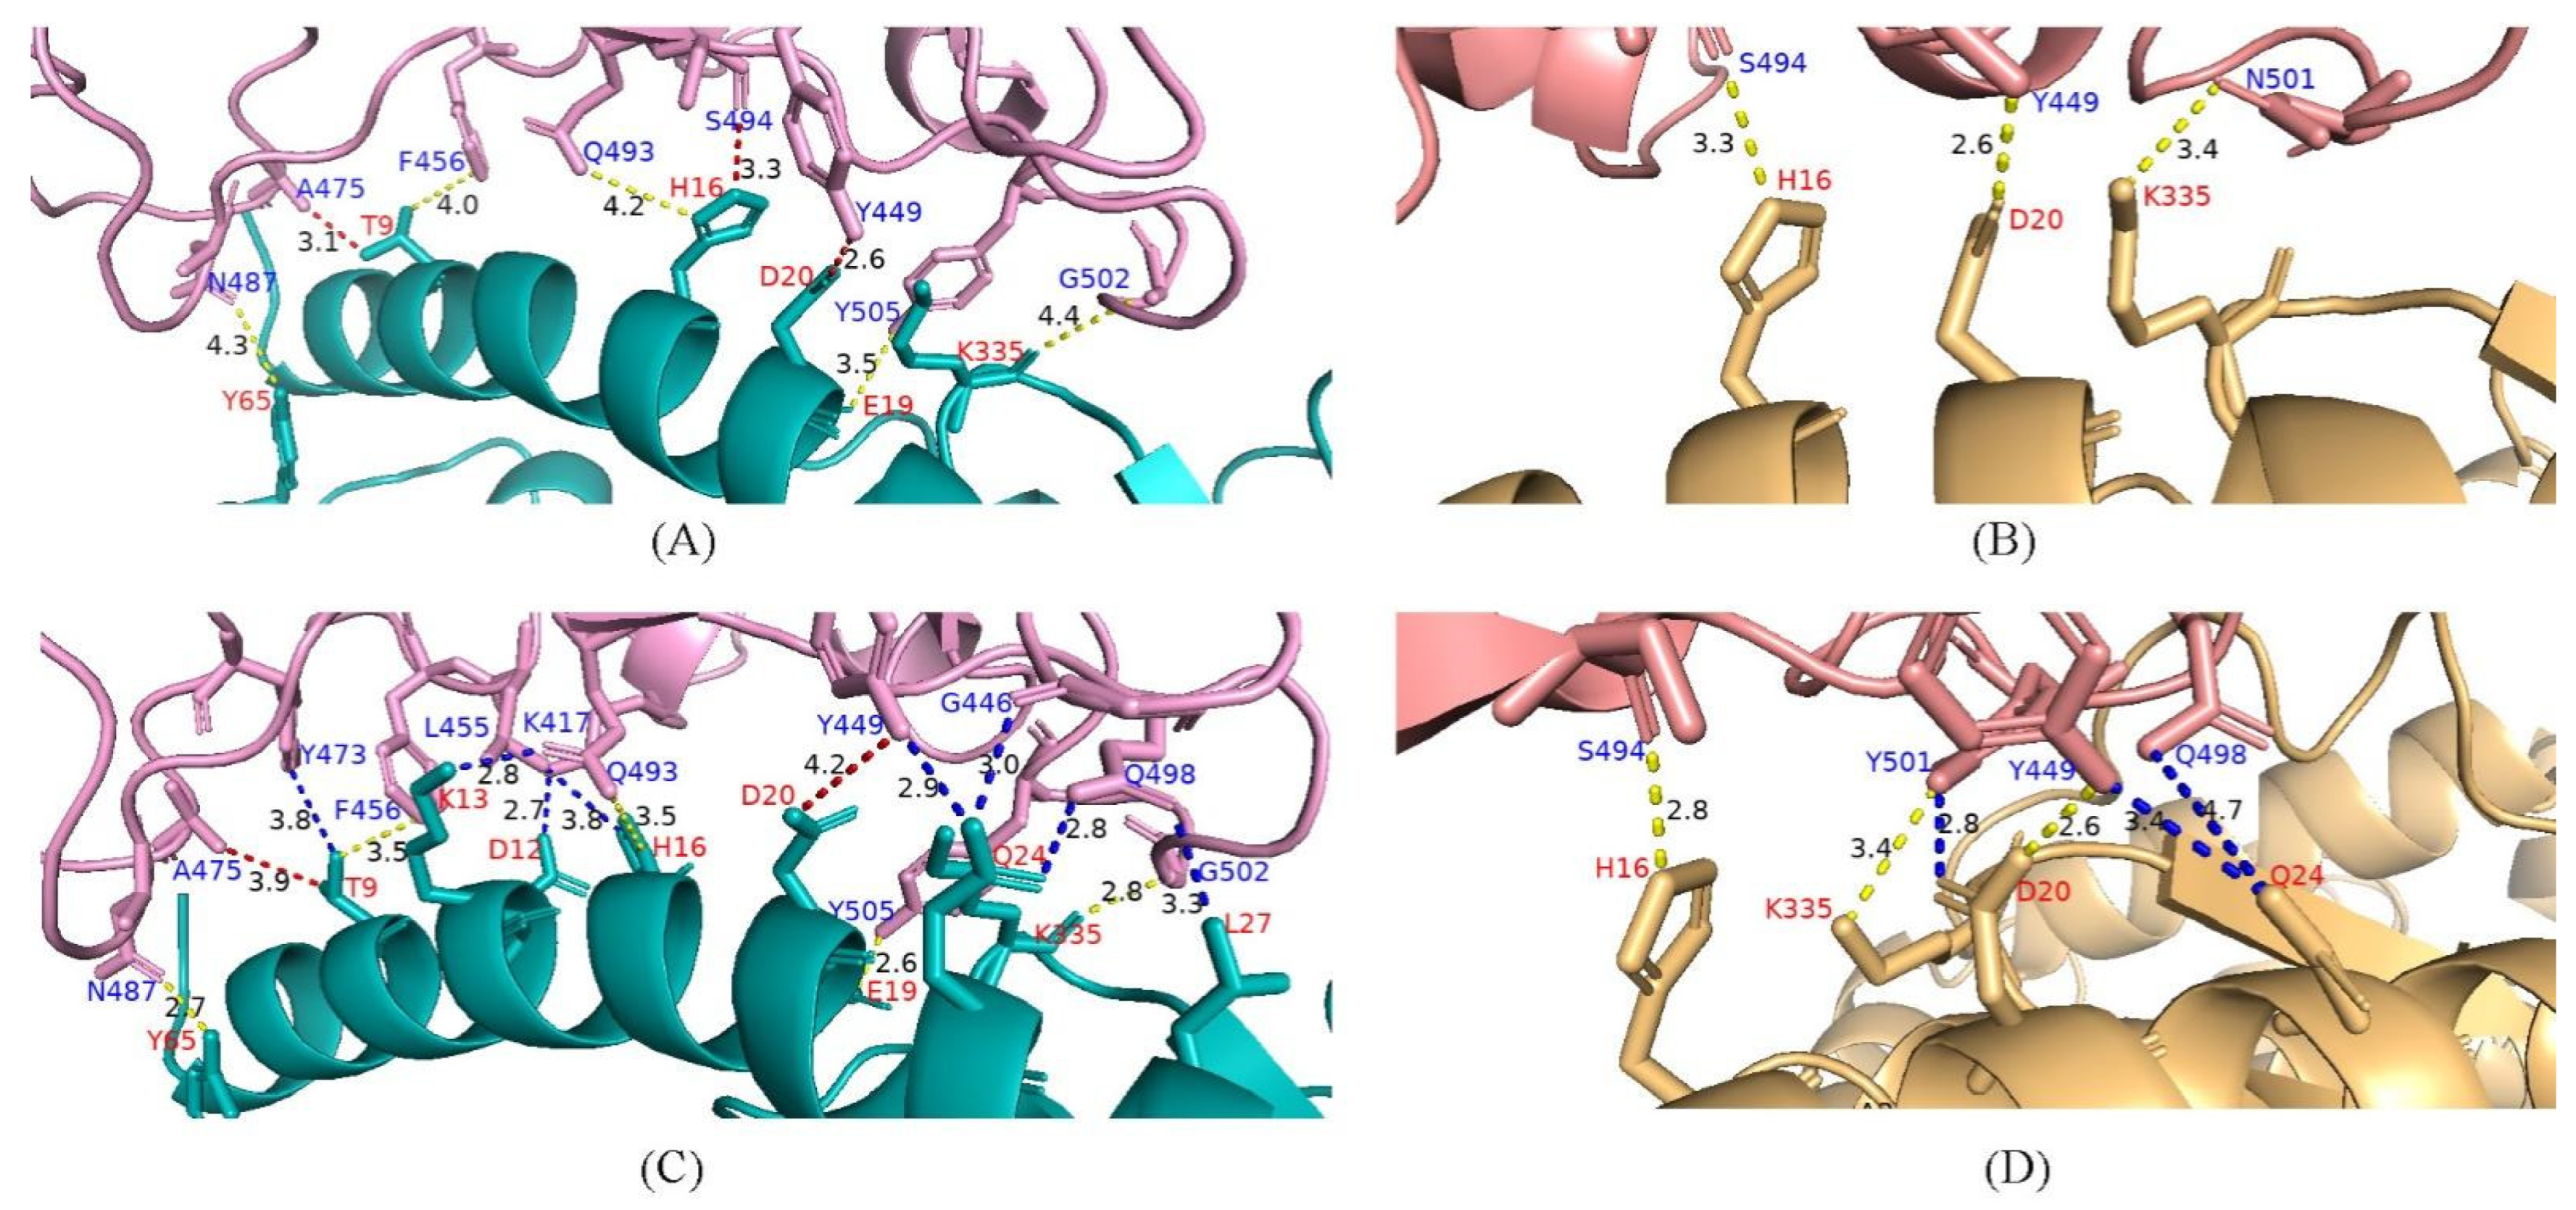
4.6. Potential Enhanced Receptor Binding Ability of Substitutions in the RBD Key Site
5. Discussion
Supplementary Materials
Author Contributions
Funding
Institutional Review Board Statement
Informed Consent Statement
Data Availability Statement
Conflicts of Interest
References
- Pawlowski, C.; Lenehan, P.; Puranik, A.; Agarwal, V.; Venkatakrishnan, A.J.; Niesen, M.J.M.; O’Horo, J.C.; Virk, A.; Swift, M.D.; Badley, A.D.; et al. FDA-authorized mRNA COVID-19 vaccines are effective per real-world evidence synthesized across a multi-state health system. Med 2021, 2, 979–992. [Google Scholar] [CrossRef] [PubMed]
- Liu, Q.; Qin, C.; Liu, M.; Liu, J. Effectiveness and safety of SARS-CoV-2 vaccine in real-world studies: A systematic review and meta-analysis. Infect. Dis. Poverty 2021, 10, 132. [Google Scholar] [CrossRef] [PubMed]
- Pormohammad, A.; Zarei, M.; Ghorbani, S.; Mohammadi, M.; Razizadeh, M.H.; Turner, D.L.; Turner, R.J. Efficacy and Safety of COVID-19 Vaccines: A Systematic Review and Meta-Analysis of Randomized Clinical Trials. Vaccines 2021, 9, 467. [Google Scholar] [CrossRef] [PubMed]
- Chen, J.; Wang, R.; Gilby, N.B.; Wei, G.W. Omicron Variant (B.1.1.529): Infectivity, Vaccine Breakthrough, and Antibody Resistance. J. Chem. Inf. Model 2022, 62, 412–422. [Google Scholar] [CrossRef] [PubMed]
- Kirby, T. New variant of SARS-CoV-2 in UK causes surge of COVID-19. Lancet Respir. Med. 2021, 9, e20–e21. [Google Scholar] [CrossRef]
- Reardon, S. How the Delta variant achieves its ultrafast spread. Nature 2021. Epub ahead of print. [Google Scholar] [CrossRef]
- Lipsitch, M.; Krammer, F.; Regev-Yochay, G.; Lustig, Y.; Balicer, R.D. SARS-CoV-2 breakthrough infections in vaccinated individuals: Measurement, causes and impact. Nat. Rev. Immunol. 2022, 22, 57–65. [Google Scholar] [CrossRef]
- Yao, H.; Song, Y.; Chen, Y.; Wu, N.; Xu, J.; Sun, C.; Zhang, J.; Weng, T.; Zhang, Z.; Wu, Z.; et al. Molecular Architecture of the SARS-CoV-2 Virus. Cell 2020, 183, 730–738.e13. [Google Scholar] [CrossRef]
- Worobey, M.; Pekar, J.; Larsen, B.B.; Nelson, M.I.; Hill, V.; Joy, J.B.; Rambaut, A.; Suchard, M.A.; Wertheim, J.O.; Lemey, P. The emergence of SARS-CoV-2 in Europe and North America. Science 2020, 370, 564–570. [Google Scholar] [CrossRef]
- Volz, E.; Hill, V.; McCrone, J.T.; Price, A.; Jorgensen, D.; O’Toole, A.; Southgate, J.; Johnson, R.; Jackson, B.; Nascimento, F.F.; et al. Evaluating the Effects of SARS-CoV-2 Spike Mutation D614G on Transmissibility and Pathogenicity. Cell 2021, 184, 64–75.e11. [Google Scholar] [CrossRef]
- Zhou, B.; Thao, T.T.N.; Hoffmann, D.; Taddeo, A.; Ebert, N.; Labroussaa, F.; Pohlmann, A.; King, J.; Steiner, S.; Kelly, J.N.; et al. SARS-CoV-2 spike D614G change enhances replication and transmission. Nature 2021, 592, 122–127. [Google Scholar] [CrossRef] [PubMed]
- Thomson, E.C.; Rosen, L.E.; Shepherd, J.G.; Spreafico, R.; da Silva Filipe, A.; Wojcechowskyj, J.A.; Davis, C.; Piccoli, L.; Pascall, D.J.; Dillen, J.; et al. Circulating SARS-CoV-2 spike N439K variants maintain fitness while evading antibody-mediated immunity. Cell 2021, 184, 1171–1187.e20. [Google Scholar] [CrossRef] [PubMed]
- Jalali, N.; Brustad, H.K.; Frigessi, A.; MacDonald, E.A.; Meijerink, H.; Feruglio, S.L.; Nygard, K.M.; Ro, G.; Madslien, E.H.; de Blasio, B.F. Increased household transmission and immune escape of the SARS-CoV-2 Omicron compared to Delta variants. Nat. Commun. 2022, 13, 5706. [Google Scholar] [CrossRef] [PubMed]
- Lyngse, F.P.; Kirkeby, C.T.; Denwood, M.; Christiansen, L.E.; Molbak, K.; Moller, C.H.; Skov, R.L.; Krause, T.G.; Rasmussen, M.; Sieber, R.N.; et al. Household transmission of SARS-CoV-2 Omicron variant of concern subvariants BA.1 and BA.2 in Denmark. Nat. Commun. 2022, 13, 5760. [Google Scholar] [CrossRef] [PubMed]
- Ahmad, L. Implication of SARS-CoV-2 Immune Escape Spike Variants on Secondary and Vaccine Breakthrough Infections. Front. Immunol. 2021, 12, 742167. [Google Scholar] [CrossRef]
- Burki, T.K. Fourth dose of COVID-19 vaccines in Israel. Lancet Respir. Med. 2022, 10, e19. [Google Scholar] [CrossRef]
- Bieniasz, P.D. The Case Against Delaying Severe Acute Respiratory Syndrome Coronavirus 2 (SARS-CoV-2) mRNA Vaccine Boosting Doses. Clin. Infect. Dis. 2021, 73, 1321–1323. [Google Scholar] [CrossRef]
- Callaway, E. Delta coronavirus variant: Scientists brace for impact. Nature 2021, 595, 17–18. [Google Scholar] [CrossRef]
- Sheikh, A.; McMenamin, J.; Taylor, B.; Robertson, C.; Public Health, S.; Public Health Scotland and the EAVE II Collaborators. SARS-CoV-2 Delta VOC in Scotland: Demographics, risk of hospital admission, and vaccine effectiveness. Lancet 2021, 397, 2461–2462. [Google Scholar] [CrossRef]
- Fan, L.Q.; Hu, X.Y.; Chen, Y.Y.; Peng, X.L.; Fu, Y.H.; Zheng, Y.P.; Yu, J.M.; He, J.S. Biological Significance of the Genomic Variation and Structural Dynamics of SARS-CoV-2 B.1.617. Front. Microbiol. 2021, 12, 750725. [Google Scholar] [CrossRef]
- Rambaut, A.; Lam, T.T.; Max Carvalho, L.; Pybus, O.G. Exploring the temporal structure of heterochronous sequences using TempEst (formerly Path-O-Gen). Virus Evol. 2016, 2, vew007. [Google Scholar] [CrossRef] [PubMed] [Green Version]
- Liu, J.; Xu, Y.P.; Li, K.; Ye, Q.; Zhou, H.Y.; Sun, H.; Li, X.; Yu, L.; Deng, Y.Q.; Li, R.T.; et al. The m(6)A methylome of SARS-CoV-2 in host cells. Cell Res. 2021, 31, 404–414. [Google Scholar] [CrossRef] [PubMed]
- Shang, J.; Ye, G.; Shi, K.; Wan, Y.; Luo, C.; Aihara, H.; Geng, Q.; Auerbach, A.; Li, F. Structural basis of receptor recognition by SARS-CoV-2. Nature 2020, 581, 221–224. [Google Scholar] [CrossRef] [PubMed] [Green Version]
- Wang, R.; Chen, J.; Wei, G.W. Mechanisms of SARS-CoV-2 Evolution Revealing Vaccine-Resistant Mutations in Europe and America. J. Phys. Chem. Lett. 2021, 12, 11850–11857. [Google Scholar] [CrossRef]
- Fuseini, H.; Gyan, B.A.; Kyei, G.B.; Heimburger, D.C.; Koethe, J.R. Undernutrition and HIV Infection in Sub-Saharan Africa: Health Outcomes and Therapeutic Interventions. Curr. HIV/AIDS Rep. 2021, 18, 87–97. [Google Scholar] [CrossRef]
- Choi, B.; Choudhary, M.C.; Regan, J.; Sparks, J.A.; Padera, R.F.; Qiu, X.; Solomon, I.H.; Kuo, H.H.; Boucau, J.; Bowman, K.; et al. Persistence and Evolution of SARS-CoV-2 in an Immunocompromised Host. N. Engl. J. Med. 2020, 383, 2291–2293. [Google Scholar] [CrossRef]
- Corey, L.; Beyrer, C.; Cohen, M.S.; Michael, N.L.; Bedford, T.; Rolland, M. SARS-CoV-2 Variants in Patients with Immunosuppression. N. Engl. J. Med. 2021, 385, 562–566. [Google Scholar] [CrossRef]
- Yi, K.; Kim, S.Y.; Bleazard, T.; Kim, T.; Youk, J.; Ju, Y.S. Mutational spectrum of SARS-CoV-2 during the global pandemic. Exp. Mol. Med. 2021, 53, 1229–1237. [Google Scholar] [CrossRef]
- Rice, A.M.; Castillo Morales, A.; Ho, A.T.; Mordstein, C.; Muhlhausen, S.; Watson, S.; Cano, L.; Young, B.; Kudla, G.; Hurst, L.D. Evidence for Strong Mutation Bias toward, and Selection against, U Content in SARS-CoV-2: Implications for Vaccine Design. Mol. Biol. Evol. 2021, 38, 67–83. [Google Scholar] [CrossRef]
- Chen, F.; Wu, P.; Deng, S.; Zhang, H.; Hou, Y.; Hu, Z.; Zhang, J.; Chen, X.; Yang, J.R. Dissimilation of synonymous codon usage bias in virus-host coevolution due to translational selection. Nat. Ecol. Evol. 2020, 4, 589–600. [Google Scholar] [CrossRef]
- Deng, S.; Xing, K.; He, X. Mutation signatures inform the natural host of SARS-CoV-2. Natl. Sci. Rev. 2022, 9, nwab220. [Google Scholar] [CrossRef] [PubMed]
- De Maio, N.; Walker, C.R.; Turakhia, Y.; Lanfear, R.; Corbett-Detig, R.; Goldman, N. Mutation Rates and Selection on Synonymous Mutations in SARS-CoV-2. Genome Biol. Evol. 2021, 13, evab087. [Google Scholar] [CrossRef] [PubMed]
- Suryadevara, N.; Shrihari, S.; Gilchuk, P.; VanBlargan, L.A.; Binshtein, E.; Zost, S.J.; Nargi, R.S.; Sutton, R.E.; Winkler, E.S.; Chen, E.C.; et al. Neutralizing and protective human monoclonal antibodies recognizing the N-terminal domain of the SARS-CoV-2 spike protein. Cell 2021, 184, 2316–2331.e15. [Google Scholar] [CrossRef]
- Zhang, J.; Xiao, T.; Cai, Y.; Lavine, C.L.; Peng, H.; Zhu, H.; Anand, K.; Tong, P.; Gautam, A.; Mayer, M.L.; et al. Membrane fusion and immune evasion by the spike protein of SARS-CoV-2 Delta variant. Science 2021, 374, 1353–1360. [Google Scholar] [CrossRef] [PubMed]
- Qin, L.; Ding, X.; Li, Y.; Chen, Q.; Meng, J.; Jiang, T. Co-mutation modules capture the evolution and transmission patterns of SARS-CoV-2. Brief Bioinform 2021, 22, bbab222. [Google Scholar] [CrossRef]
- Biswas, N.; Mallick, P.; Maity, S.K.; Bhowmik, D.; Mitra, A.G.; Saha, S.; Roy, A.; Chakrabarti, P.; Paul, S.; Chakrabarti, S. Genomic Surveillance and Phylodynamic Analyses Reveal the Emergence of Novel Mutations and Co-mutation Patterns Within SARS-CoV-2 Variants Prevalent in India. Front. Microbiol. 2021, 12, 703933. [Google Scholar] [CrossRef] [PubMed]
- Deng, X.; Garcia-Knight, M.A.; Khalid, M.M.; Servellita, V.; Wang, C.; Morris, M.K.; Sotomayor-Gonzalez, A.; Glasner, D.R.; Reyes, K.R.; Gliwa, A.S.; et al. Transmission, infectivity, and neutralization of a spike L452R SARS-CoV-2 variant. Cell 2021, 184, 3426–3437.e8. [Google Scholar] [CrossRef]
- Saville, J.W.; Mannar, D.; Zhu, X.; Srivastava, S.S.; Berezuk, A.M.; Demers, J.P.; Zhou, S.; Tuttle, K.S.; Sekirov, I.; Kim, A.; et al. Structural and biochemical rationale for enhanced spike protein fitness in delta and kappa SARS-CoV-2 variants. Nat. Commun. 2022, 13, 742. [Google Scholar] [CrossRef]
- Liu, Y.; Liu, J.; Plante, K.S.; Plante, J.A.; Xie, X.; Zhang, X.; Ku, Z.; An, Z.; Scharton, D.; Schindewolf, C.; et al. The N501Y spike substitution enhances SARS-CoV-2 infection and transmission. Nature 2022, 602, 294–299. [Google Scholar] [CrossRef]
- Cheng, L.; Song, S.; Zhou, B.; Ge, X.; Yu, J.; Zhang, M.; Ju, B.; Zhang, Z. Impact of the N501Y substitution of SARS-CoV-2 Spike on neutralizing monoclonal antibodies targeting diverse epitopes. Virol. J. 2021, 18, 87. [Google Scholar] [CrossRef]
- Wilamowski, M.; Sherrell, D.A.; Minasov, G.; Kim, Y.; Shuvalova, L.; Lavens, A.; Chard, R.; Maltseva, N.; Jedrzejczak, R.; Rosas-Lemus, M.; et al. 2′-O methylation of RNA cap in SARS-CoV-2 captured by serial crystallography. Proc. Natl. Acad. Sci. USA 2021, 118, e2100170118. [Google Scholar] [CrossRef] [PubMed]
- Pan, R.; Kindler, E.; Cao, L.; Zhou, Y.; Zhang, Z.; Liu, Q.; Ebert, N.; Zust, R.; Sun, Y.; Gorbalenya, A.E.; et al. N7-Methylation of the Coronavirus RNA Cap Is Required for Maximal Virulence by Preventing Innate Immune Recognition. mBio 2022, 13, e0366221. [Google Scholar] [CrossRef] [PubMed]
- Daffis, S.; Szretter, K.J.; Schriewer, J.; Li, J.; Youn, S.; Errett, J.; Lin, T.Y.; Schneller, S.; Zust, R.; Dong, H.; et al. 2′-O methylation of the viral mRNA cap evades host restriction by IFIT family members. Nature 2010, 468, 452–456. [Google Scholar] [CrossRef] [PubMed]
- Viswanathan, T.; Misra, A.; Chan, S.H.; Qi, S.; Dai, N.; Arya, S.; Martinez-Sobrido, L.; Gupta, Y.K. A metal ion orients SARS-CoV-2 mRNA to ensure accurate 2′-O methylation of its first nucleotide. Nat. Commun. 2021, 12, 3287. [Google Scholar] [CrossRef]
- Shulman, Z.; Stern-Ginossar, N. The RNA modification N(6)-methyladenosine as a novel regulator of the immune system. Nat. Immunol. 2020, 21, 501–512. [Google Scholar] [CrossRef]
- Alter, G.; Yu, J.; Liu, J.; Chandrashekar, A.; Borducchi, E.N.; Tostanoski, L.H.; McMahan, K.; Jacob-Dolan, C.; Martinez, D.R.; Chang, A.; et al. Immunogenicity of Ad26.COV2.S vaccine against SARS-CoV-2 variants in humans. Nature 2021, 596, 268–272. [Google Scholar] [CrossRef]
- Afkhami, S.; D’Agostino, M.R.; Zhang, A.; Stacey, H.D.; Marzok, A.; Kang, A.; Singh, R.; Bavananthasivam, J.; Ye, G.; Luo, X.; et al. Respiratory mucosal delivery of next-generation COVID-19 vaccine provides robust protection against both ancestral and variant strains of SARS-CoV-2. Cell 2022, 185, 896–915.e19. [Google Scholar] [CrossRef]
- Motozono, C.; Toyoda, M.; Zahradnik, J.; Saito, A.; Nasser, H.; Tan, T.S.; Ngare, I.; Kimura, I.; Uriu, K.; Kosugi, Y.; et al. SARS-CoV-2 spike L452R variant evades cellular immunity and increases infectivity. Cell Host. Microbe. 2021, 29, 1124–1136.e11. [Google Scholar] [CrossRef]
- Riou, C.; Keeton, R.; Moyo-Gwete, T.; Hermanus, T.; Kgagudi, P.; Baguma, R.; Valley-Omar, Z.; Smith, M.; Tegally, H.; Doolabh, D.; et al. Escape from recognition of SARS-CoV-2 variant spike epitopes but overall preservation of T cell immunity. Sci. Transl. Med. 2022, 14, eabj6824. [Google Scholar] [CrossRef]
- Geers, D.; Shamier, M.C.; Bogers, S.; den Hartog, G.; Gommers, L.; Nieuwkoop, N.N.; Schmitz, K.S.; Rijsbergen, L.C.; van Osch, J.A.T.; Dijkhuizen, E.; et al. SARS-CoV-2 variants of concern partially escape humoral but not T-cell responses in COVID-19 convalescent donors and vaccinees. Sci. Immunol. 2021, 6, eabj1750. [Google Scholar] [CrossRef]
- Cobey, S.; Larremore, D.B.; Grad, Y.H.; Lipsitch, M. Concerns about SARS-CoV-2 evolution should not hold back efforts to expand vaccination. Nat. Rev. Immunol. 2021, 21, 330–335. [Google Scholar] [CrossRef] [PubMed]


Publisher’s Note: MDPI stays neutral with regard to jurisdictional claims in published maps and institutional affiliations. |
© 2022 by the authors. Licensee MDPI, Basel, Switzerland. This article is an open access article distributed under the terms and conditions of the Creative Commons Attribution (CC BY) license (https://creativecommons.org/licenses/by/4.0/).
Share and Cite
Zhang, J.; Fan, L.; Xu, H.; Fu, Y.; Peng, X.; Zheng, Y.; Yu, J.; He, J. Evolutionary Pattern Comparisons of the SARS-CoV-2 Delta Variant in Countries/Regions with High and Low Vaccine Coverage. Viruses 2022, 14, 2296. https://doi.org/10.3390/v14102296
Zhang J, Fan L, Xu H, Fu Y, Peng X, Zheng Y, Yu J, He J. Evolutionary Pattern Comparisons of the SARS-CoV-2 Delta Variant in Countries/Regions with High and Low Vaccine Coverage. Viruses. 2022; 14(10):2296. https://doi.org/10.3390/v14102296
Chicago/Turabian StyleZhang, Jiahao, Linqian Fan, Hanli Xu, Yuanhui Fu, Xianglei Peng, Yanpeng Zheng, Jiemei Yu, and Jinsheng He. 2022. "Evolutionary Pattern Comparisons of the SARS-CoV-2 Delta Variant in Countries/Regions with High and Low Vaccine Coverage" Viruses 14, no. 10: 2296. https://doi.org/10.3390/v14102296