Article

Severe Drought Still Affects Reproductive Traits Two Years Later in a Common Garden Experiment of Frangula alnus

by
Kristine Vander Mijnsbrugge
*,
Marc Schouppe
,
Stefaan Moreels
,
Yorrick Aguas Guerreiro
,
Laura Decorte
and
Marie Stessens
Department of Forest Ecology and Management, Research Institute for Nature and Forest, 9500 Geraardsbergen, Belgium
*
Author to whom correspondence should be addressed.
Forests 2023, 14(4), 857; https://doi.org/10.3390/f14040857
Submission received: 23 February 2023 / Revised: 18 April 2023 / Accepted: 19 April 2023 / Published: 21 April 2023
(This article belongs to the Special Issue Impact of Climate Warming and Disturbances on Forest Ecosystems)

Abstract

:
Longer periods of intensified droughts in Western Europe are predicted due to ongoing climate change. Studying the responses of woody species during intense drought events can help toward understanding the consequences for forest ecosystems. We studied the effects of an intense summer water limitation on several reproductive traits, two years after the treatment, in Frangula alnus Mill. shrubs grown in a common garden. Drought-treated shrubs produced more berries one and two years after the drought event, while the height increment of the second post-treatment year was still significantly retarded. The mean weight of stones from berries picked two years after the drought treatment and their germination percentage, which was corrected for mean stone weight, were higher for the treated shrubs. These results indicate a resource re-allocation toward reproduction, rather than toward growth, which was still in action two years after the water limitation. The higher germination success, which is a transgenerational effect, and which has already been suggested to be an adaptation to survival in more stressful growth conditions, is also still detectable two years after the severe drought. F. alnus produces mature berries continuously during the whole summer. From the middle of July till the end of August, the counts of mature berries, the mean stone weight and the germination percentage, corrected for mean stone weight, decreased, whereas the timing of seedling emergence, also corrected for stone weight, advanced slightly. The timing of seedling emergence correlated weak but significantly with the timing of bud burst in the mother shrubs, with a variance analysis indicating a stronger genetic control for bud burst in comparison to seedling emergence. Several results corroborated previous findings. Population differentiation in the common garden was observed for mature berry counts and for several phenological traits. In conclusion, longer-term effects of drought on reproductive traits in woody species may add more complexity to the consequences of climate change on tree species distributions and survival of forest ecosystems.

1. Introduction

Forests worldwide face increasing challenges, not least driven by climate change [1,2]. The frequency and the duration of drought and heat stress are rising and will continue to do so [3]. Climate change is already responsible for increasing tree mortality, which can lead to an altered composition and structure of forests [3,4]. To predict how forest ecosystems will evolve in the future, knowledge is needed on the impact of climate change on tree reproduction patterns [5]. It is clear that the reproduction of trees is influenced by climate change [6]. Still, our understanding of the mechanisms that govern tree fecundity is restricted [7]. Observational studies indicate that reproduction in trees can both increase and decrease when studied over a longer time period [8,9,10], but uncertainty remains in terms of how far the observed clines are responses to an altering climate [11]. Therefore, experiments that stress plants with environmental conditions that are predicted by climate change are justified to assess the impact on reproduction of forest trees and shrubs. Still, one has to keep in mind that the impact of, e.g., warming, fertilization or drought, should not be extrapolated without caution, as on average, these effects may be dampened over time [12].
Natural selection and phenotypic plasticity are two well-known mechanisms for plants, as sedentary organisms, to respond to an altering growth environment. Less investigated is the phenomenon of transgenerational plasticity as a way for plants to cope with changing growth conditions. Transgenerational effects in plants can be described as the impact that the parental environment can have on the offspring performance, excluding any influence of the genes that are transmitted from the parent to the descendants [13]. The inherited adjustments in the offspring can be an adaptation to the parental environmental conditions that caused these effects. The offspring that experiences a comparable environment than the parental one can therefore display a better fitness [14]. Diverse mechanisms can lead to adaptive transgenerational adjustments including altered seed provisioning and epigenetic modifications [13]. Perennial species have longer life cycles than annuals, and it can be suggested that transgenerational effects may play a more important role in their responses to altering growth environments [13]. The question remains as to how far they will help woody vegetations in keeping pace with the rapid climate change.
Because of their long life span, studies on the impact of an altering climate on tree fecundity and recruitment tend to remain observational in nature. It often needs many years before a tree starts to flower and fructify. Shrubs have the advantage of flowering and fructifying more quickly, permitting shrubs grown in a container to reproduce and thus allowing experimental studies specifically focusing on reproduction. Our study species was Frangula alnus Mill. (glossy buckthorn), which is an insect-pollinated and bird-dispersed shrub to small tree, characterized by an extended natural distribution range in Europe [15]. Similarly to most other shrub species, F. alnus has no economic significance, although the ecological importance in its natural range is beyond doubt, and is therefore not much studied. F. alnus flowers and produces berries on the year’s shoot, which grows indeterminately, implying that mature berries are formed from early summer to early autumn.
Two drought experiments in a common garden of F. alnus have been described before. The experimental set-up consisted of a common garden with three provenances, including a local Belgian, a more northernly located Swedish and a more southernly located Italian one. In the first experiment, a summer drought was imposed on potted F. alnus plants, by withholding any watering for 27 days [16]. Due to the severity of the drought stress, 41% of the plants died off. Here, the Italian provenance suffered earlier and more from the imposed stress in comparison to the Belgian and Swedish provenances. This provenance displayed a retarded leaf senescence in the subsequent autumn. One year later, both bud burst and leaf senescence were advanced for all provenances that experienced the drought treatment. No effect was detectable anymore in the leaf phenological traits two years later. In the year of the drought stress, evidently, height growth was retarded, an effect still visible one year later. In the second drought experiment, a milder early summer drought stress was imposed on potted F. alnus plants, with plants displaying the first symptoms of leaf wilting, but without any plants dying off [17]. The drought treatment significantly reduced the amount of mature berry production in the same year of the treatment, and it did not affect stone weight. The germination percentage of the berries collected in the same year of the drought treatment, was higher among the drought-treated mother plants [18]. In addition, the timing of seedling emergence was advanced for the berries that were collected at the time of maximum berry production (middle of July). The timing of seedling emergence among the three provenances followed the same order as the timing of bud burst, possibly suggesting a common genetic basis.
The question remains whether drought stress may still display legacies on reproductive traits in the years after the water limitation. The main objective of the study here presented was to measure the effects of the severe water withholding treatment in the first experiment on F. alnus [16], as described above, specifically on the reproductive traits two years after the drought treatment. We observed mainly reproductive traits up to two years after the drought treatment. The following research questions were put forward. (i) Did the severe drought treatment influence reproductive traits up to two years after the treatment? (ii) Were transgenerational effects visible two years after the drought treatment? (iii) Were the after-effects provenance dependent?

2. Materials and Methods

2.1. Common Garden

This study builds on a common garden experiment of the shrub F. alnus that was established as described before [16]. In short, mature berries were harvested in three natural populations located in Italy (lat. 43.12181, lon. 11.17654), Belgium (lat. 51.08424, lon. 4.793124) and Sweden (lat. 62.44210, lon. 17.23451) (Figure S1). The sites are characterized by an annual mean temperature and an annual precipitation of 13.7 °C and 706 mm for the Italian provenance, 10.1 °C and 785 mm for the Belgian provenance and 2.9 °C and 682 mm for the Swedish provenance, respectively (data from WorldClim [19] and already reported in [16]). Plants were grown in the nursery of the Research Institute of Nature and Forest (Geraardsbergen, Belgium), following standard nursery techniques. In 2016, 8 cuttings were taken from every genotype (8 genotypes for the Italian, 17 genotypes for the Belgium and 14 genotypes for the Swedish provenance) and further raised as container plants using standard potting soil (organic matter 20%, pH 5.0–6.5, Electrical Conductivity 450 µS cm−1, dry matter 25%, 1.5 kg m−3 powdered compound fertilizer NPK 12 + 14 + 24). In this way, the common garden was established with 309 plants, and a drought experiment in a greenhouse was performed in 2018 as described before [16]. In summary, half of the plants (with four clones for each genotype) did not receive any water for 28 days in the summer of 2018, after which they were again well watered. In this process, 64 plants died off in the drought-treated group of plants, leaving 245 plants in total in the remaining common garden. After the drought experiment, plants were individually intermingled and further raised as container plants on an outdoor container field. In the spring of 2020, immediately after bud burst, all plants were pruned at 10 cm above soil level.

2.2. Measurements

Height of the plants was measured at the end of 2019 and 2020. As the plants were pruned in the beginning of 2020, the height of the plants at the end of 2020 was a proxy for the height increment of this year.
F. alnus produces berries from an early age onwards, so reproductive traits can be studied on young container plants. As plants flower on the current year of growth, berries ripen continuously in summer and early autumn. Mature berries of F. alnus are purple-black colored. All mature berries were counted on each plant separately on 12 August 2019, one year after the drought treatment, in both the control and the water-limited group.
In 2020, mature berries were counted on each plant separately throughout the summer, starting when the first black berries appeared and lasting till no new black berries were produced (counting days on 3, 9, 16 and 24 July and 7 and 21 August 2020). On every counting day, all black berries were also picked, avoiding double counting. Except for the first two counting days, the picked berries were kept (from 16 July till 21 August) and were pooled for the ramets belonging to the same genotype and having received the same treatment (drought or control) two years before. Stones were extracted from each batch of berries by hand, washed and air dried for a few days. Then, the batches of stones were weighted. About two weeks later, the batches were stratified using sand and nursery potting soil in equal volumes. Tray cells were filled with the sand-soil mixture up to one cm from the top. The batches of stones were scattered on the mixture in every cell and were covered with the same mixture. The filled trays were placed in a refrigerator at 4 °C for a cold stratification, until the end of January 2021. During the cold stratification, the soil mixture was kept moist. Together, 218 different batches of cleaned stones were stratified, containing all together 7406 stones (Table 1).
In February 2021, the trays were transferred from the refrigerator to a non-heated but frost-free greenhouse. Germination advanced in the beginning of March and emerging seedlings were counted on a regular basis until all seedlings had appeared. Counting was performed on 8, 12, 15, 19, 22, 26 and 29 March, and on 2, 6, 9 and 16 April 2021.
Germination percentage was calculated by dividing the count of emerged seedlings on the last counting day in a given batch by the number of stratified stones in the batch. Germination percentage is a proxy for the viability of the stones. The sequence of counts over time allowed us to study the timing of emergence. For this, percentages of emergence were calculated by dividing each count of each batch on every counting day by the count of this batch on the last counting day.
In the autumn of 2020, leaf senescence was evaluated on the mother shrubs in the common garden using a 5-level scoring protocol as follows: 1: green leaves; 2: light green leaves; 3: yellowing leaves; 4: leaves turning brown; 5: leaves falling off. The process of leaf senescence was observed on 18 September and on 5 and 26 October 2020.
In the spring of 2021, bud burst was evaluated on the mother shrubs in the common garden using a 5-level scoring protocol as follows: 1: buds in winter rest; 2: buds opening and first green tissue visible; 3: green tissue sliding out of the bud but not yet unfolding; 4: first leaves opening but not yet fully opened; 5: leaves fully opened. Bud burst scoring was performed on a regular basis on 9, 16, 23 and 30 April, and on 7, 14 and 21 May 2021.

2.3. Statistical Analysis

The obtained data were processed in R (version 4.2.1, Vienna, Austria [20]). The first focus of the analysis was on the putative influence of the treatment of the mother shrubs in 2018 on the different response variables. Additionally, we focused on a putative population differentiation in the common garden.
Linear and generalized linear mixed models were applied using the package nlme [21]. The variable T represented the drought treatment of the mother shrubs in 2018 with “control” and “drought” as levels. The variable P denoted the provenance of the mother shrubs with “Be” for Belgian, “It” for Italian and “Sw” for Swedish. The variables H19 and H20 represented the height of the mother plants at the end of 2019 and 2020, respectively. The variable C indicated the days of berry counts on the mother plants in 2020. The variable D represented the days that emerged seedlings were counted or that bud burst was scored on the mother shrubs, both in the spring of 2021. The variable S denoted the mean stone weight.
In the random part of all the models, a unique identifier for every genotype was present. A unique identifier for every mother plant was added in the random part of the model for the response variable berry count in 2020, and also for the response variable timing of bud burst in the spring of 2021, as repeated counts or observations were performed on the same plants. Another unique identifier for pooled ramets within a genotype (pooled for the drought treatment and pooled for the control) was added to the random part of the models for the response variables mean weight of a stone, germination percentage and timing of seedling emergence, to account for the repeated collections of berries on the same mother shrubs. Finally, a unique identifier for every batch of stones was added to the model of the timing of seedling emergence to account for the different counting events on the same batches of stones.
A linear mixed model was fit to the height increment of the mother plants in 2020 (H20):
H20 = αH20 + βPH20P + βTH20T
A generalized mixed model with Poisson distribution was fit to the counts of mature berries on every shrub that produced mature berries on 12 August 2019 (B19):
B19 = αB19 + βPB19P + βTB19T + βH19B19H19
A generalized mixed model with Poisson distribution was fit to the counts of mature berries on every shrub in 2020 (B20):
B20 = αB20 + βPB20P + βTB20T + βH20B20H20 + βCB20C + βC2B20C2 + βC3B20C3 + βPCB20PC + βPC2B20PC2 + βPC3B20PC3
The genotypes for which only ramets in the control group of mother shrubs survived the treatment in 2018, were excluded from the dataset. A polynomial to the third degree for day of berry collection (C) was added in the model as the raw data indicated a non-linear curve of mature berry counts over time. An interaction term between day of berry collection and provenance allowed the berry counts to vary over time in a different way for the different provenances.
Mean stone weight (S) was modeled using a linear mixed model:
S = αS + βPSP + βTST + βCSC + βC2SC2
A polynomial to the second degree for day of berry collection was added in the model as the raw data indicated a non-linear curve of mean stone weight over time.
Germination percentage (Gp) was modelled using a linear mixed model:
Gp = αGp + βPGpP + βTGpT + βCGpC + βSGpS
The chance (p1) was modeled for a seedling to have already emerged on a given day. A binomial generalized linear mixed model was fit to the seedling count data over time, with the count of germinated seedlings on the last count day as the “weight” argument in the model. The model formula is as follows:
log(p1/(1 − p1)) = αp1 + βPp1P + βTp1T + βDp1D + βCp1C + βSp1S
To allow a correlation analysis between the timing of seedling emergence and the timing of bud burst of the mother plants in the spring of 2021, two models were run. As treatment in 2018 was not significant in either of the models, it was omitted from the fixed part of the models. The model for bud burst was based on cumulative logistic regression, as the response variable bud burst was of an ordinal type. The package ‘ordinal’ was used [22]. The chance (p2) was modeled for a mother plant to have reached at minimum a given bud burst score (i.e., to have reached a bud burst score or a score higher than this score on a specific day). Model formula is as follows:
log(p2/(1 − p2)) = αp2 − βPp2P − βDp2D − βH20p2H20 − random effects
The random part consisted of a unique identifier for every genotype and a unique identifier for every mother plant.
Timing of germination was modeled for the berry collection on 16 July 2020 using a binomial generalized linear mixed model with the formula:
log(p3/(1 − p3)) = αp3 + βPp3P + βDp3D + βSp3S + random effects
The random part consisted of a unique identifier for every genotype and a unique identifier for every batch of collected stones on 16 July 2020.
Based on Formulas (7) and (8), the modelled day was calculated when the chance was 50% to have reached a bud burst score of 3 or higher (bud burst scorings on the mother shrubs, D50bb), and to have emerged (germinating seedlings, D50ge), respectively. The random effects were added in this calculation so that a D50 was calculated for every mother shrub (bud burst) and for every batch of stratified stones that was collected on the 16th of July 2020 (seedling emergence), respectively. For the calculations, the mean height of a mother shrub in 2020 (mH20) and the mean weight of a seed (mS) were used.
D50bb = (αp2 − βPp2 − βH20p2mH20 − random effects)/βDp2
D50ge = (αp3 + βPp3 + βSp3mS + random effects)/βDp3
A Pearson correlation coefficient was calculated between the D50 values for bud burst of the mother plants and the D50 values for seedling emergence.
To allow a partitioning of variance analysis, both models (7) and (8) were run as linear mixed models in which the variance of the random part was partitioned in variance between genotypes, in variance between ramets (bud burst) or pooled ramets (seedling emergence) within genotypes, and in residual variance. As the plants shared the same growth environment, the variance between genotypes had a genetic base, which was not the case for the variance between (pooled) ramets and the residual variance.
Leaf senescence in 2020 was modelled using cumulative logistic regression. The chance (p4) was modeled for a mother plant to have reached at maximum a given leaf senescence score on a given day:
log(p4/(1 − p4)) = αp4 − βPp4P − βTp4T − βDp4D − βH20p4H20
The random part consisted of a unique identifier for every genotype and a unique identifier for every mother plant.

3. Results

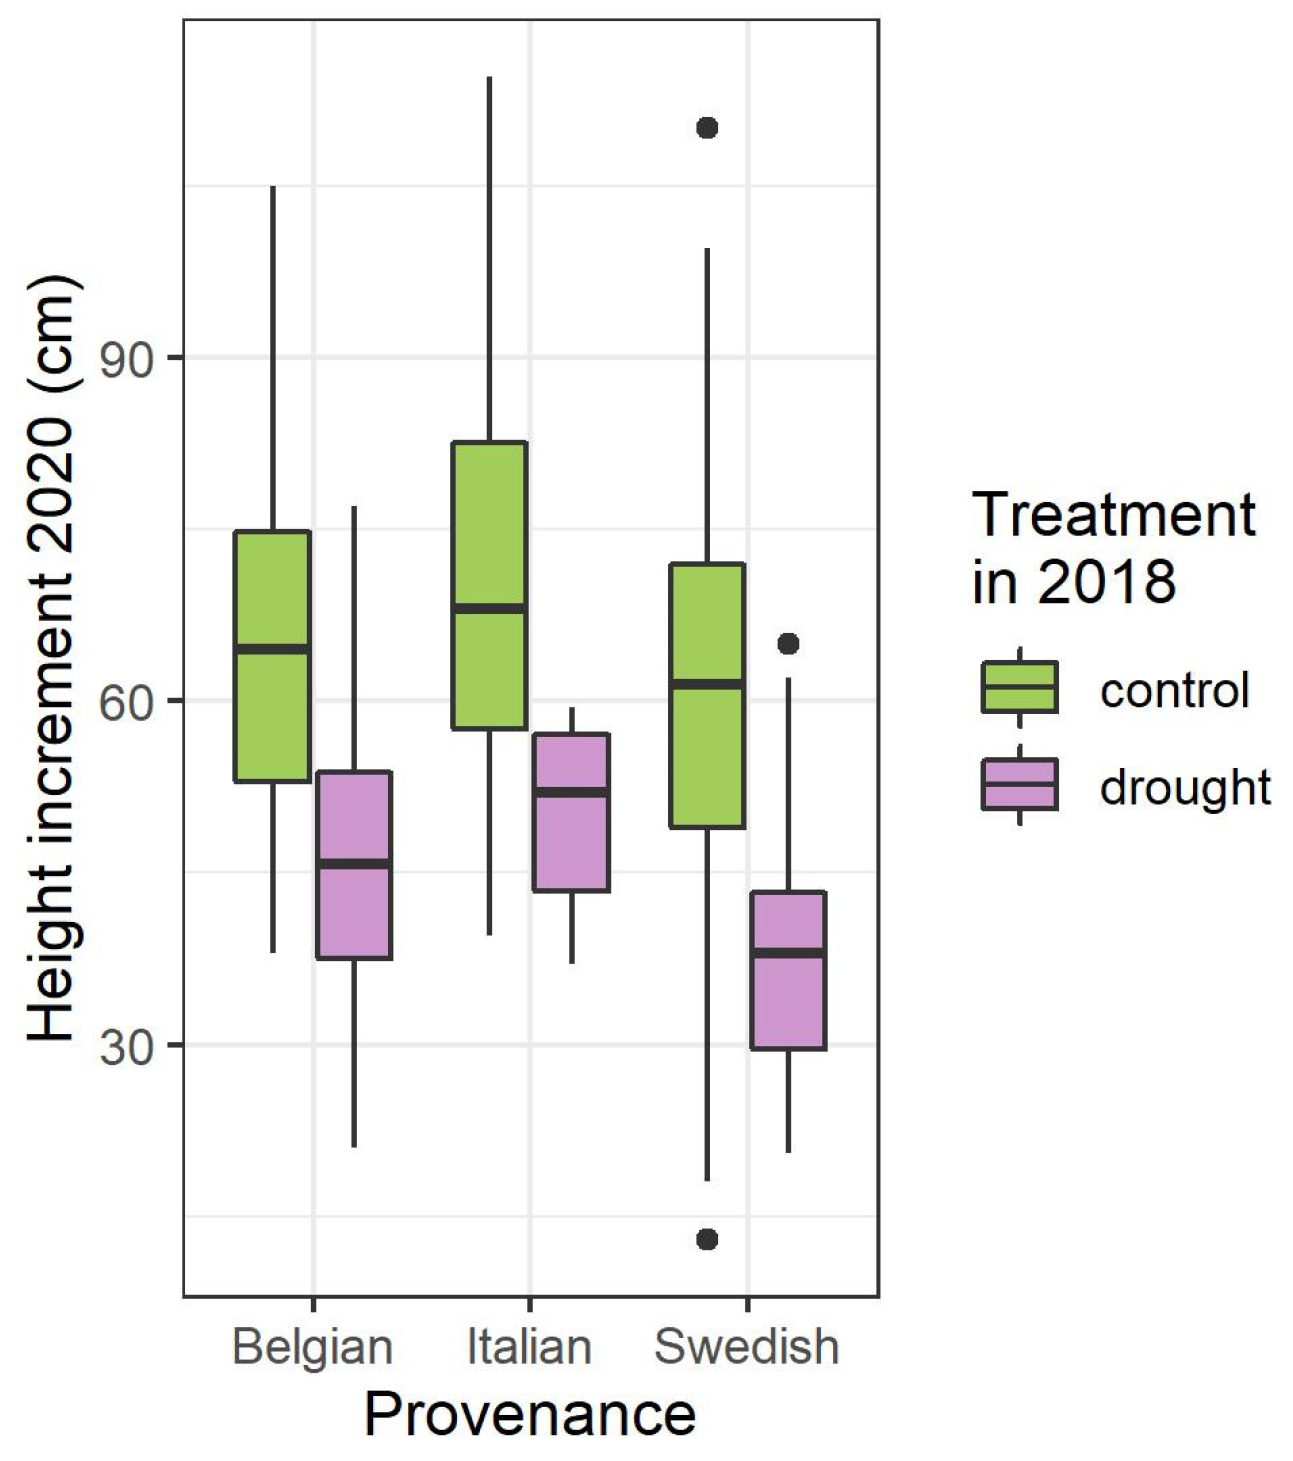
3.1. Height Increment, Two Years after the Summer Drought Treatment

Height increment growth in 2020, two years after the summer water withholding treatment, was still clearly negatively affected by the treatment (treatment p-value < 0.001 in Table 2 and Figure 1).

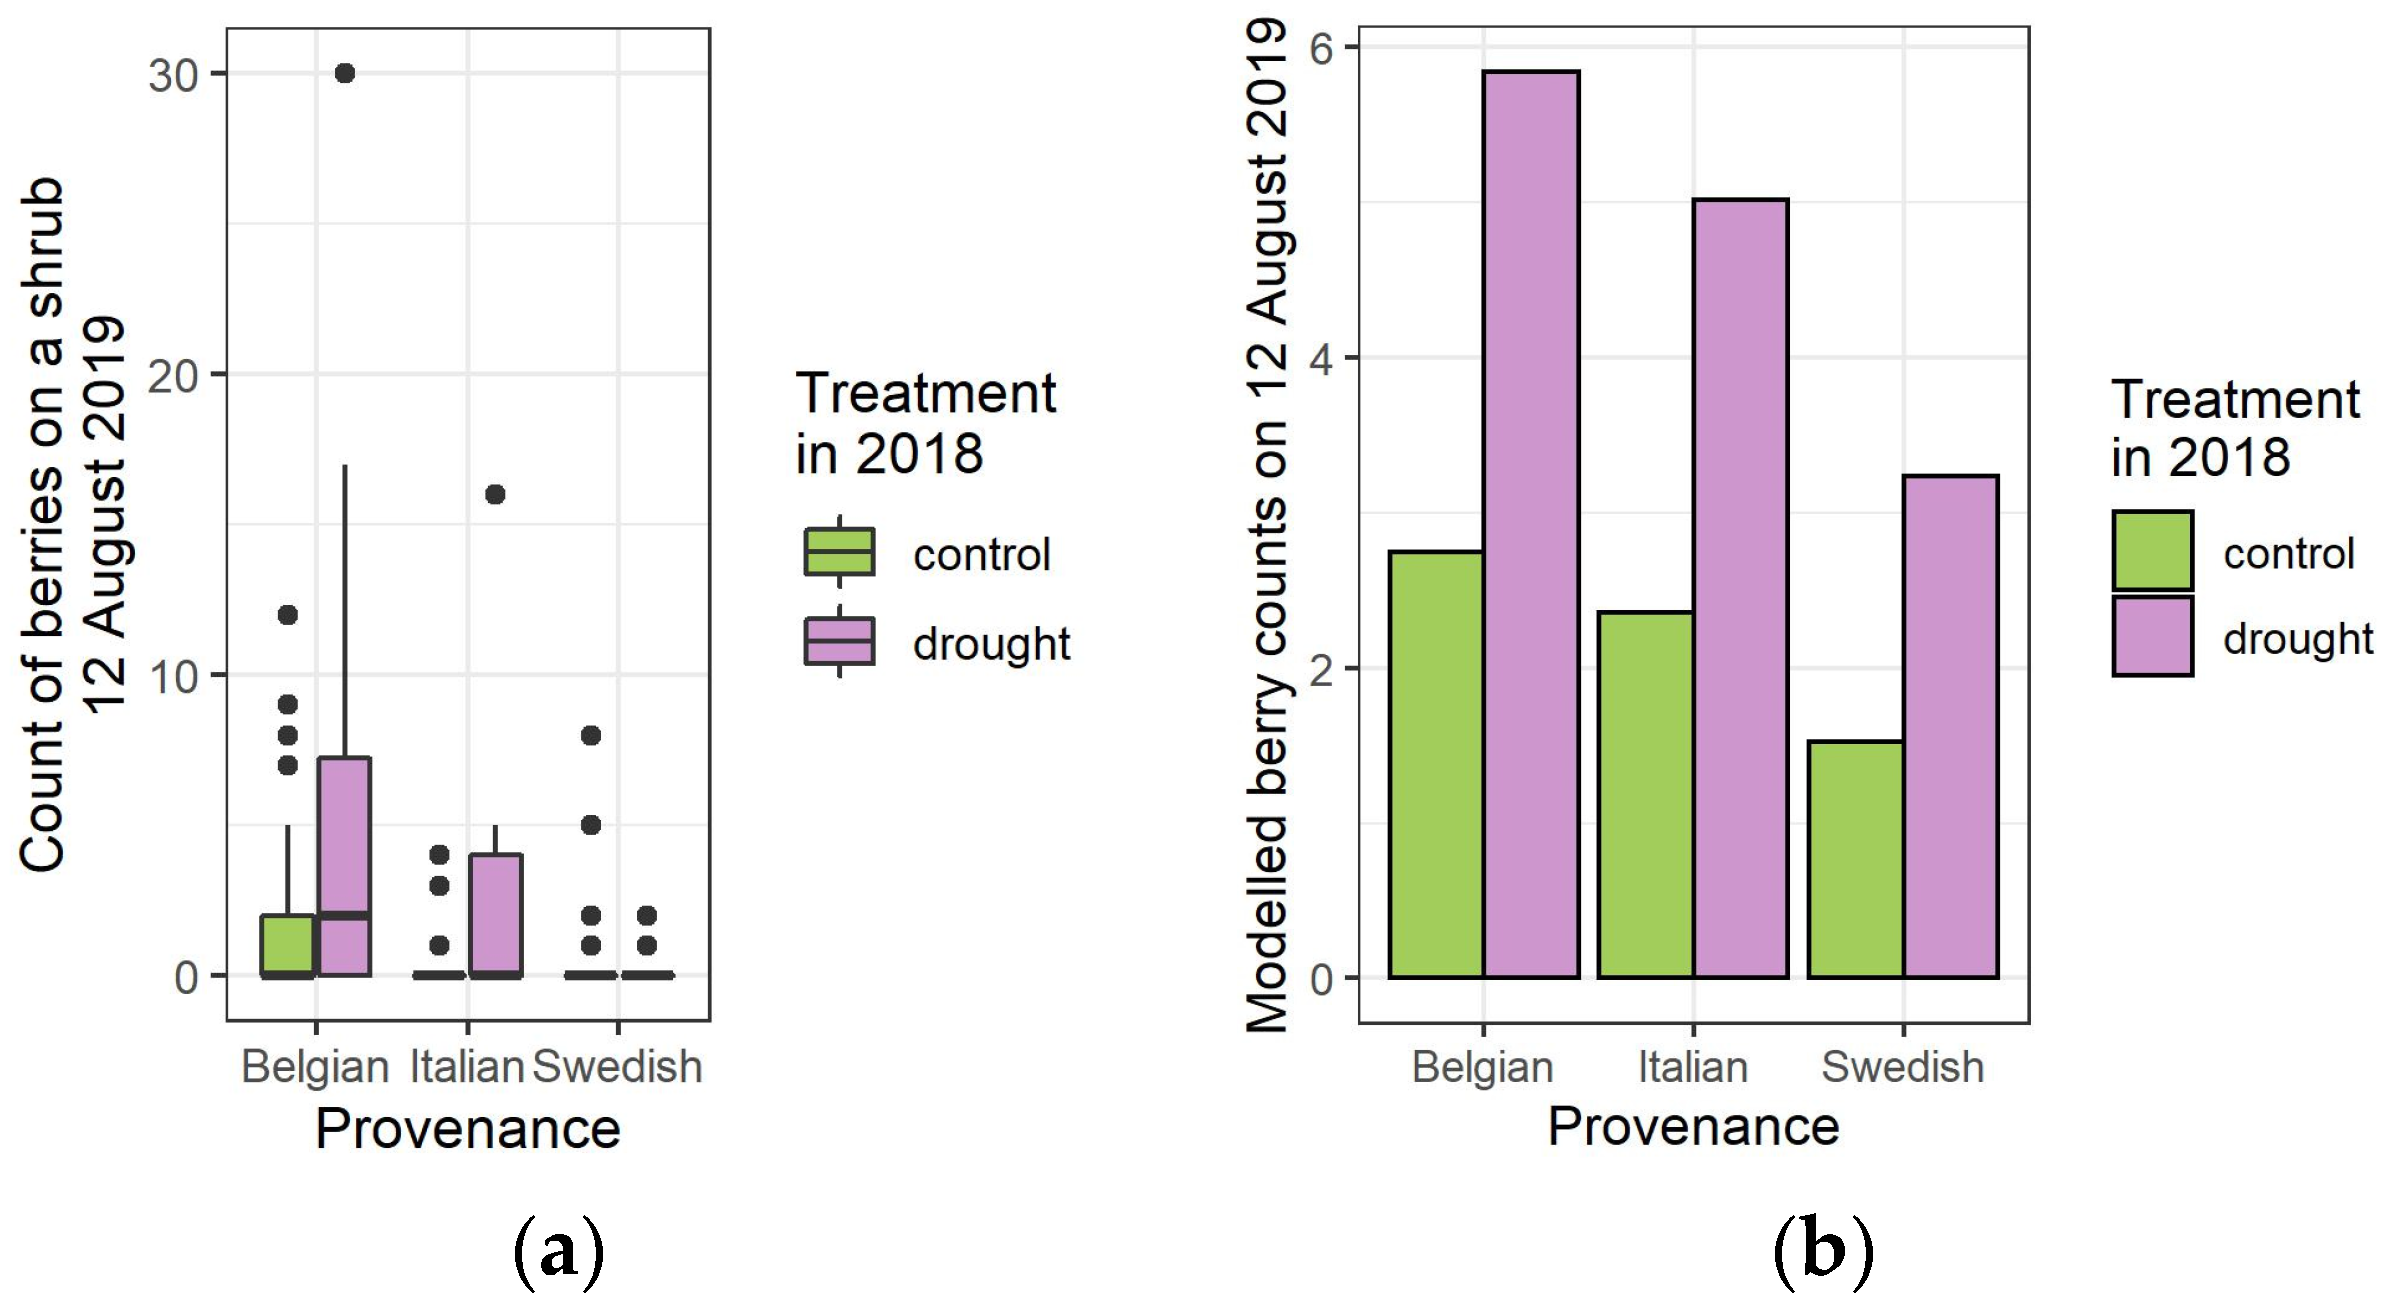
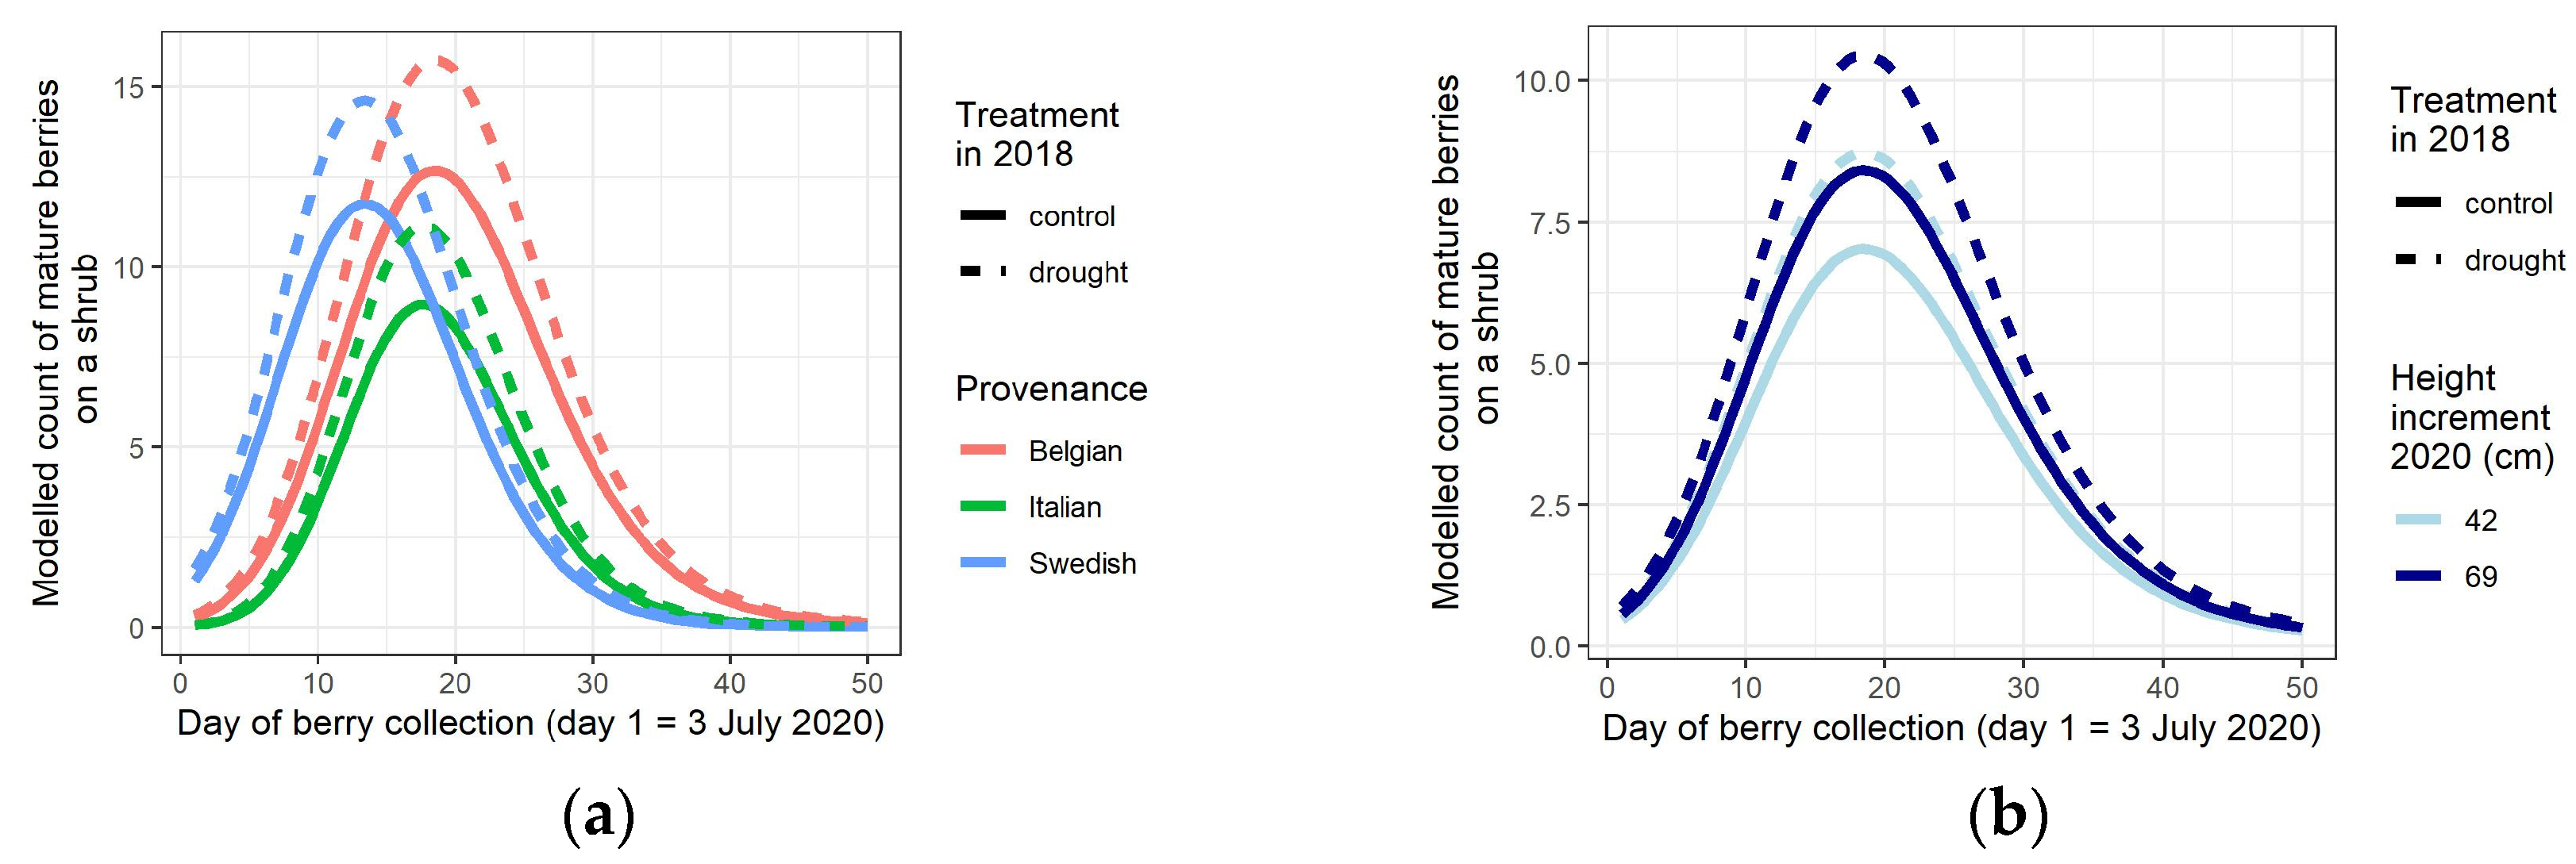
3.2. Mature Berry Counts, One and Two Years after the Drought Treatment

One year after the drought treatment (2019), counts of berries were significantly larger on the drought-treated mother shrubs compared to the controls (p-value < 0.001 for treatment in Table 3 and Figure 2a,b).
In 2020, berries were counted on a regular basis in the growing season, facilitating the study of the berry production over time. Mature berry production displayed a clear maximum in the middle of the growing season and was still slightly increased by the drought treatment in 2018 (treatment p-value = 0.040 in Table 3 and Figure 3). The Italian and the Swedish provenances both produced less mature berries compared to the local Belgian provenance (p-values = 0.002 and < 0.001 for the Italian and Swedish provenance, respectively, in Table 3 and Figure 3a). In addition, the Swedish provenance displayed an earlier maximum of berry production in time (p-values < 0.001 for the interaction between day of berry collection in 2020 and the Swedish provenance in Table 3 and Figure 3a). Higher plants produced slightly more mature berries (p-value = 0.042 in Table 3 and Figure 3b).

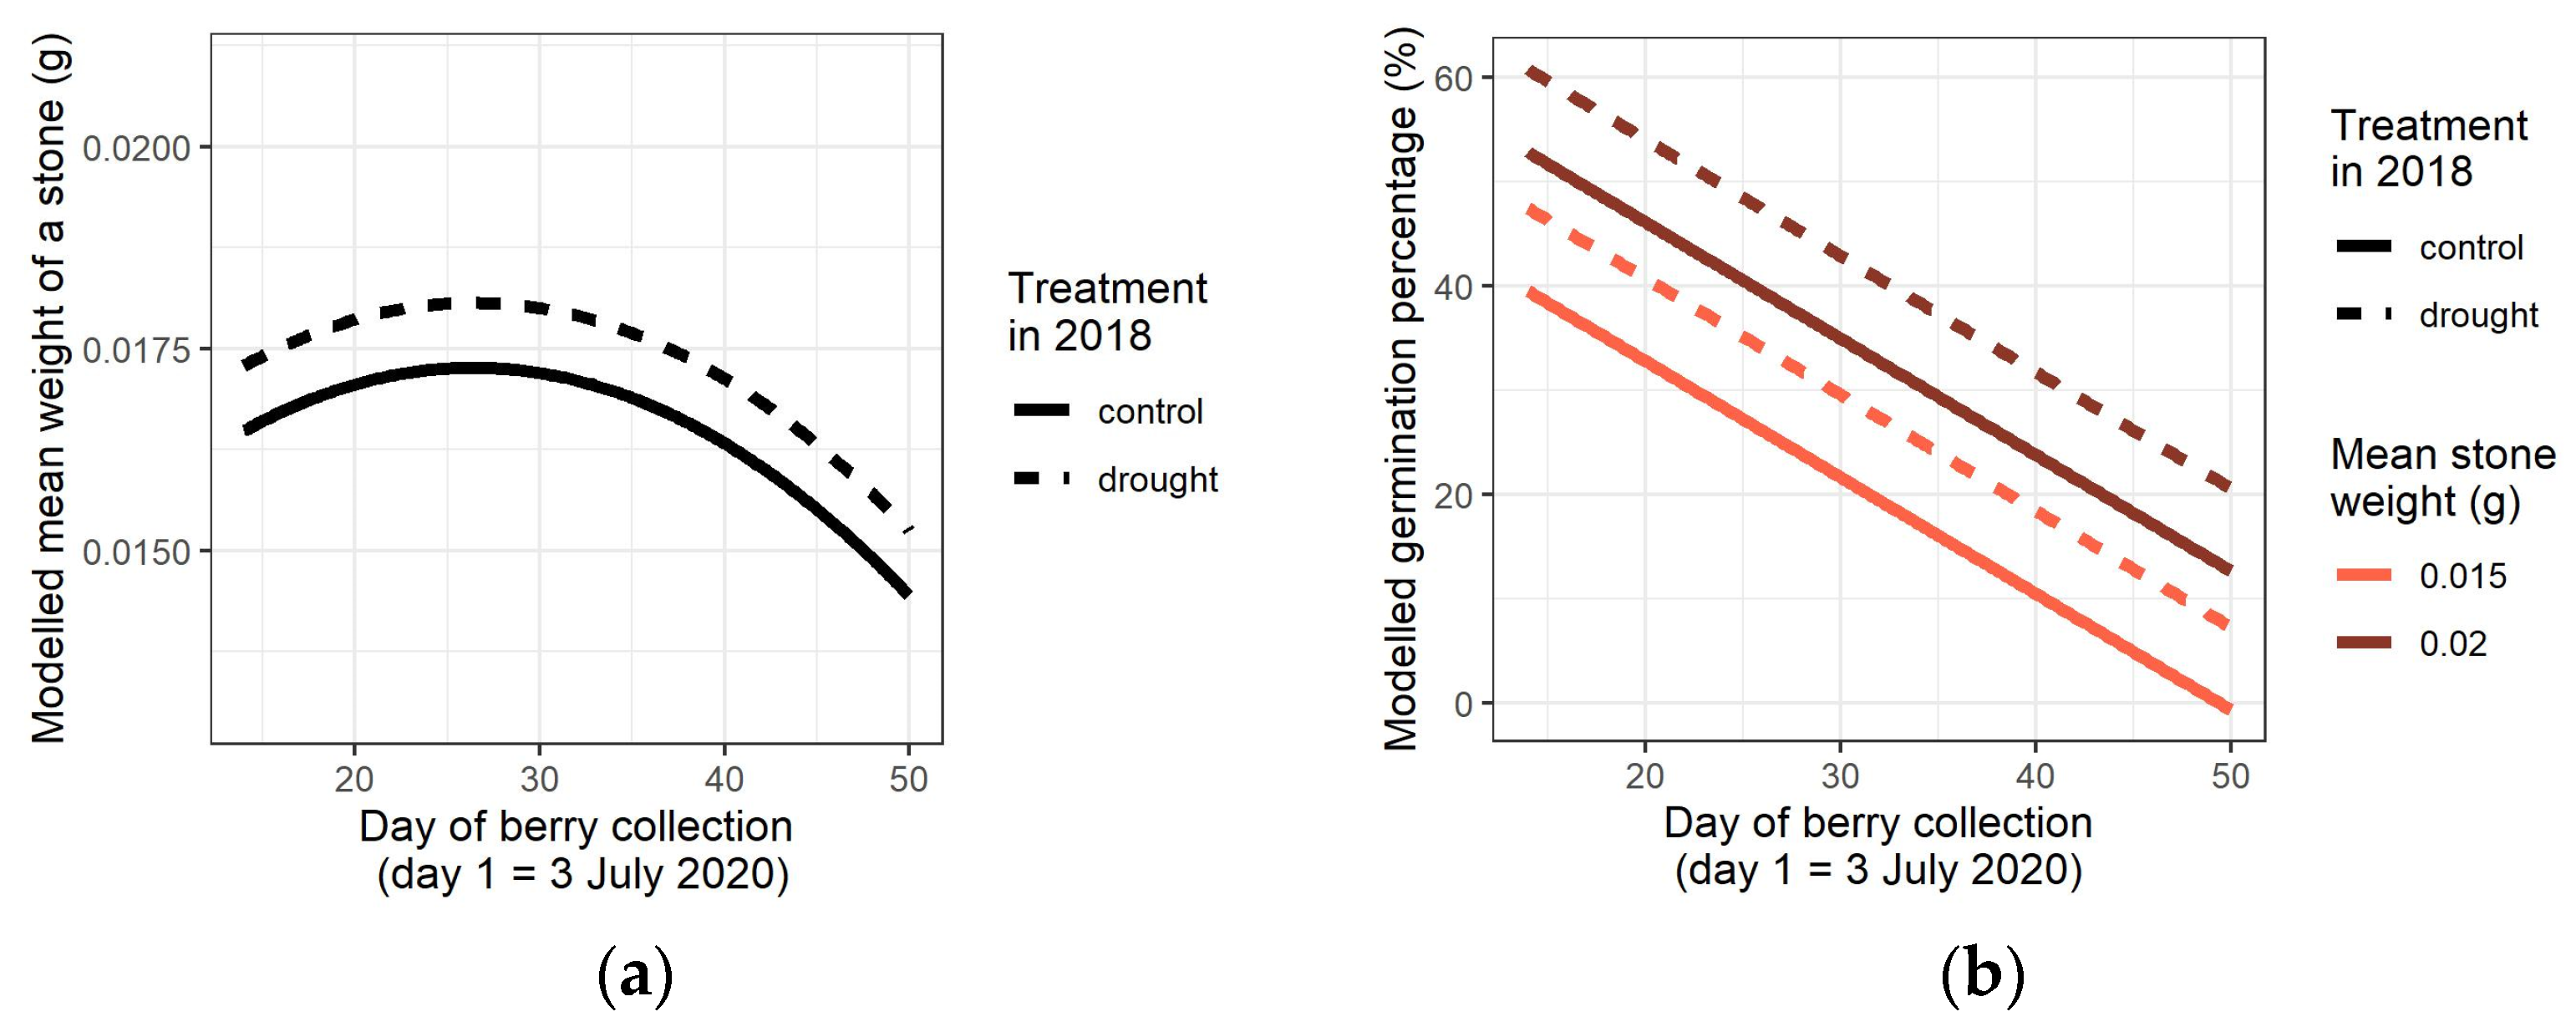
3.3. Mean Stone Weight

The mean weight of a stone for the pooled ramets within a genotype with the same treatment in 2018, was slightly higher for the drought-treated mother shrubs (p-value = 0.031 for treatment in Table 4 and in Figure 4a and Figure S3). The day when the berries were collected from which the stones were extracted, significantly influenced the mean stone weight, showing a maximum mean weight in the middle of the growing season (p-values < 0.001 for C and C2 in Table 4 and Figure 4a). No population differentiation was present between the different provenances.

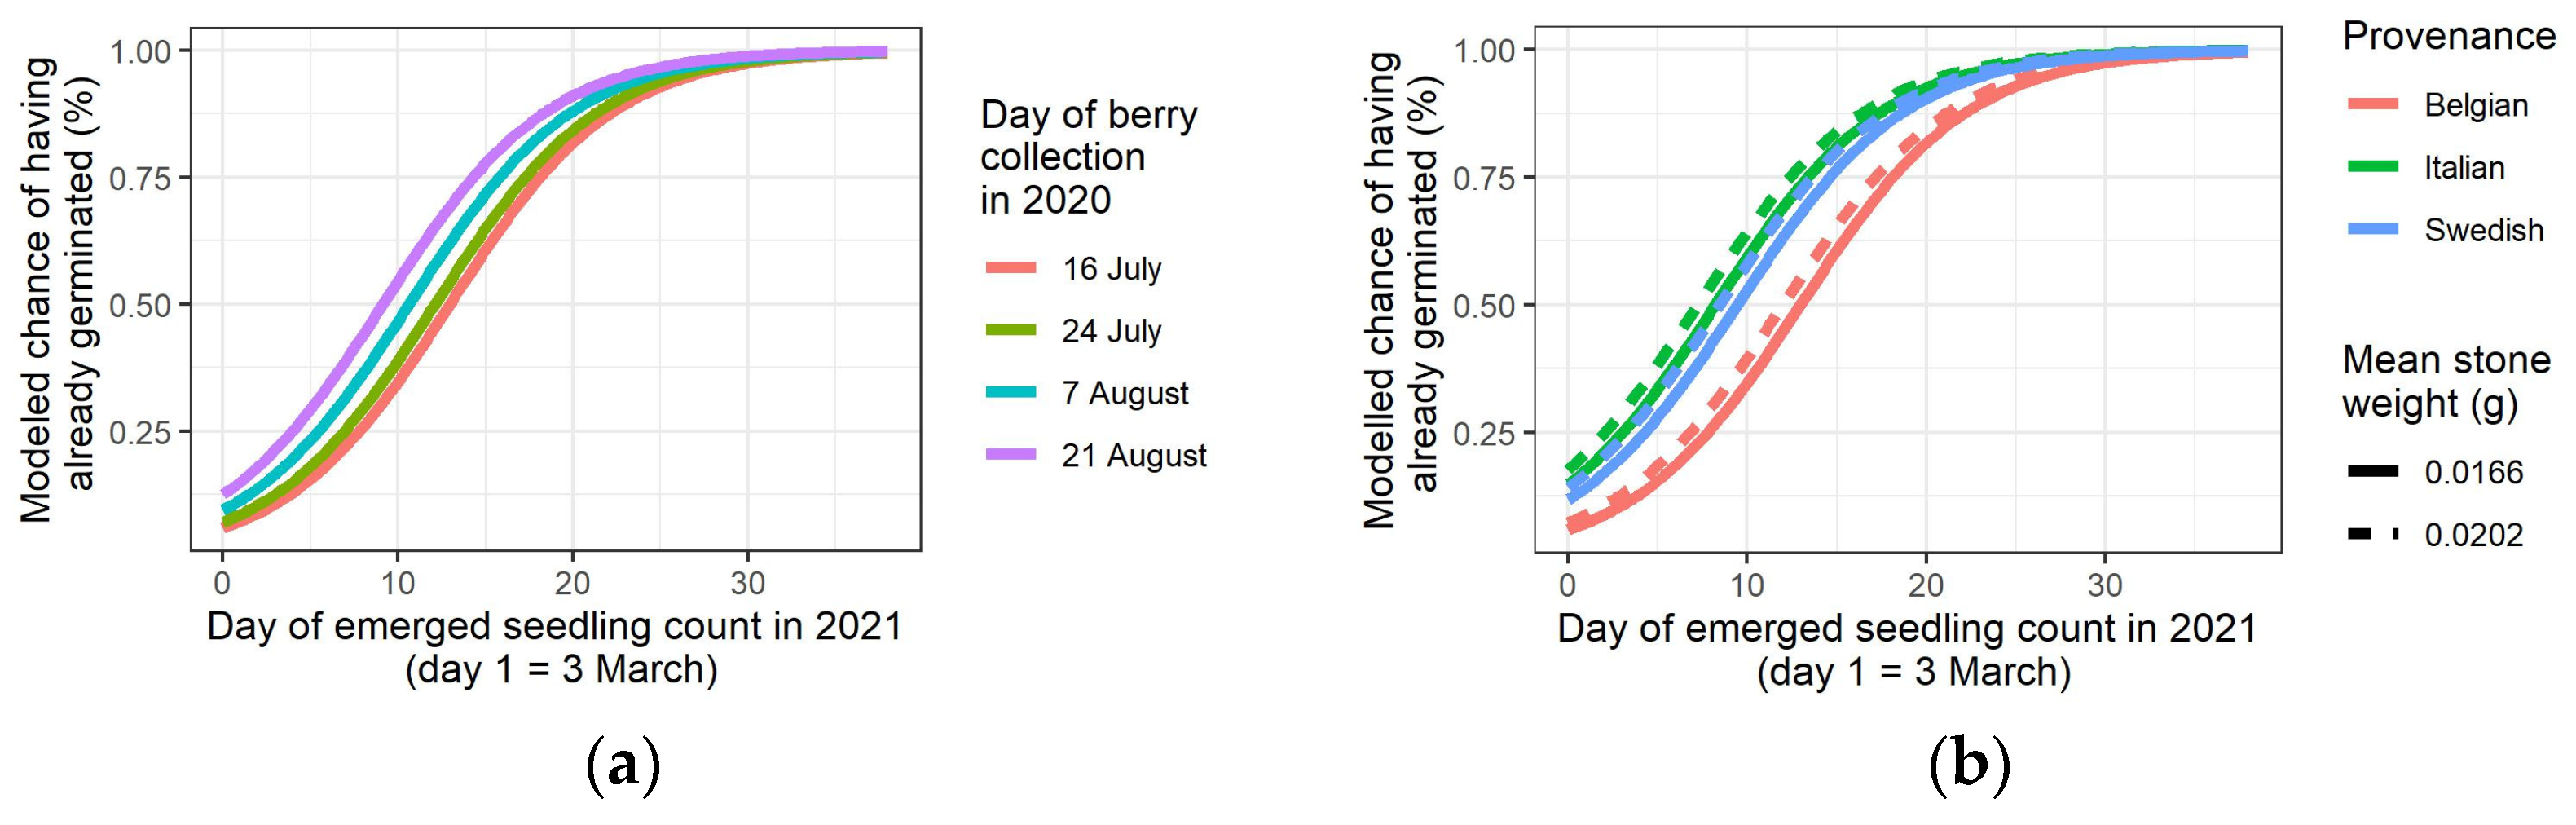
3.4. Germination of the Stones in the Spring of 2021

Germination in the different batches of stones was observed carefully in the spring of 2021. The germination percentage, as the ratio between the number of germinated stones and the total number of stones in a batch, was significantly higher for the batches of stones derived from the mother shrubs that experienced the drought treatment in 2018 (p-value = 0.003 for T in Table 5 and in Figure 4b and Figure S4). Stones originating from the berry collections in the middle of July till the end of August 2020 displayed a decrease in germination percentage over time (p-value < 0.001 for C in Table 5 and Figure 4b). Heavier stones showed also a higher germination (p-value < 0.001 for S in Table 5).
The treatment of the mother shrubs in 2018 did not influence the timing of germination (no significant p-value in Table 5). The first stone harvest originating from the berries collected in the middle of July displayed the latest germination, while the later the berries were collected, the earlier the seedlings emerged (p-value = 0.025 for C in Table 5 and Figure 5a). Heavier stones also displayed an advancement of the germination (p-value = 0.007 for S in Table 5 and Figure 5b). Additionally, contrary to the germination percentage, the Italian and Swedish provenances germinated earlier than the local Belgian provenance (p-values < 0.001 for both provenances in Table 5 and Figure 5b).

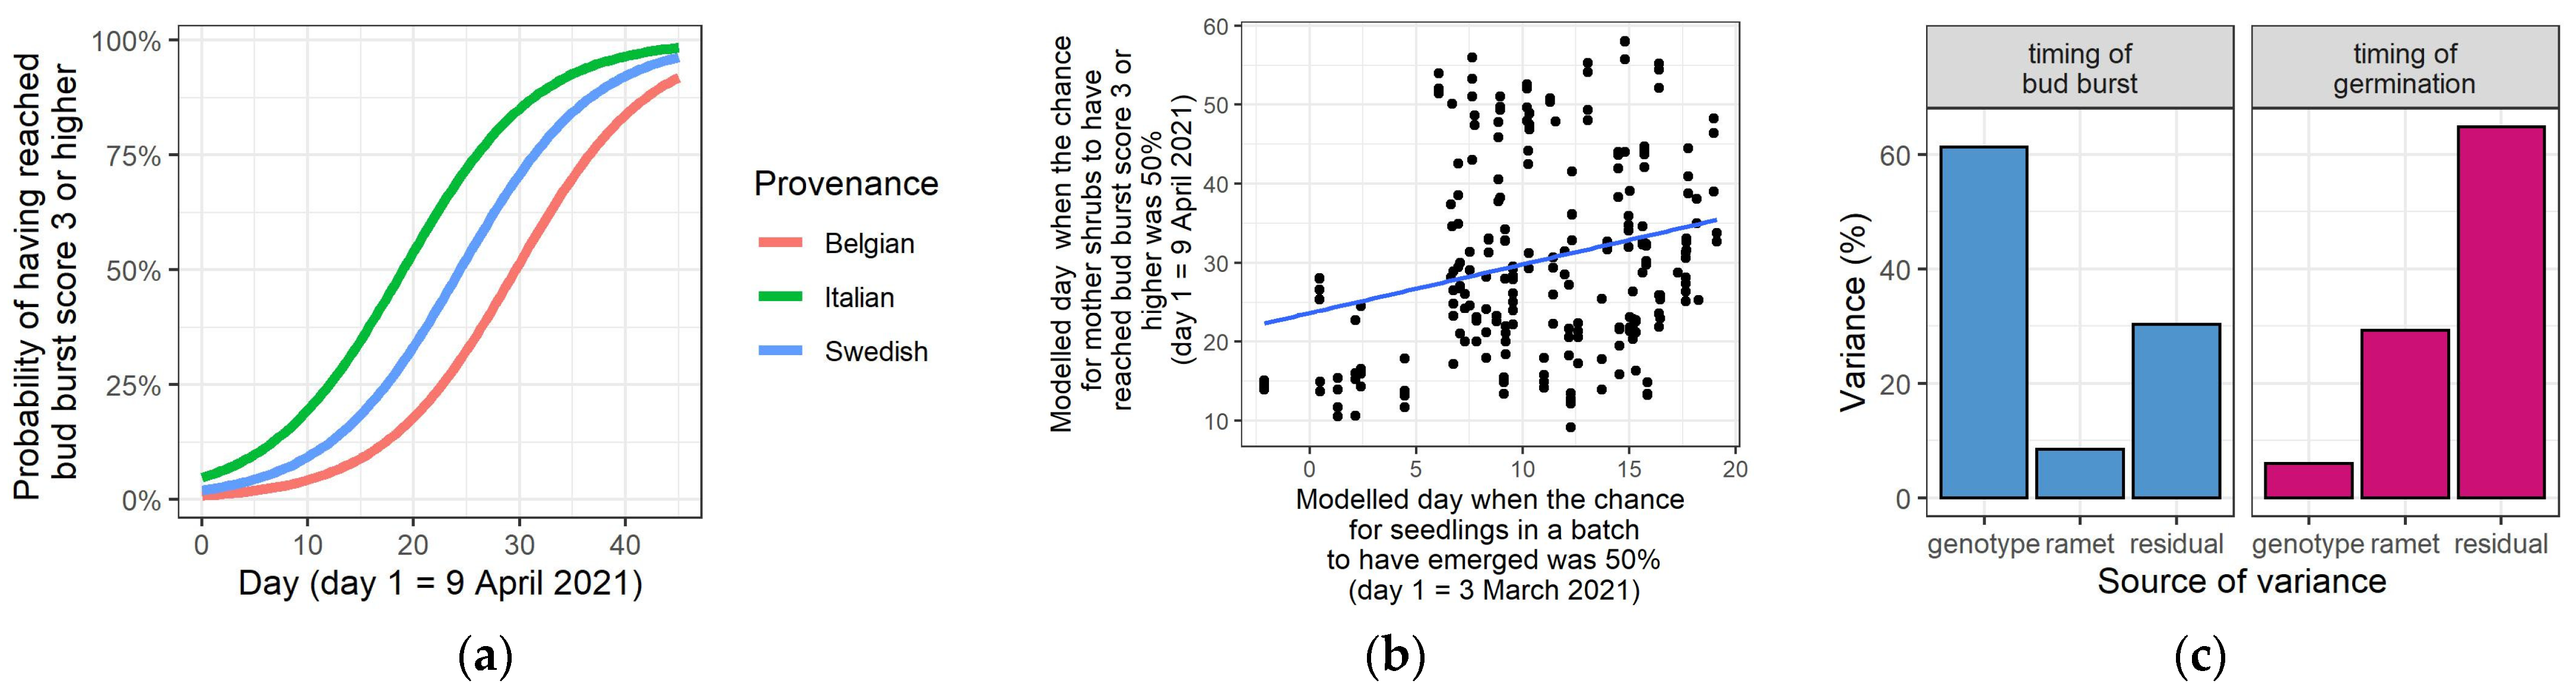
3.5. Timing of Bud Burst and Seedling Emergence

Two models were run to allow a comparison between the timing of bud burst on the mother shrubs in the common garden and the timing of seedling emergence, two phenological traits that were observed in the spring of 2021. As the treatment of the mother shrubs in 2018 had no effect anymore on these two phenological traits, this variable was omitted from the models. Bud burst in the Italian provenance occurred earlier than the Belgian provenance (p-value = 0.002 for It in Table 6 and Figure 6a, whereas the Swedish provenance only showed a tendency for earlier bud burst (p-value = 0.070 for Sw in Table 6 and Figure 6a). Seedlings from the Italian and Swedish provenances emerged earlier than the Belgian seedlings (p-values = 0.016 and 0.010, respectively, in Table 6).
For every mother shrub in the common garden, the modelled day was calculated when the chance to have reached at least bud burst score 3 was 50% (D50bb). Similarly, for every batch of stones collected on 16 July 2020, the modelled day was calculated when the chance to have already emerged was 50% (D50ge). The correlation coefficient between the D50bb and the D50ge values was 0.25 (p-value < 0.001) (Figure 6b).
The nested structure of the data allowed us to conduct a partitioning of variance analysis. For this, the two models used for the correlation analysis were run once more, but as linear models. This approximation for the ordinal and binomial data was applied as only linear models allow a partitioning of variance analysis. Because of the approximation, results should be taken with care. Still, there was a clear difference between the variance structure of the two models. For timing of bud burst, the relative variance between genotypes was larger than the relative variance between the ramets within a genotype together with the residual variance (Figure 6c). For the timing of seedling emergence, the relative variance between genotypes was very small in comparison to the relative variance which had no genetic base (variance between ramets within a genotype and residual variance).

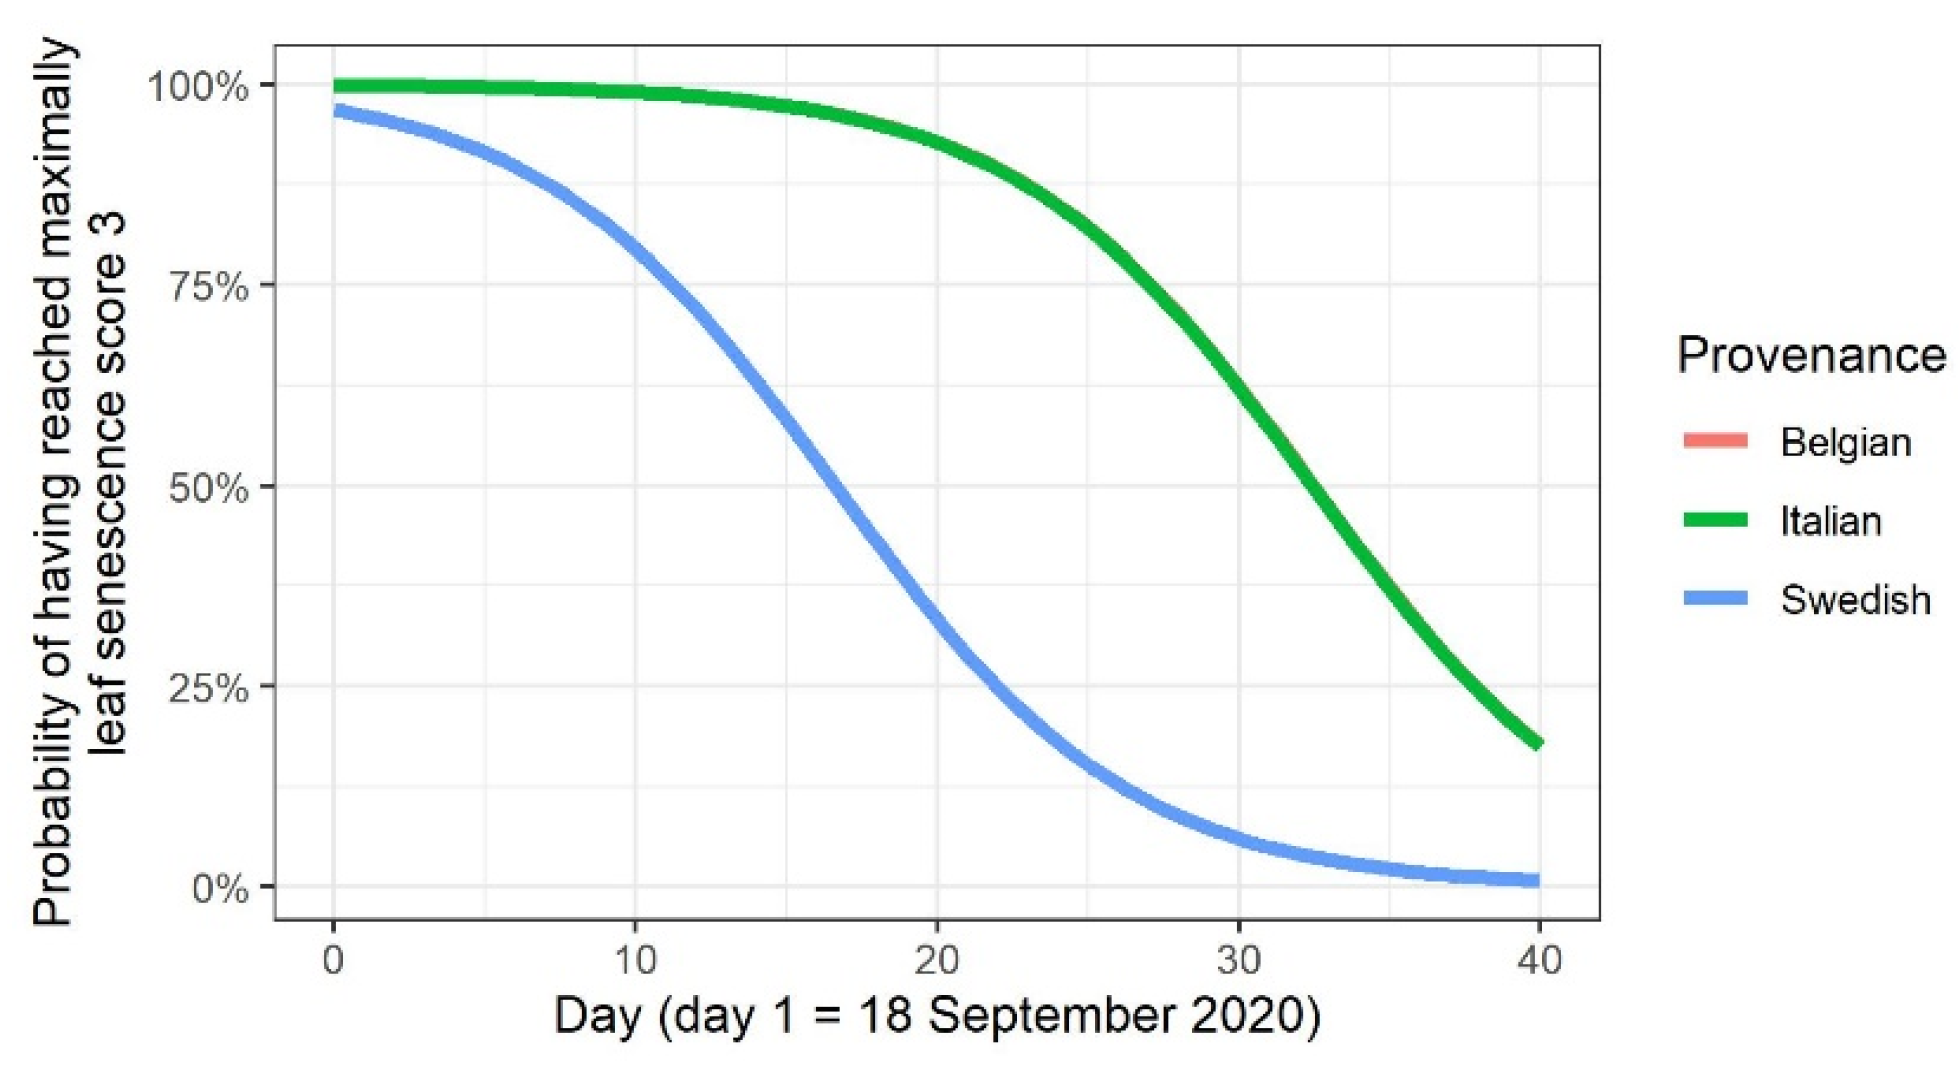
3.6. Leaf Senescence

The timing of leaf senescence in the autumn of 2020 was not influenced anymore by the treatment in 2018 (no significant p-value in Table 7). The Swedish provenance displayed an advanced leaf senescence when compared to the other two provenances (p-value < 0.001 for Sw in Table 7 and Figure 7).

4. Discussion

4.1. Influence of Former Water Limitation on Growth and Reproduction

A carbon isotope study showed that fruit production in several temperate tree species relies on carbohydrates that were synthesized through photosynthesis during the months preceding the fruit production [23], allowing a plastic response of fructification to variable growing conditions in the foregoing period. In our experiment, up to two years after the water withholding, the drought-treated shrubs in the common garden produced more berries than the non-treated shrubs, suggesting that a longer-lasting signal diverted newly synthesized carbohydrates toward berry production. In the second post-drought year, the shrubs still displayed a clear retarded height growth, pointing to a re-allocation of resources to reproduction rather than to growth. It should be noted that berry production in F. alnus in the year of a drought period, was found to be decreased and not yet increased in the treated group of plants [16], suggesting that a re-allocation of resources toward berry production is a longer-term effect. A similar observation is described for an 18-year-lasting rainfall-reduction experiment in a Mediterranean setting, where Quercus ilex and Arbutus unedo produced more fruits in comparison to controls [24]. On the other hand, an observational study of monospecies stands of Fagus sylvatica, Q. petraea and Q. robur, during a time period of 8 years, displayed no evidence for a trade-off between vegetative growth and reproduction, with seasonal temperatures positively correlating mainly with crown cover and fruit production [25]. This phenomenon was also described in other studies: e.g., in recent decades, a clear concurring increase in vegetative and reproductive growth was observed in Q. petraea and Q. robur stands in central Europe [26]. It is likely that favorable meteorological conditions may promote the buildup of resources, thus facilitating an allocation to both growth and reproduce together, whereas the maintenance of reproduction at the expense of growth, as observed in our common garden, may happen in more stressful growth conditions or as a response to it. In a tree ring analysis of F. sylvatica, the largest reductions in radial growth were observed in years with massive seed production coinciding with summer drought [27]. By shifting the allocation of resources to reproduction rather than to growth, woody plants may raise the probability of successful offspring at the expense of a higher probability of mortality, as the resources not allocated to growth may decrease stress defenses [28]. Stress-induced reproduction has mainly been studied in herbaceous plant species [29]. Seed production in temperate forest tree species often rely on mast seeding, the synchronous intermittent production of large seed crops, a mechanism that reduces the amount of seeds that are consumed by predators [30]. The responses of reproduction to stress events in mast seeding tree species is rather complex [31]. Still, some studies have found a possible link between drought events and mast seeding. Drought in early summer is a good predictor for masting in the following year for F. sylvatica and F. grandifolia [32]. In Abies alba Mill, a dry spring that was followed by a humid spring the next year could be correlated with high cone production two years later [33].
Two years after the drought treatment, stones extracted from the berries picked from drought-treated mother shrubs were slightly heavier than the controls. Additionally, these stones displayed a slightly higher germination percentage than controls. It should be noted that stone weight was included in the germination percentage model as a co-factor, indicating that the germination percentage was higher for stones derived from the drought-treated mother plants when considering equal weights of stones. A milder drought experiment in F. alnus (no plants died from the experienced stress) already showed that the germination percentage of stones derived from berries picked from mother shrubs in the same year that drought stress was imposed on these mother shrubs was higher in comparison to the controls [18], whereas the stone weight was not affected [17]. In the experiment here described, the imposed drought stress on the mother shrubs was more severe, as 41% of the plants had died off during the drought period, which may be a reason why stones derived from the drought-treated mother plants were heavier. The drought stress experienced by the mother shrubs, which affected the germination percentage of the derived stones, suggests a transgenerational effect of the drought, both in the same year of the drought treatment [18] and two years after the treatment (this study). It is likely that this transgenerational effect raised the chances of seedling survival in case the growth environment would remain stressful. This result may be related to the observation that the offspring of drought-treated grassland species produced higher amounts of seed when compared to offspring from control mother plants [34,35]. The higher amount of seeds would be needed to keep proper chances of survival in a continuing stressful growth environment. Similarly, in several annual plant species, dry-grown parents were shown to produce seeds with higher germination percentages [35,36]. Heavier stones derived from mother shrubs that experienced drought stress may be related to the finding that drought tolerance and heavy seeds are correlated functional traits, likely reflecting a general plant strategy [37]. A higher seed mass facilitates a quicker root development, in turn allowing germinating seedlings to rapidly escape a dry surface of the soil, thus enhancing the chances of survival [38].

4.2. Population Differentiation in the Common Garden

Berry counts and some phenological traits that we studied in the common garden displayed population differentiation, corroborating earlier findings. The local Belgian provenance produced more mature berries than the other two provenances, both in an earlier study [17] and in the experiment here described. As hypothesized before, this may suggest that in F. alnus, locally adapted provenances can invest more in reproduction. A higher reproductive output as an expression of local adaptation has been detected in reciprocal transplant experiments of several herbaceous plants [39,40].
The peak of berry production in 2020 was advanced in the Swedish provenance, while the Belgian and Italian provenances peaked congruently, as was already observed in a comparable experiment [17]. Based on the berry and leaf phenologies, it can be suggested that the phenology of berry maturation may be correlated with the timing of leaf senescence, as for the latter, the Swedish provenance was also advanced when compared to the other two provenances that displayed a similar timing. In monocarpic plants, the timing of seed maturation is closely associated with the timing of leaf senescence, as nutrients from the leaves are re-allocated to maturing seeds [41]. An indirect indication of a correlation between the phenologies of leaf senescence and seed maturation in a woody species was found in alternate-bearing pistachio (Pistacia vera L.), where 61% of the N storage originated from soil uptake in a non-reproductive year, whereas all the N was drawn from senescing leaves in a reproductive year [42].
Bud burst in the mother shrubs of the Italian and Swedish provenances started earlier (Italian) or tended to start earlier (Swedish) than the Belgian provenance. Interestingly, seedlings from the Italian and Swedish provenances likewise emerged earlier than the Belgian seedlings. These phenomena were already observed in a similar common garden experiment in F. alnus [18]. As was postulated, these findings may corroborate the hypothesis that bud and seed phenology in general may share a common genetic basis [43]. Some evidence has already been published. In apple fruit tree (Malus x domestica Borkh.) research, timing of bud burst and timing of seed germination were found to be related, and it was suggested that buds and seeds needed a similar chilling requirement [44]. Likewise, the chilling requirements for bud burst and seed germination were found to be correlated in walnut (Juglans regia L.) [45]. Here, we studied the putative relationship between the two phenological traits in more detail, and we found only a weak but significant correlation between the two phenophases. From a variance partitioning analysis, it could be deduced that the timing of bud burst was more strongly genetically defined than the timing of seedling emergence. The timing of bud burst is adapted to the local growth environment, leading to a higher relative genetic control [46] and high heritability values for this recurrent phenophase [47,48]. Seedling emergence, a process that only happens once in the lifetime of a tree, needs strong fine tuning with the very local micro-climate, and therefore likely benefits more from plasticity in its timing than bud burst. Likewise, it was already shown in a variance partitioning analysis that the timing of seedling emergence was less genetically determined in comparison to germination percentage [18]. It can be argued that once established, the rare occurrence of late spring frost damage on bursting buds and unfolding leaves may be less detrimental for the survival of the shrub or tree in comparison to an emerging seedling, justifying the need for a stronger plasticity in seedling emergence, which likely has its cost. This can be related to the finding in a reciprocal transplant experiment of F. sylvatica, including seven populations from south to north in its European distribution range, that germination was highly plastic in response to environmental conditions [49]. Additionally, environmental cues were found to tightly control the timing of germination in three Nothofagus species [50].

4.3. Phenology of Berry Maturation

As F. alnus flowers and fructifies on the current years’ shoots, mature berries are produced continuously during the whole summer. From the middle of July, the peak moment of berry production, till the end of August, the counts of mature berries, the mean stone weight and the germination percentage decreased in our study, whereas the timing of seedling emergence advanced slightly. A higher berry count co-occurring with a higher germination percentage may be related to silver birch (Betula pendula Roth), where seeds originating from trees that produced higher amounts of seeds also displayed a higher germination success [51]. It remains an intriguing question why F. alnus invests in berry production after the peak moment in the middle of July, for which survival chances of the offspring are lowered over time. As many tree species invest in inter-annual irregular seed production, i.e., the mast seeding, as a strategy to avoid seed losses [30], it could be hypothesized that berry production over a longer time intra-annually may also serve as a type of safeguard against seed loss at a certain time within the seasonal berry maturation period.
The advanced seedling emergence of the berries that were picked later in the growing season in our experiment, an effect that was corrected for stone weight (mean stone weight was present as a co-factor in the model), could be related to an earlier germination for seeds originating from genotypes that displayed later fruit maturation, as already found in apple (M. x domestica) [52].

5. Conclusions

We found that a severe water limitation can show legacy effects at least up to two years after the stress event. Height increment was still reduced while berry count, stone weight and germination percentage were raised in the treated plants, indicating a post-drought re-allocation of resources. The higher stone weight and the higher germination percentage two years after the drought treatment of the mother plants can be considered as transgenerational effects, which may help plants to survive in deteriorating environments. The observation that the local provenance produced more berries in comparison to a more northernly and a more southernly originating provenance suggests that translocation of provenances as an anticipation to the warming climate (assisted migration) should be considered with care.

Supplementary Materials

The following supporting information can be downloaded at: https://www.mdpi.com/article/10.3390/f14040857/s1. Figure S1: Distribution map of Frangula alnus in Europe, freely available at euforgen.org (accessed on 12 October 2022), with indication of the sampling sites (asterisk); Figure S2: Boxplots of mature berry counts in 2020, according to the treatment in 2018, to the provenance and to the berry collection days in 2020; Figure S3: Boxplots of the mean weight of a stone, according to the treatment in 2018, the provenance and the day of berry collection in 2020; Figure S4: Boxplots of the germination percentage, according to the day of berry collection in 2020, to the provenance and to the treatment in 2018.

Author Contributions

The described experiment was conceptualized by S.M. and K.V.M. The methodology was also demarcated by S.M. and K.V.M. Plants were grown by S.M. and M.S. (Marc Schouppe). Data collection and formal analysis were executed by M.S. (Marc Schouppe), Y.A.G., S.M., M.S. (Marie Stessens) and L.D. Data processing was completed by K.V.M., M.S. (Marie Stessens) and L.D. Manuscript preparation was performed by K.V.M. The manuscript was reviewed and edited by K.V.M., L.D. and M.S. (Marie Stessens). All authors have read and agreed to the published version of the manuscript.

Funding

This research received no external funding.

Data Availability Statement

Acknowledgments

We greatly appreciate Hanne De Kort for the original seed collection. Contribution to the data acquisition: Lisa Carnal, Amy Lauwers, Cédric Van Dun and Matthieu Gallin. Nico De Regge took care of the plants.

Conflicts of Interest

The authors declare no conflict of interest.

References

  1. Seidl, R.; Thom, D.; Kautz, M.; Martin-Benito, D.; Peltoniemi, M.; Vacchiano, G.; Wild, J.; Ascoli, D.; Petr, M.; Honkaniemi, J.; et al. Forest disturbances under climate change. Nat. Clim. Chang. 2017, 7, 395–402. [Google Scholar] [CrossRef] [PubMed]
  2. Patacca, M.; Lindner, M.; Lucas-Borja, M.E.; Cordonnier, T.; Fidej, G.; Gardiner, B.; Hauf, Y.; Jasinevičius, G.; Labonne, S.; Linkevičius, E.; et al. Significant increase in natural disturbance impacts on European forests since 1950. Glob. Chang. Biol. 2022, 29, 1359–1376. [Google Scholar] [CrossRef] [PubMed]
  3. Allen, C.D.; Macalady, A.K.; Chenchouni, H.; Bachelet, D.; McDowell, N.; Vennetier, M.; Kitzberger, T.; Rigling, A.; Breshears, D.D.; Hogg, E.H.; et al. A global overview of drought and heat-induced tree mortality reveals emerging climate change risks for forests. For. Ecol. Manag. 2010, 259, 660–684. [Google Scholar] [CrossRef]
  4. Allen, C.D.; Breshears, D.D.; McDowell, N.G. On underestimation of global vulnerability to tree mortality and forest die-off from hotter drought in the Anthropocene. Ecosphere 2015, 6, 1–55. [Google Scholar] [CrossRef]
  5. Bogdziewicz, M.; Kelly, D.; Thomas, P.A.; Lageard, J.G.; Hacket-Pain, A. Climate warming disrupts mast seeding and its fitness benefits in European beech. Nat. Plants 2020, 6, 88–94. [Google Scholar] [CrossRef]
  6. Monks, A.; Monks, J.M.; Tanentzap, A.J. Resource limitation underlying multiple masting models makes mast seeding sensitive to future climate change. New Phytol. 2016, 210, 419–430. [Google Scholar] [CrossRef]
  7. Bogdziewicz, M.; Ascoli, D.; Hacket-Pain, A.; Koenig, W.D.; Pearse, I.; Pesendorfer, M.; Satake, A.; Thomas, P.; Vacchiano, G.; Wohlgemuth, T.; et al. From theory to experiments for testing the proximate mechanisms of mast seeding: An agenda for an experimental ecology. Ecol. Lett. 2020, 23, 210–220. [Google Scholar] [CrossRef]
  8. Richardson, S.J.; Allen, R.B.; Whitehead, D.; Carswell, F.E.; Ruscoe, W.A.; Platt, K.H. Climate and Net Carbon Availability Determine Temporal Patterns of Seed Production by Nothofagus. Ecology 2005, 86, 972–981. [Google Scholar] [CrossRef]
  9. Redmond, M.D.; Forcella, F.; Barger, N.N. Declines in pinyon pine cone production associated with regional warming. Ecosphere 2012, 3, 1–14. [Google Scholar] [CrossRef]
  10. Allen, R.B.; Hurst, J.M.; Portier, J.; Richardson, S.J. Elevation-dependent responses of tree mast seeding to climate change over 45 years. Ecol. Evol. 2014, 4, 3525–3537. [Google Scholar] [CrossRef]
  11. Pesendorfer, M.B.; Bogdziewicz, M.; Szymkowiak, J.; Borowski, Z.; Kantorowicz, W.; Espelta, J.M.; Fernández-Martínez, M. Investigating the relationship between climate, stand age, and temporal trends in masting behavior of European forest trees. Glob. Chang. Biol. 2020, 26, 1654–1667. [Google Scholar] [CrossRef]
  12. Leuzinger, S.; Luo, Y.; Beier, C.; Dieleman, W.; Vicca, S.; Körner, C. Do global change experiments overestimate impacts on terrestrial ecosystems? Trends Ecol. Evol. 2011, 26, 236–241. [Google Scholar] [CrossRef]
  13. Herman, J.; Sultan, S. Adaptive Transgenerational Plasticity in Plants: Case Studies, Mechanisms, and Implications for Natural Populations. Front. Plant Sci. 2011, 2, 102. [Google Scholar] [CrossRef]
  14. Galloway, L.F.; Etterson, J.R. Transgenerational Plasticity Is Adaptive in the Wild. Science 2007, 318, 1134–1136. [Google Scholar] [CrossRef]
  15. Zecchin, B.; Caudullo, G.; de Rigo, D. Frangula alnus in Europe: Distribution, habitat, usage and threats. In European Atlas of Forest Tree Species; Publication Office of the European Union: Luxembourg, 2016. [Google Scholar]
  16. Vander Mijnsbrugge, K.; De Clerck, L.; Van der Schueren, N.; Moreels, S.; Lauwers, A.; Steppe, K.; De Ligne, L.; Campioli, M.; Van den Bulcke, J. Counter-Intuitive Response to Water Limitation in a Southern European Provenance of Frangula alnus Mill. in a Common Garden Experiment. Forests 2020, 11, 1186. [Google Scholar] [CrossRef]
  17. Vander Mijnsbrugge, K.; Schouppe, M.; Moreels, S.; Aguas Guerreiro, Y.; Decorte, L.; Stessens, M. Influence of Water Limitation and Provenance on Reproductive Traits in a Common Garden of Frangula alnus Mill. Forests 2022, 13, 1744. [Google Scholar] [CrossRef]
  18. Vander Mijnsbrugge, K.; Schouppe, M.; Moreels, S.; De Leenheer, S. Transgenerational Effects of Water Limitation on Reproductive Mother Plants in a Common Garden of the Shrub Frangula alnus. Forests 2023, 14, 348. [Google Scholar] [CrossRef]
  19. Fick, S.E.; Hijmans, R.J. WorldClim 2: New 1-km spatial resolution climate surfaces for global land areas. Int. J. Climatol. 2017, 37, 4302–4315. [Google Scholar] [CrossRef]
  20. Team, R.C. R: A Language and Environment for Statistical Computing; R Foundation for Statistical Computing: Vienna, Austria, 2019; Available online: http://www.R-project.org/ (accessed on 1 February 2020).
  21. Bates, D.; Machler, M.; Bolker, B.M.; Walker, S.C. Fitting Linear Mixed-Effects Models Using lme4. J. Stat. Softw. 2015, 67, 1–48. [Google Scholar] [CrossRef]
  22. Christensen, R.H.B. Ordinal: Regression Models for Ordinal Data, R Package Version 2015.6-28; R Foundation for Statistical Computing: Vienna, Austria, 2015. Available online: http://www.cran.r-project.org/package=ordinal/(accessed on 1 February 2020).
  23. Hoch, G.; Siegwolf, R.T.W.; Keel, S.G.; Körner, C.; Han, Q. Fruit production in three masting tree species does not rely on stored carbon reserves. Oecologia 2013, 171, 653–662. [Google Scholar] [CrossRef]
  24. Bogdziewicz, M.; Fernández-Martínez, M.; Espelta, J.M.; Ogaya, R.; Penuelas, J. Is forest fecundity resistant to drought? Results from an 18-yr rainfall-reduction experiment. New Phytol. 2020, 227, 1073–1080. [Google Scholar] [CrossRef] [PubMed]
  25. Vergotti, M.J.; Fernández-Martínez, M.; Kefauver, S.C.; Janssens, I.A.; Peñuelas, J. Weather and trade-offs between growth and reproduction regulate fruit production in European forests. Agric. For. Meteorol. 2019, 279, 107711. [Google Scholar] [CrossRef]
  26. Caignard, T.; Kremer, A.; Firmat, C.; Nicolas, M.; Venner, S.; Delzon, S. Increasing spring temperatures favor oak seed production in temperate areas. Sci. Rep. 2017, 7, 8555. [Google Scholar] [CrossRef] [PubMed]
  27. Hacket-Pain, A.J.; Lageard, J.G.A.; Thomas, P.A. Drought and reproductive effort interact to control growth of a temperate broadleaved tree species (Fagus sylvatica). Tree Physiol. 2017, 37, 744–754. [Google Scholar] [CrossRef] [PubMed]
  28. Lauder, J.D.; Moran, E.V.; Hart, S.C. Fight or flight? Potential tradeoffs between drought defense and reproduction in conifers. Tree Physiol. 2019, 39, 1071–1085. [Google Scholar] [CrossRef]
  29. Takeno, K. Stress-induced flowering: The third category of flowering response. J. Exp. Bot. 2016, 67, 4925–4934. [Google Scholar] [CrossRef]
  30. Zwolak, R.; Celebias, P.; Bogdziewicz, M. Global patterns in the predator satiation effect of masting: A meta-analysis. Proc. Natl. Acad. Sci. USA 2022, 119, e2105655119. [Google Scholar] [CrossRef]
  31. Bogdziewicz, M. How will global change affect plant reproduction? A framework for mast seeding trends. New Phytol. 2022, 234, 14–20. [Google Scholar] [CrossRef]
  32. Piovesan, G.; Adams, J.M. Masting behaviour in beech: Linking reproduction and climatic variation. Can. J. Bot. 2001, 79, 1039–1047. [Google Scholar] [CrossRef]
  33. Davi, H.; Cailleret, M.; Restoux, G.; Amm, A.; Pichot, C.; Fady, B. Disentangling the factors driving tree reproduction. Ecosphere 2016, 7, e01389. [Google Scholar] [CrossRef]
  34. Mojzes, A.; Kalapos, T.; Kröel-Dulay, G. Drought in maternal environment boosts offspring performance in a subordinate annual grass. Environ. Exp. Bot. 2021, 187, 104472. [Google Scholar] [CrossRef]
  35. Germain, R.M.; Caruso, C.M.; Maherali, H. Mechanisms and Consequences of Water Stress–Induced Parental Effects in an Invasive Annual Grass. Int. J. Plant Sci. 2013, 174, 886–895. [Google Scholar] [CrossRef]
  36. Tielbörger, K.; Valleriani, A. Can seeds predict their future? Germination strategies of density-regulated desert annuals. Oikos 2005, 111, 235–244. [Google Scholar] [CrossRef]
  37. Stahl, U.; Kattge, J.; Reu, B.; Voigt, W.; Ogle, K.; Dickie, J.; Wirth, C. Whole-plant trait spectra of North American woody plant species reflect fundamental ecological strategies. Ecosphere 2013, 4, art128. [Google Scholar] [CrossRef]
  38. Leishman, M.R.; Westoby, M. The Role of Seed Size in Seedling Establishment in Dry Soil Conditions—Experimental Evidence from Semi-Arid Species. J. Ecol. 1994, 82, 249–258. [Google Scholar] [CrossRef]
  39. Rice, K.J.; Knapp, E.E. Effects of Competition and Life History Stage on the Expression of Local Adaptation in Two Native Bunchgrasses. Restor. Ecol. 2008, 16, 12–23. [Google Scholar] [CrossRef]
  40. Hamann, E.; Kesselring, H.; Armbruster, G.F.J.; Scheepens, J.F.; Stöcklin, J. Evidence of local adaptation to fine- and coarse-grained environmental variability in Poa alpina in the Swiss Alps. J. Ecol. 2016, 104, 1627–1637. [Google Scholar] [CrossRef]
  41. Schippers, J.H.M.; Schmidt, R.; Wagstaff, C.; Jing, H.-C. Living to Die and Dying to Live: The Survival Strategy behind Leaf Senescence. Plant Physiol. 2015, 169, 914–930. [Google Scholar] [CrossRef]
  42. Rosecrance, R.C.; Weinbaum, S.A.; Brown, P.H. Alternate Bearing Affects Nitrogen, Phosphorus, Potassium and Starch Storage Pools in Mature Pistachio Trees. Ann. Bot. 1998, 82, 463–470. [Google Scholar] [CrossRef]
  43. Rohde, A.; Bhalerao, R. Plant dormancy in the perennial context. Trends Plant Sci. 2007, 12, 217–223. [Google Scholar] [CrossRef]
  44. Mehlenbacher, S.A.; Voordeckers, A.M. Relationship of flowering time, rate of seed germination, and time of leaf budbreak and usefulness in selecting for late-flowering apples. J. Am. Soc. Hortic. Sci. 1991, 116, 565–568. [Google Scholar] [CrossRef]
  45. Vahdati, K.; Aslani Aslamarz, A.; Rahemi, M.; Hassani, D.; Leslie, C. Mechanism of seed dormancy and its relationship to bud dormancy in Persian walnut. Environ. Exp. Bot. 2012, 75, 74–82. [Google Scholar] [CrossRef]
  46. Vander Mijnsbrugge, K.; Moreels, S. Varying Levels of Genetic Control and Phenotypic Plasticity in Timing of Bud Burst, Flower Opening, Leaf Senescence and Leaf Fall in Two Common Gardens of Prunus padus L. Forests 2020, 11, 1070. [Google Scholar] [CrossRef]
  47. Soularue, J.-P.; Kremer, A. Assortative mating and gene flow generate clinal phenological variation in trees. BMC Evol. Biol. 2012, 12, 79. [Google Scholar] [CrossRef]
  48. Savolainen, O.; Pyhäjärvi, T.; Knürr, T. Gene Flow and Local Adaptation in Trees. Annu. Rev. Ecol. Evol. Syst. 2007, 38, 595–619. [Google Scholar] [CrossRef]
  49. Muffler, L.; Schmeddes, J.; Weigel, R.; Barbeta, A.; Beil, I.; Bolte, A.; Buhk, C.; Holm, S.; Klein, G.; Klisz, M.; et al. High plasticity in germination and establishment success in the dominant forest tree Fagus sylvatica across Europe. Glob. Ecol. Biogeogr. 2021, 30, 1583–1596. [Google Scholar] [CrossRef]
  50. Arana, M.V.; Gonzalez-Polo, M.; Martinez-Meier, A.; Gallo, L.A.; Benech-Arnold, R.L.; Sánchez, R.A.; Batlla, D. Seed dormancy responses to temperature relate to Nothofagus species distribution and determine temporal patterns of germination across altitudes in Patagonia. New Phytol. 2016, 209, 507–520. [Google Scholar] [CrossRef]
  51. Rousi, M.; Heinonen, J.; Neuvonen, S. Intrapopulation variation in flowering phenology and fecundity of silver birch, implications for adaptability to changing climate. For. Ecol. Manag. 2011, 262, 2378–2385. [Google Scholar] [CrossRef]
  52. Pauwels, E.; Eyssen, R.; Keulemans, J. Seed dormancy and bud break of apple seedlings. Acta Hortic. 1998, 484, 119–122. [Google Scholar] [CrossRef]
Figure 1. Boxplot representing the height increment of the shrubs in the common garden in 2020, according to the provenances and treatment in 2018.
Forests 14 00857 g001
Figure 2. Actual (a) and modelled count of berries (b) on a shrub according to the treatment in 2018 and the provenance.
Forests 14 00857 g002
Figure 3. Modelled mature berry production on a shrub over time in 2020 for drought-treated and control plants, according to the provenance (a) and to the height of the plants (b).
Forests 14 00857 g003
Figure 4. Modelled mean weight of a stone, according to the treatment in 2018 and to the day of berry collection in 2020 (a) and modelled germination percentage according to the treatment in 2018, to the day of berry collection in 2020 and to the mean stone weight (b).
Forests 14 00857 g004
Figure 5. Modelled timing of seedling emergence in the spring of 2021, according to the day of berry collection in 2020 (a) and the provenance and mean stone weight (b).
Forests 14 00857 g005
Figure 6. Modelled timing of bud burst on the mother shrubs in the spring of 2021, according to the provenance (a). Scatter plot comparing the modelled days when the chance for seedlings to have emerged was 50% with the modelled days when the chance for the mother shrubs to have reached at least bud burst score 3 was 50%. Linear regression line is shown (b). Partitioning of variance for bud burst and seedling emergence in the spring of 2021 (c).
Forests 14 00857 g006
Figure 7. Modelled timing of leaf senescence on the mother shrubs in the autumn of 2020, according to the provenance. Belgian and Italian lines overlap.
Forests 14 00857 g007
Table 1. Number of stratified batches (nb°) and sum of stones in the batches (ns°), for each provenance of the mother plants, for each treatment of the mother plants in 2020 (control and drought) and for each berry collection day in 2020.
Berry Collection DayBelgianItalianSwedishTotal
ControlDroughtControlDroughtControlDroughtControlDrought
nb°ns°nb°ns°nb°ns°nb°ns°nb°ns°nb°ns°ns°ns°
16 July1712141695474425118146481356423041636
24 July177241472982344471344581191403895
7 August174621633261013307115312678374
21 August95212422412135135957
Table 2. Statistical analysis of height increment in 2020. In the model, the Belgian provenance is the standard to which the Italian (It) and Swedish (Sw) provenances are compared, and for the treatment in 2018 (T), the control is the standard to which the water limitation is compared.
VariableEstimateStd. Errordft-Valuep-Value
(Intercept)64.9482.40419627.021<0.001 ***
It4.5284.625330.9790.335
Sw−6.1173.48033−1.7580.088
T−9.0951.830196−10.434<0.001 ***
*** p < 0.001.
Table 3. Statistical analysis of the mature berry counts in 2019 and 2020. In the model, the Belgian provenance is the standard to which the Italian (It) and Swedish (Sw) provenances are compared, and for the treatment in 2018 (T), the control is the standard to which the water limitation is compared.
YearVariableEstimateStd. Errorz-Valuep-Value
2019(Intercept)0.8400.3772.230.026 *
It−0.1530.391−0.3920.695
Sw−0.5920.370−1.6000.110
T0.7540.1236.119<0.001 ***
H190.0020.0040.5400.589
2020(Intercept)0.450.261.760.079
It−0.970.31−3.130.002 **
Sw−0.830.22−3.74<0.001 ***
T0.220.112.050.040 *
H200.010.002.030.042 *
C−18.671.45−12.89<0.001 ***
C2−28.351.09−26.08<0.001 ***
C39.080.959.58<0.001 ***
C:It−7.624.95−1.540.123
C2:It−6.553.47−1.890.059
C3:It5.772.941.970.049 *
C:Sw−29.603.98−7.44<0.001 ***
C2:Sw5.502.781.980.048 *
C3:Sw1.561.950.800.423
*** p < 0.001; ** p < 0.01; * p < 0.05. H19 and H20: height measurements in 2019 and 2020, respectively; C: day of berry counting.
Table 4. Statistical analysis of the mean weight of a stone in 2020. In the model, the Belgian provenance is the standard to which the Italian (It) and Swedish (Sw) provenances are compared, and for the treatment in 2018 (T), the control is the standard to which the water limitation is compared.
VariableEstimateStd. Errordft-Valuep-Value
(Intercept)0.01660.000613128.15<0.001 ***
It0.00180.0012311.560.128
Sw0.00080.0009310.960.343
T0.00080.0004342.250.031 *
C−0.02050.0022131−9.27<0.001 ***
C2−0.01720.0022131−7.84<0.001 ***
*** p < 0.001; * p < 0.05. C: day of berry collection.
Table 5. Statistical analysis of the germination percentage and the timing of seedling emergence in the spring of 2021. In the model, the Belgian provenance is the standard to which the Italian (It) and Swedish (Sw) provenances are compared, and for the treatment in 2018 (T), the control is the standard to which the water limitation is compared.
Germination Percentage Timing of Seedling Emergence
VariableEstimateStd. Errordft-Valuep-ValueEstimateStd. Errorz-Valuep-Value
(Intercept)15.229.391281.620.107−4.040.46−8.80<0.001 ***
It−8.025.2031−1.540.1331.010.283.60<0.001 ***
Sw−1.113.8531−0.290.7750.750.203.73<0.001 ***
T7.932.44333.250.003 **−0.240.17−1.440.151
S2661.75434.731286.12<0.001 ***57.8921.572.680.007 **
C−1.120.11128−9.86<0.001 ***0.020.012.240.025 *
D 0.210.0090.95<0.001 ***
*** p < 0.001; ** p < 0.01; * p < 0.05. S: mean weight of a stone; C: day of berry collection in 2020; D: counting day of emerged seedlings in the spring of 2021.
Table 6. Statistical analysis of the timing of bud burst on the mother shrubs and the timing of seedling emergence, both in the spring of 2021. In the model, the Belgian provenance is the standard to which the Italian (It) and Swedish (Sw) provenances are compared.
Timing of Bud Burst on Mother ShrubsTiming of Seedling Emergence
VariableEstimateStd. Errorz-Valuep-ValueEstimateStd. Errorz-Valuep-Value
It−1.680.55−3.030.002 **0.870.362.420.016 *
Sw−0.830.46−1.810.0700.710.282.580.010 *
H20/S0.040.016.41<0.001 ***100.3360.471.660.097
D−0.160.01−29.36<0.001 ***0.190.0070.59<0.001 ***
*** p < 0.001; ** p < 0.01; * p < 0.05. H20: height of the mother shrubs in 2020 (bud burst); S: the mean weight of a stone (seedling emergence); D: day of bud burst observation or the counting day of emerging seedlings.
Table 7. Statistical analysis of the timing of leaf senescence on the mother shrubs in the autumn of 2020. In the model, the Belgian provenance is the standard to which the Italian (It) and Swedish (Sw) provenances are compared, and for the treatment in 2018 (T), the control is the standard to which the water limitation is compared.
VariableEstimateStd. Errorz-Valuep-Value
It0.0090.4550.0190.984
Sw3.2440.4018.088<0.001 ***
T−0.0490.210−0.2360.813
H200.0230.0063.747<0.001 ***
D0.2050.01020.287<0.001 ***
*** p < 0.001. H20: height of the mother shrubs in 2020; D: day of leaf senescence observation.
Disclaimer/Publisher’s Note: The statements, opinions and data contained in all publications are solely those of the individual author(s) and contributor(s) and not of MDPI and/or the editor(s). MDPI and/or the editor(s) disclaim responsibility for any injury to people or property resulting from any ideas, methods, instructions or products referred to in the content.

