Article

Short-Term Effects of Bamboo Biochar and Oyster Shell Powder on Soil Organic Carbon Fraction, Microbial Respiration, and Enzymatic Stoichiometry in a Lei Bamboo Plantation

1
The State Key Laboratory of Subtropical Silviculture, Zhejiang A&F University, Linan, Hangzhou 311300, China
2
Agricultural and Rural Bureau of Qu Jiang District, Quzhou 324000, China
3
Agricultural Technology Extension Centre, Lin’an Municipal Bureau of Agriculture, Hangzhou 311300, China
*
Author to whom correspondence should be addressed.
These authors contributed equally to this work.
Forests 2023, 14(4), 853; https://doi.org/10.3390/f14040853
Submission received: 26 February 2023 / Revised: 12 April 2023 / Accepted: 18 April 2023 / Published: 21 April 2023
(This article belongs to the Section Forest Soil)

Abstract

:
Both biochar and oyster shell powder have been known as promising amendments to ameliorate soil acidity and enhance soil fertility. However, it is still unclear how their application alone and in combination affect the soil organic carbon (C) fraction and microbial activity in subtropical bamboo plantations. Therefore, to investigate the effects of biochar and oyster shell powder on soil microbial respiration, organic C fractions, microbial biomass, and enzyme activities related to C, N and P cycling, topsoil samples were collected from plots in a bamboo (Phyllostachys praecox) plantation that has been amended with oyster shell powder at 4 t ha−1 (T), bamboo biochar at 10 t ha−1 (B), and their combination (TB, with 4 t ha−1 T and 10 t ha−1 B) for 8 months. Our results showed that T alone significantly increased soil microbial respiration by 21.5%, whereas B alone and TB significantly decreased soil microbial respiration and metabolic quotient compared with T. T alone also increased soil pH, the size of labile C pool and the activities of β−glucosidase and cellobiosidase, whereas TB rather than B increased soil pH, the recalcitrant C pool size and declined these enzyme activities relative to T. T alone significantly enhanced microbial C limitation by 28.6% and decreased P limitation by 13.0%, while TB decreased microbial C limitation and increased microbial C use efficiency (CUE). Structural equation modeling indicated that T enhanced soil microbial respiration through increasing soil pH and enzyme activity, while biochar co-addition weakened the stimulation of T on microbial respiration by increasing soil recalcitrant C pool size and microbial metabolic quotient. Our study suggests that adding bamboo biochar together with oyster shell powder could be a better strategy to decrease soil C loss and ameliorate soil acidity in bamboo plantations compared with the application of oyster shell powder alone.

1. Introduction

Forest soils store about 45% of terrestrial carbon of soil organic carbon (SOC) and play a key role in the global C cycle [1]. Increasing SOC storage and soil fertility are crucial for soil C sequestration and plant productivity, in particular in plantation ecosystems [2]. The rapid growth rate and high yield of bamboo have led to its widespread cultivation, and bamboo plantations have emerged as a promising option for sequestering atmospheric CO2 [3]. Among bamboo species, Lei bamboo (Phyllostachys praecox) is a major cash crop for edible shoot production and is frequently planted in southern China. In recent years, a large amount of chemical fertilizer has been applied to the Lei Bamboo plantations in order to achieve high yields, leading to soil acidification and reduction of carbon sequestration [4,5]. Therefore, soil amendments and management practices that reduce soil acidity and increase soil C storage simultaneously are urgently needed to achieve a more sustainable bamboo plantation.
Oyster shell powder and biochar applied in various systems have been reported to reduce soil acidity and improve soil quality in recent years [6,7,8,9]. As a shellfish by-product from the fishing industry, oyster shell powder is available at a low price, and has been recommended as a soil amendment because it can significantly increase soil pH, nitrogen (N) and phosphorus (P) concentrations, enzyme activity and crop yield [10,11]. However, a few studies reported that oyster shell powder had limited ability to increase soil C storage in the short term since it contains a small organic C content and even accelerates the decomposition of soil organic C once incorporated [10,12,13]. Biochar has been recognized as a promising way to increase soil C storage and improve soil quality because it has abundant recalcitrant C and a porous structure with strong water and nutrient retention abilities [7,14,15,16]. However, the amelioration effect of biochar on soil acidity varies depending on the crop, soil type and other factors [6,7]. Our previous study found that bamboo biochar significantly increased soil organic C content but failed to increase plant growth and reduced soil exchangeable acids compared to biochar from corn straw [17]. Moreover, it has been shown that adding biochar and organic amendments (manure and straw) together could reduce the stimulation of organic amendments on SOC decomposition [18,19,20]. However, the effects of adding bamboo biochar and oyster shell powder together on soil organic C fractions and soil acidity remain largely unknown. Therefore, considering the individual advantage of bamboo biochar and oyster shell powder, we hypothesize that the combined application of these two amendments may effectively ameliorate soil acidity while increasing SOC storage.
SOC decomposition mediated by microbial activity releases heterotrophic respiration and is a key pathway for SOC loss to the atmosphere [21]. SOC is a major abiotic factor affecting microbial respiration, and an increase in its recalcitrant C content can reduce the rate of microbial respiration and facilitate SOC stability [22]. In addition, shifts in microbial ecological strategies (R-strategy and K-strategy) can also affect microbial respiration rates to some extent, and the K-strategy is more favorable to SOC stabilization compared to the R-strategy [23]. Extracellular enzyme activity is a key biotic factor regulating SOC mineralization. Organic amendments, such as straw and manure, usually increase soil enzyme activity and accelerate SOC loss [20], whereas biochar applications have been reported to reduce microbial activity and make microbial communities more conducive to C sequestration [16]. Recently, ecoenzymatic stoichiometry has been considered a more sensitive indicator to reveal the relationship between microbial nutrient demand and soil nutrient supply [24,25,26,27]. Observing changes in enzymatic stoichiometric characteristics can clarify the status of microbial resource limitation and their linkage with soil organic matter decomposition mediated by soil microbial activity. It has been well documented that when soil microbial metabolism is restricted by C or mineral nutrients, soil microorganisms can regulate extracellular enzyme production to mobilize the substrates containing the limiting elements, thereby increasing or decreasing soil organic C decomposition [28]. Among the ecoenzymatic stoichiometry indicators, vector variables have been proposed as a powerful index to reflect the relative C limitation (indicated by vector length) and relative N vs. P limitation (indicated by vector angle) by microorganisms [29,30,31,32]. Based on a vector analysis of soil enzyme activities, Yuan et al. found a strong microbial P limitation in tropical soils that influences soil C cycling [33]. Similarly, nitrogen fertilizer addition increased microbial P limitation, which promoted the decomposition of labile organic C [34]. Our previous study also showed that microbial nutrient metabolism was limited by N in soils amended with straw residue but was limited by C under biochars [5]. However, information on how oyster shell powder and biochar affect microbial nutrient limitation and how microbial nutrient limitation relates to soil organic carbon decomposition is still limited.
The purpose of this study was to investigate the short-term effects of biochar and oyster shell powder alone and in combination on soil chemical properties, the size of soil labile and recalcitrant C pools, soil microbial biomass and respiration rate, and enzyme activities in a Lei bamboo plantation. We hypothesized that biochar combined with oyster shell powder might reduce the stimulation of oyster shell powder on soil microbial respiration and enzyme activity and increase soil organic C recalcitrancy. To test this hypothesis, a field experiment was conducted using oyster shell powder, biochar and their combination in a bamboo plantation.

2. Materials and Methods

2.1. Site Description

The field experiment was established in Taihuyuan Town (30°23′ N, 119°72′ E), Lin’an District, Hangzhou City, Zhejiang Province, China. The site has a monsoonal subtropical climate, with an average annual precipitation of 1614 mm, an average annual temperature of 15.8 °C and an elevation of 104 m above sea level. Lei bamboo (Phyllostachys praecox) plantations are widely distributed in the local area for edible shoot production. The bamboo plantations are usually managed intensively by applying mineral fertilizer 3 times a year and mulching with rice hulls in winter. The total amount of fertilizers applied ranged up to 2.2 t ha−1 of compound fertilizer (N:P2O5:K2O = 15:15:15) combined with 1.1 t ha−1 of urea. According to the FAO soil classification system, the soil is classified as Ferrisols, with a pH of 4.18, total N of 2.91 g kg−1, soil organic C of 28.50 g kg−1, total P of 1.05 g kg−1, available P of 195.23 mg kg−1, and available K of 488.25 mg kg−1.

2.2. Experimental Design

The field trial consisted of 4 treatments: a non-amendment control (CK), an amendment of oyster shell powder at 4 t ha−1 (T), an amendment of biochar at 10 t ha−1 (B), and a combined application of oyster shell powder at 4 t ha−1 and biochar at 10 t ha−1 (TB). The 4 treatments were arranged in a randomized block design with 3 replicates (12 plots in total). Each plot had an area of 35 m2 with a bamboo plant density of 8860 stems ha−1 and was separated by a 1 m-wide row. In the middle of each row, a PVC board was inserted into the soil to 50 cm in depth to limit the bamboo rhizome connecting between each other. The tested biochar was prepared by cutting bamboo sticks into small pieces (approximately 10 cm in length), then pyrolyzed in a kiln at 600 °C for 4 h under oxygen-limited conditions. Biochar was passed through a 2 mm sieve before application. The biochar had a pH of 9.32, total C of 82.15%, total N of 0.43%, total P of 1.27 mg kg−1, C/N of 191.05, dissolved organic C of 236 mg kg−1, ash content of 8.65%, surface area of 0.89 m2 g−1 and bulk density of 0.21 g cm−3. The tested oyster shell powder was produced from oyster shell, with a pH of 8.66, CaO of 53%, organic C of 1.46%, N of 0.16%, P of 0.12%, K of 0.40%, magnesium (Mg) of 0.51%, available P of 70 mg kg−1. In mid-October 2018, biochar and oyster shell powder were spread evenly on the surface of the plots by hand, then incorporated thoroughly to a depth of 0–15 cm by manual plowing. The bamboo plantation was managed with fertilization and winter mulching following local management practice, as described by Qin et al. [4].

2.3. Soil Sampling and Chemical Properties Analysis

In June 2019, 5 soil cores (with a diameter of 5 cm) were randomly taken from each plot (0–15 cm depth) and mixed thoroughly to form a composite plot sample. Each plot sample was passed through a 2 mm sieve, homogenized and divided into 3 equal portions. One portion was air-dried at room temperature for soil chemical analysis, 1 portion was freeze-dried and kept at −70 °C until soil DNA extraction, and the remaining soil was kept at 4 °C and used for the determination of soil microbial respiration, microbial biomass and enzyme activity.
Soil pH was measured by a pH meter with a soil: water ratio of 1:2.5. Soil total nitrogen (TN) content was measured with the Kjeldahl method, and SOC was determined by K2CrO7 oxidation [35]. Soil total P (TP) was determined by the HClO4-H2SO4 procedure. Soil available P (AP) was measured by spectrophotometry. Soil available K (AK) was extracted by 1 M NH4OAc. Soil microbial biomass carbon (MBC) and microbial biomass nitrogen (MBN) were quantified by chloroform fumigation-K2SO4 extraction, and C and N contents of the unfumigated samples were set as soil dissolved organic C (DOC) and dissolved N (DN) [36]. According to Rovira and Vallejo, a 2-step acid hydrolysis process was used to quantify the size of 2 soil labile C pools (LPI−C and LPII−C), where LPI−C was extracted by 2.5 M H2SO4, and LPII−C was extracted by 13 M H2SO4. The recalcitrant C pool (RP−C) was calculated as the SOC concentration minus those of 2 labile C pools [37]. We also calculated soil microbial quotient (qMB, as the ratio of MBC/SOC) and soil microbial metabolic quotient (qCO2, as the ratio of SMR/MBC) according to Liu et al. [38].

2.4. Determination of Soil Microbial Respiration

Soil microbial respiration was determined with the MicroResp™ soil respiration system [39]. The system has a deep well plate that can contain fresh soil and carbon sources and a CO2 detection microplate. The CO2 detection microplate was prepared with Noble agar (1%) based gel containing 150 mM potassium chloride solution, 2.5 mM sodium bicarbonate and 12.5 ppm (w/w) cresol red. A 0.3 g fresh soil sample was added to each deep-well plate without adding any C substrates but moistened to 60% of water hold capacity with distilled water and incubated in the dark for 6 h at 25 °C. After incubation, the CO2 efflux was determined by a microplate reader at 570 nm. In this study, we measured the soil microbial respiration rate of each soil sample within a 2-month period. Distilled water was added to the soil every 2 days to main the soil moisture during the incubation. Soil microbial respiration rate (SMR) was calculated as C mg−1 dry soil kg−1 d−1.

2.5. Soil DNA Extraction and Quantitative Real-Time PCR

Soil DNA was extracted with a PowerSoil DNA isolation kit (Mo Bio Laboratories Inc., Carlsbad, CA, USA). The quality of DNA was examined by agarose gel electrophoresis and quantified using a Nanodrop 2000 Spectrophotometer (Thermo Scientific, Waltham, MA, USA). Abundances of bacterial 16S rRNA, fungal 18S rRNA and archaeal 16S rRNA gene fragments were determined by quantitative real-time PCR with their specific primers, according to Situ et al. [40]. The PCR mixture and programs were described in our previous study [40]. Standard curves were constructed with serial dilutions of known copy numbers of plasmids containing these gene fragments. All samples were repeated in triplicate to ensure accuracy.

2.6. Soil Enzyme Activity Measurement and Their Stoichiometry Analysis

The activities of N−acetylglucosaminidase (NAG), leucine aminopeptidase (LAP), β− glucosidase (BG), cellobiohydrolase (CB), and acid phosphatase (PHOS) were determined according to Saiya−Cork et al. [41]. Detailed procedures have been provided in our previous study [20]. A geometric mean of the measured enzyme activities (GMEA), as an indicator of the total enzyme activity of each soil, was determined according to Chen et al. [42] as follows: GMEA = (NAG × LAP × BG × CB × PHOS)1/5.
According to Moorhead et al. [29], the vector length and vector angle were calculated based on enzyme activity as follows:
Vector   length = X 2 + Y 2
  Vector   angle = Degrees   ( ATAN 2 ( X , Y ) )
where X represents the relative activity of C to P acquiring enzymes, that is (BG + CB)/(BG + CB + PHOS); Where Y means the relative activity of C to N acquiring enzymes, that is (BG + CB)/(BG + CB + NAG + LAP). According to Moorhead et al. [29], a longer vector length suggests a relatively larger microbial C limitation, and a vector angle <45° or >45° indicates N or P limitation, respectively.
We also calculated microbial carbon use efficiency (CUE) based on stoichiometry theory, which was calculated as follows:
CUE =   CUE max [ S C : N / ( S C : N + K ) ]
S C : N = ( 1 / EEA C : N ) ( B C : N / L C : N )
where CUEmax means the upper limit of the microbial growth efficiency, which was set to 0.6 based on thermodynamic constraints. K represents a half-saturation constant and was set to 0.5. EEAC:N indicates the ratio of C to N-acquiring enzyme activities and was calculated as (BG + CB):(NAG + LAP). BC:N is represented by MBC:MBN, and LC:N means the C:N ratio of accessible resources and is represented by DOC:DN [43].

2.7. Statistical Analysis

The statistical significance of the differences among treatments was tested by a 1-way ANOVA followed by Duncan’s multiple comparisons test. The interactive effects of oyster shell powder and biochar on soil chemical and biological properties were determined with a 2-way analysis of variance (ANOVA). Redundancy analysis (RDA) evaluated how soil chemical properties affected enzyme activities and their stoichiometry (Canoco 5.0). The correlations among soil microbial respiration rate, soil chemical properties and enzyme activities were determined by Pearson’s correlation. A structural equation model (SEM) was constructed to determine the factors affecting soil microbial respiration rate according to the relationships among each variable. We assumed that changes in soil pH and the size of the soil recalcitrant C pool were key factors influencing soil microbial respiration through soil enzymatic and microbial activities. In our model, soil pH and recalcitrant C fractions were considered exogenous variables, while microbial metabolic quotient and ecoenzymatic stoichiometry indicators were set as endogenous variables. Finally, soil microbial respiration rate was classified as a response variable. SEM analysis was carried out with AMOS 18.0 software (IBM, Chicago, IL, USA).

3. Results

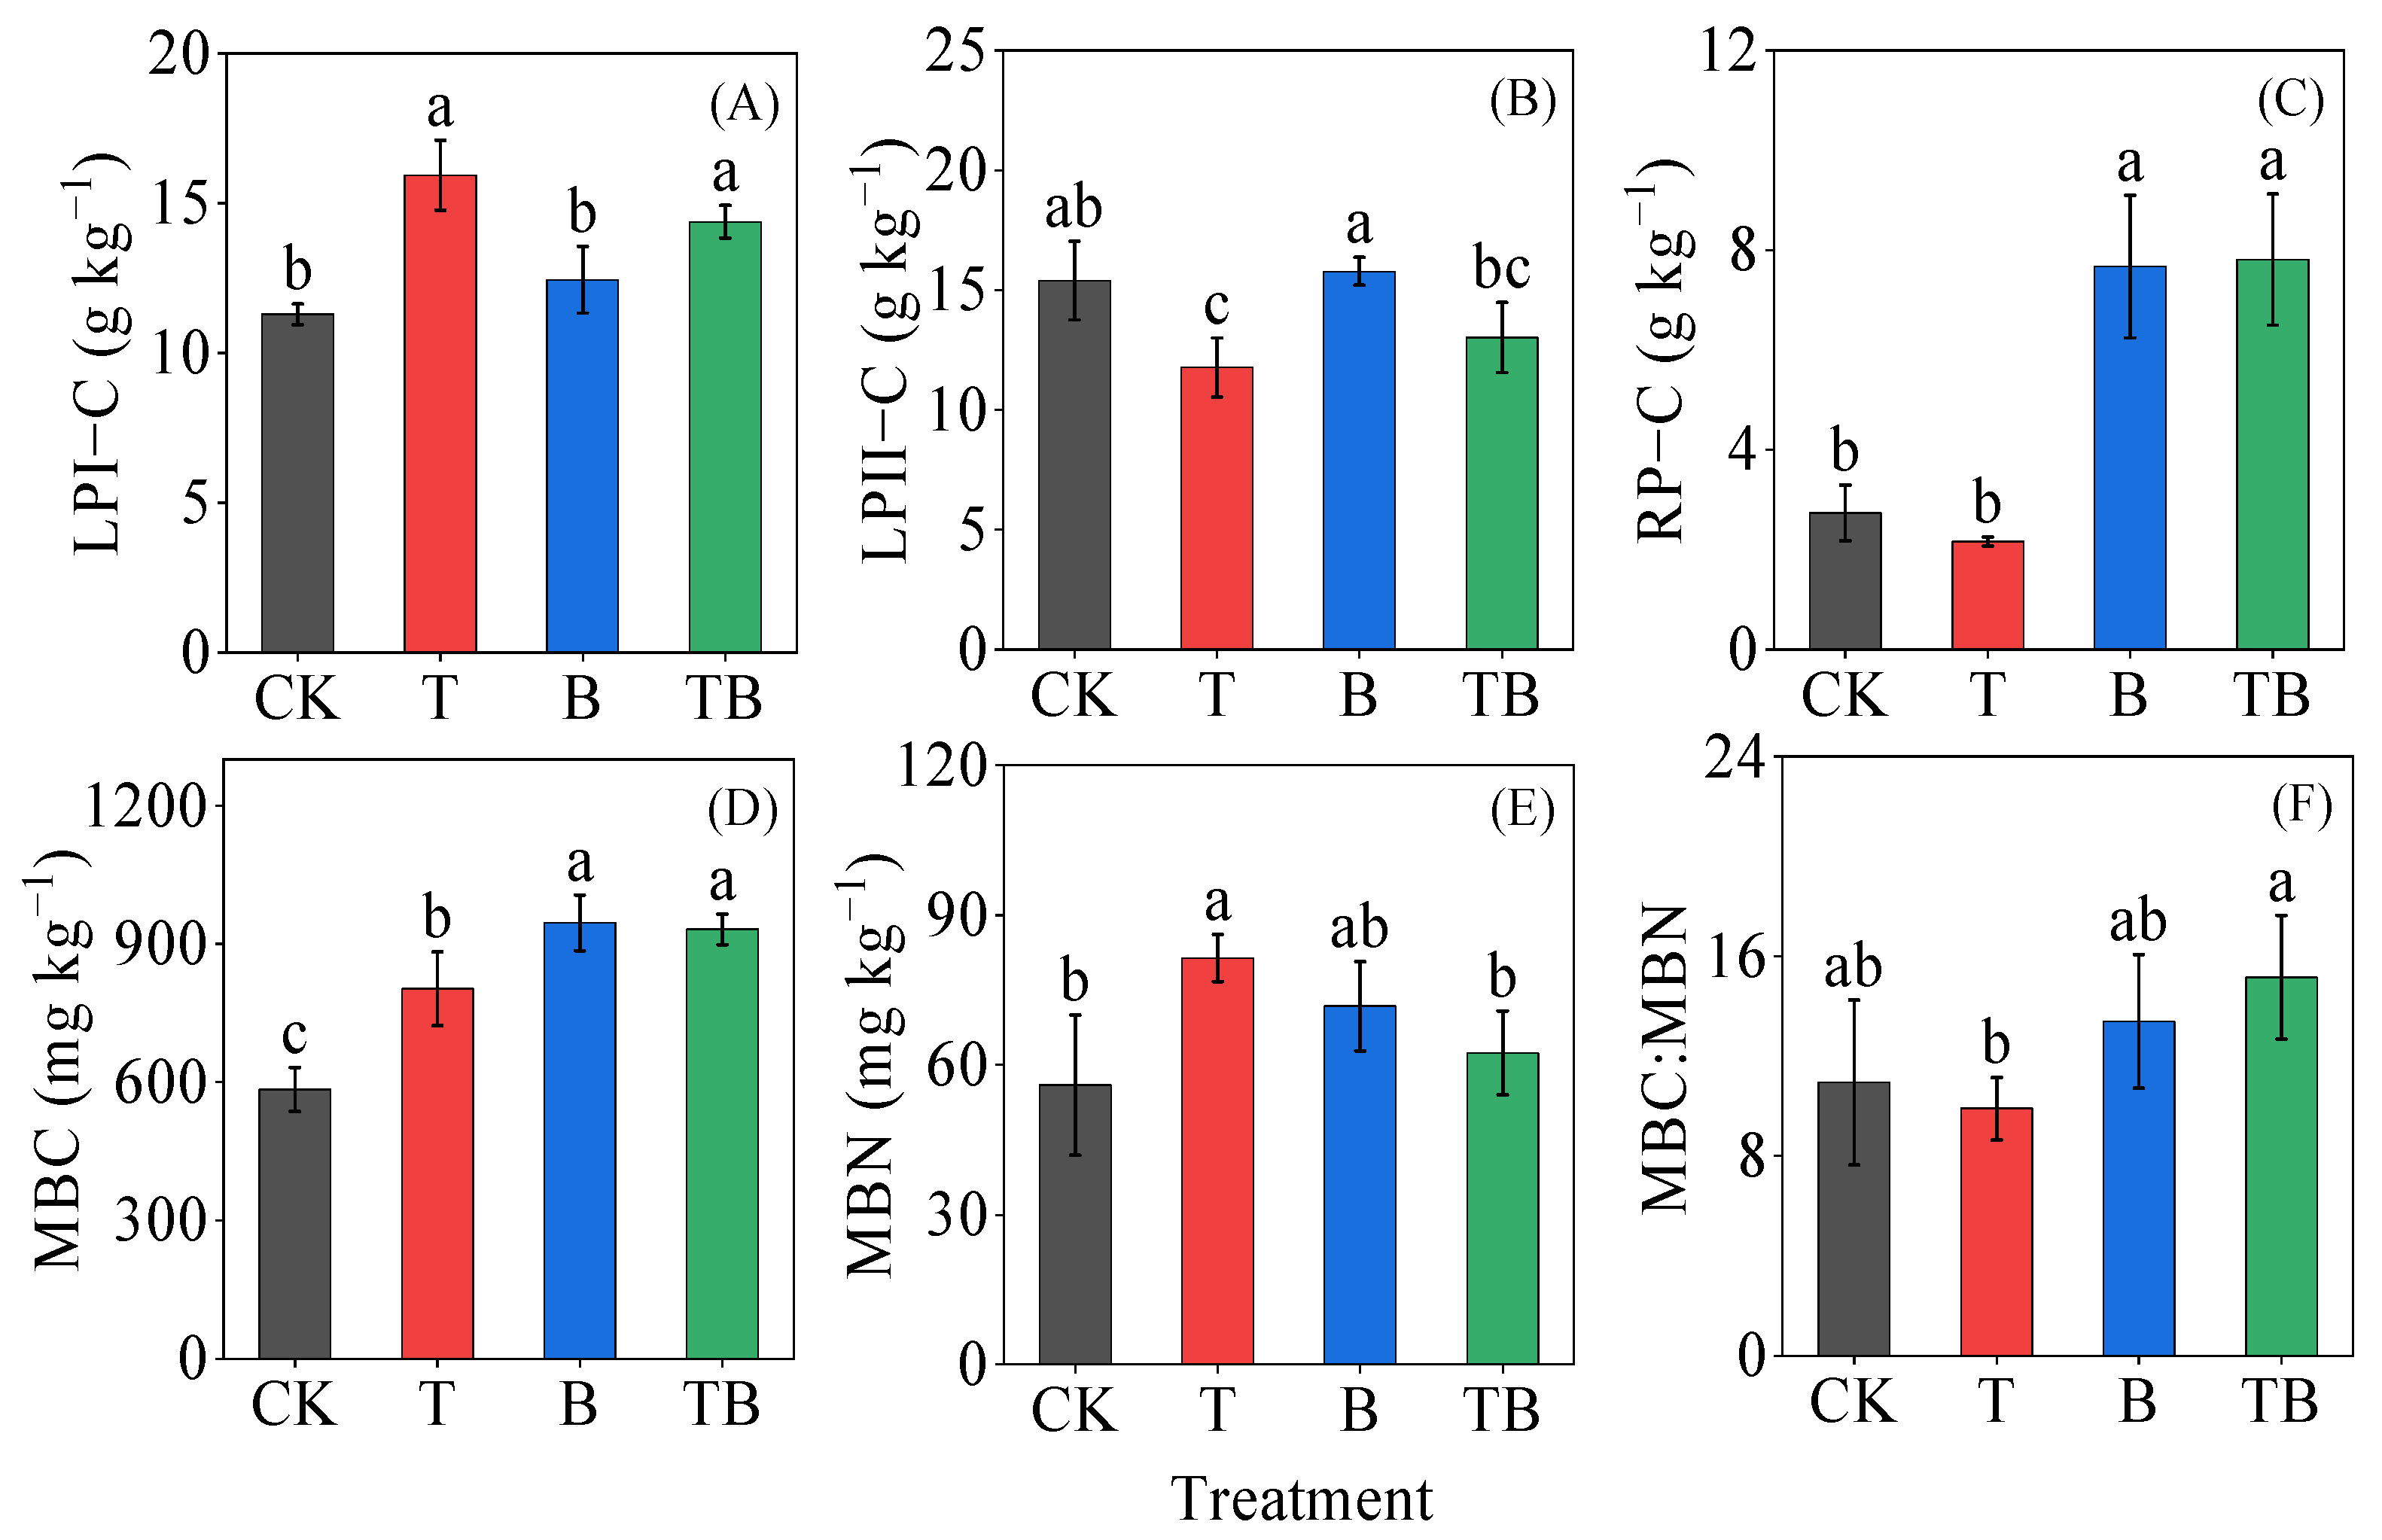
3.1. Soil Chemical Properties

The two-way ANOVA results showed that oyster shell powder (T) had significant effects on soil pH and DN content, while bamboo biochar (B) had significant effects on SOC, DOC, and C:N, and there was a significant interactive effect on DN content (Table S1). Compared to the control (CK), T alone significantly (p < 0.05) increased soil pH and DN content by 67.7% and 29.7%, respectively. B alone significantly (p < 0.01) increased SOC, DOC and C:N by 20.9%, 9.4% and 18.9%, respectively (Table 1). Combined application of oyster shell powder and biochar (TB) significantly (p < 0.05) increased pH, the contents of SOC, DOC and DN by 60.1%, 19.6%, 10.9% and 61.6%, respectively, compared to CK (Table 1). T treatment significantly (p < 0.05) increased the size of the LPI−C pool by 41.1% and reduced the size of LPII−C by 23.6% compared with CK (Figure 1A,B). B significantly increased the size of RP−C by 179.9% (Figure 1C) and had no effect on LPI−C and LPII−C (Figure 1A,B). Compared with T, TB significantly increased the size of RP−C by 261.6% (Figure 1C).

3.2. Soil Microbial Respiration, Microbial Metabolic Quotient and Microbial Biomass

The application of T had a significant effect on soil microbial respiration rate (p < 0.01), whereas biochar and their interaction had no effect (Table S1). Compared with CK, T alone increased the cumulative CO2 efflux and the mean soil microbial respiration rate (SMR) by 17.6% and 21.5% (p < 0.01), while the application of B alone and TB had no significant effect on them (Figure 2A,B and Table S1).
Compared with CK, T treatment significantly (p < 0.05) increased MBC, MBN, soil microbial quotient (qMB), and the ratio of SMR/SOC by 37.4%, 45.4%, 36.5%, and 16.7%, respectively, but had no effect on the qCO2 (Figure 1D,E and Figure 2C–E). B significantly increased MBC and qMB by 61.9% and 33.8% while decreasing qCO2 and SMR/SOC by 39.0% and 22.2%, respectively (Figure 1D and Figure 2C–E). Compared with T, TB significantly (p < 0.05) increased MBC while decreasing qCO2 and SMR/SOC by 23.5% and 23.8% (Figure 1D and Figure 2C,E).
The two-way ANOVA results showed that T had significant effects on the abundances of bacteria and archaea, and T and B had a significant interaction on bacterial abundance (Table S1). Compared with CK, T and TB treatments significantly (p < 0.05) increased the abundance of bacteria by 97.0% and 28.3%, and the abundance of archaea by 92.0% and 96.1%, respectively (Figure 2F,H). Both had little effect on the abundance of fungi (Figure 2G).

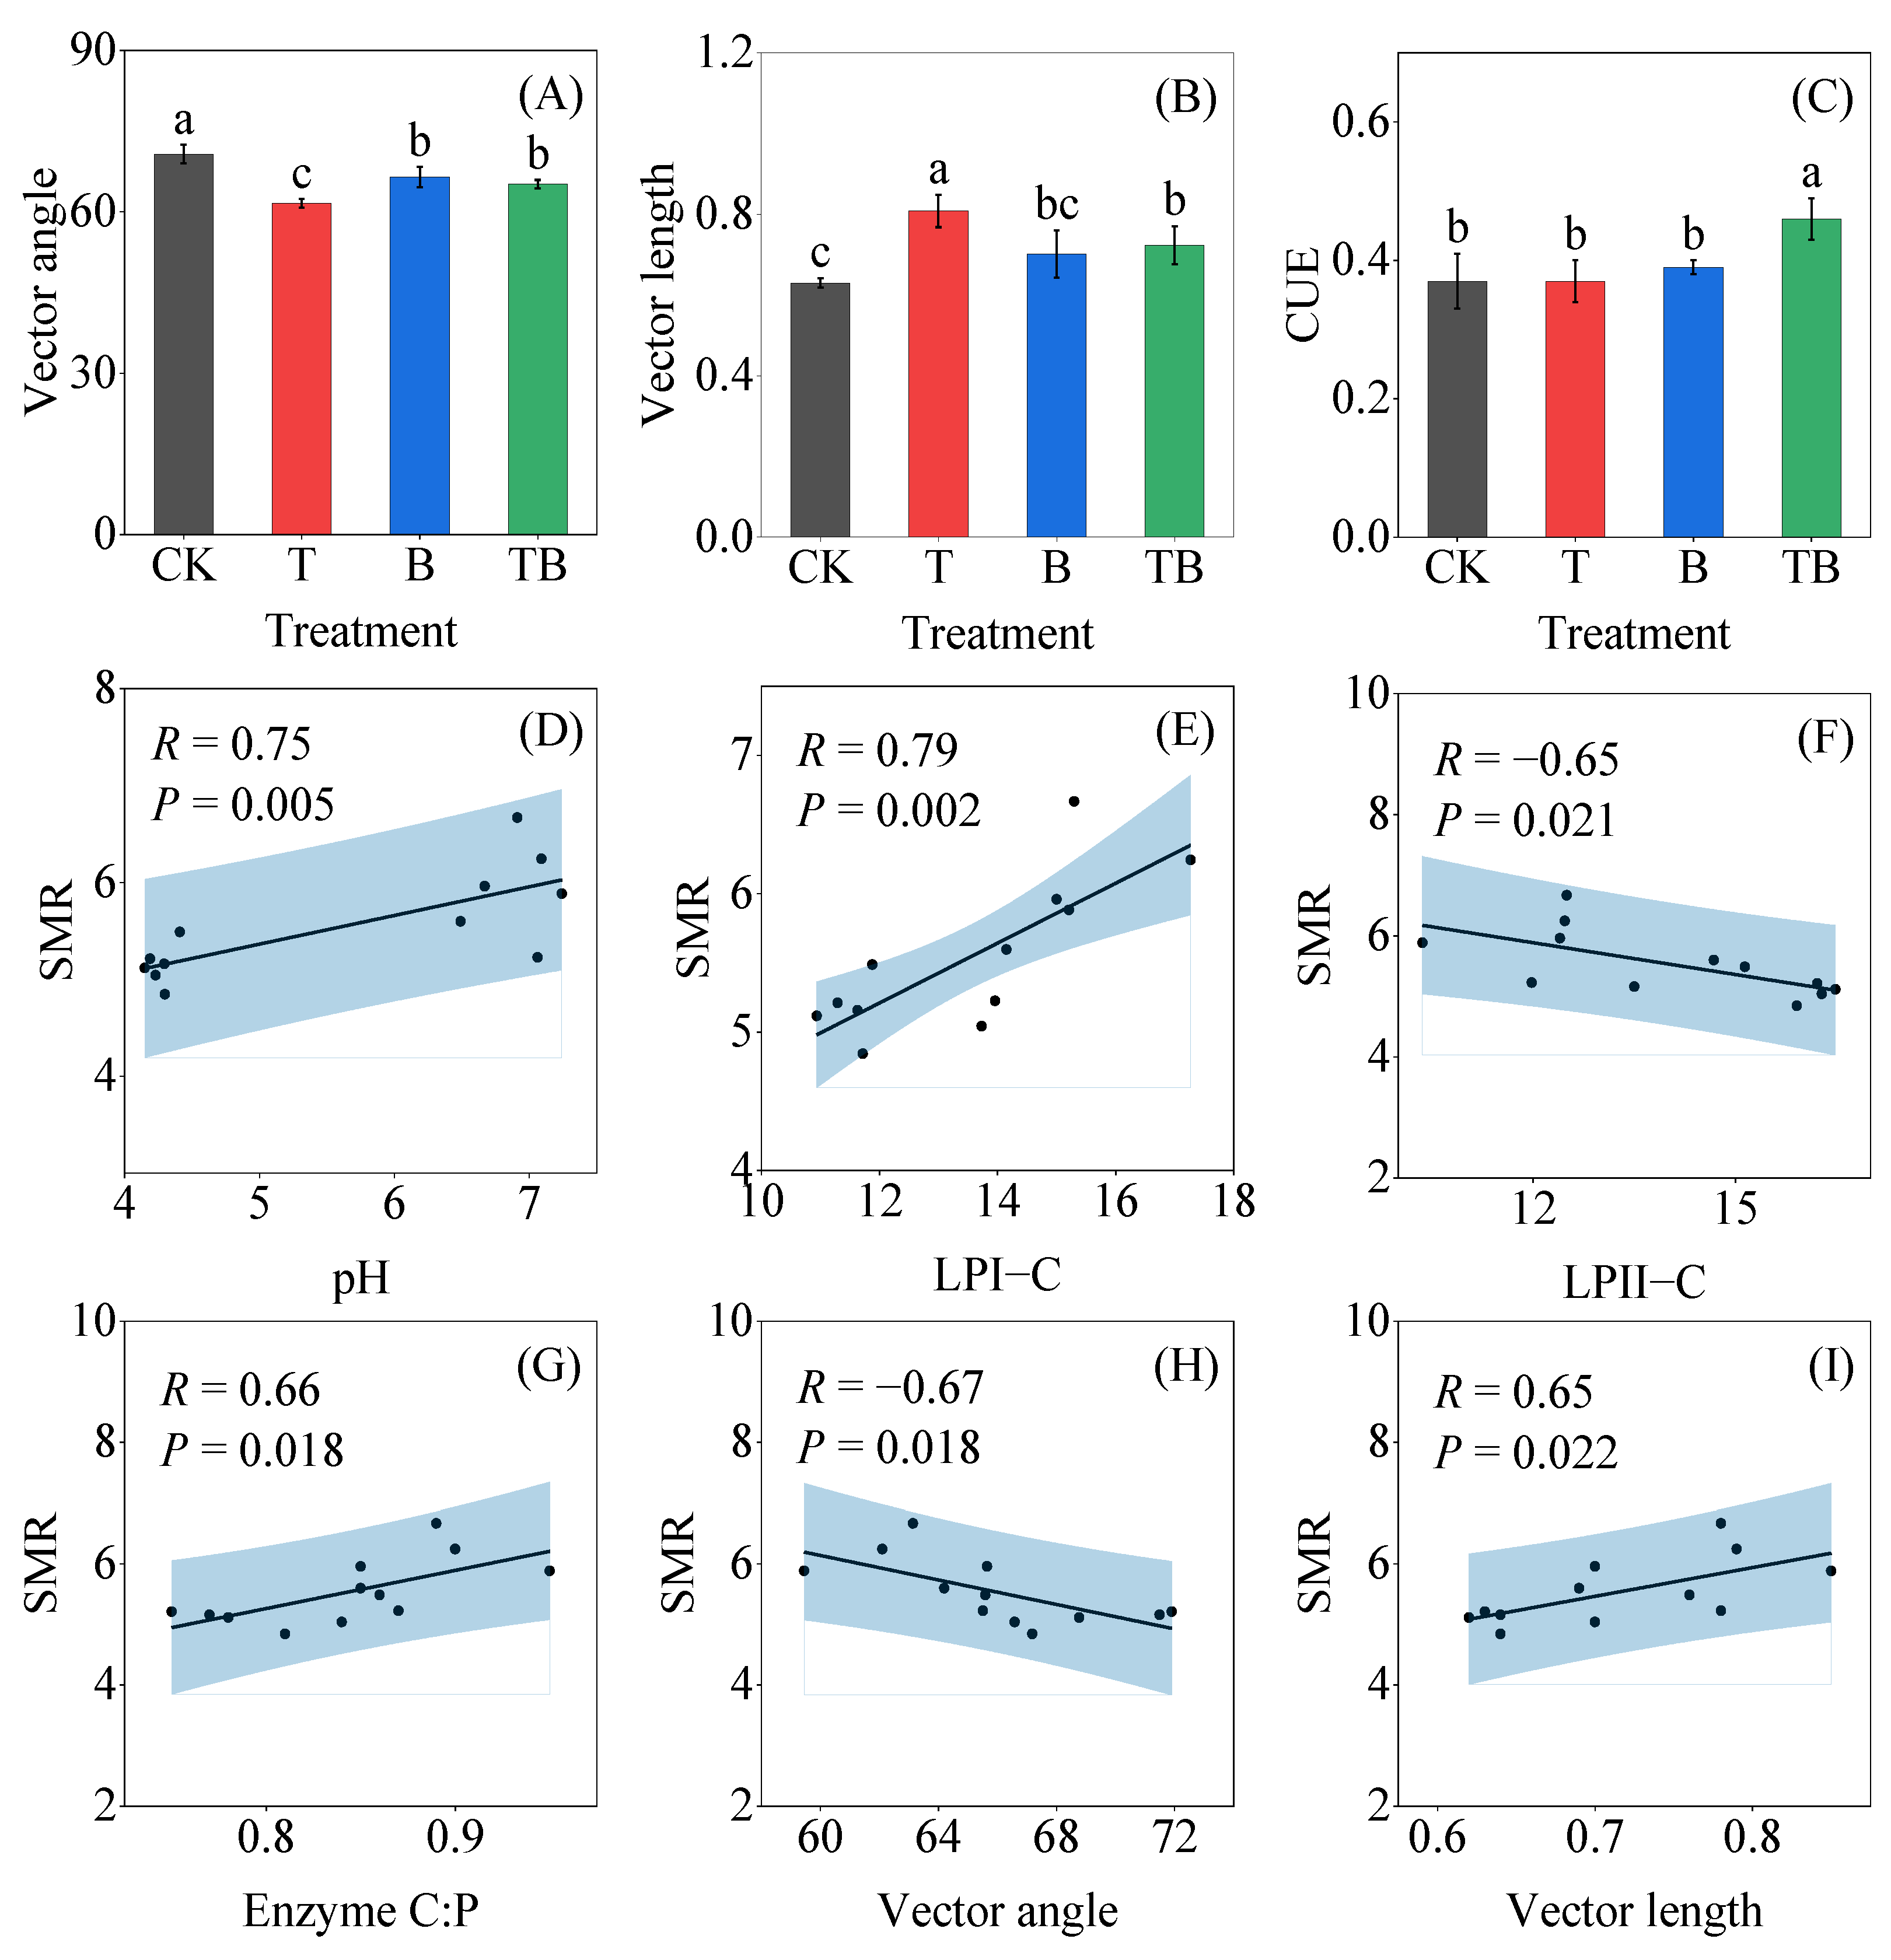
3.3. Soil Enzyme Activity and Stoichiometry

The two-way ANOVA results showed that T and B had significant (p < 0.05) interactions on BG and CB activities, enzyme C:P, GMEA, vector length, vector angle and CUE (p < 0.05; Table S1). Compared with CK, T alone increased the activities of BG, CB, LAP, GMEA, and vector length by 106.1%, 98.0%, 57.61%, 44.1%, and 28.6%, respectively, while decreasing the vector angle by 13.0% (Figure 3A,B,D,I and Figure 4A,B). B also significantly (p < 0.05) increased the activities of BG, CB and GMEA by 49.2%, 60.1%, and 26.4%, respectively, while decreasing the vector angle by 6.0% (Figure 3A,B,I and Figure 4A). However, TB significantly decreased the activities of BG and CB by 15.0% and 21.1%, respectively, compared with T alone (Figure 3A,B). In addition, T significantly (p < 0.05) enhanced enzyme C:N, C:P, and N:P ratios by 10.0%, 19.5% and 8.6%, while TB significantly decreased enzyme C:P by 6.5% in comparison with T alone (Figure 3F–H).

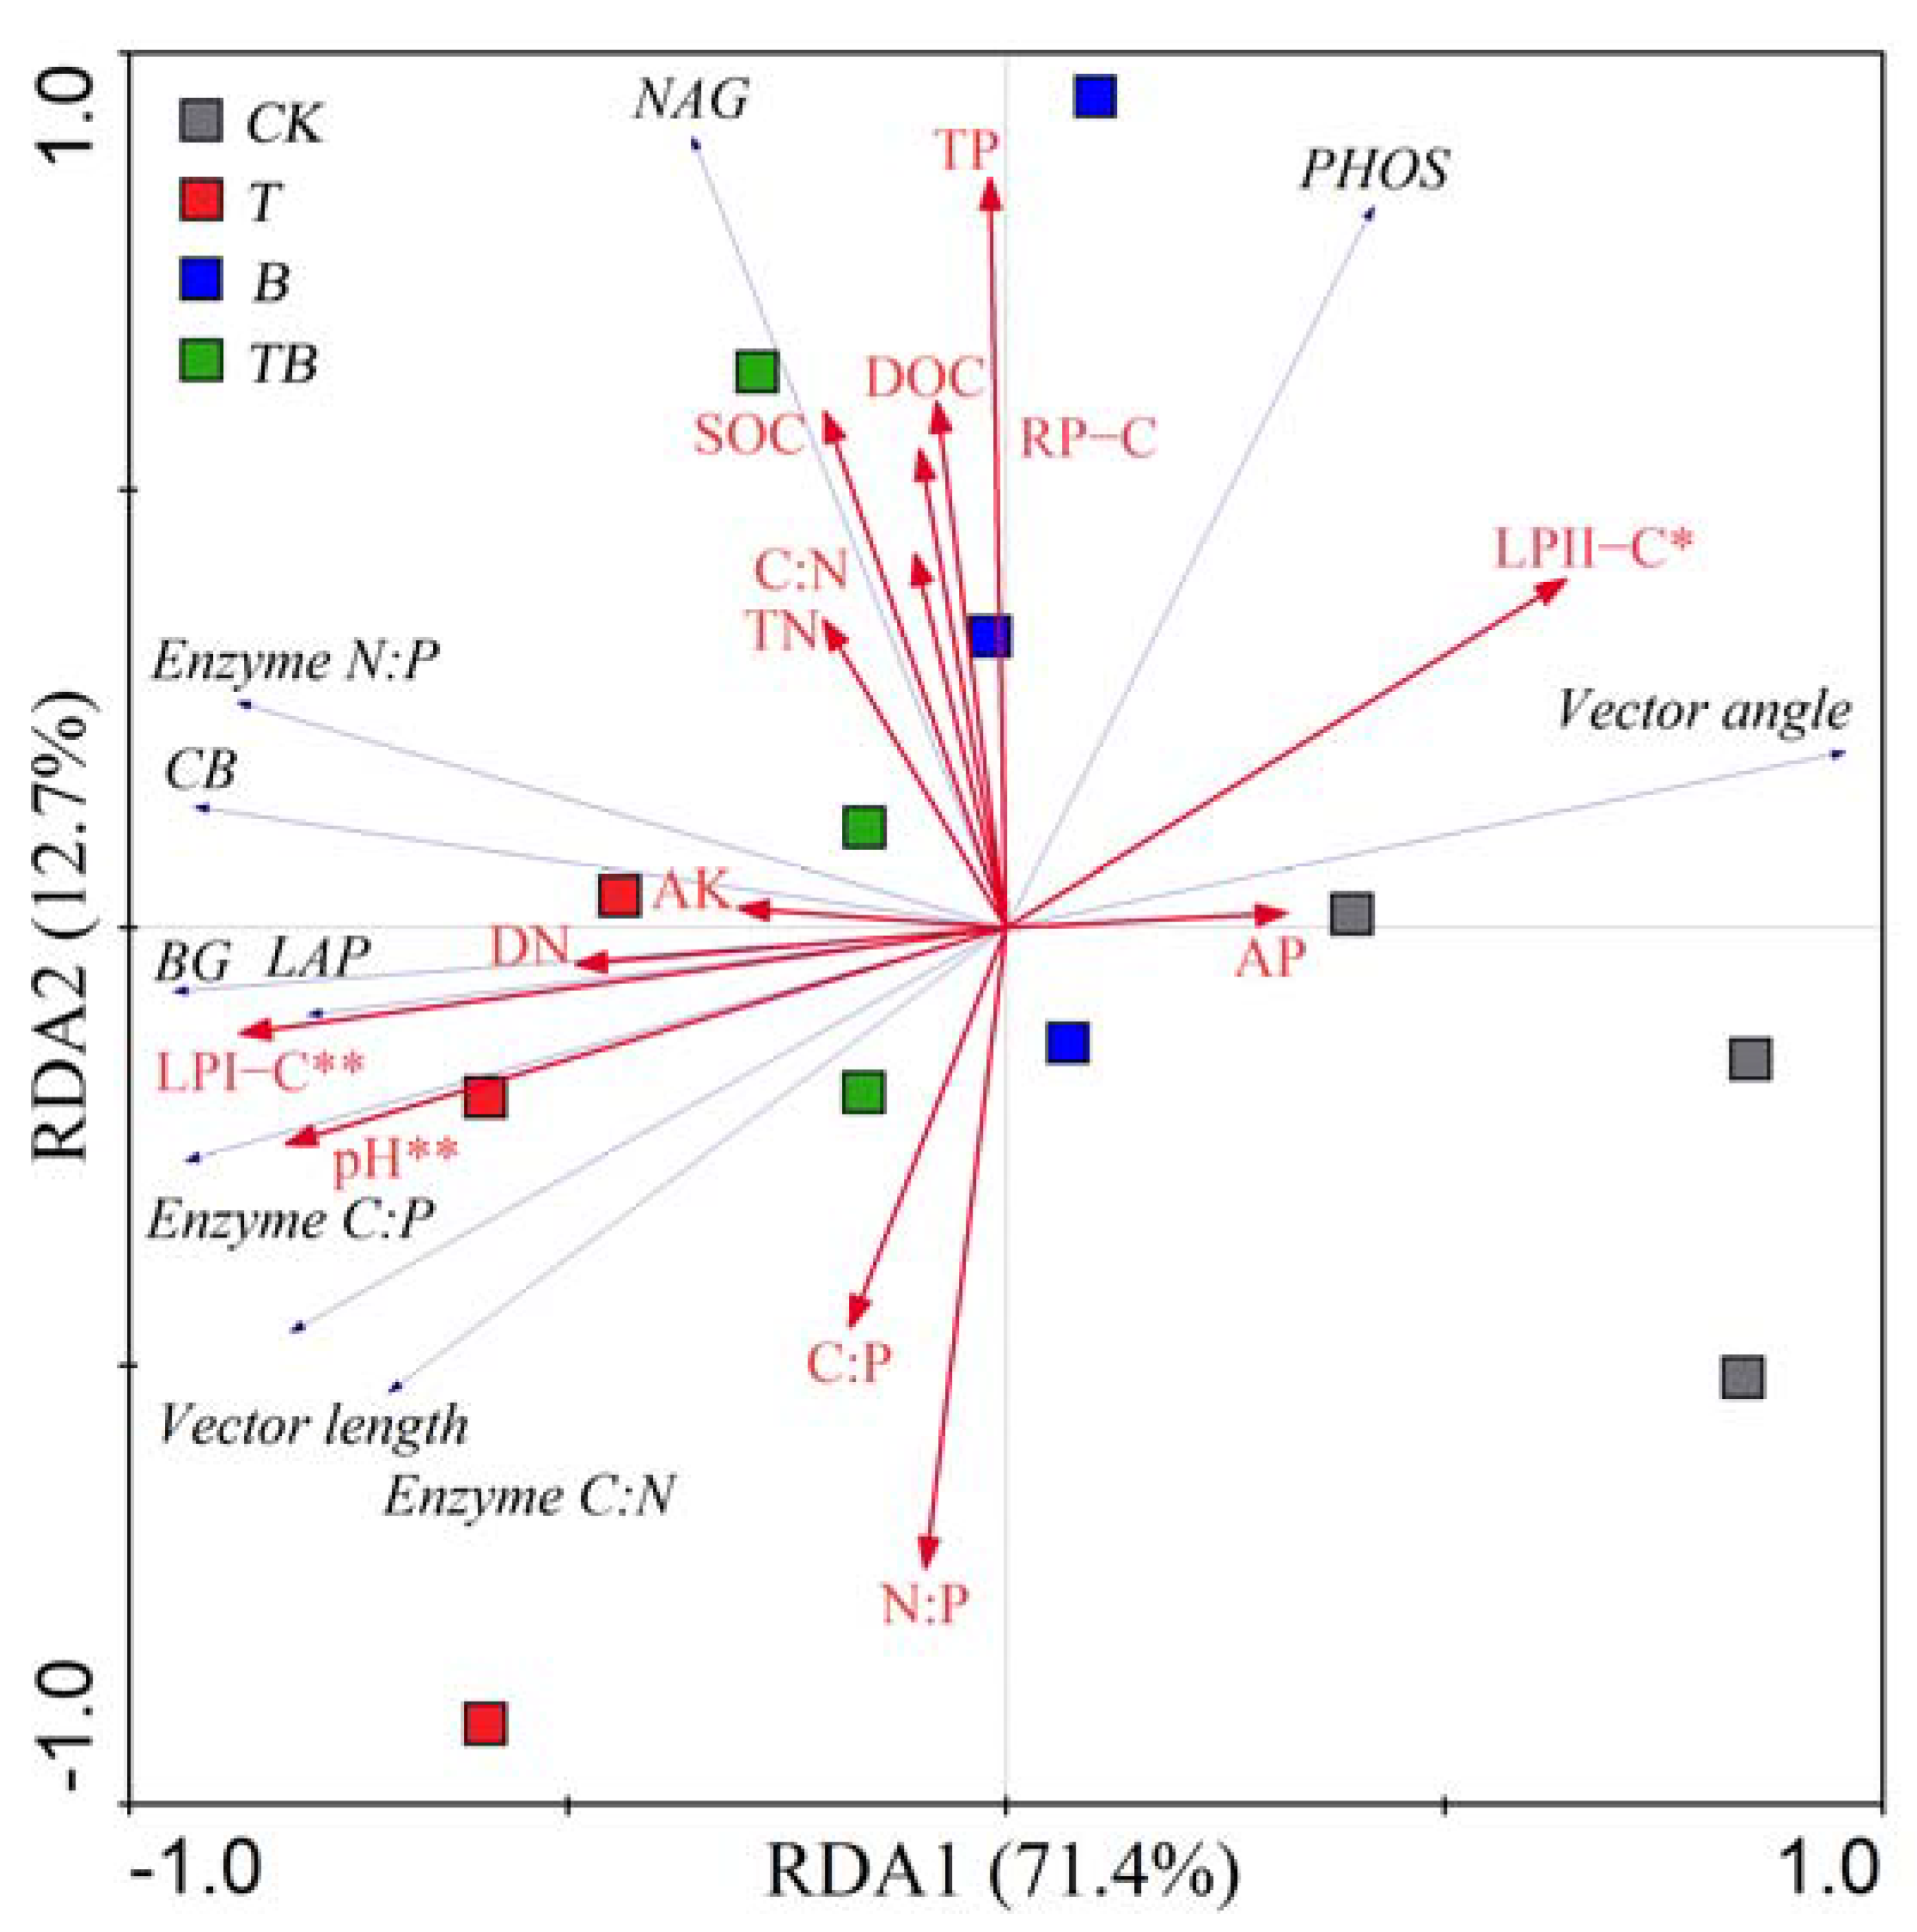
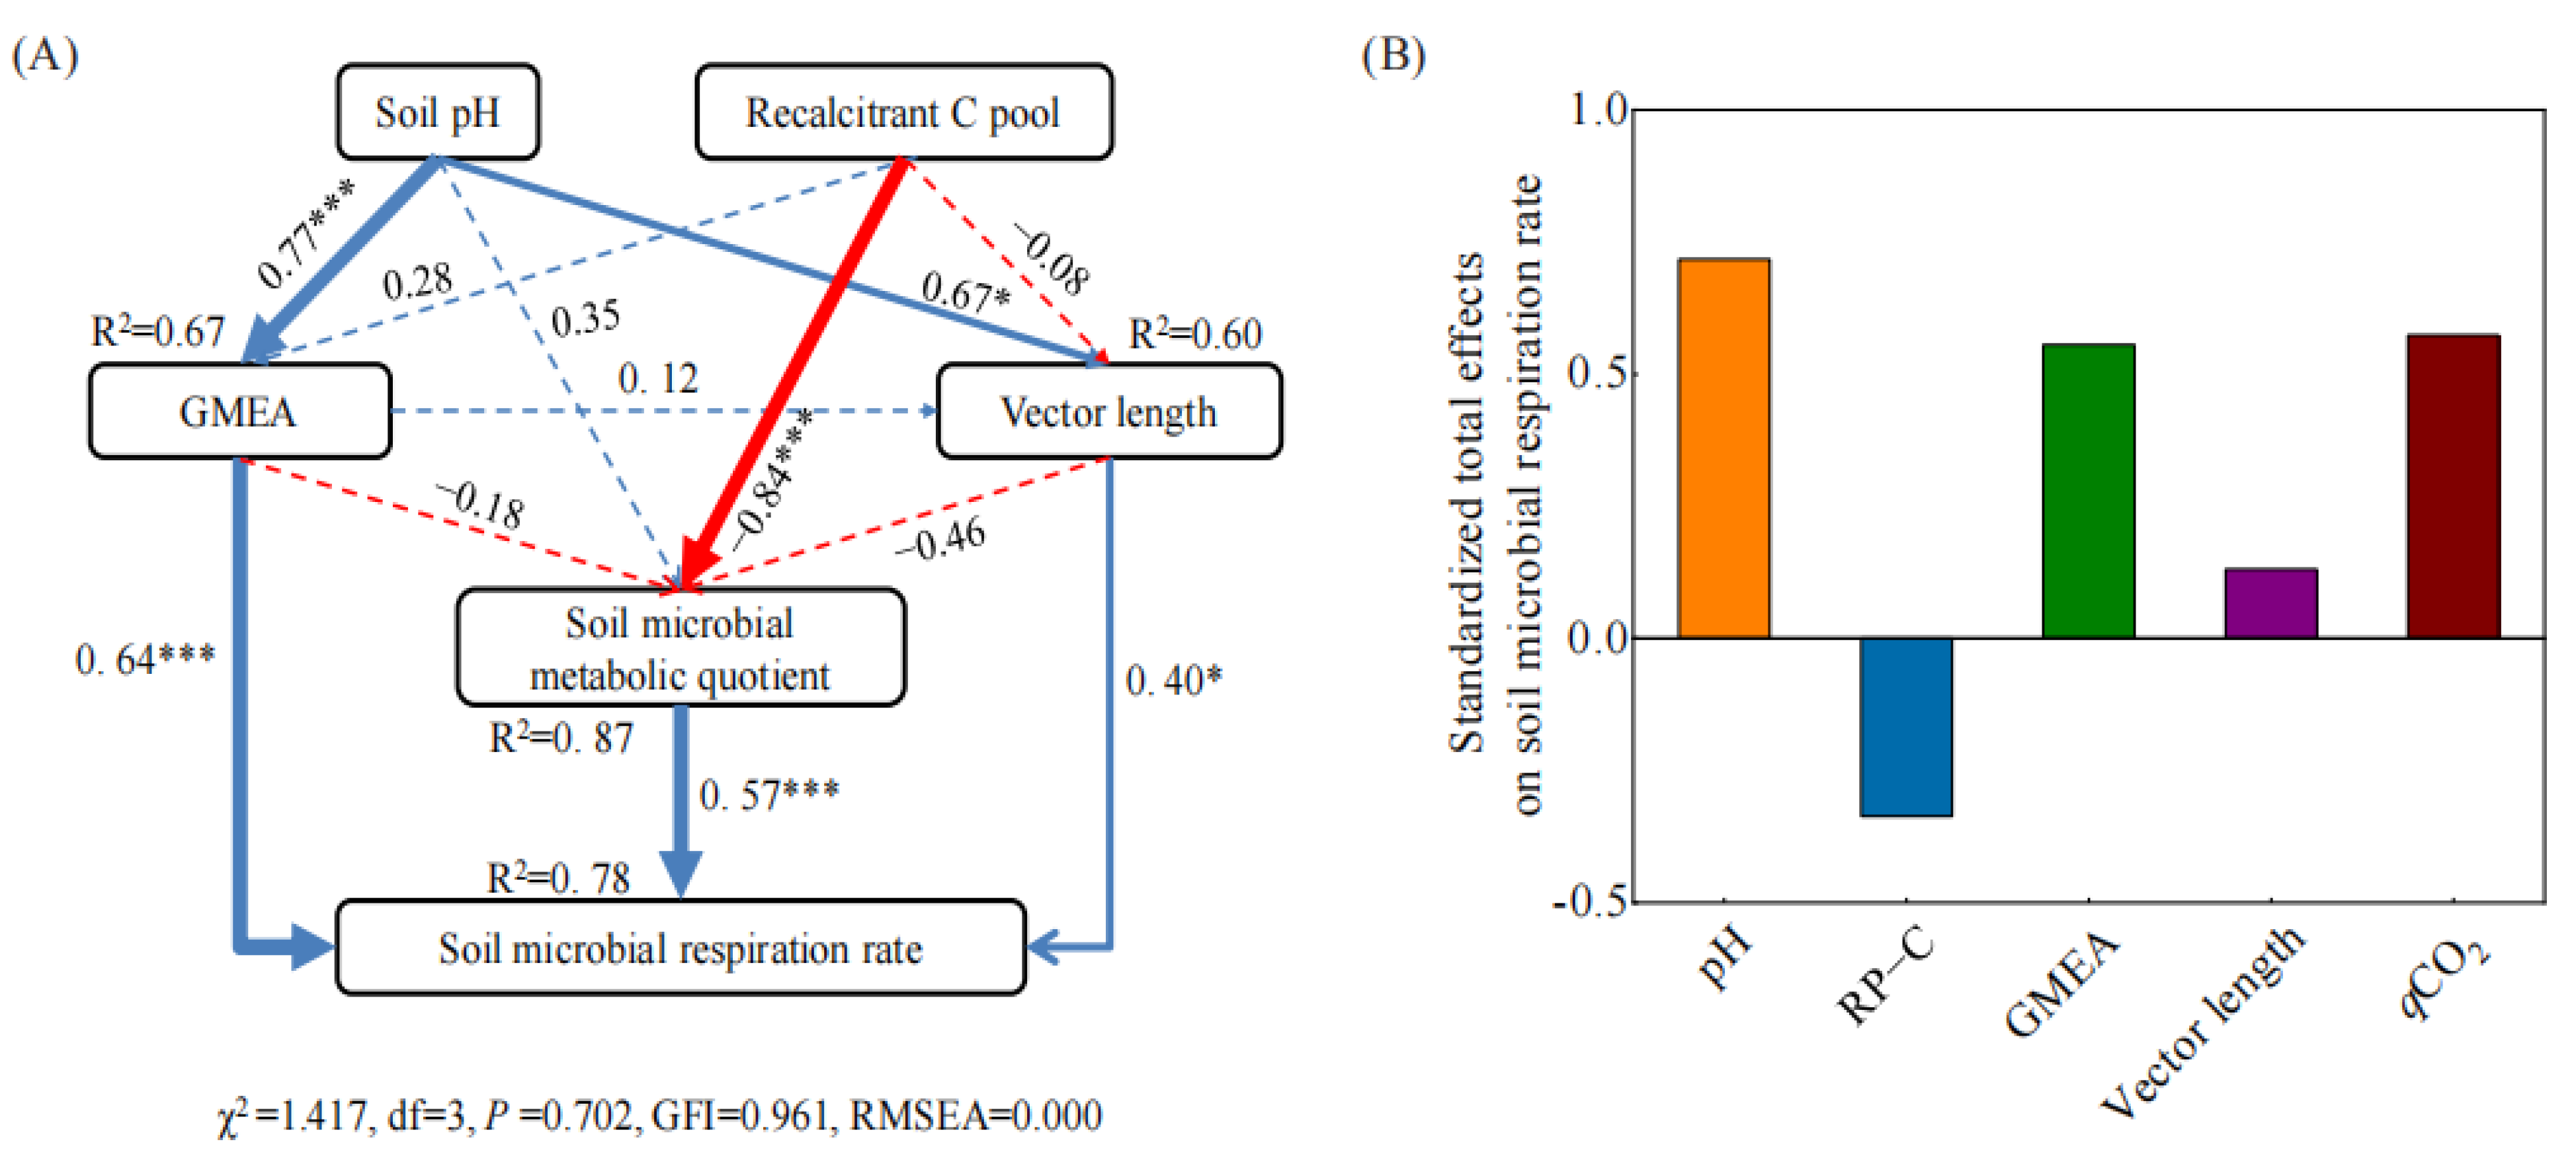
3.4. Factors Affecting Soil Enzyme Stoichiometry and Microbial Respiration Rate

Redundancy analysis (RDA) showed that soil chemical properties explained 84.1% of the total variance in soil enzyme activities, with the first axis illustrating 71.4% of the variables and the second axis illustrating 12.7% of the variables. LPI−C (F = 12.29, P = 0.002), pH (F = 9.82, P = 0.002) and LPII−C (F = 4.66, P = 0.01) were recognized as significant factors affecting soil enzyme activity, accounting for 55%, 50%, and 32% of the variance, respectively (Table 2). LPI−C and pH correlated positively with BG, CB, LAP and enzyme C:N, enzyme C:P and vector length. LPII−C correlated positively with PHOS and vector angle but correlated negatively with vector length (Figure 5).
Soil microbial respiration rate had significant and positive correlations with soil pH, LPI−C, enzyme C:P ratio and vector length (Figure 4D,E,G,I) but negative correlations with LPII−C and vector angle (Figure 4F,H). The structural equation model (SEM) illustrated 78% of the variation in soil microbial respiration rates (Figure 6A). Soil pH was the strongest predictor of soil microbial respiration rate, followed by soil microbial metabolic quotient and GMEA (Figure 6B). In addition, the size of the recalcitrant C pool was negatively correlated with the microbial metabolic quotient and could alter the soil microbial respiration rate by affecting the microbial metabolic quotient (Figure 6B).

4. Discussion

4.1. Biochar Combined with Oyster Shell Powder Attenuated the Stimulation of SOC Decomposition by Oyster Shell Powder Alone and Increased Soil C Recalcitrancy

The present study showed that the cumulative soil CO2 efflux and mean soil microbial respiration rate were significantly increased by 17.6% and 21.5% under oyster shell powder application alone than the non-amended control, suggesting that oyster shell powder promoted soil organic C mineralization in Lei bamboo plantation after a short-term (8 months) incorporation. This was due to oyster shell powder significantly increased soil pH, enzyme activity and the labile C content for soil microorganisms [9]. In contrast, bamboo biochar combined with oyster shell powder significantly decreased cumulative CO2 efflux by 10.7% compared with the T treatment, indicating that biochar co-amendment with oyster shell powder weakened the stimulation effect of oyster shell powder on soil organic C decomposition. Such contrasting effects of oyster shell powder and biochar on soil microbial respiration were associated with changes in SOC availability. We found that LPI−C significantly increased by 41.1% under oyster shell powder but remained unchanged under biochar (Figure 1), while the size of RP-C was significantly increased by 179.9% under biochar amendment, suggesting that the oyster shell powder could improve SOC availability while bamboo biochar could increase SOC recalcitrancy. Chen et al. reported that biochar amendment decreased the content of labile C and reduced the availability of SOC, thus inhibiting soil respiration [42]. The biochar used in this study had no effect on LPI−C because of the low concentration of dissolved organic C in biochar produced at high pyrolysis temperatures. Our previous study provided evidence that the dissolved organic C concentration of bamboo biochar was 22.3% lower than that of straw-derived biochar and had no effect on soil-dissolved organic C after application [17], which explained little change in SMR under biochar addition. Moreover, we found that the responses of LPI−C and LPII−C to oyster shell powder addition were different (LPI−C content increased by 41.1% and LPII−C decreased by 23.6%), which could be due to oyster shell powder promoting the transformation of LPII−C to LPI−C as a result of increased in β−glucosidase and cellobiohydrolase activities [37]. We also observed that oyster shell powder alone and combined with biochar significantly increased bacterial abundance by 92.0% and 96.1%, respectively, compared to the non-amended control, while biochar alone had no significant effect on bacterial abundance. This was similar to Johannes et al., who showed a significant increase in bacterial abundance when soil pH increased to about 7 [43].
The ratios of SMR/SOC were significantly increased under oyster shell powder but decreased under biochar application alone and in combination with oyster shell powder, indicating that biochar application may reduce the decomposability of soil organic C or have a negative effect on soil microbial activity [44]. Soil microbial metabolic quotient (qCO2), defined as the respiration rate per unit of biomass, indicates the efficiency in acquiring organic C and the intensity of C mineralization and has also been recognized as a bio-indicator of environmental stress on microorganisms [45]. In this study, biochar applied with oyster shell powder significantly reduced the qCO2 by 23.5% compared to oyster shell powder alone, suggesting that biochar amendment promoted microorganisms to use more C sources for their own cell construction rather than respiration [46]. It has also been demonstrated that the pore structure of biochar can provide a good habitat for microorganisms, which also improves soil porosity and aeration, thus reducing environmental stress for microorganisms [6]. Therefore, these findings together suggested that biochar combined with oyster shell powder can mitigate the stimulation effect of oyster shell powder alone on soil microbial respiration and increased soil C recalcitrancy.

4.2. Biochar Combined with Oyster Shell Powder Decreased the C-Degrading Enzyme Activity Relative to Oyster Shell Powder Alone

While oyster shell powder alone significantly increased the β−glucosidase activity (BG) by 106.1% and cellobiohydrolase activity (CB) by 98.0% compared with the control, biochar combined with oyster shell powder reduced BG and CB activities by 15.0% and 21.1%, respectively, compared to the oyster shell powder alone (Figure 3). These results suggest that biochar combined with oyster shell powder could decrease the stimulation of oyster shell powder on soil C-degrading enzyme activities, which is partly in line with our hypothesis. Increases in soil C-degrading enzyme activities could be related to an increase in soil pH. For example, Zhang et al. found that soil pH had a direct biochemical effect on extracellular enzyme activities, and BG and NAG activities increased with increasing pH [47]. The lower C-degrading enzyme activity under the co-application of biochar and oyster shell powder relative to oyster shell powder alone could be ascribed to the fact that biochar induced a negative effect on soil C-degrading enzyme activities as a consequence of their strong adsorption capacity of pore structure [48]. The bamboo biochar used in this study had a large surface area (0.89 m2 g−1) [17], which may decrease the availability of soil organic C and disturb the reactions between enzymes and soil substrates. Foster et al. suggested that biochar can decrease enzyme activity, as the abundant porous structure and large surface area of biochar can reduce C availability and inhibit soil enzyme reaction [48]. In support, Demisie et al. found that the application of biochars derived from oak and bamboo decreased β−glucosidase activity in degraded red soil [49], though other studies indicated that biochar prepared from wood chips had no effect on BG and CB activities after one year of addition to the soil [50].
Oyster shell powder alone significantly increased microbial C limitation (as shown by the increased vector length of 28.6% compared to CK), while biochar co-amendment mitigated microbial C limitation by oyster shell powder (as shown by the decreased vector length by 11.1% compared to T treatment). The exacerbated microbial C limitation under the application of oyster shell powder due to the increased bacterial abundance that enhanced C consumption. Similarly, Yang et al. showed that the enrichment of copiotrophic bacteria promoted C emission [51]. Conversely, biochar co-amendment mitigated microbial C limitation by oyster shell powder since biochar had no effect on bacterial abundance and decreased the stimulation of oyster shell powder on soil C-degrading enzyme activities. Vector angles of all treatments were >45°, suggesting that soil microbial communities in the subtropical bamboo plantations were limited by P. These findings support the suggestion that soil P is not only the key element in limiting vegetation growth but also for soil microbial communities in subtropical forests [52]. A recent study demonstrated that increasing P availability decreased phosphatase activity and microbial P limitation [26]. RDA showed that the vector angle had a significant negative correlation with soil pH, indicating that an increase in soil pH under oyster shell powder application could promote soil P availability, thereby reducing microbial P limitation. It is likely that reduced P limitation may cause microbial communities to consume less energy (Decomposition of SOC) to synthesize enzymes associated with cycling.

4.3. The Role of Soil pH and C Availability on Soil Enzyme Activity and Microbial CUE under Biochar and Oyster Shell Powder Addition

The SEM results showed that changes in soil pH and soil enzyme activities under oyster shell powder and biochar application had significant positive effects on the soil microbial respiration rate. In particular, oyster shell powder could promote the enhancement of microbial respiration rate by increasing soil pH and enzyme activity (Figure 6). The role of soil pH in increasing enzyme activity and soil organic C decomposition was supported by previous studies that BG, CB, and NAG activities can be increased by increasing pH [20,42]. Moreover, we found that soil pH also had a positive effect on the vector length, which indicated that oyster shell powder application enhanced microbial C limitation by increasing soil pH. It is likely that an increase in soil pH favored soil N and P availability, which may lead to an increased demand for C substrates relative to N and P nutrients by microorganisms. In addition, soil recalcitrant C content had a significant negative effect on microbial metabolic quotient (qCO2). Biochar combined with oyster shell powder increased soil recalcitrant C content and decreased soil organic carbon availability compared to oyster shell powder alone, which may increase microbial carbon use efficiency [53,54]. We found that microbial CUE was enhanced under the combined application of biochar and oyster shell powder. Jones et al. showed that neutral soil pH favored microbial CUE since a low pH environment encourages microorganisms to consume more energy to reduce aluminum stress, thereby reducing CUE [55]. On the other hand, changes in the soil microbial CUE could be ascribed to microbial C limitation. Moreover, correlation analysis further showed that soil microbial respiration rate was negatively correlated with the vector angle, indicating that increased soil microbial P limitation may reduce the decomposition of soil organic C. Similarly, Cui et al. found that the decrease of microbial P limitation increased soil CO2 release in a short-term incubation, suggesting that changes in microbial P limitation may also regulate soil C decomposition in soils with low P availability [26]. The increased microbial CUE under oyster shell powder with biochar could also be ascribed to the fact that biochar amendment may have shifted the microbial communities from R-strategy (with higher microbial respiration and BG activity) to K-strategy (with lower microbial respiration and higher MBC and CUE) with the addition of biochar [23].

5. Conclusions

This study showed that the addition of oyster shell powder alone increased soil pH, labile C pool size and the activities of C-degrading enzyme activities, whereas adding biochar and oyster shell powder together not only increased soil pH but also increased the recalcitrant C content and reduced C-degrading enzyme activities. Compared with the addition of oyster shell powder, biochar co-amendment weakened the stimulation effect of oyster shell powder on soil microbial respiration by increasing soil organic C recalcitrancy and microbial C use efficiency. In summary, our results suggest that biochar combined with oyster shell powder could decrease soil C loss and ameliorate soil acidity in bamboo plantations compared with the application of oyster shell powder alone.

Supplementary Materials

The following supporting information can be downloaded at: https://www.mdpi.com/article/10.3390/f14040853/s1, Table S1: The interactive effects of oyster shell powder and biochar on soil chemical and biological properties.

Author Contributions

Conceptualization, J.C., H.J. and G.Y.; methodology, H.J., G.Y, Y.L, J.Y., S.L. and Q.W.; software, Y.L.; validation, J.C., H.J. and G.Y.; formal analysis, H.J., G.Y. and S.L.; investigation, H.J., G.Y. and J.Y.; resources, H.Q., J.C., S.L. and Q.W.; data curation, H.J., G.Y., Y.L. and J.Y.; writing—original draft preparation, H.J. and G.Y.; writing—review and editing, J.C. and H.Q.; visualization, H.J.; supervision, J.C.; project administration, J.C.; funding acquisition, J.C. All authors have read and agreed to the published version of the manuscript.

Funding

This work was funded by the National Natural Science Foundation of China under grant numbers 41977083 and 31971631 and the Natural Science Foundation of Zhejiang Province under grant number LZ22C160001.

Data Availability Statement

The data included in this study are available upon request from the corresponding author.

Conflicts of Interest

The authors declare no conflict of interest.

References

  1. Bonan, G.B. Forests and Climate Change: Forcings, Feedbacks, and the Climate Benefits of Forests. Science 2008, 320, 1444–1449. [Google Scholar] [CrossRef] [PubMed]
  2. Luo, Z.; Wang, G.; Wang, E. Global subsoil organic carbon turnover times dominantly controlled by soil properties rather than climate. Nat. Commun. 2019, 10, 3688. [Google Scholar] [CrossRef] [PubMed]
  3. Xu, Q.; Liang, C.; Chen, J.; Li, Y.; Qin, H.; Fuhrmann, J.J. Rapid bamboo invasion (expansion) and its effects on biodiversity and soil processes. Glob. Ecol. Conserv. 2020, 21, e00787. [Google Scholar] [CrossRef]
  4. Qin, H.; Wang, H.; Strong, S.P.; Li, Y.; Xu, Q.; Wu, Q. Rapid soil fungal community response to intensive management in a bamboo forest developed from rice paddies. Soil Biol. Biochem. 2014, 68, 177–184. [Google Scholar] [CrossRef]
  5. Guo, K.; Zhao, Y.; Liu, Y.; Chen, J.; Wu, Q.; Ruan, Y.; Li, S.; Shi, J.; Zhao, L.; Sun, X.; et al. Pyrolysis temperature of biochar affects ecoenzymatic stoichiometry and microbial nutrient-use efficiency in a bamboo forest soil. Geoderma 2020, 363, 114162. [Google Scholar] [CrossRef]
  6. Dai, Z.; Zhang, X.; Tang, C.; Muhammad, N.; Wu, J.; Brookes, P.C.; Xu, J. Potential role of biochars in decreasing soil acidification-a critical review. Sci. Total Environ. 2016, 581–582, 601–611. [Google Scholar] [CrossRef]
  7. Li, G.; Kim, S.; Han, S.; Chang, H.; Du, D.; Son, Y. Precipitation affects soil microbial and extracellular enzymatic responses to warming. Soil Biol. Biochem. 2018, 120, 212–221. [Google Scholar] [CrossRef]
  8. Lu, M.; Shi, X.; Feng, Q.; Zhang, M.; Guo, Y.; Dong, X.; Guo, R. Modification of oyster shell powder by humic acid for ammonium removal from aqueous solutions and nutrient retention in soil. J. Environ. Chem. Eng. 2021, 9, 106708. [Google Scholar] [CrossRef]
  9. Yang, X.; Huang, Y.; Liu, K.; Zheng, C. Effects of oyster shell powder on leaching characteristics of nutrients in low-fertility latosol in South China. Environ. Sci. Pollut. R 2022, 29, 56200–56214. [Google Scholar] [CrossRef]
  10. Lee, C.H.; Lee, D.K.; Ali, M.A.; Kim, P.J. Effects of oyster shell on soil chemical and biological properties and cabbage productivity as a liming materials. Waste Manag. 2008, 28, 2702–2708. [Google Scholar] [CrossRef]
  11. Zhao, L.; Huang, P.; Yang, C.; Lu, S. Effects of oyster shell powder and lime on availability and forms of phosphorus, and enzyme activity in acidic paddy soil. Environ. Sci. 2022, 1–13, 5224–5233. (In Chinese) [Google Scholar]
  12. Coonan, E.C.; Kirkby, C.A.; Kirkegaard, J.A.; Amidy, M.R.; Strong, C.L.; Richardson, A.E. Lime and nutrient addition affects the dynamics and fractions of soil carbon in a short-term incubation study with 13C-labeled wheat straw. Soil Sci. 2019, 184, 43–51. [Google Scholar] [CrossRef]
  13. Grover, S.P.; Butterly, C.R.; Wang, X.; Tang, C. The short-term effects of liming on organic carbon mineralisation in two acidic soils as affected by different rates and application depths of lime. Biol. Fertil. Soils 2017, 53, 431–443. [Google Scholar] [CrossRef]
  14. Lehmann, J.; Joseph, S. Biochar for Environmental Management: Science, Technology and Implementation; Taylor and Francis: Abingdon, UK, 2015; pp. 2–20. [Google Scholar]
  15. Chen, J.; Li, S.; Liang, C.; Xu, Q.; Li, Y.; Qin, H.; Fuhrmann, J.J. Response of microbial community structure and function to short-term biochar amendment in an intensively managed bamboo (Phyllostachys praecox) plantation soil: Effect of particle size and addition rate. Sci. Total Environ. 2017, 574, 24–33. [Google Scholar] [CrossRef] [PubMed]
  16. Chen, J.; Sun, X.; Zheng, J.; Zhang, X.; Liu, X.; Bian, R.; Li, L.; Cheng, K.; Zheng, J.; Pan, G. Biochar amendment changes temperature sensitivity of soil respiration and composition of microbial communities 3 years after incorporation in an organic carbon-poor dry cropland soil. Biol. Fertil. Soils 2018, 54, 175–188. [Google Scholar] [CrossRef]
  17. Liu, Y.; Guo, K.; Zhao, Y.; Li, S.; Wu, Q.; Liang, C.; Sun, X.; Xu, Q.; Chen, J.; Qin, H. Change in composition and function of microbial communities in an acid bamboo (Phyllostachys praecox) plantation soil with the addition of three different biochars. For. Ecol. Manag. 2020, 473, 118336. [Google Scholar] [CrossRef]
  18. Singh, R.; Singh, P.; Singh, H.; Raghubanshi, A.S. Impact of sole and combined application of biochar, organic and chemical fertilizers on wheat crop yield and water productivity in a dry tropical agro-ecosystem. Biochar 2019, 1, 229–235. [Google Scholar] [CrossRef]
  19. Agegnehu, G.; Srivastava, A.K.; Bird, M.I. The role of biochar and biochar-compost in improving soil quality and crop performance: A review. Appl. Soil Ecol. 2017, 119, 156–170. [Google Scholar] [CrossRef]
  20. Wu, Q.; Lian, R.; Bai, M.; Bao, J.; Liu, Y.; Li, S.; Liang, C.; Qin, H.; Chen, J.; Xu, Q. Biochar co-application mitigated the stimulation of organic amendments on soil respiration by decreasing microbial activities in an infertile soil. Biol. Fertil. Soils 2021, 57, 793–807. [Google Scholar] [CrossRef]
  21. Luo, Y.; Wan, S.; Hui, D.; Wallace, L.L. Acclimatization of soil respiration to warming in a tall grass prairie. Nature 2001, 413, 622–625. [Google Scholar] [CrossRef]
  22. Chen, J.; Elsgaard, L.; van Groenigen, K.J.; Olesen, J.E.; Liang, Z.; Jiang, Y.; Laerke, P.E.; Zhang, Y.; Luo, Y.; Huanggate, B.A.; et al. Soil carbon loss with warming: New evidence from carbon-degrading enzymes. Glob. Change Biol. 2020, 26, 1944–1952. [Google Scholar] [CrossRef] [PubMed]
  23. Yang, Y.; Dou, Y.; Wang, B.; Xue, Z.; Wang, Y.; An, S.; Chang, S. Deciphering factors driving soil microbial life-history strategies in restored grasslands. iMeta 2022, 2, e66. [Google Scholar] [CrossRef]
  24. Sinsabaugh, R.L. Phenol oxidase, peroxidase and organic matter dynamics of soil. Soil Biol. Biochem. 2010, 42, 391–404. [Google Scholar] [CrossRef]
  25. Nannipieri, P.; Trasar, C.C.; Dick, R.P. Soil enzyme activity: A brief history and biochemistry as a basis for appropriate interpretations and meta-analysis. Biol. Fertil. Soils 2018, 54, 11–19. [Google Scholar] [CrossRef]
  26. Cui, Y.; Moorhead, D.L.; Wang, X.; Xu, M.; Wang, X.; Wei, X.; Zhu, Z.; Ge, T.; Peng, S.; Zhu, B.; et al. Decreasing microbial phosphorus limitation increases soil carbon release. Geoderma 2022, 419, 115868. [Google Scholar] [CrossRef]
  27. Sinsabaugh, R.L.; Hill, B.H.; Follstad, S.J.J. Ecoenzymatic stoichiometry of microbial organic nutrient acquisition in soil and sediment. Nature 2009, 462, 795–798. [Google Scholar] [CrossRef]
  28. Sinsabaugh, R.L.; Lauber, C.L.; Weintraub, M.N.; Ahmed, B.; Allison, S.D.; Crenshaw, C.; Contosta, A.R.; Cusack, D.; Frey, S.; Gallo, M.E.; et al. Stoichiometry of soil enzyme activity at global scale. Ecol. Lett. 2008, 11, 1252–1264. [Google Scholar] [CrossRef]
  29. Moorhead, D.L.; Rinkes, Z.L.; Sinsabaugh, R.L.; Weintraub, M.N. Dynamic relationships between microbial biomass, respiration, inorganic nutrients and enzyme activities: Informing enzyme based decomposition models. Front. Microbiol. 2013, 4, 223. [Google Scholar] [CrossRef]
  30. Moorhead, D.L.; Sinsabaugh, R.T.; Hill, B.H.; Weintraub, M.N. Vector analysis of ecoenzyme activities reveal constraints on coupled C, N and P dynamics. Soil Biol. Biochem. 2016, 93, 1–7. [Google Scholar] [CrossRef]
  31. Cui, Y.; Bing, H.; Fang, L.; Jiang, M.; Shen, G.; Yu, J.; Wang, X.; Zhu, H.; Wu, Y.; Zhang, X. Extracellular enzyme stoichiometry reveals the carbon and phosphorus limitations of microbial metabolisms in the rhizosphere and bulk soils in alpine ecosystems. Plant Soil 2019, 458, 1–14. [Google Scholar] [CrossRef]
  32. Zhao, Y.; Liang, C.; Shao, S.; Chen, J.; Qin, H.; Xu, Q. Linkages of litter and soil C:N:P stoichiometry with soil microbial resource limitation and community structure in a subtropical broadleaf forest invaded by Moso bamboo. Plant Soil 2021, 465, 473–490. [Google Scholar] [CrossRef]
  33. Yuan, Y.; Li, Y.; Mou, Z.; Kuang, L.; Wu, W.; Zhang, J.; Wang, F.; Hui, D.; Peñuelas, J.; Sardans, J.; et al. Phosphorus addition decreases microbial residual contribution to soil organic carbon pool in a tropical coastal forest. Glob. Change Biol. 2020, 27, 454–466. [Google Scholar] [CrossRef] [PubMed]
  34. Cui, J.; Zhang, S.; Wang, X.; Xu, X.; Ai, C.; Liang, G.; Zhu, P.; Zhou, W. Enzymatic stoichiometry reveals phosphorus limitation-induced changes in the soil bacterial communities and element cycling: Evidence from a long-term field experiment. Geoderma 2022, 426, 116124. [Google Scholar] [CrossRef]
  35. Lu, R.K. Analytical Methods for Soil and Agro-Chemistry; China Agricultural Science and Technology Press: Beijing, China, 2020. [Google Scholar]
  36. Wu, J.; Joergensen, R.G.; Pommerening, B.; Chaussod, R.; Brookes, P.C. Measurement of soil microbial biomass C by fumigation-extraction-an automated procedure. Soil Biol. Biochem. 1990, 22, 1167–1169. [Google Scholar] [CrossRef]
  37. Rovira, P.; Vallejo, V.R. Labile and recalcitrant pools of carbon and nitrogen in organic matter decomposing at different depths in soil: An acid hydrolysis approach. Geoderma 2002, 107, 109–141. [Google Scholar] [CrossRef]
  38. Liu, W.; Xu, W.; Hong, J.; Wan, S. Interannual variability of soil microbial biomass and respiration in responses to topography, annual burning and N addition in a semiarid temperate steppe. Geoderma 2010, 158, 259–267. [Google Scholar] [CrossRef]
  39. Campbell, C.D.; Chapman, S.J.; Cameron, C.M.; Davidson, M.S.; Potts, J.M. A rapid microtiter plate method to measure carbon dioxide evolved from carbon substrate amendments so as to determine the physiological profiles of soil microbial communities by using whole soil. Appl. Environ. Microb. 2003, 69, 3593–3599. [Google Scholar] [CrossRef]
  40. Situ, G.; Zhao, Y.; Zhang, L.; Yang, X.; Chen, D.; Li, S.; Wu, Q.; Xu, Q.; Chen, J.; Qin, H. Linking the chemical nature of soil organic carbon and biological binding agent in aggregates to soil aggregate stability following biochar amendment in a rice paddy. Sci. Total Environ. 2022, 847, 157460. [Google Scholar] [CrossRef]
  41. Saiya-Cork, K.R.; Sinsabaugh, R.L.; Zak, D.R. The effects of long-term nitrogen deposition on extracellular enzyme activity in an Acer saccharum forest soil. Soil Biol. Biochem. 2002, 34, 1309–1315. [Google Scholar] [CrossRef]
  42. Chen, J.; Chen, D.; Xu, Q.; Fuhrmann, J.; Li, L.; Pan, G.; Li, Y.; Qin, H.; Liang, C.; Sun, X. Organic carbon quality, composition of main microbial groups, enzyme activities, and temperature sensitivity of soil respiration of an acid paddy soil treated with biochar. Biol. Fertil. Soils 2019, 55, 185–197. [Google Scholar] [CrossRef]
  43. Rousk, J.; Baathe, E.; Brookes, P.C.; Lauber, C.L.; Lozupone, C.; Caporaso, J.G.; Knight, R.; Fierer, N. Soil bacterial and fungal communities across a pH gradient in an arable soil. ISME J. 2010, 4, 1340–1351. [Google Scholar]
  44. Noah, F.; Benjamin, P.; Joshua, P.; Robert, B. Predicting the temperature dependence of microbial respiration in soil: A continental-scale analysis. Glob. Biogeochem. Cycles 2006, 20, B3026. [Google Scholar]
  45. Lu, W.; Ding, W.; Zhang, J.; Li, Y.; Luo, J.; Bolan, N.; Xie, Z. Biochar suppressed the decomposition of organic carbon in a cultivated sandy loam soil: A negative priming effect. Soil Biol. Biochem. 2014, 76, 12–21. [Google Scholar] [CrossRef]
  46. Babujia, L.C.; Hungria, M.; Franchini, J.C.; Brookes, P.C. Microbial biomass and activity at various soil depths in a Brazilian oxisol after two decades of no-tillage and conventional tillage. Soil Biol. Biochem. 2010, 42, 2174–2181. [Google Scholar] [CrossRef]
  47. Zhang, Y.; Chen, L.; Chen, X.; Tan, M.; Duan, Z.; Wu, Z.; Li, X.; Fan, X. Response of soil enzyme activity to long-term restoration of desertified land. CATENA 2015, 133, 64–70. [Google Scholar]
  48. Foster, E.J.; Hansen, N.; Wallenstein, M.; Cotrufo, F. Biochar and manure amendments impact soil nutrients and microbial enzymatic activities in a semi-arid irrigated maize cropping system. Agric. Ecosyst. Environ. 2016, 233, 404–414. [Google Scholar] [CrossRef]
  49. Demisie, W.; Liu, Z.; Zhang, M. Effect of biochar on carbon fractions and enzyme activity of red soil. CATENA 2014, 121, 214–221. [Google Scholar]
  50. Elzobair, K.A.; Stromberger, M.E.; Ippolito, J.A.; Lentz, R.D. Contrasting effects of biochar versus manure on soil microbial communities and enzyme activities in an Aridisol. Chemosphere 2016, 142, 145–152. [Google Scholar] [CrossRef]
  51. Yang, Y.; Sun, K.; Liu, J.; Chen, Y.; Han, L. Changes in soil properties and CO2 emissions after biochar addition: Role of pyrolysis temperature and aging. Sci. Total Environ. 2022, 839, 156333. [Google Scholar] [CrossRef]
  52. Niu, Y.; Chai, R.; Jin, G.; Wang, H.; Tang, C.; Zhang, Y. Responses of root architecture development to low phosphorus availability: A review. Ann. Bot. 2013, 112, 391–408. [Google Scholar] [CrossRef]
  53. Zheng, J.; Chen, J.; Pan, G.; Liu, X.; Zhang, X.; Li, L.; Bian, R.; Cheng, K.; Zheng, J. Biochar decreased microbial metabolic quotient and shifted community composition four years after a single incorporation in a slightly acid rice paddy from Southwest China. Sci. Total Environ. 2016, 571, 206–217. [Google Scholar] [CrossRef] [PubMed]
  54. Zhu, Z.; Ge, T.; Luo, Y.; Liu, S.; Xu, X.; Tong, C.; Shibistova, O.; Guggenberger, G.; Wu, J. Microbial stoichiometric flexibility regulates rice straw mineralization and its priming effect in paddy soil. Soil Biol. Biochem. 2018, 121, 67–76. [Google Scholar] [CrossRef]
  55. Jones, D.L.; Cooledge, E.C.; Hoyle, F.C.; Griffiths, R.I.; Murphy, D.V. pH and exchangeable aluminum are major regulators of microbial energy flow and carbon use efficiency in soil microbial communities. Soil Biol. Biochem. 2019, 138, 107584. [Google Scholar] [CrossRef]
Figure 1. A comparison of labile C pool I (LPI−C) (A), labile C pool II (LPII−C) (B) and recalcitrant C pool (RP−C) (C), soil microbial biomass C (MBC) and N (MBN) and MBC/MBN (DF) (mean ± SE) among the different treatments including the control (CK), oyster shell powder (T), biochar (B) and a combined amendment (TB). Bars with different letters indicate significant differences (p < 0.05).
Forests 14 00853 g001
Figure 2. A comparison of cumulative CO2 efflux (A), soil microbial respiration rate (SMR) (B), the ratio of SMR/SOC (C), soil microbial quotient (qMB) (D), soil microbial metabolic quotient (qCO2) (E), and the gene abundances of bacteria, fungi and archaea (FH) (mean ± SE) among the different treatments including the control (CK), oyster shell powder (T), biochar (B) and a combined amendment (TB). Bars with different letters indicate significant differences (p < 0.05).
Forests 14 00853 g002
Figure 3. A comparison of soil enzyme activities (AE) and their C:N:P ratios (FH) and the geometric mean of the assayed enzyme activities (GMEA) (I) (mean ± SE) among the different treatments, including the control (CK), oyster shell powder (T), biochar (B) and a combined amendment (TB). BG, β−glucosidase; CB, cellobiohydrolase; NAG, N−acetylglucosaminidase; LAP, leucine aminopeptidase; PHOS, acid phosphatase; Enzyme C:N means ln (BG + CB): ln (NAG + LAP); Enzyme C:P means ln (BG + CB): ln PHOS; Enzyme N:P means ln (NAG + LAP): ln PHOS. Bars with different letters indicate significant differences (p < 0.05).
Forests 14 00853 g003
Figure 4. A comparison of vector angle (A), vector length (B) and microbial carbon use efficiency (CUE) (C) (mean ± SE) among the different treatments, including the control (CK), oyster shell powder (T), biochar (B) and a combined amendment (TB), and correlation analysis of soil microbial respiration rate (SMR) with pH, LPI−C, LPII−C, enzyme C:P ratio, vector angle and vector length (DI). Bars with different letters indicate significant differences (p < 0.05).
Forests 14 00853 g004
Figure 5. Redundancy analysis (RDA) of soil chemical properties with enzyme activities and their stoichiometry. The red arrows with asterisks indicate significant (*, p < 0.05; **, p < 0.01) factors affecting the enzyme activities and their stoichiometry.
Forests 14 00853 g005
Figure 6. Structural equation model (SEM) showing the direct and indirect effects of soil pH, recalcitrant C pool, GMEA, vector length, and soil microbial metabolic quotient (qCO2) on soil microbial respiration rate (A). The standardized total effects (direct plus indirect effects) calculated by the structural equation model (B). Continuous and dashed arrows indicate significant and insignificant relationships, respectively. The width of the arrows is proportional to the strength of path coefficients. Blue and red arrows indicate positive and negative correlations, respectively. Significant level: *, p < 0.05; ***, p < 0.001.
Forests 14 00853 g006
Table 1. A comparison of the various soil chemical properties (mean ± SE) among the different treatments, including the control (CK), oyster shell powder (T), biochar (B), and a combined amendment (TB).
Soil Chemical PropertyTreatment
CKTBTB
pH4.21 ± 0.07 c7.08 ± 0.17 a4.31 ± 0.09 c6.74 ± 0.29 b
SOC (g kg−1)29.42 ± 1.90 b29.87 ± 2.09 b35.56 ± 1.47 a35.20 ± 2.04 a
DOC (mg kg−1)946.38 ± 27.78 b941.84 ± 34.13 b1035.37 ± 28.39 a1049.43 ± 29.57 a
TN (g kg−1)3.04 ± 0.17 a3.11 ± 0.30 a3.10 ± 0.20 a3.30 ± 0.12 a
DN (mg kg−1)80.67 ± 5.91c104.61 ± 8.68 b73.20 ± 8.90 c130.40 ± 12.17 a
TP (g kg−1)1.09 ± 0.11 a1.05 ± 0.19 a1.20 ± 0.20 a1.24 ± 0.03 a
AP (mg kg−1)204.57 ± 14.35 a184.95 ± 15.24 a204.62 ± 22.18 a208.26 ± 15.30 a
AK (mg kg−1)592.55 ± 26.02 a611.16 ± 46.43 a593.49 ± 16.55 a596.26 ± 60.45 a
C:N9.67 ± 0.44 b9.64 ± 1.01 b11.50 ± 0.25 a10.68 ± 0.66 ab
C:P27.20 ± 4.05 a28.82 ± 4.20 a30.22 ± 4.69 a28.39 ± 1.24 a
N:P2.82 ± 0.47 a3.00 ± 0.41 a2.63 ± 0.42 a2.66 ± 0.14 a
CK, control; T, oyster shell powder; B, biochar; TB, oyster shell powder combined with biochar; SOC, soil organic carbon; DOC, dissolved organic carbon; TN, total N; DN, dissolved N; TP, total P; AP, available P; AK, available K; C:N, SOC/TN; C:P, SOC/TP; N:P, TN/TP. Different letters in the same row indicate a significant difference (p < 0.05).
Table 2. Results of the permutation test of the redundancy analysis (RDA), estimating potential significant relationships between soil chemical properties with enzyme activities and their stoichiometry. The results are based on 999 permutations.
Soil Chemical PropertyExplainsPseudo-Fp-Value
pH50%9.820.002 **
SOC7%0.800.436
DOC7%0.710.458
TN6%0.670.512
DN18%2.220.112
TP9%1.030.352
AP8%0.830.434
AK7%0.730.456
C:N4%0.420.662
C:P5%0.520.588
N:P8%0.820.434
LPI−C55%12.290.002 **
LPII−C32%4.660.010 *
RP−C5%0.500.624
Explains: the percentage explained by each soil chemical property. Significant effects at * p < 0.05, ** p < 0.01.
Disclaimer/Publisher’s Note: The statements, opinions and data contained in all publications are solely those of the individual author(s) and contributor(s) and not of MDPI and/or the editor(s). MDPI and/or the editor(s) disclaim responsibility for any injury to people or property resulting from any ideas, methods, instructions or products referred to in the content.

