
The Classification of Log Decay Classes and an Analysis of Their Physical and Chemical Characteristics Based on Artificial Neural Networks and K-Means Clustering

Abstract
:1. Introduction
2. Materials and Methods
2.1. Site
2.2. Materials
2.3. Experimental Procedures
2.3.1. Determination of Basic Factors
2.3.2. Determination of Hardness
2.3.3. Data Analysis
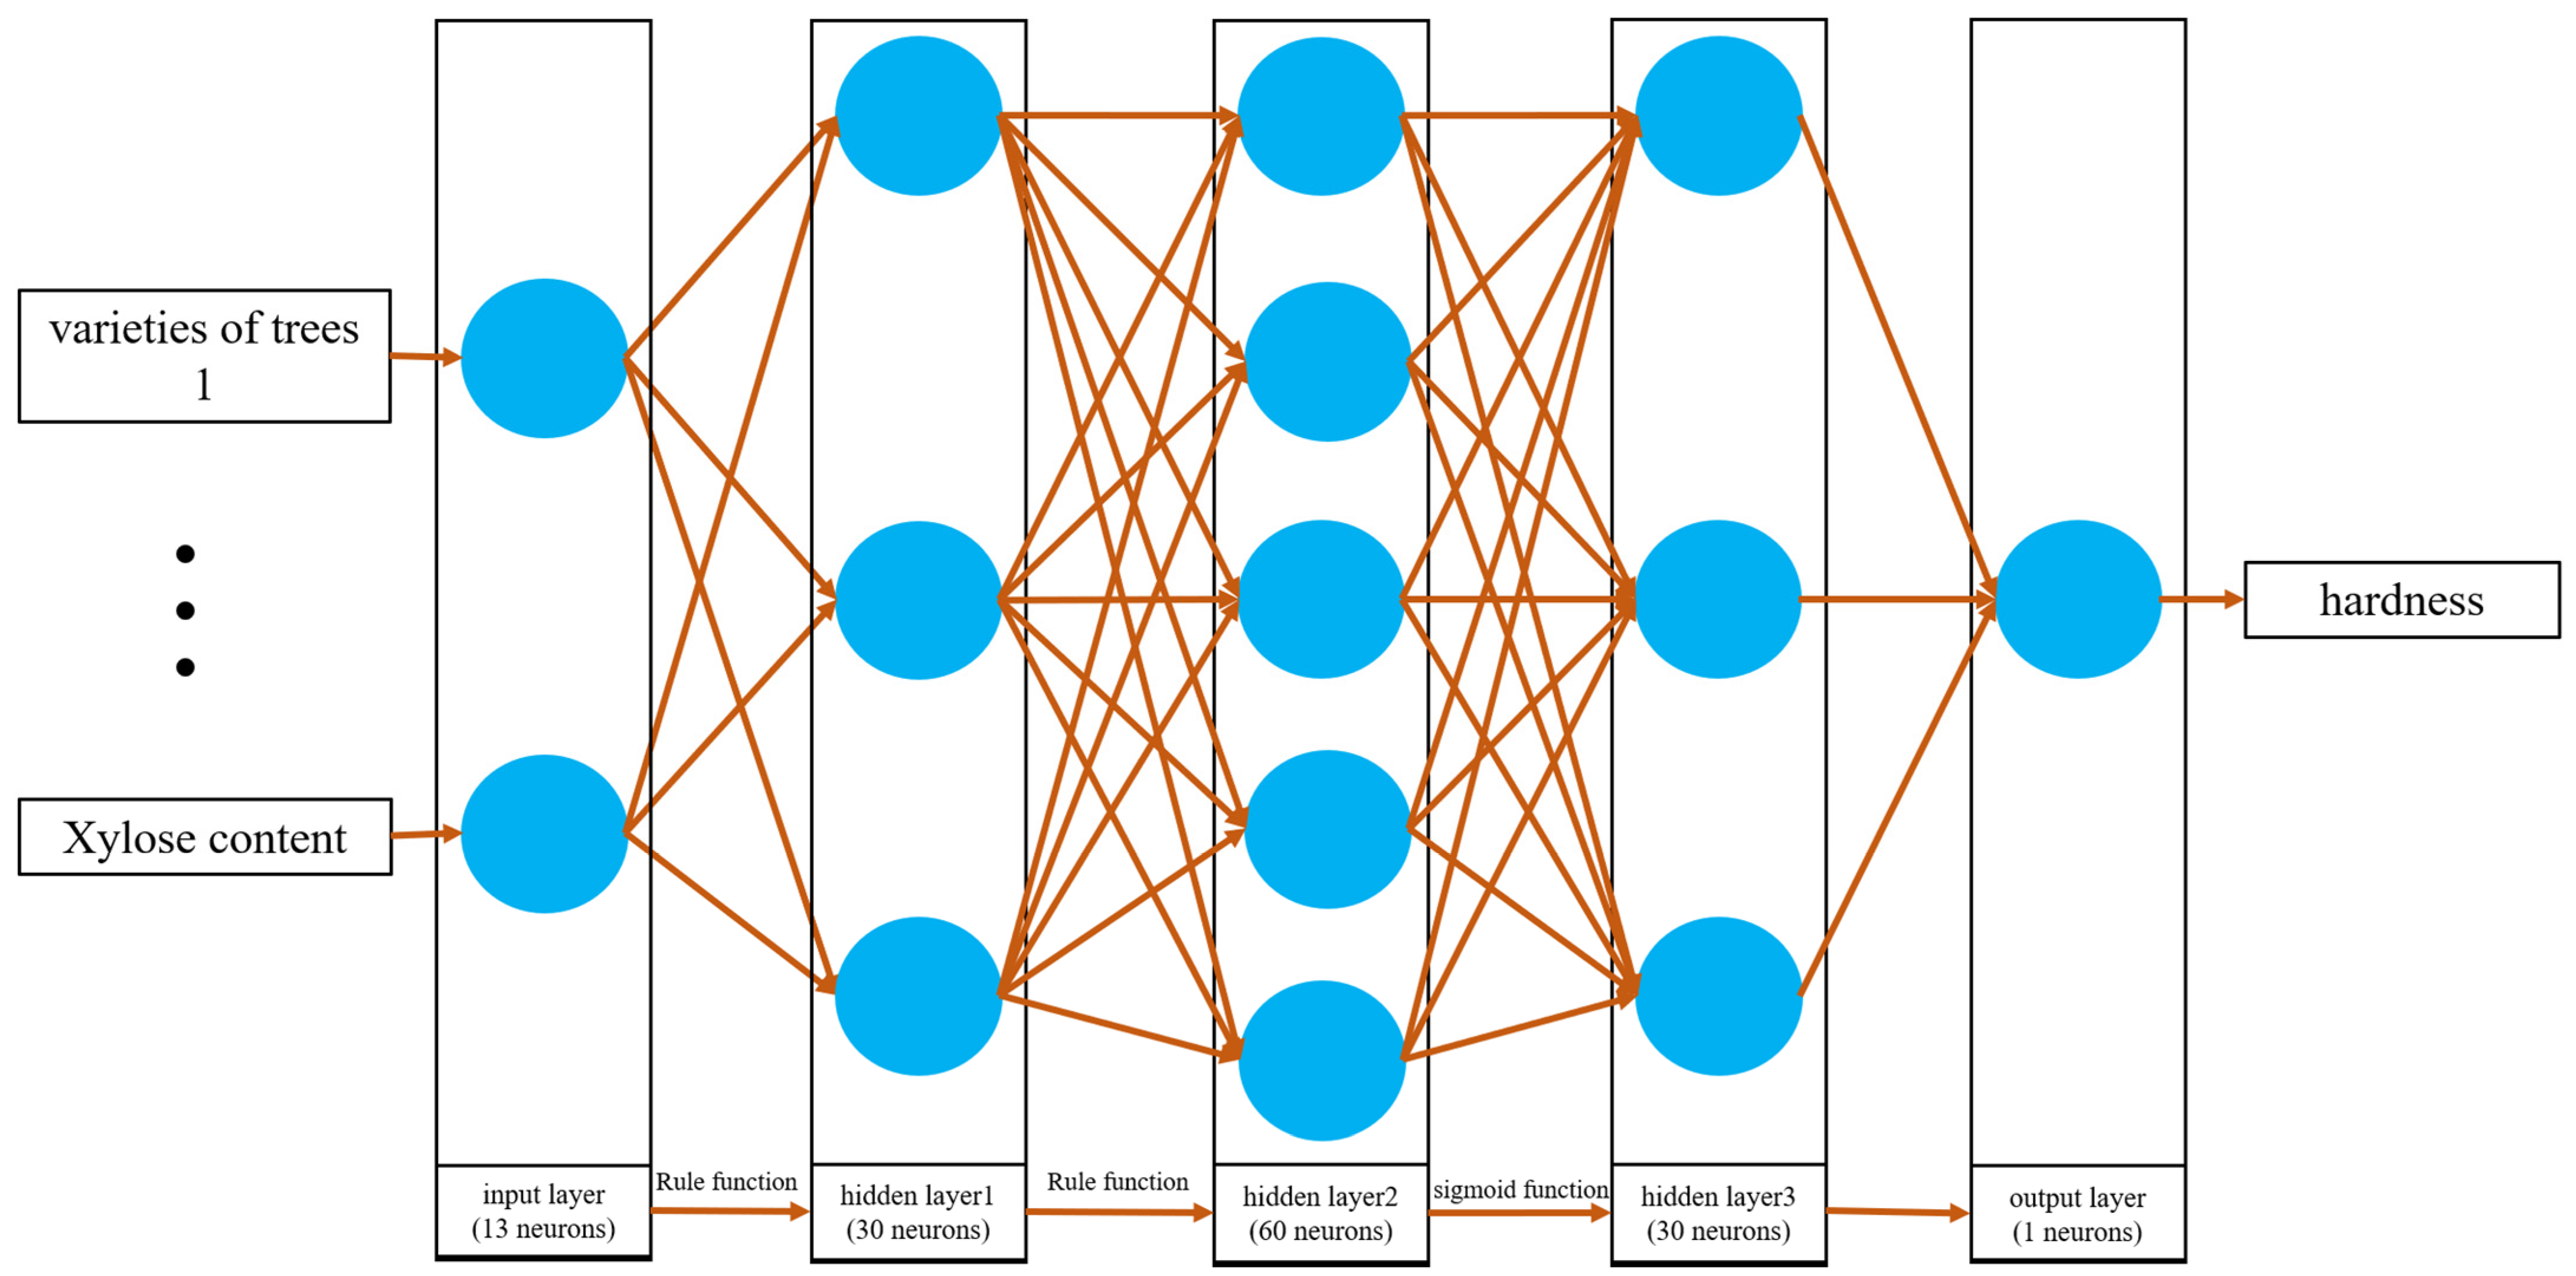
- Artificial Neural Network
- Hardness clustering
- Normal distribution test and ANOVA
3. Results
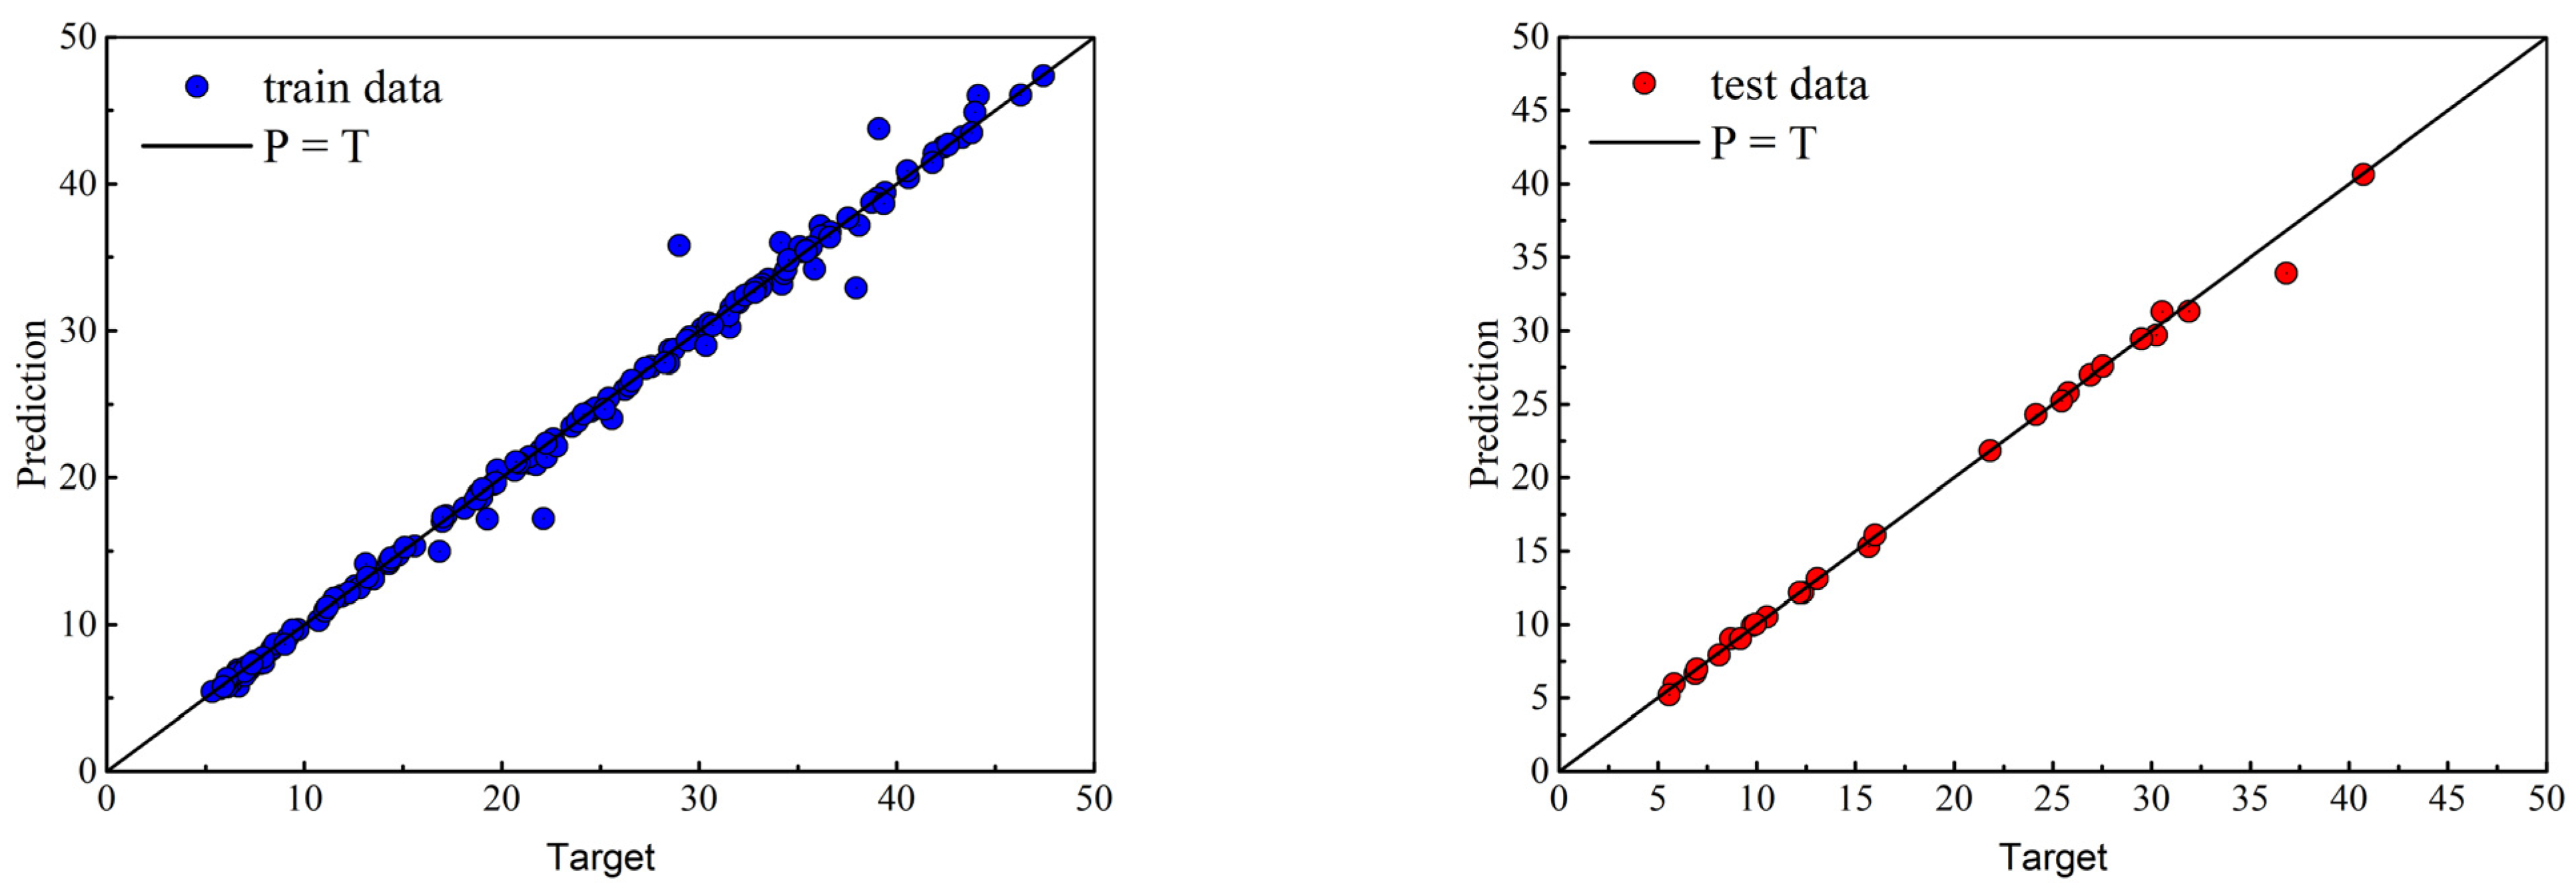
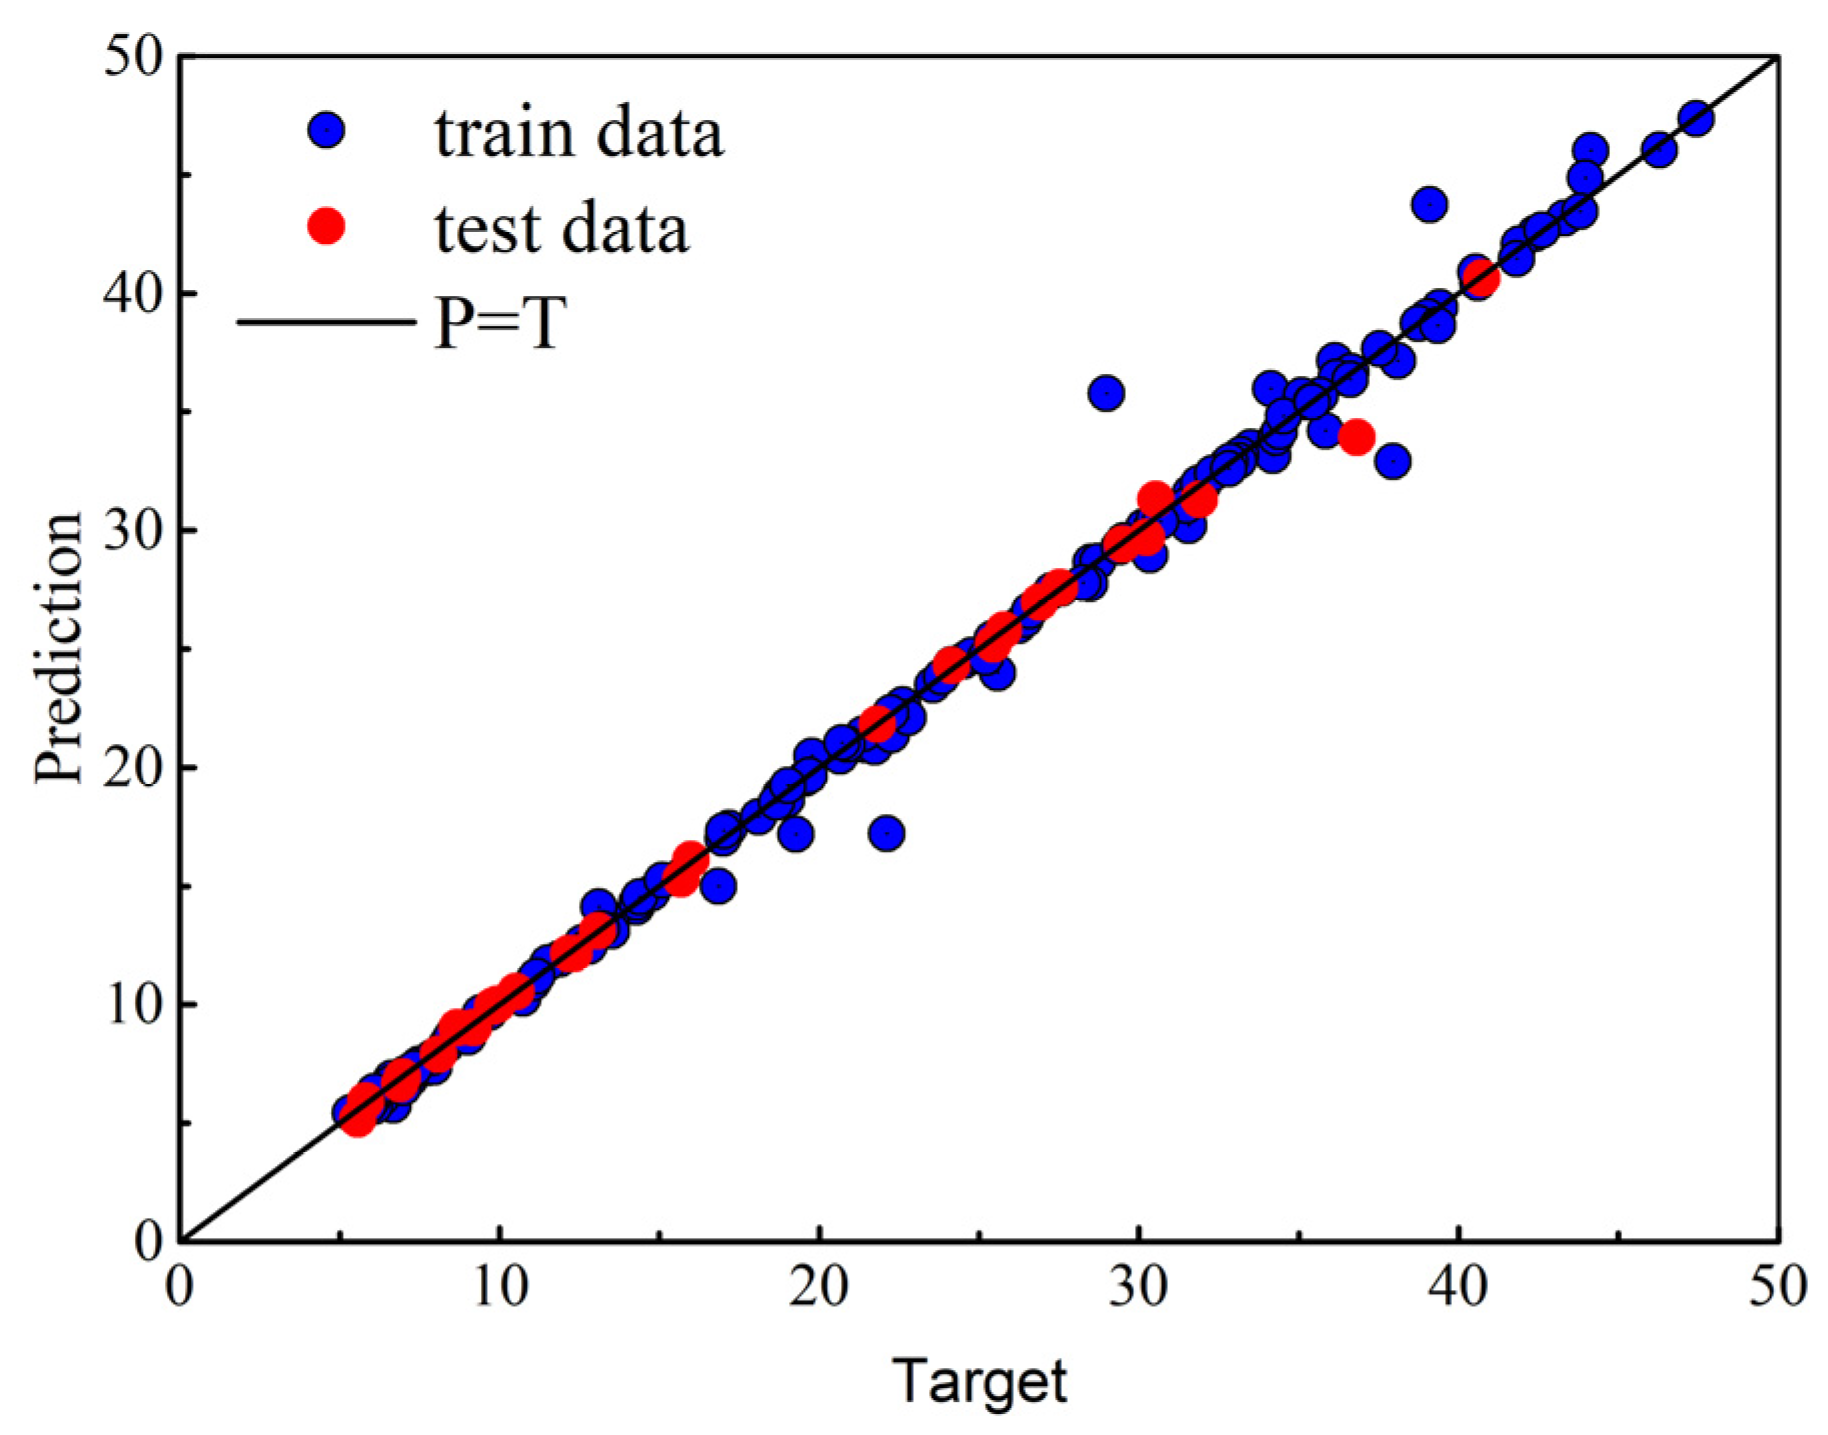
3.1. Prediction of the Hardness Value of Log under Different Levels of Decay and Different Moisture Content Conditions Using an ANN
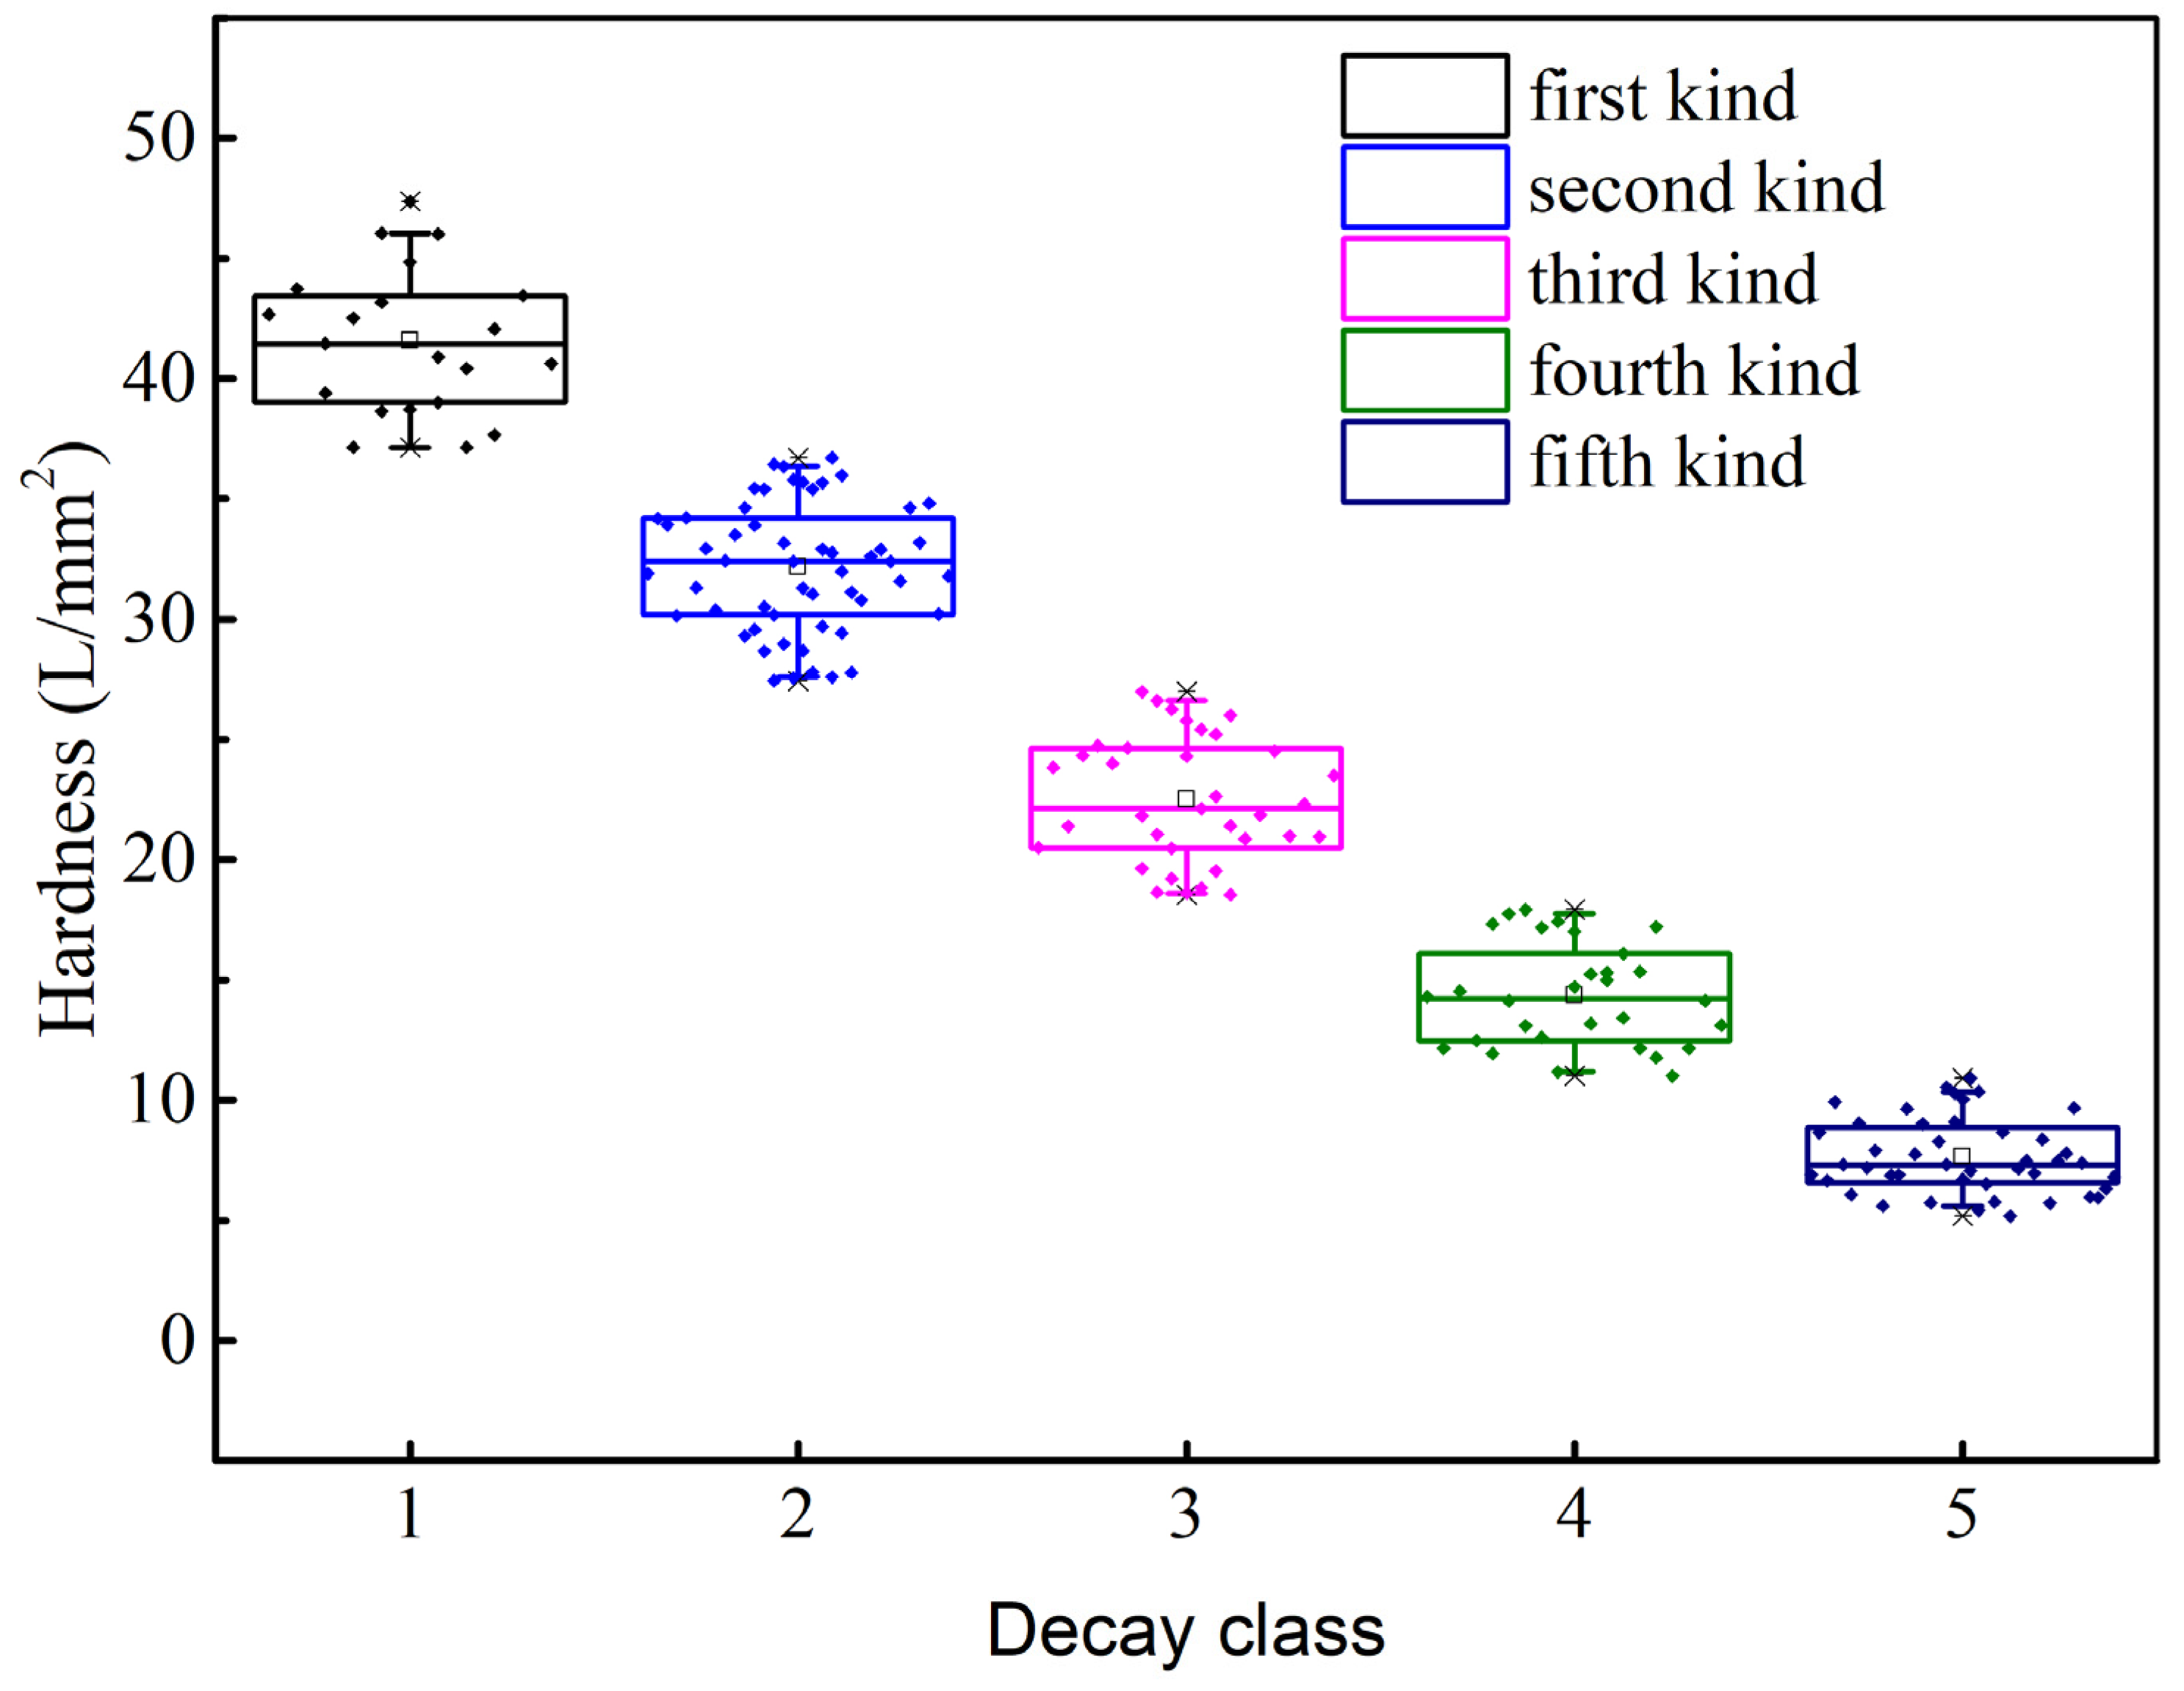
3.2. K-Means Clustering Analysis and the Classification of Log Decay Classes Based on the Hardness of Log
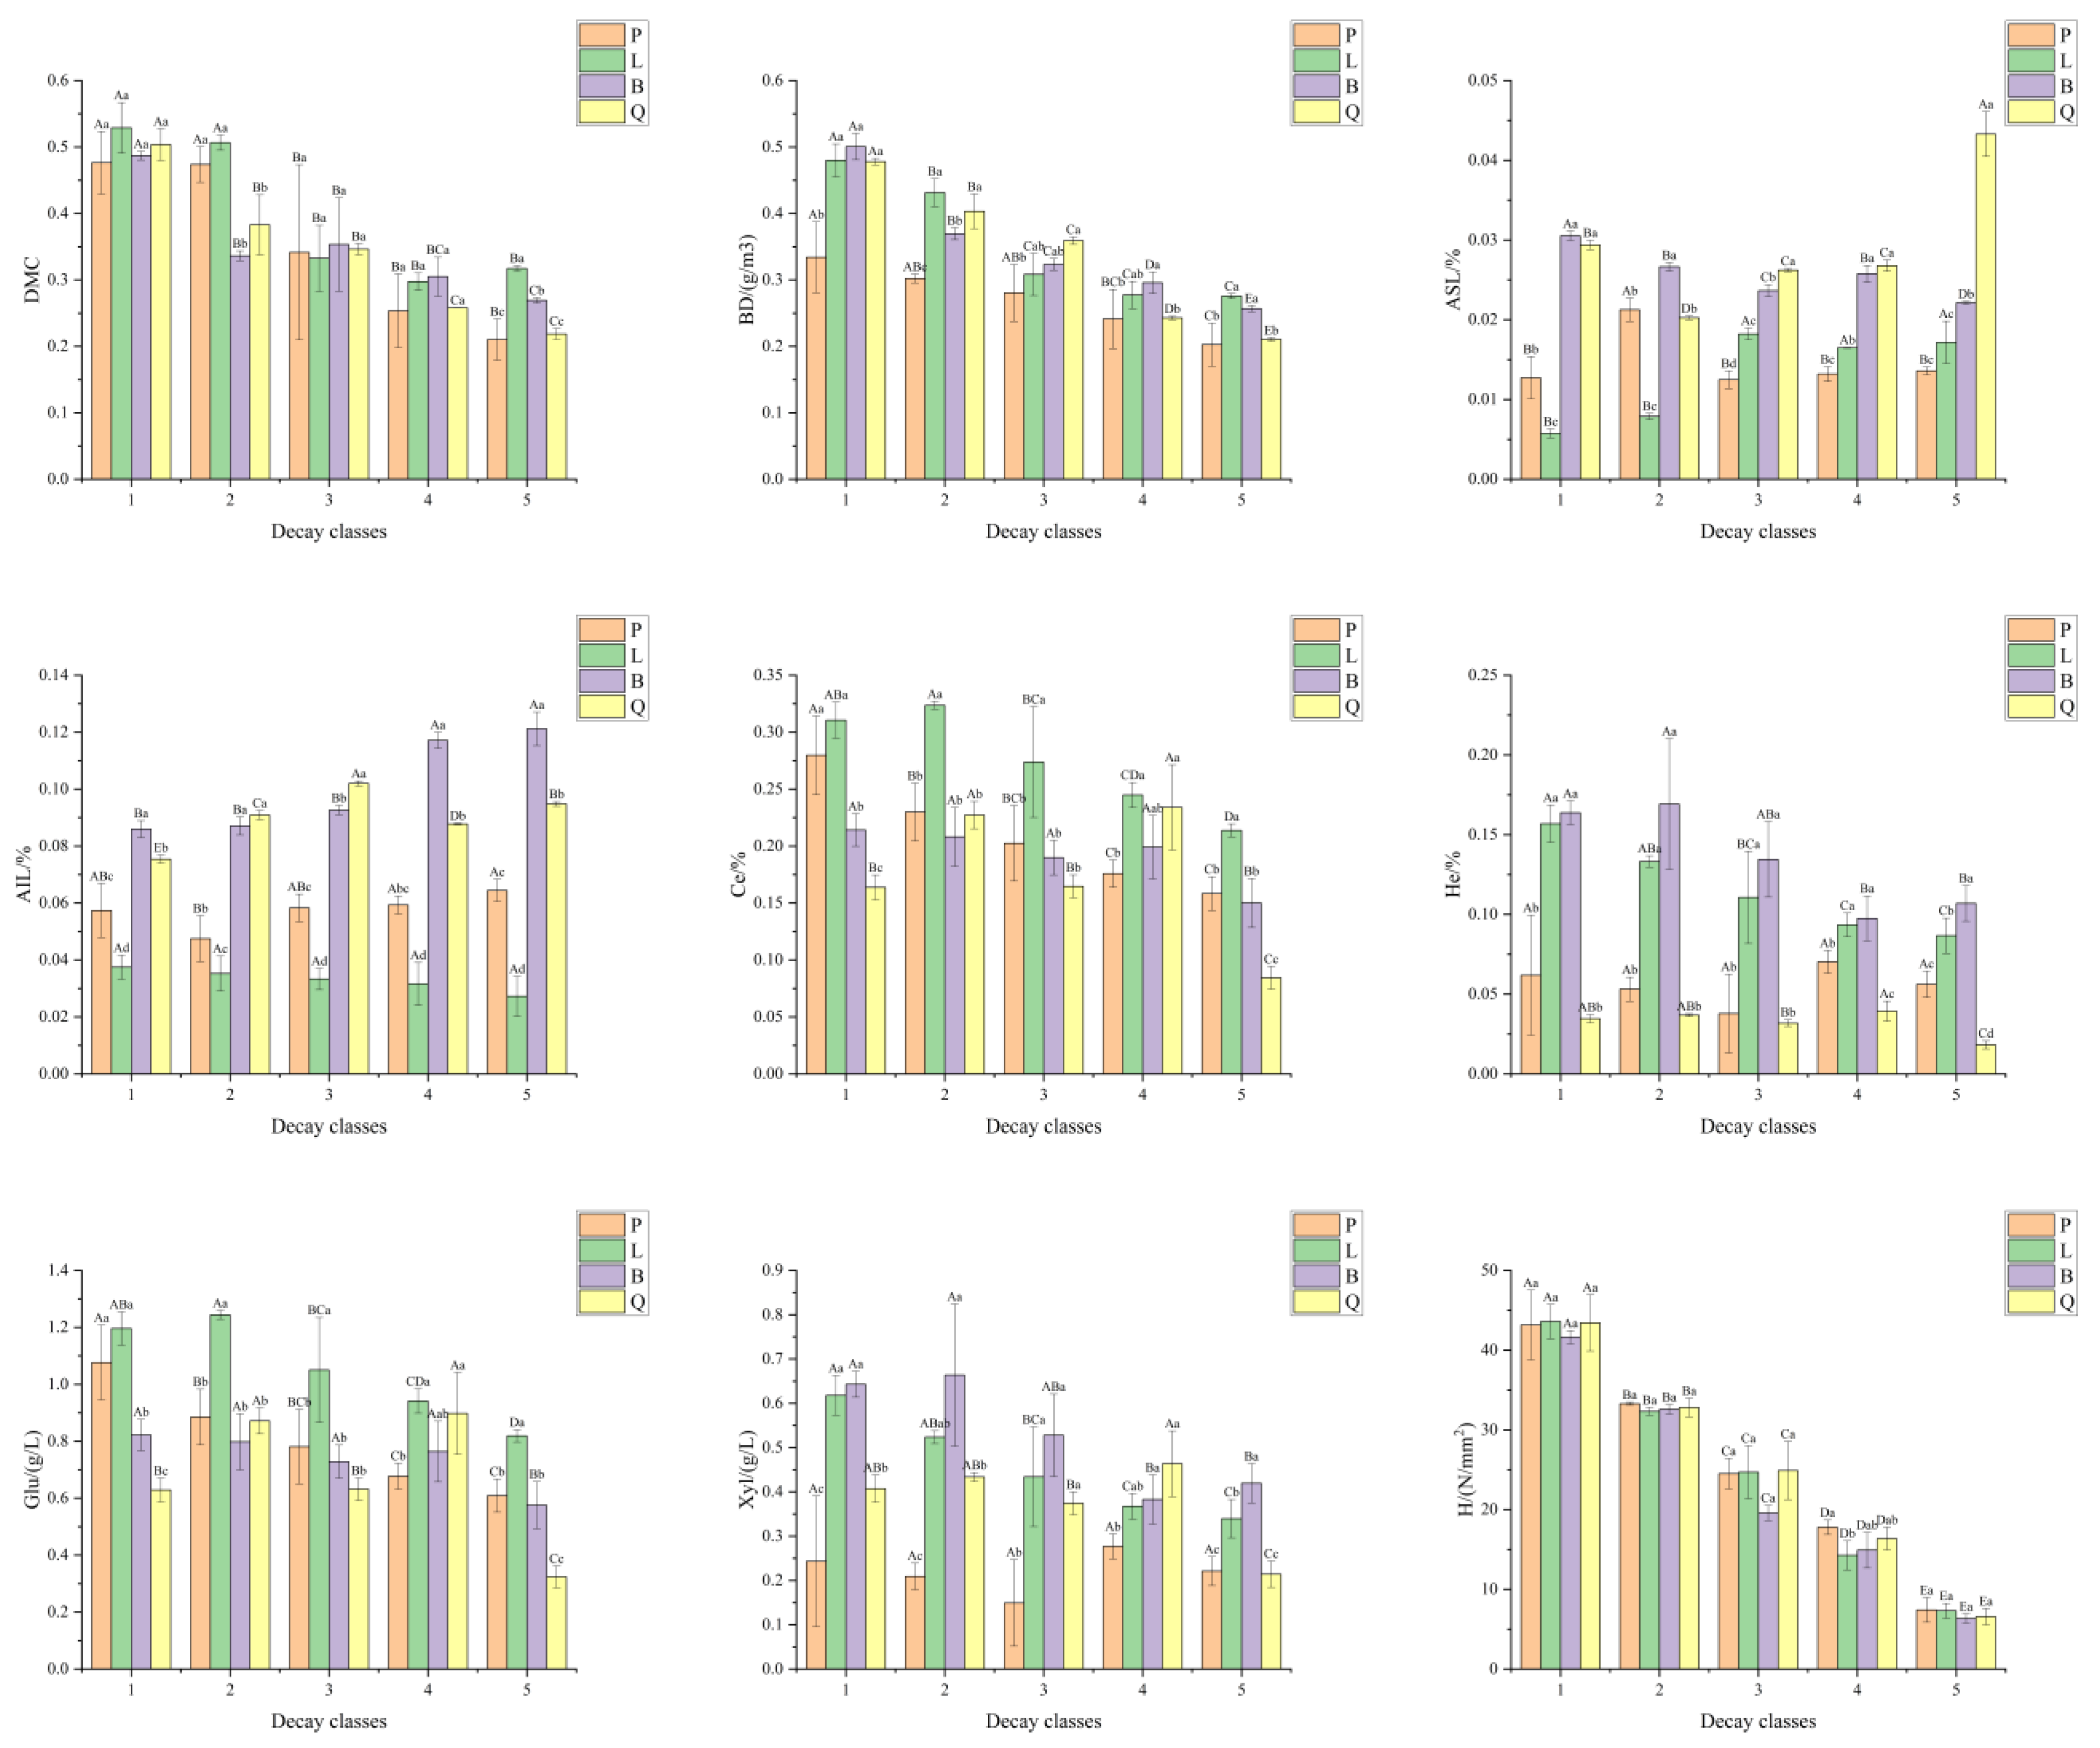
3.3. Physicochemical Characteristics of Logs with Different Decay Grades
4. Discussion
5. Conclusions
Author Contributions
Funding
Data Availability Statement
Conflicts of Interest
References
- Harmon, M.E.; Franklin, J.F.; Swanson, F.J.; Sollins, P.; Gregory, S.V.; Lattin, J.D.; Anderson, N.H.; Cline, S.P.; Aumen, N.G.; Sedell, J.R.; et al. Ecology of coarse woody debris in temperate ecosystems. Adv. Ecol. Res. 1986, 15, 122–302. [Google Scholar]
- Brassard, B.W.; Chen, H.Y.H. Stand structural dynamics of North American boreal forests. Crit. Rev. Plant Sci. 2006, 25, 115–137. [Google Scholar] [CrossRef]
- Harmon, M.E.; Chen, H. Coarse woody debris dynamics in two old-growth ecosystems. Bioscience 1991, 41, 604–610. [Google Scholar] [CrossRef]
- Garrett, L.; Davis, M.; Oliver, G. Decomposition of coarse woody debris, and methods for determining decay rates. N. Z. J. For. Sci. 2007, 37, 227–240. [Google Scholar]
- Mackensen, J.; Bauhus, J.; Webber, E.J. Decomposition rates of coarse woody debris: A review with particular emphasis on Australian tree species. Aust. J. Bot. 2003, 51, 27–37. [Google Scholar] [CrossRef]
- Xu, H.D.; Wei, J.D.; Di, Y.N.; Qin, R.X.; Zhen, Z.L. Changes in Carbon Sequestration in Wood During Decay by Brown- and White-Rot Fungi. J. Biobased Mater. Bioenergy 2020, 14, 414–419. [Google Scholar] [CrossRef]
- Brown, S. Measuring carbon in forests: Current status and future challenges. Environ. Pollut. 2002, 116, 363–372. [Google Scholar] [CrossRef]
- Yuan, J. Study on Coarse Woody Residues of Main Forest Types in Huoditang Forest Area of Qinling Mountains. Ph.D. Thesis, Northwest A&F University, Xianyang, China, 2016. [Google Scholar]
- Yan, E.; Wang, X.; Huang, J. Concept and classification of coarse woody debris in forest ecosystems. Acta Ecol. Sin. 2005, 25, 158–167. [Google Scholar] [CrossRef]
- Maser, C.; Anderson, R.G.; Cromack, K.; Williams, J.T.; Martin, R.E. Dead and Down Woody Material. In Wildlife Habitats in Managed Forests of the Blue Mountains of Oregon and Washington; USDA Forest Service: Washington, DC, USA, 1979. [Google Scholar]
- Sollins, P. Input and decay of coarse woody debris in coniferous stands in western Oregon and Washington. Can. J. For. Res. 1982, 12, 18–28. [Google Scholar] [CrossRef]
- Spies, T.A.; Franklin, J.F.; Thomas, T.B. Coarse woody debris in Douglas-fir forest of western Oregon and Washington. Ecology 1988, 69, 1689–1702. [Google Scholar] [CrossRef]
- Larjavaara, M.; Muller-Landau, H. Comparison of decay classification, knife test, and two penetrometers for estimating wood density of coarse woody debris. Can. J. For. Res. 2010, 40, 2313–2321. [Google Scholar] [CrossRef]
- Oberle, B.; Dunham, K.; Milo, A.; Walton, M.; Young, D.; Zanne, A. Progressive, idiosyncratic changes in wood hardness during decay: Implications for dead wood inventory and cycling. For. Ecol. Manag. 2014, 323, 1–9. [Google Scholar] [CrossRef]
- Spänhoff, B. Simple Method for Rating the Decay Stages of Submerged Woody Debris. J. N. Am. Benthol. Soc. 2001, 20, 385–394. [Google Scholar] [CrossRef]
- Vlad, R.; Zhiyanski, M.; Dinca, L.; Sidor, C.; Constandache, C.; Gheorghe, P.; Ispravnic, A.; Blaga, T. Assessment of the density of wood with stem decay of Norway spruce trees using drill resistance. Comptes Rendus L’académie Bulg. Sci. Sci. Mathématiques Nat. 2018, 71, 1502–1510. [Google Scholar]
- Chambers, J.Q.; Schimel, J.P.; Nobre, A.D. Respiration from coarse wood litter in central Amazon forests. Biogeochemistry 2001, 52, 115–131. [Google Scholar] [CrossRef]
- Lutes, D.C.; Hardy, C.C. Lodgepole Pine Bole Wood Density and Decay Rate 1, 11, and 22 Years After Felling in Central Montana, United States. Front. For. Glob. Chang. 2021, 4, 687567. [Google Scholar] [CrossRef]
- Maser, C.; Trappe, J.M. The Seen and Unseen World of the Fallen Tree; Pacific Northwest Forest and Range Experiment Station, US Department of Agriculture, Forest Service: Portland, OR, USA, 1984.
- Yuan, J.; Zhang, S.X. Study on the variation characteristics of fallen wood density and water content of natural secondary Pinus tabulaeformis forest in Huoditang, Qinling Mountains. J. Cent. South Univ. For. Technol. 2012, 32, 105–109. [Google Scholar]
- Fujihira, M.; Nakamura, Y.; Isoda, N.; Hikita, Y. Relationship between decay resistance and changes of bending strength of structural lumber of wood-framing construction by fungal attack. Mokuzai Gakkaishi 1997, 43, 589–594. [Google Scholar]
- Maeda, K.; Ohta, M.; Momohara, I. Relationship between the mass profile and the strength property profile of decayed wood. Wood Sci. Technol. 2015, 49, 331–344. [Google Scholar] [CrossRef]
- Berg, B.; McClaugherty, C. Plant Litter: Decomposition, Humus Formation, Carbon Sequestration; Springer: Berlin, Germany, 2014. [Google Scholar]
- Talbot, J.M.; Treseder, K.K. Interactions among lignin, cellulose, and nitrogen drive litter chemistry–decay relationships. Ecology 2012, 93, 345–354. [Google Scholar] [CrossRef]
- Rutigliano, F.A.; De Santo, A.V.; Berg, B.; Alfani, A.; Fioretto, A. Lignin decomposition in decaying leaves of Fagus sylvatica L. and needles of Abies alba Mill. Soil Biol. Biochem. 1996, 28, 101–106. [Google Scholar] [CrossRef]
- Wu, A.M.; Yin, R.; Xu, Z.F.; Zhang, L.; You, C.M.; Liu, Y.; Li, H.; Wang, L.X.; Liu, S.N.; Zhang, Y.Q.; et al. Forest gaps slow lignin and cellulose degradation of fir (Abies faxoniana) twig litter in an alpine forest. Geoderma 2022, 424, 116010. [Google Scholar] [CrossRef]
- He, W.; Fu, Z.W.; Zhang, D.J.; Yang, W.Q.; Tan, B.; Zhao, Y.Y.; Wu, Q.Q. The effects of forest gaps on cellulose degradation in the foliar litter of two shrub species in an alpine fir forest. Plant Soil 2015, 303, 109–122. [Google Scholar] [CrossRef]
- He, W.; Wu, F.Z.; Yang, W.Q.; Tan, B.; Zhao, Y.Y.; He, M. Lignin Degradation in Foliar Litter of Two Shrub Species from the Gap Center to the Closed Canopy in an Alpine Fir Forest. Ecosystems 2016, 19, 115–128. [Google Scholar] [CrossRef]
- Tan, B.; Yin, R.; Yang, W.Q.; Zhang, J.; Xu, Z.F.; Liu, Y.; He, S.Q.; Zhou, W.; Zhang, L.; Li, H.; et al. Soil fauna show different degradation patterns of lignin and cellulose along an elevational gradient. Appl. Soil Ecol. 2020, 155, 103673. [Google Scholar] [CrossRef]
- Means, J.E.; Cromack, K.J.; MacMillan, P.C. Comparison of decomposition models using wood density of Douglas-fir logs. Can. J. For. Res.-Rev. Can. Rech. For.—Can. J. Forest Res. 1985, 15, 1092–1098. [Google Scholar] [CrossRef]
- Ganjegunte, G.K.; Condron, L.M.; Clinton, P.W.; Davis, M.R.; Mahieu, N. Decomposition and nutrient release from radiata pine (Pinus radiata) coarse woody debris. For. Ecol. Manag. 2004, 187, 197–211. [Google Scholar] [CrossRef]
- Rahman, M.M.; Tsukamoto, J.; Rahman, M.M.; Yoneyama, A.; Mostafa, K.M. Lignin and its effects on litter decomposition in forest ecosystems. Chem. Ecol. 2013, 29, 540–553. [Google Scholar] [CrossRef]
- Klotzbücher, T.; Kaiser, K.; Guggenberger, G.; Gatzek, C.; Kalbitz, K. A new conceptual model for the fate of lignin in decomposing plant litter. Ecology 2011, 92, 1052–1062. [Google Scholar] [CrossRef]
- Chen, Y.M.; Liu, Y.; Zhang, J.; Yang, W.Q.; Deng, C.C.; He, R.L. Cumulative cellulolytic enzyme activities and initial litter quality in prediction of cellulose degradation in an alpine meadow of the eastern Tibetan Plateau. J. Plant Ecol. 2020, 13, 51–58. [Google Scholar] [CrossRef]
- Sluiter, A.; Hames, B.; Ruiz, R.O.; Scarlata, C.; Sluiter, J.; Templeton, D. Determination of structural carbohydrates and lignin in biomass. Biomass Anal. Technol. Team Lab Anal. Proced. 2004, 2011, 1–14. [Google Scholar]
- Yi, Y.G.P. Property analysis of linear dimensionless methods. Stat. Res. 2008, 196, 93–100. [Google Scholar] [CrossRef]
- Haghbakhsh, R.; Adib, H.; Keshavarz, P.; Koolivand, M.; Keshtkari, S. Development of an artificial neural network model for the prediction of hydrocarbon density at high-pressure, high-temperature conditions. Thermochim. Acta 2013, 551, 124–130. [Google Scholar] [CrossRef]
- Han, Y.; Zhang, Y.; Jin, G. Effects of decay class and diameter class on moisture content and wood density in a typical mixed broadleaf-Korean pine forest. J. Nanjing For. Univ. Nat. Sci. Ed. 2020, 44, 133–140. [Google Scholar]
- Mu, Z.B.; Pan, H.; Wen, X.H.; Chao, Y.S.; You, W.B.; Liu, J.S.; Cai, C.T.; He, D.J. Effects of decay grades and diameter classes on physicochemical properties of woody debris in Tsuga longibracteata forest in Tianbaoyan National Nature Reserve. Shengtaixue Zazhi 2022, 41, 246–255. [Google Scholar] [CrossRef]
- Wang, L.H.; Zhang, X.L.; Xu, G.Q.; Xu, H.D.; Wu, J.Z. Using Lignin Content, Cellulose Content, and Cellulose Crystallinity as Indicators of Wood Decay in Juglans mandshurica Maxim. and Pinus koraiensis. Bioresources 2014, 9, 6205–6213. [Google Scholar] [CrossRef]
- Larson, P.R. Wood Formation and the Concept of Wood Quality; Yale University, School of Forestry: New Haven, CT, USA, 1969; pp. 1–54. [Google Scholar]
- Doyle, J.; Walker, J.C.F. Indentation of wood by wedges. Wood Sci. Technol. 1985, 19, 47–55. [Google Scholar] [CrossRef]
- Van Nguyen, T.H.; Nguyen, T.T.; Ji, X.; Lanh Do, K.T.; Guo, M. Using Artificial Neural Networks (ANN) for Modeling Predicting Hardness Change of Wood during Heat Treatment. IOP Conf. Ser. Mater. Sci. Eng. 2018, 394, 032044. [Google Scholar] [CrossRef]
- Shorohova, E.; Kapitsa, E.; Kuznetsov, A.; Kuznetsova, S.; de Gerenyu, V.L.; Kaganov, V.; Kurganova, I. Coarse woody debris density and carbon concentration by decay classes in mixed montane wet tropical forests. Biotropica 2022, 54, 635–644. [Google Scholar] [CrossRef]
- Di Lella, S.; Tognetti, R.; La Porta, N.; Lombardi, F.; Nardin, T.; Larcher, R. Characterization of Silver fir Wood Decay Classes Using Sugar Metabolites Detected with Ion Chromatography. J. Wood Chem. Technol. 2019, 39, 90–110. [Google Scholar] [CrossRef]
- Russell, M.B.; Fraver, S.; Aakala, T.; Gove, J.H.; Woodall, C.W.; D’Amato, A.W.; Ducey, M.J. Quantifying carbon stores and decomposition in dead wood: A review. For. Ecol. Manag. 2015, 350, 107–128. [Google Scholar] [CrossRef]
- Yuan, J.; Cheng, F.; Zhu, X.; Li, J.X.; Zhang, S.X. Respiration of downed logs in pine and oak forests in the Qinling Mountains, China. Soil Biol. Biochem. 2018, 127, 1–9. [Google Scholar] [CrossRef]
- Harmon, M.E.; Fasth, B.; Woodall, C.W.; Sexton, J. Carbon concentration of standing and downed woody detritus: Effects of tree taxa, decay class, position, and tissue type. For. Ecol. Manag. 2013, 291, 259–267. [Google Scholar] [CrossRef]
- Lombardi, F.; Cherubini, P.; Tognetti, R.; Cocozza, C.; Lasserre, B.; Marchetti, M. Investigating biochemical processes to assess deadwood decay of beech and silver fir in Mediterranean mountain forests. Ann. For. Sci. 2013, 70, 101–111. [Google Scholar] [CrossRef]
- Petrillo, M.; Cherubini, P.; Sartori, G.; Abiven, S.; Ascher, J.; Bertoldi, D.; Camin, F.; Barbero, A.; Larcher, R.; Egli, M. Decomposition of Norway spruce and European larch coarse woody debris (CWD) in relation to different elevation and exposure in an Alpine setting. iForest-Biogeosci. For. 2016, 9, 154–164. [Google Scholar] [CrossRef]
- Tze, W.T.Y.; Wang, S.; Rials, T.G.; Pharr, G.M.; Kelley, S.S. Nanoindentation of wood cell walls: Continuous stiffness and hardness measurements. Compos. Part A Appl. Sci. Manuf. 2007, 38, 945–953. [Google Scholar] [CrossRef]


| Performance Criteria | Data Sets | ||
|---|---|---|---|
| Training Data | Testing Data | All | |
| MAPE | 0.02069 | 0.02134 | 0.01716 |
| RMSE | 1.0264 | 0.6187 | 0.9576 |
| R2 | 0.9925 | 0.9964 | 0.9931 |
| Indictors | DMC | BD | ASL | AIL | Ce | He | Glu | Xyl | H | |
|---|---|---|---|---|---|---|---|---|---|---|
| p-Value | ||||||||||
| TS | 0.496 | 0.496 | 0.041 | 0.000 | 0.000 | 0.000 | 0.000 | 0.000 | 0.971 | |
| DC | 0.000 | 0.000 | 0.668 | 0.789 | 0.000 | 0.295 | 0.000 | 0.032 | 0.000 | |
Disclaimer/Publisher’s Note: The statements, opinions and data contained in all publications are solely those of the individual author(s) and contributor(s) and not of MDPI and/or the editor(s). MDPI and/or the editor(s) disclaim responsibility for any injury to people or property resulting from any ideas, methods, instructions or products referred to in the content. |
© 2023 by the authors. Licensee MDPI, Basel, Switzerland. This article is an open access article distributed under the terms and conditions of the Creative Commons Attribution (CC BY) license (https://creativecommons.org/licenses/by/4.0/).
Share and Cite
Wen, W.; Zhang, W.; He, S.; Hu, H.; Qiao, H.; Wang, X.; Rao, N.; Yuan, J. The Classification of Log Decay Classes and an Analysis of Their Physical and Chemical Characteristics Based on Artificial Neural Networks and K-Means Clustering. Forests 2023, 14, 852. https://doi.org/10.3390/f14040852
Wen W, Zhang W, He S, Hu H, Qiao H, Wang X, Rao N, Yuan J. The Classification of Log Decay Classes and an Analysis of Their Physical and Chemical Characteristics Based on Artificial Neural Networks and K-Means Clustering. Forests. 2023; 14(4):852. https://doi.org/10.3390/f14040852
Chicago/Turabian StyleWen, Wen, Wenjun Zhang, Shirong He, Haitao Hu, Hailiang Qiao, Xiao Wang, Nan Rao, and Jie Yuan. 2023. "The Classification of Log Decay Classes and an Analysis of Their Physical and Chemical Characteristics Based on Artificial Neural Networks and K-Means Clustering" Forests 14, no. 4: 852. https://doi.org/10.3390/f14040852