Article

Weighted Gene Co-Expression Network Analysis Reveals Key Pathways and Hub Genes Associated with Successful Grafting in Pecan (Carya illinoinensis)

1
Institute of Botany, Jiangsu Province and Chinese Academy of Sciences, Nanjing 210014, China
2
Jiangsu Key Laboratory for the Research and Utilization of Plant Resources, Nanjing 210014, China
3
Jiangxi Forestry Science and Technology Promotion and Propaganda Education Center, Nanchang 330038, China
*
Author to whom correspondence should be addressed.
Forests 2023, 14(4), 835; https://doi.org/10.3390/f14040835
Submission received: 16 March 2023 / Revised: 9 April 2023 / Accepted: 16 April 2023 / Published: 19 April 2023
(This article belongs to the Special Issue Advances in Tree Germplasm Innovation and High-Efficiency Propagation)

Abstract

:
Patch budding (bud grafting) is a commonly used method for pecan reproduction; however, the grafting survival rate varies with cultivars. Clarifying the underlying mechanisms of successful grafting is pivotal for graft technique improvement. Here, weighted gene co-expression network analysis (WGCNA) was conducted to dissect the key pathways and genes related to the successful grafting of pecan. Based on the transcriptome data of two contrasting cultivars (an easy-to-survive cultivar ‘Pawnee’ and a difficult-to-survive cultivar ‘Jinhua’) in response to budding, all the genes with variable transcripts were grouped into 18 modules. There were two modules that were significantly correlated with the trait of different cultivars. Enrichment analysis showed that several enriched gene ontology (GO) terms were related to oxidative detoxification and genes associated with hormone signaling pathway occupied a high ratio for the two modules. A total of 52 hub genes were identified, and 48 showed promoter polymorphisms between the two cultivars. Our study suggested that oxidative detoxification and hormone signaling were probably the key pathways for the successful grafting of pecan. The 48 hub genes identified here might be the key genes that led to the divergence of graft survival rates among different pecan cultivars. Our results will lay a foundation for future graft technique improvement in pecan.

1. Introduction

Grafting is a widely used technique in plants, especially for economically important tree species. Successful grafting is a complicated process involving oxidative detoxification, callus proliferation, and vascular bundle formation [1,2]. Upon cutting of the graft partners, oxidative stress is induced and high activities of antioxidant scavenging enzymes are required to ensure fast and effective healing [3]. Pectin secretion and callus formation are the passive responses of wound healing, and these reactions contribute to the initial adhesion and short-distance communication of the graft partners [4]. Vascular bundle formation guarantees the long distance of nutrients, hormones, and organics [5], promoting the formation of a graft union.
Over the past decades, transcriptome sequencing has become a routine technique to unravel the control mechanisms of graft union formation. Analysis of the transcriptomes in woody species, such as Torreya grandis [6], pecan [5], and Vitis vinifera [7], has dissected that more than 1000 genes were differentially expressed significantly during the graft healing process, and those genes involved in oxidative stress response, hormone signaling, cell wall modification, cell proliferation, and secondary metabolism were all important for the formation of a successful graft union. Despite the fact that mounting genes associated with graft healing have been revealed, it is still difficult to determine which ones are more relevant and important, since differential expression analysis treats genes as individuals and is inefficient for revealing the interconnection among genes [8,9]. This would seriously limit the application of graft-associated genes in production. Therefore, a systems genetics approach developed for the network-based analysis of transcriptome-wide gene expression is in demand. Several methods have been proposed [10,11,12], among which weighted gene co-expression network analysis (WGCNA) has an intrinsic superiority in screening hub genes.
WGCNA is a systems biology approach for revealing gene–gene association patterns [13]. It is very similar to the traditional cluster analysis, but is more biologically meaningful than the latter due to its special algorithm [14]. The WGCNA algorithm considers that gene connectivity within a network follows a scale-free distribution and correlation between genes is the sum of direct and indirect interactions [12]. Owing to its unique algorithm, WGCNA could effectively group thousands of genes into different modules (each module contains a set of genes with high correlation), analyze the correlation between the modules and phenotypic traits, and identify the biologically significant modules and the hub genes [15]. With this approach, researchers could focus on a few hub genes for further experiments, as hub genes are highly connective and play a core role in maintaining the network’s architecture [16]. Up to now, WGCNA has been extensively applied for identifying key pathways and hub genes in various research fields, such as disease resistance [17], heat tolerance [18], graft healing [19], and flower development [20].
Pecan (C. illinoinensis) is an economically important nut tree, and the reproduction of this species is heavily reliant on grafting [21,22]. For tree production in the nursery, the most commonly adopted grafting method is patch budding [23]. In practice, we found that the budding survival rate varies with cultivars, with ‘Pawnee’ being a typical easy-to-survive cultivar and ‘Jinhua’ being a representative difficult-to-survive cultivar regardless of the genotypes of the rootstocks used. Understanding the possible pathways and key genes causing the difference in the budding success rates among cultivars is helpful for future graft technique improvement. Given this, here, we performed a WGCNA using RNA-seq data generated from the two contrasting cultivars (‘Pawnee’ and ‘Jinhua’) in response to budding.

2. Materials and Methods

2.1. Plant Materials and RNA-seq

Pecan cultivars ‘Pawnee’ and ‘Jinhua’ were employed as scions, and the ‘Shaoxing’ cultivar was used as rootstock. Scions were taken from the new shoots growing in the current season, and rootstocks were the seedlings that had been grown for two growing seasons. Patch budding was performed in August 2021. Based on our observation, the ‘Jinhua’ scion began to present signs of budding failure (scion bark turning green to brownish black) at 12 days after grafting (DAG). To build a time series of RNA-Seq data, scions (~3 cm length × 2 cm width) were collected at four time points (0, 3, 7, and 12 DAG) with two cultivars and three biological repetitions. Each biological replicate contained at least three individual scions.
In total, 24 RNA libraries were built for sequencing. Total RNA was first isolated using a CTAB-based method. The quality and quantity of RNA was monitored by 1% agarose gel electrophoresis and a NanoDrop Spectrophotometer (NanoDrop Technologies, Wilmington, DE, USA). RNA samples possessing A260/A230 values larger than 1.8 and A260/A280 ratios ranging from 1.8 to 2 were considered qualified for library construction. Libraries were constructed with an Illumina TruSeq RNA Sample Prep Kit (San Diego, CA, USA) according to the manufacturer’s protocols. The well-prepared libraries were sequenced on a paired-end (2 × 150) Illumina Hiseq platform. Raw data have been deposited in NCBI’s Sequence Read Archive (SRA) with accession no. SRP355019.

2.2. Selection of Variable Genes

Clean reads were generated through trimming adapter sequences, removing poor-quality and poly-N reads from raw reads. The obtained clean reads were then blasted to the reference genome sequence of pecan cultivar ‘Pawnee’ [24] for summarizing the total read counts of each gene. Gene expressions were normalized to transcripts per million (TPM). The expressions at 0, 3, 7, and 12 DAG libraries for ‘Pawnee’ were represented as P0, P3, P7, and P12, respectively. Similarly, the expressions at 0, 3, 7, and 12 DAG libraries for ‘Jinhua’ were separately indicated as J0, J3, J7, and J12. The expressions at 0 DAG for both genotypes were used as control and subjected to identify differentially expressed genes (DEGs) between every two libraries with the R package DESeq2. Six comparisons among libraries (P3/P0, P7/P0, P12/P0, J3/J0, J7/J0, and J12/J0) were conducted to detect DEGs. Criteria for differential expression were the following: absolute log2-fold change (FC) > 1 and false discovery rate (FDR)-corrected p-value < 0.01. DEGs in at least one of the libraries were recognized as variable genes and were used for WGCNA.

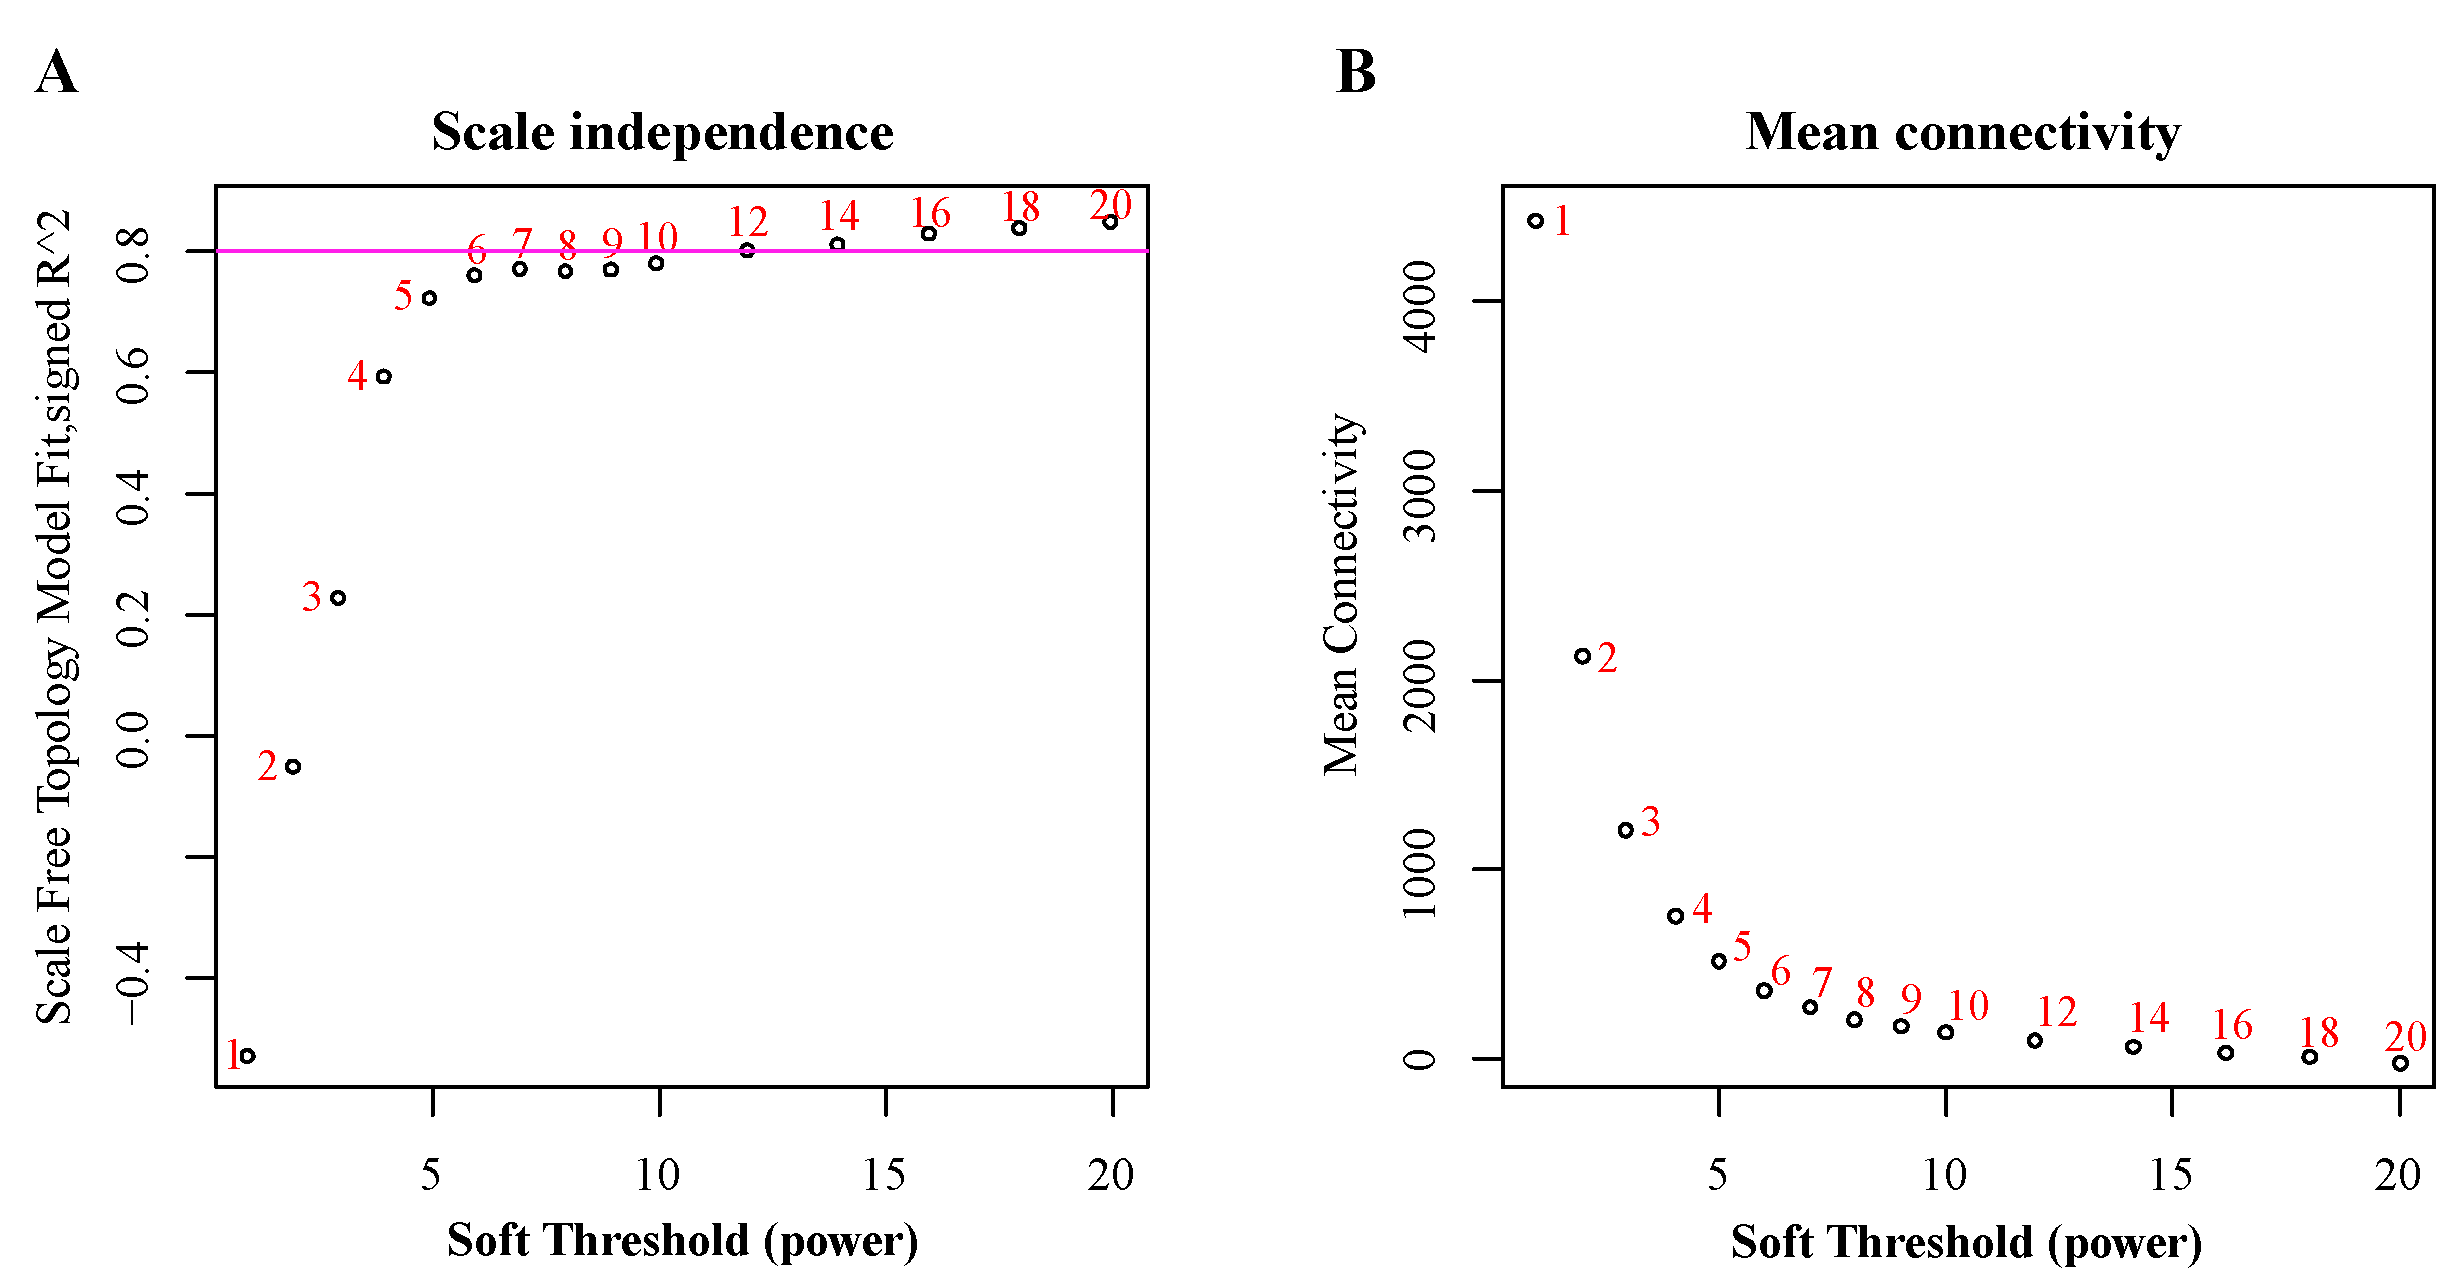
2.3. Construction of Co-Expression Network

An R package WGCNA [12] was applied for co-expression network construction (The used R commands were supplied in Table S1). To build the network, Pearson’s correlation coefficient for each gene pair (in absolute value) was firstly computed using gene expression data and the resulting outcomes constituted a co-expression similarity matrix. Then, a proper soft threshold power β was applied to transform the similarity matrix into an adjacency matrix to emphasize strong correlations and reduce the influence of weak correlations between genes. For selection of the most suitable β, the scale-free topology fit index (R2) and mean connectivity of every supposed β value from 1 to 30 were calculated. When R2 was higher than 0.80, the corresponding β was deemed to be the most appropriate. Thirdly, a topological overlap matrix (TOM) was transformed from the adjacency matrix. This aim was to take into consideration both the directional and non-directional correlations between genes. Finally, hierarchical clustering was performed according to the TOM-based dissimilarity to group all genes into multiple co-expression modules, with each having at least 100 genes. Highly similar modules (higher than 0.75) were merged together to generate the final module clustering.

2.4. Identification of Biologically Significant Modules

The grafting traits used in our study contained grafted cultivar (1 for ‘Jinhua’ and 0 for ‘Pawnee’), collection time (samples collected at 0, 3, 7, and 12 DAG were represented as 1, 2, 3, and 4, respectively), and treatment (0 for un-grafted samples at 0 DAG and 1 for grafted samples). Module eigengenes (MEs), which were defined as the first principal components of a given module representing the general expression of module genes, were calculated via the moduleEigengenes function in WGCNA. Module–trait correlation analysis was carried out through calculating Spearman’s correlation coefficient between MEs and grafting traits. As the grey module contains the genes outside any proper module, it was excluded from the module–trait correlation analysis. Modules with absolute correlation (cor) > 0.5 and p < 0.05 indicated statistical significance. Modules that had statistically significant correlation with traits of grafted cultivar were considered to be biologically meaningful.

2.5. Gene enrichment Analysis on Meaningful Modules

Genes in the biologically meaningful modules were extracted for Gene Ontology (GO) and Kyoto Encyclopedia of Genes and Genomes (KEGG) enrichment analysis using the R package clusterProfiler. Only the biological process category in GO terms was used for analysis. GO terms and KEGG pathways showing adjusted P (Padj) values < 0.05 were considered to be significantly enriched.

2.6. Screen of Hub Gene

The module eigengene-based connectivity (kME), which is the Pearson relevance between the expression pattern of a specific gene and module eigengenes, was calculated for each gene by the signedKME algorithm. A gene with the highest kME has the most connectivity in the network. We used the previously reported criteria, hub genes possessing an absolute kME > 0.9 [25], to select hub genes. The regulation network of hub genes was drawn with Cytoscape software.

2.7. Detecting the Promoter Variations in Hub Genes

To detect promoter variation in the identified hub genes, genome re-sequencing was conducted for ‘Jinhua’ and ‘Pawnee’ cultivars. Total DNA was separately isolated from the healthy leaves of ‘Jinhua’ and ‘Pawnee’ with a CTAB method, and two sequencing libraries with ~300 bp insert length were prepared. Whole genome re-sequencing was conducted on a paired-end (2 × 150) Illumina Hiseq platform. Following sequencing, raw reads (NCBI accession no. PRJNA930916) were processed to generate clean reads. The clean reads were mapped against a pecan (‘Pawnee’ cultivar) reference genome to identify variations using BWA and the Genome Analysis Toolkit (GATK). Genetic variations were summarized in variant call format (VCF) files. The promoter areas (2 kb of nucleotide sequence upstream from the ATG translation initiation site) of the hub genes were compared between cultivars to detect polymorphisms.

3. Results

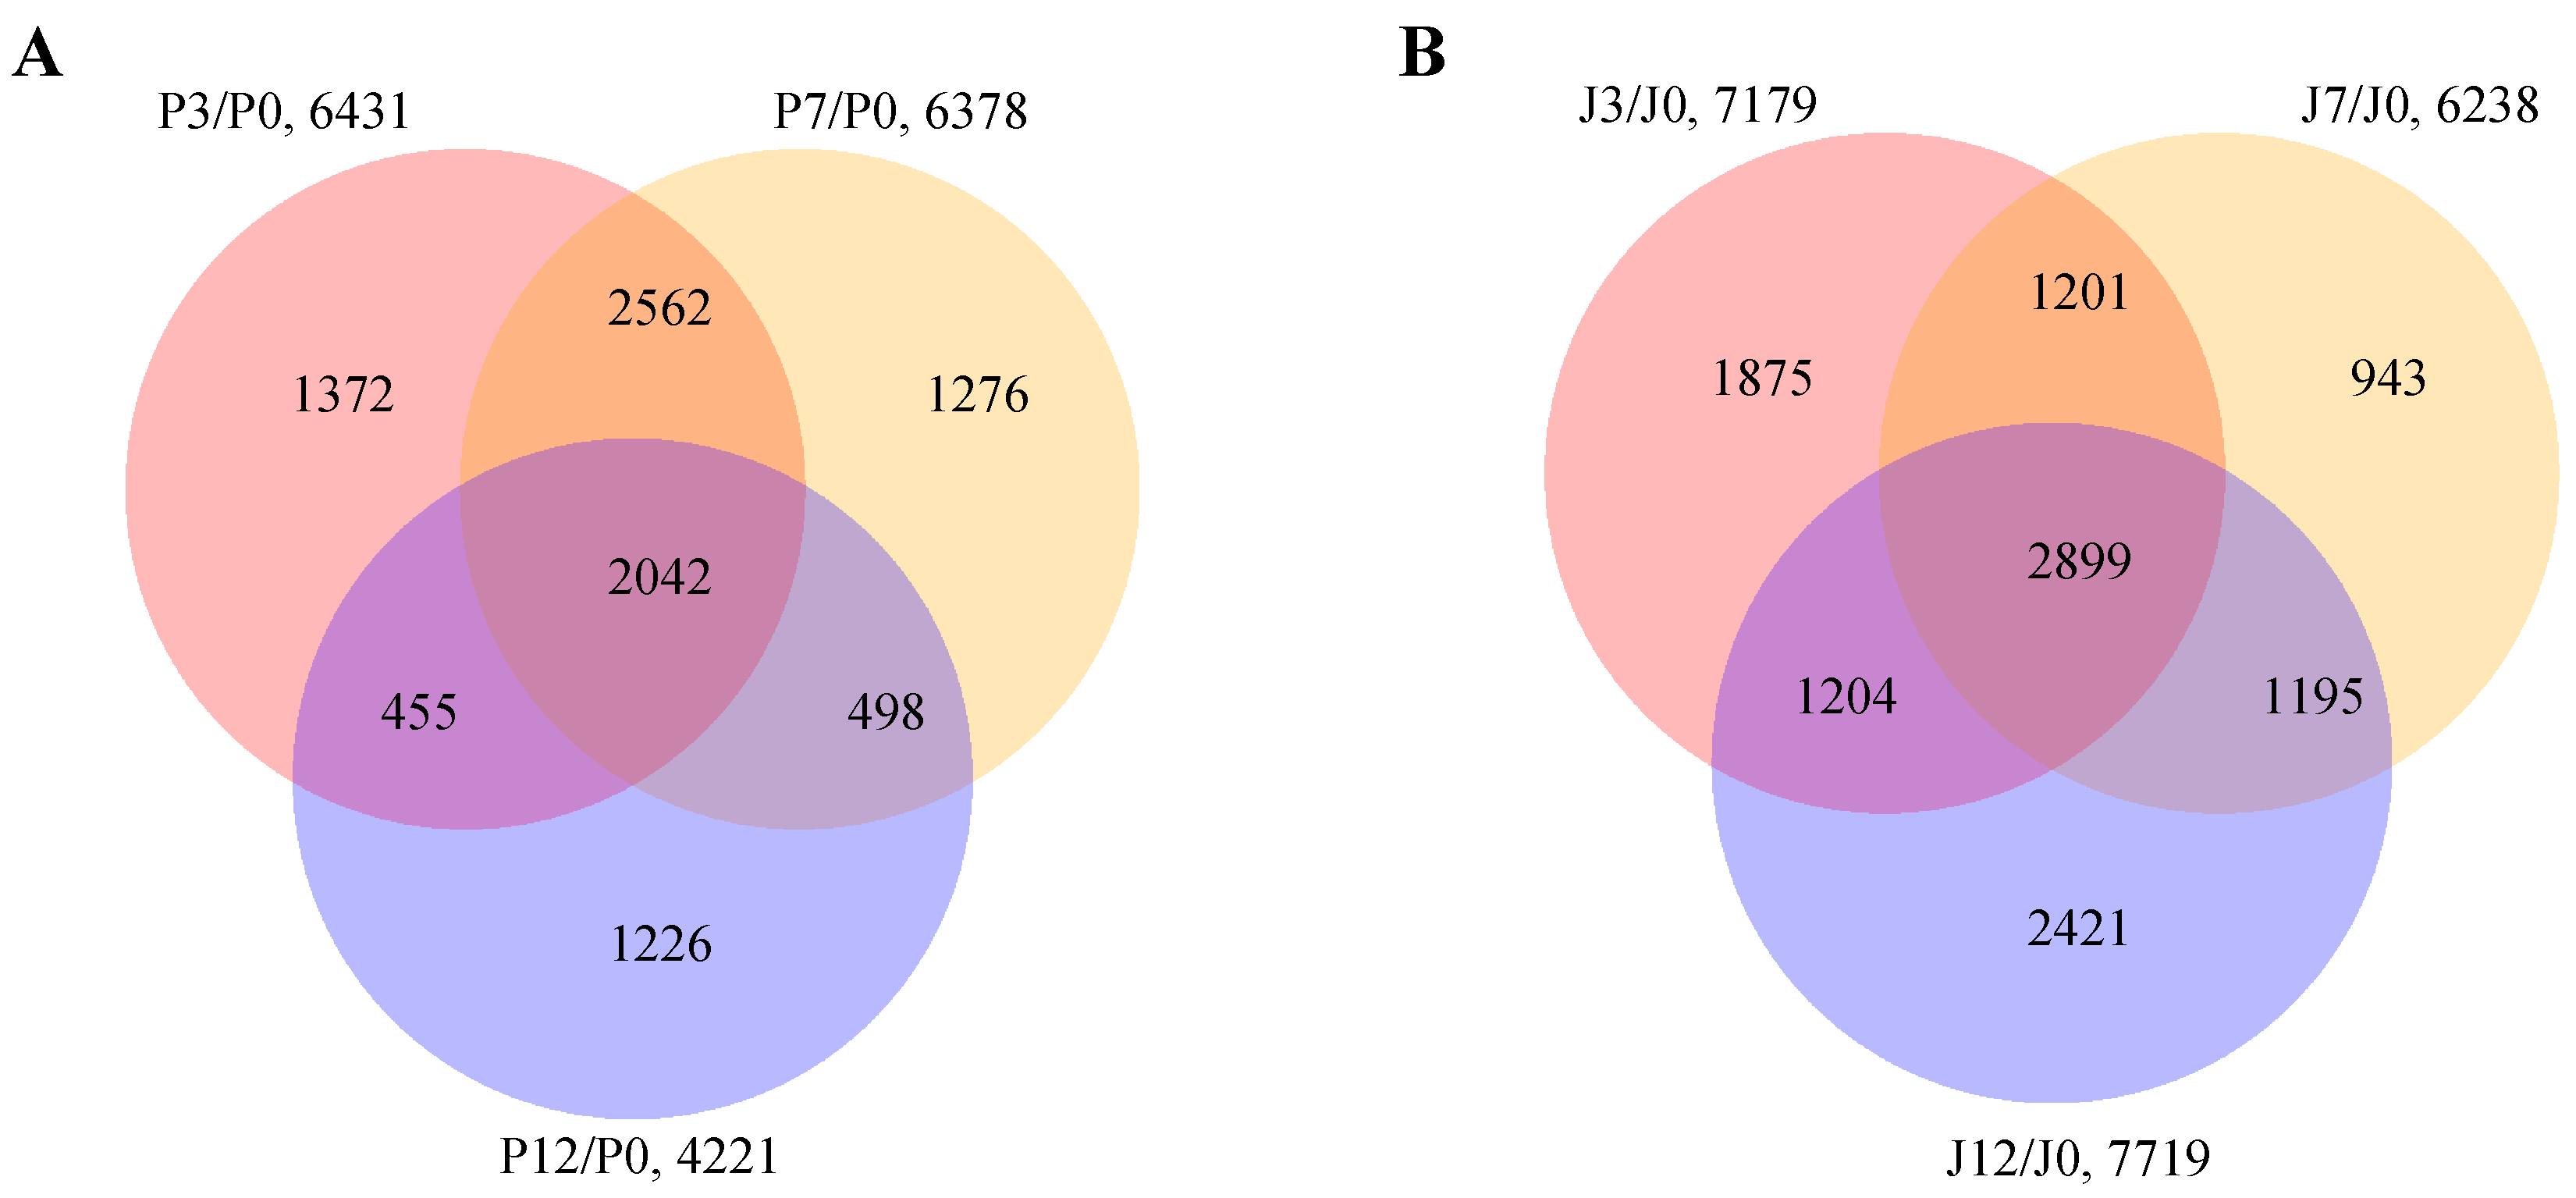
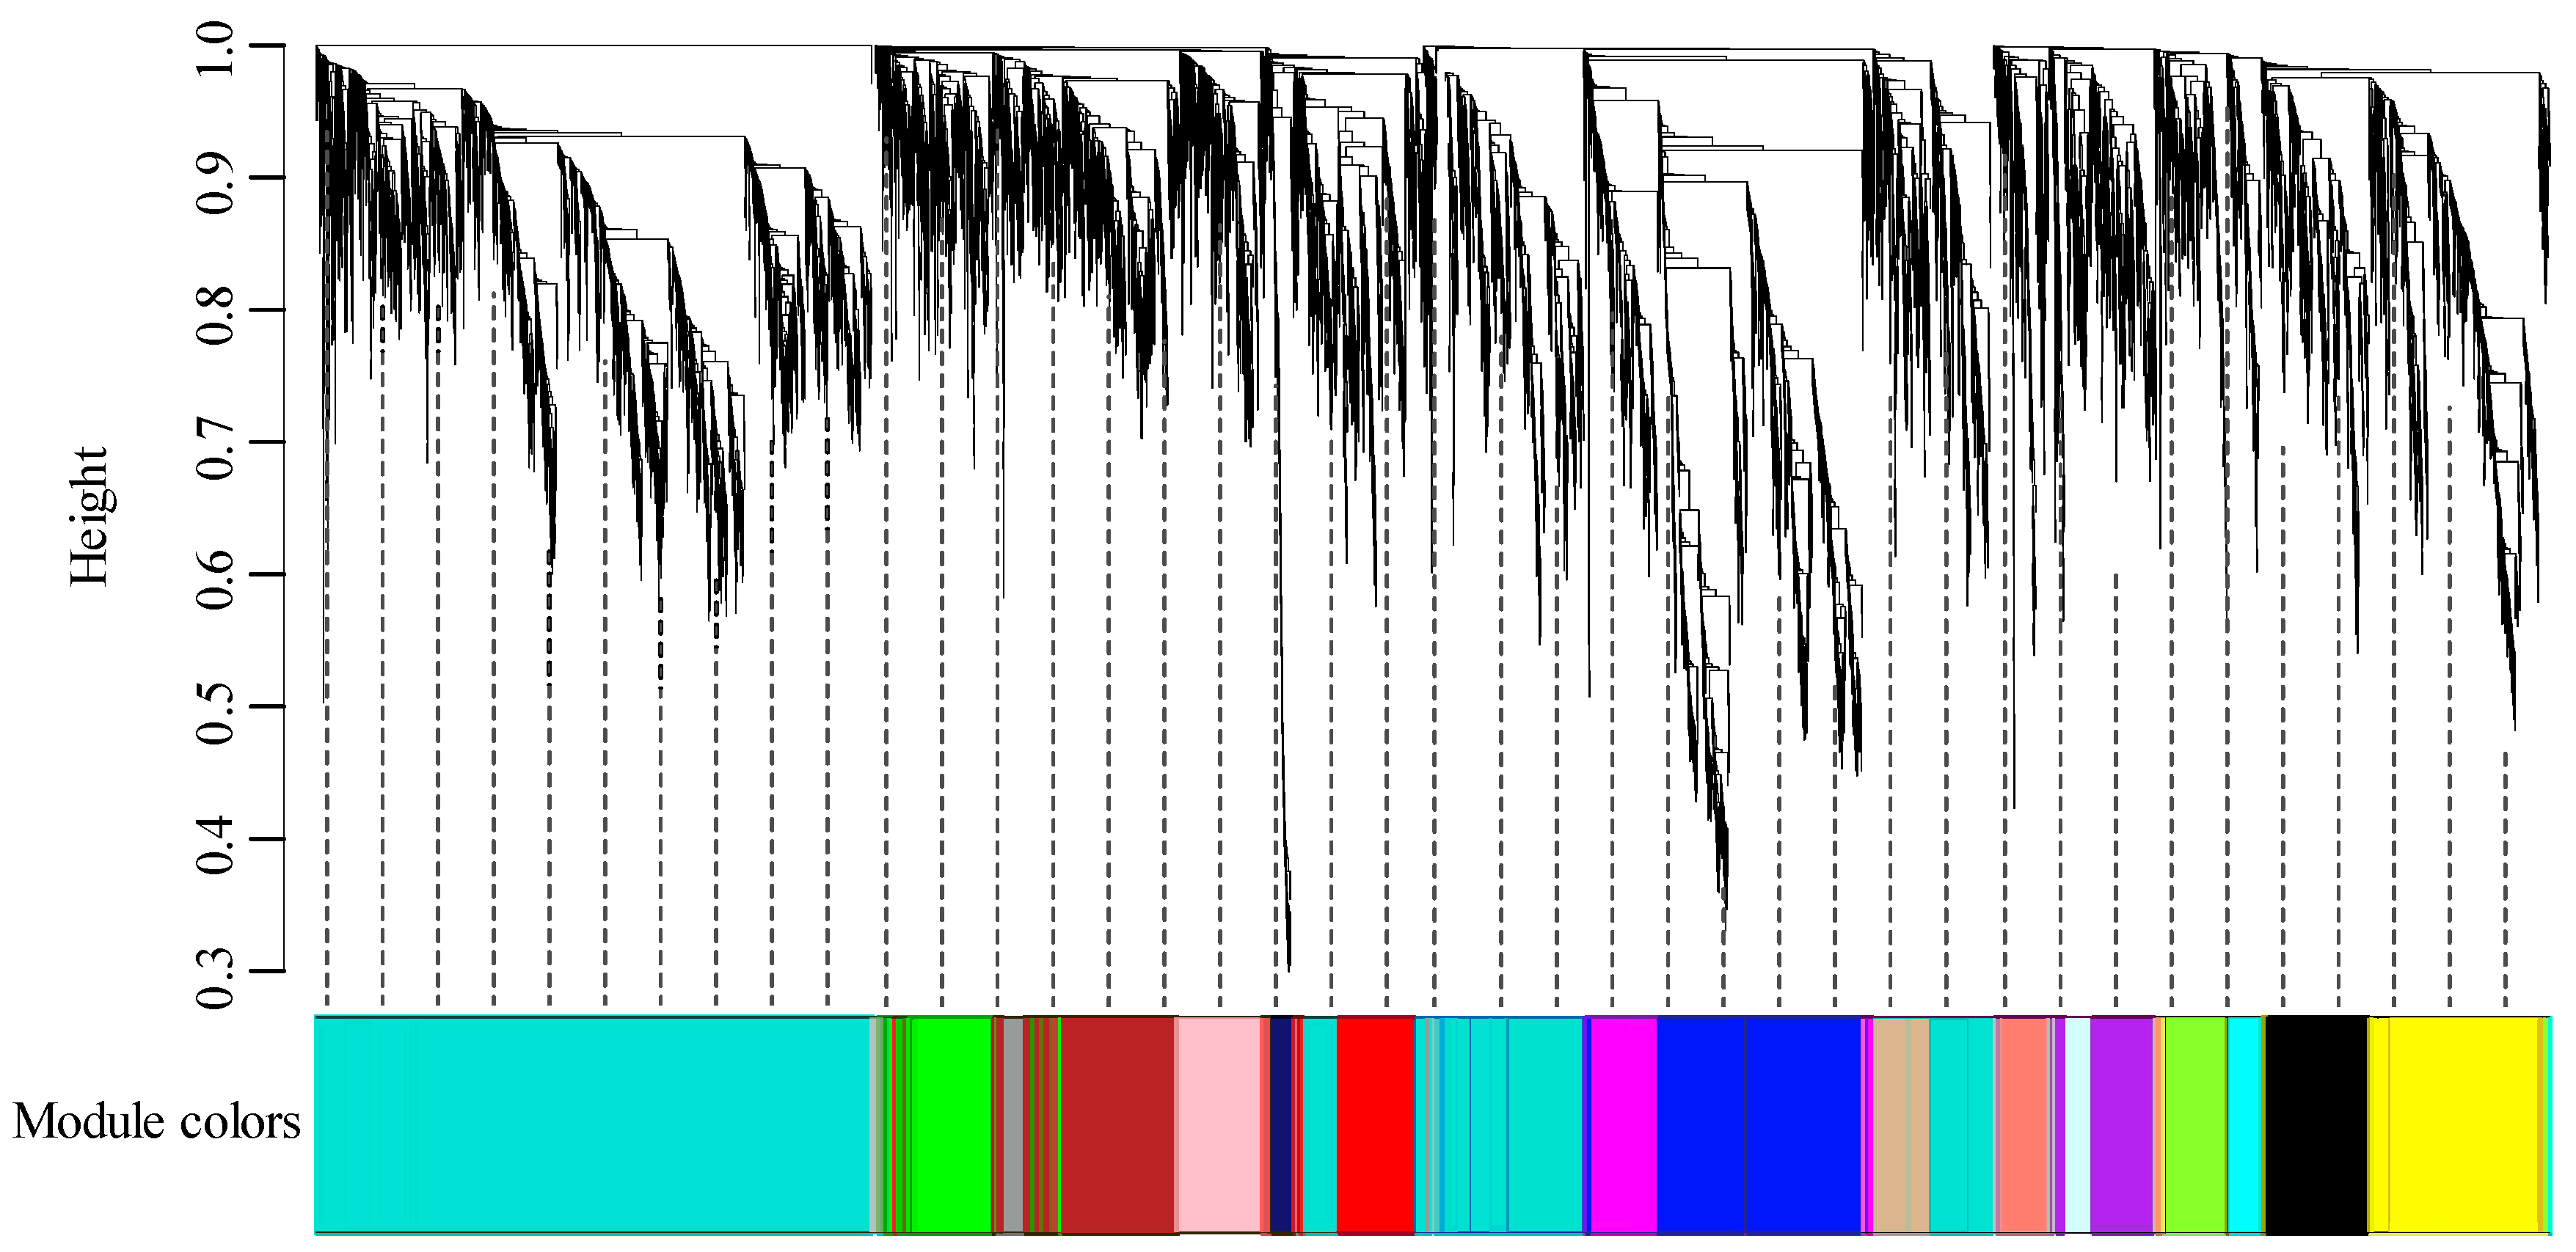
3.1. RNA Sequencing and Construction of Co-Expression Network

To dissect the possible genes that led to the variance in the budding survival rates among different pecan genotypes, a typical easy-to-survive cultivar (‘Pawnee’) and a representative difficult-to-survive cultivar (‘Jinhua’) were used for RNA sequencing (RNA-seq). Following sequencing, 1046.92 million (M) raw reads were generated, yielding a mean of 43.62 M reads per library. The Q20 and Q30 for each library were greater than 97% and 93%, respectively. After quality filtering, 1041.91 M clean reads were produced, with a mean of 43.41 M clean reads per sample. The obtained cleaned reads were aligned to the reference genome. For each sample, more than 92% of the clean reads could be mapped to the genome (Table S2). Differentially expressed genes were detected based on TPM values. The number of DEGs in P3/P0, P7/P0, P12/P0, J3/J0, J7/J0, and J12/J0 comparisons was 6431, 6378, 4221, 7179, 6238, and 7719, respectively (Figure 1A,B). A total of 13,158 genes were identified as differentially expressed in at least one time point sample and were used for WGCNA (Table S3).
A suitable soft threshold power (β) is the first step for building a co-expression network. Our results showed that as the β value increased, the scale-free topology fit index (R2) progressively increased, while the mean connectivity sharply decreased (Figure 2). When the β value was 12, the R2 was larger than 0.80 for the first time. Therefore, this β value satisfied the demand of the scale-free network and was selected to construct a co-expression network.
Hierarchical clustering suggested that the 13,158 DEGs could be grouped into 18 modules, including black (506 DEGs), blue (1072 DEGs), brown (888 DEGs), cyan (167 DEGs), green (572 DEGs), green-yellow (279 DEGs), grey (166 DEGs), grey60 (111 DEGs), light cyan (123 DEGs), magenta (364 DEGs), midnight blue (129 DEGs), pink (470 DEGs), purple (357 DEGs), red (517 DEGs), salmon (244 DEGs), tan (275 DEGs), turquoise (6051 DEGs), and yellow (867 DEGs) (Figure 3).

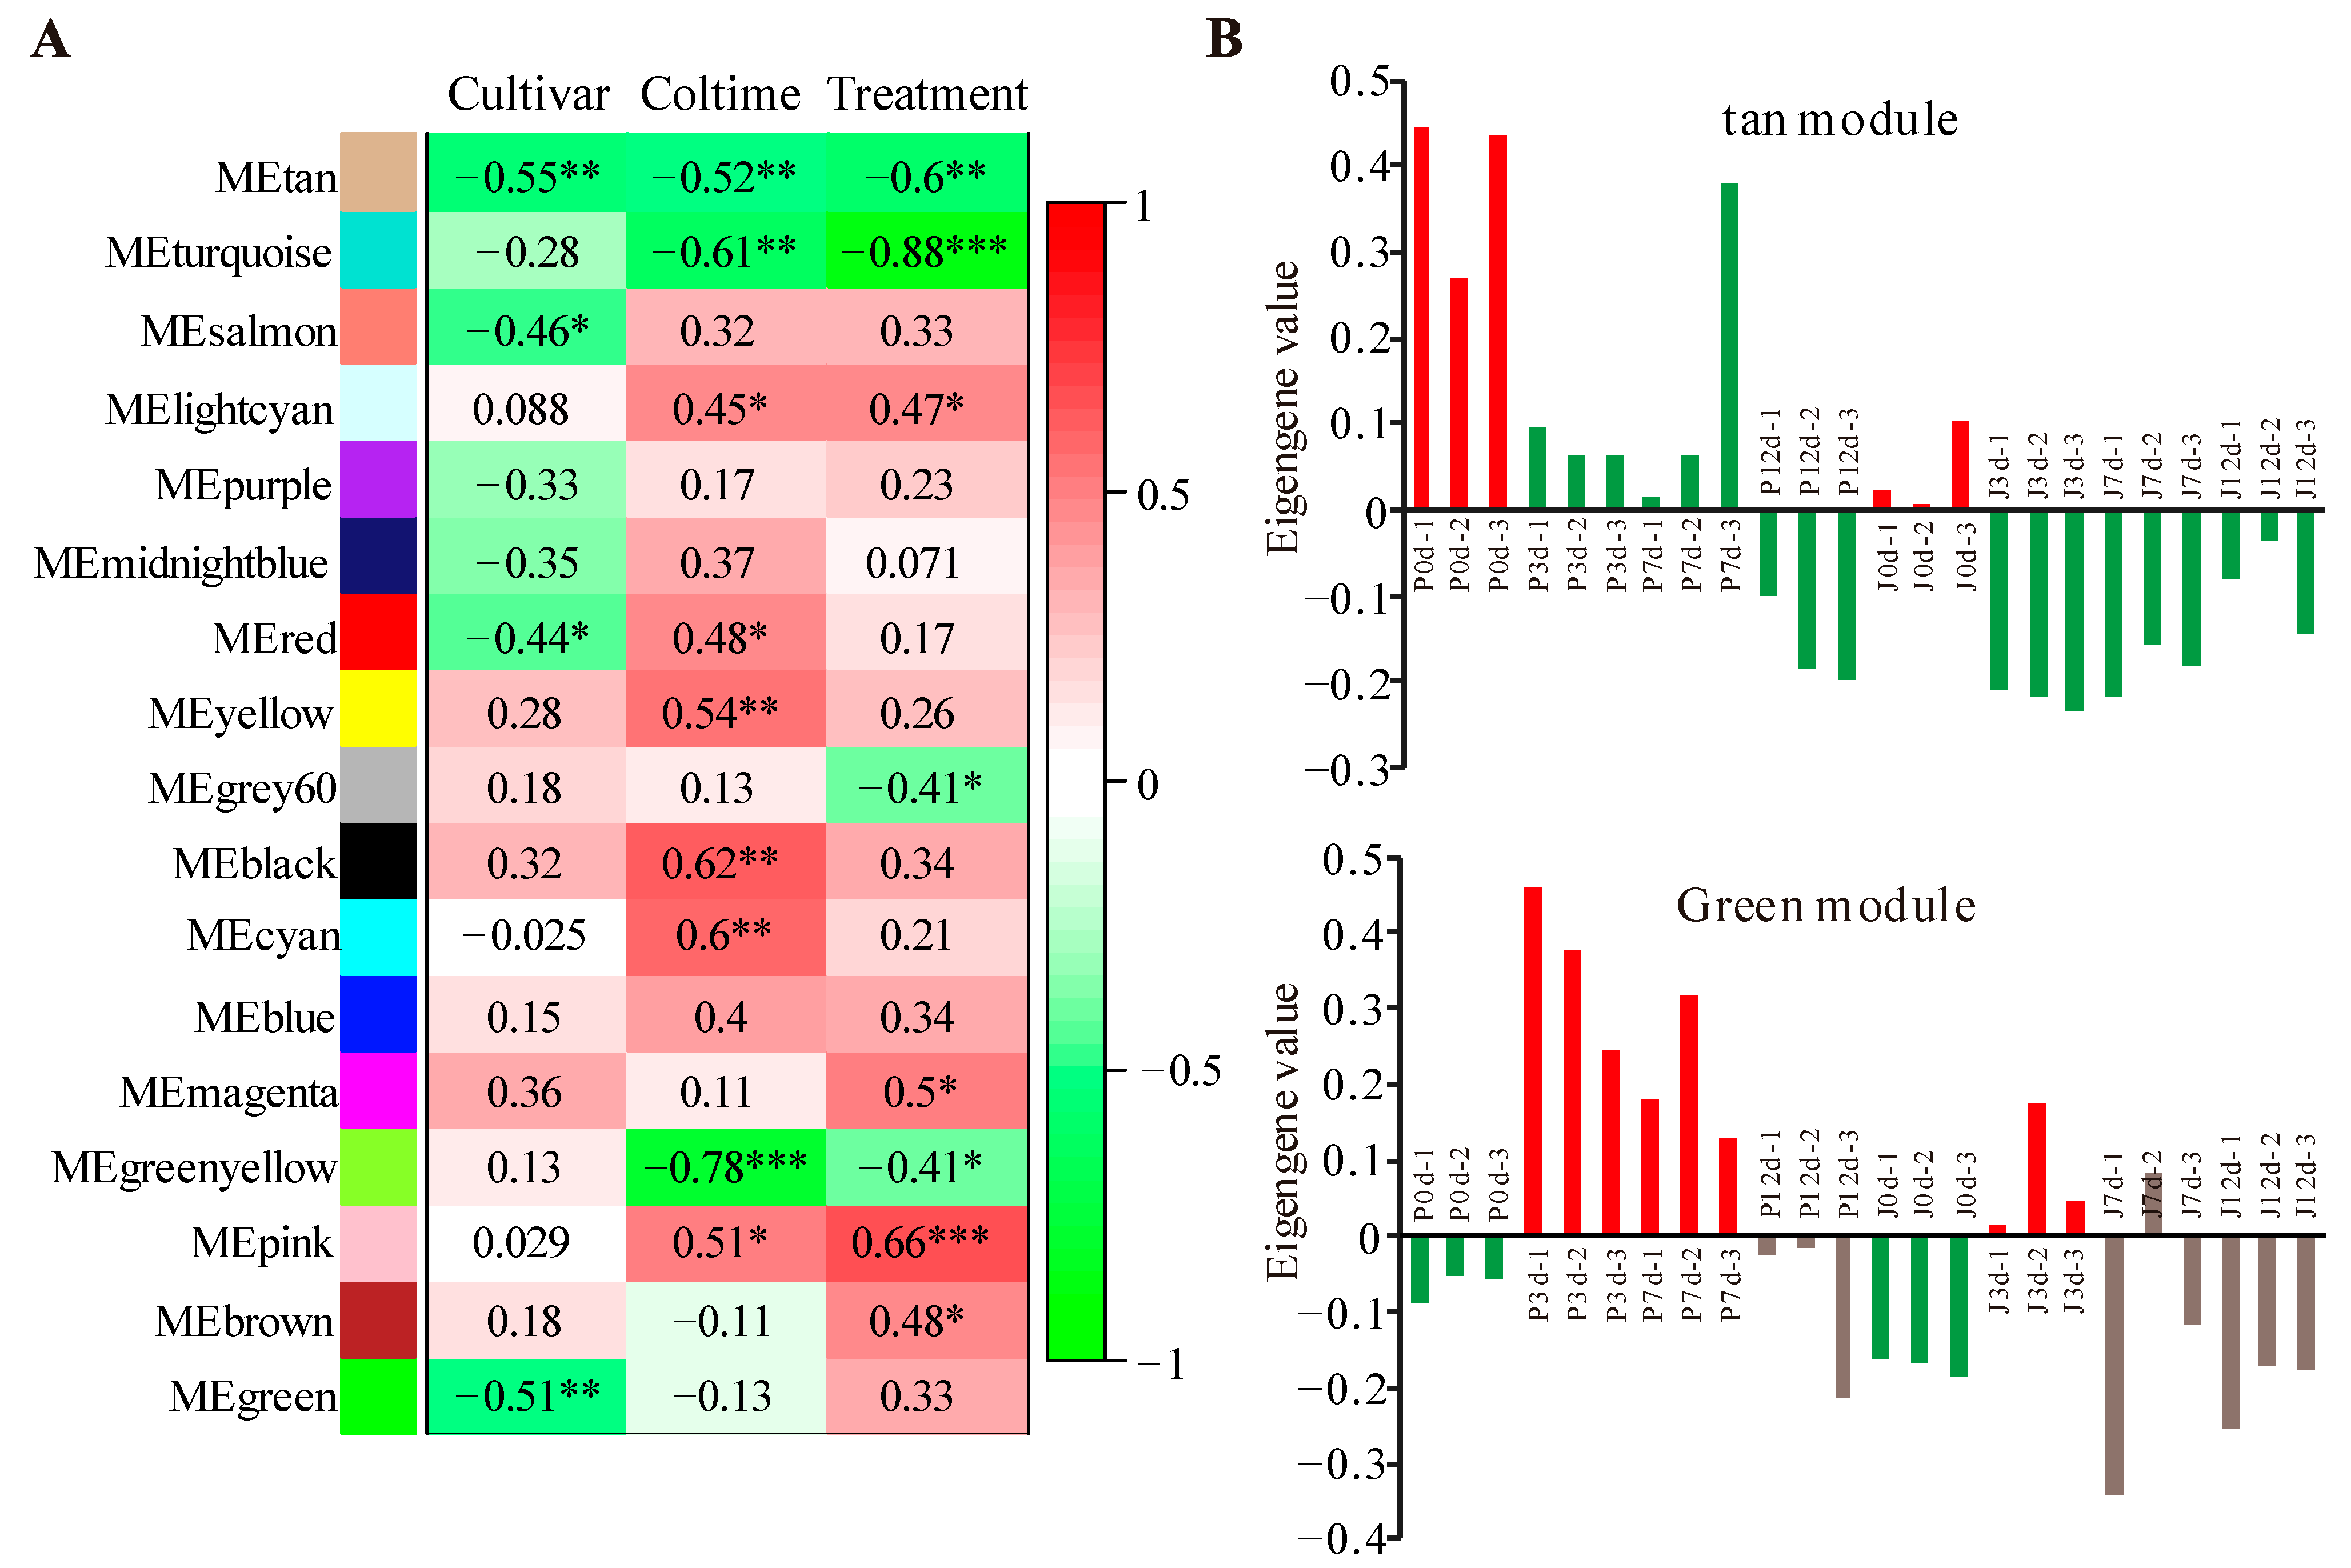
3.2. Modules Associated with Grafting Traits

The correlation coefficients between MEs and traits were computed to determine relevant modules. Based on the criteria (|cor| > 0.5 and p < 0.05), several specific modules with obvious associations for the grafting traits were identified (Figure 4A). The tan and green modules showed high correlations with different cultivars and were recognized to be biologically significant. The MEs in these two modules presented that the expressions of ‘Jinhua’ were generally lower than those of ‘Pawnee’ at the same time point (Figure 4B). The tan module was also significantly negatively correlated with varied collection times (coltime) and different treatments (un-grafted and grafted treatments), suggesting that genes in this module were downregulated gradually over time.

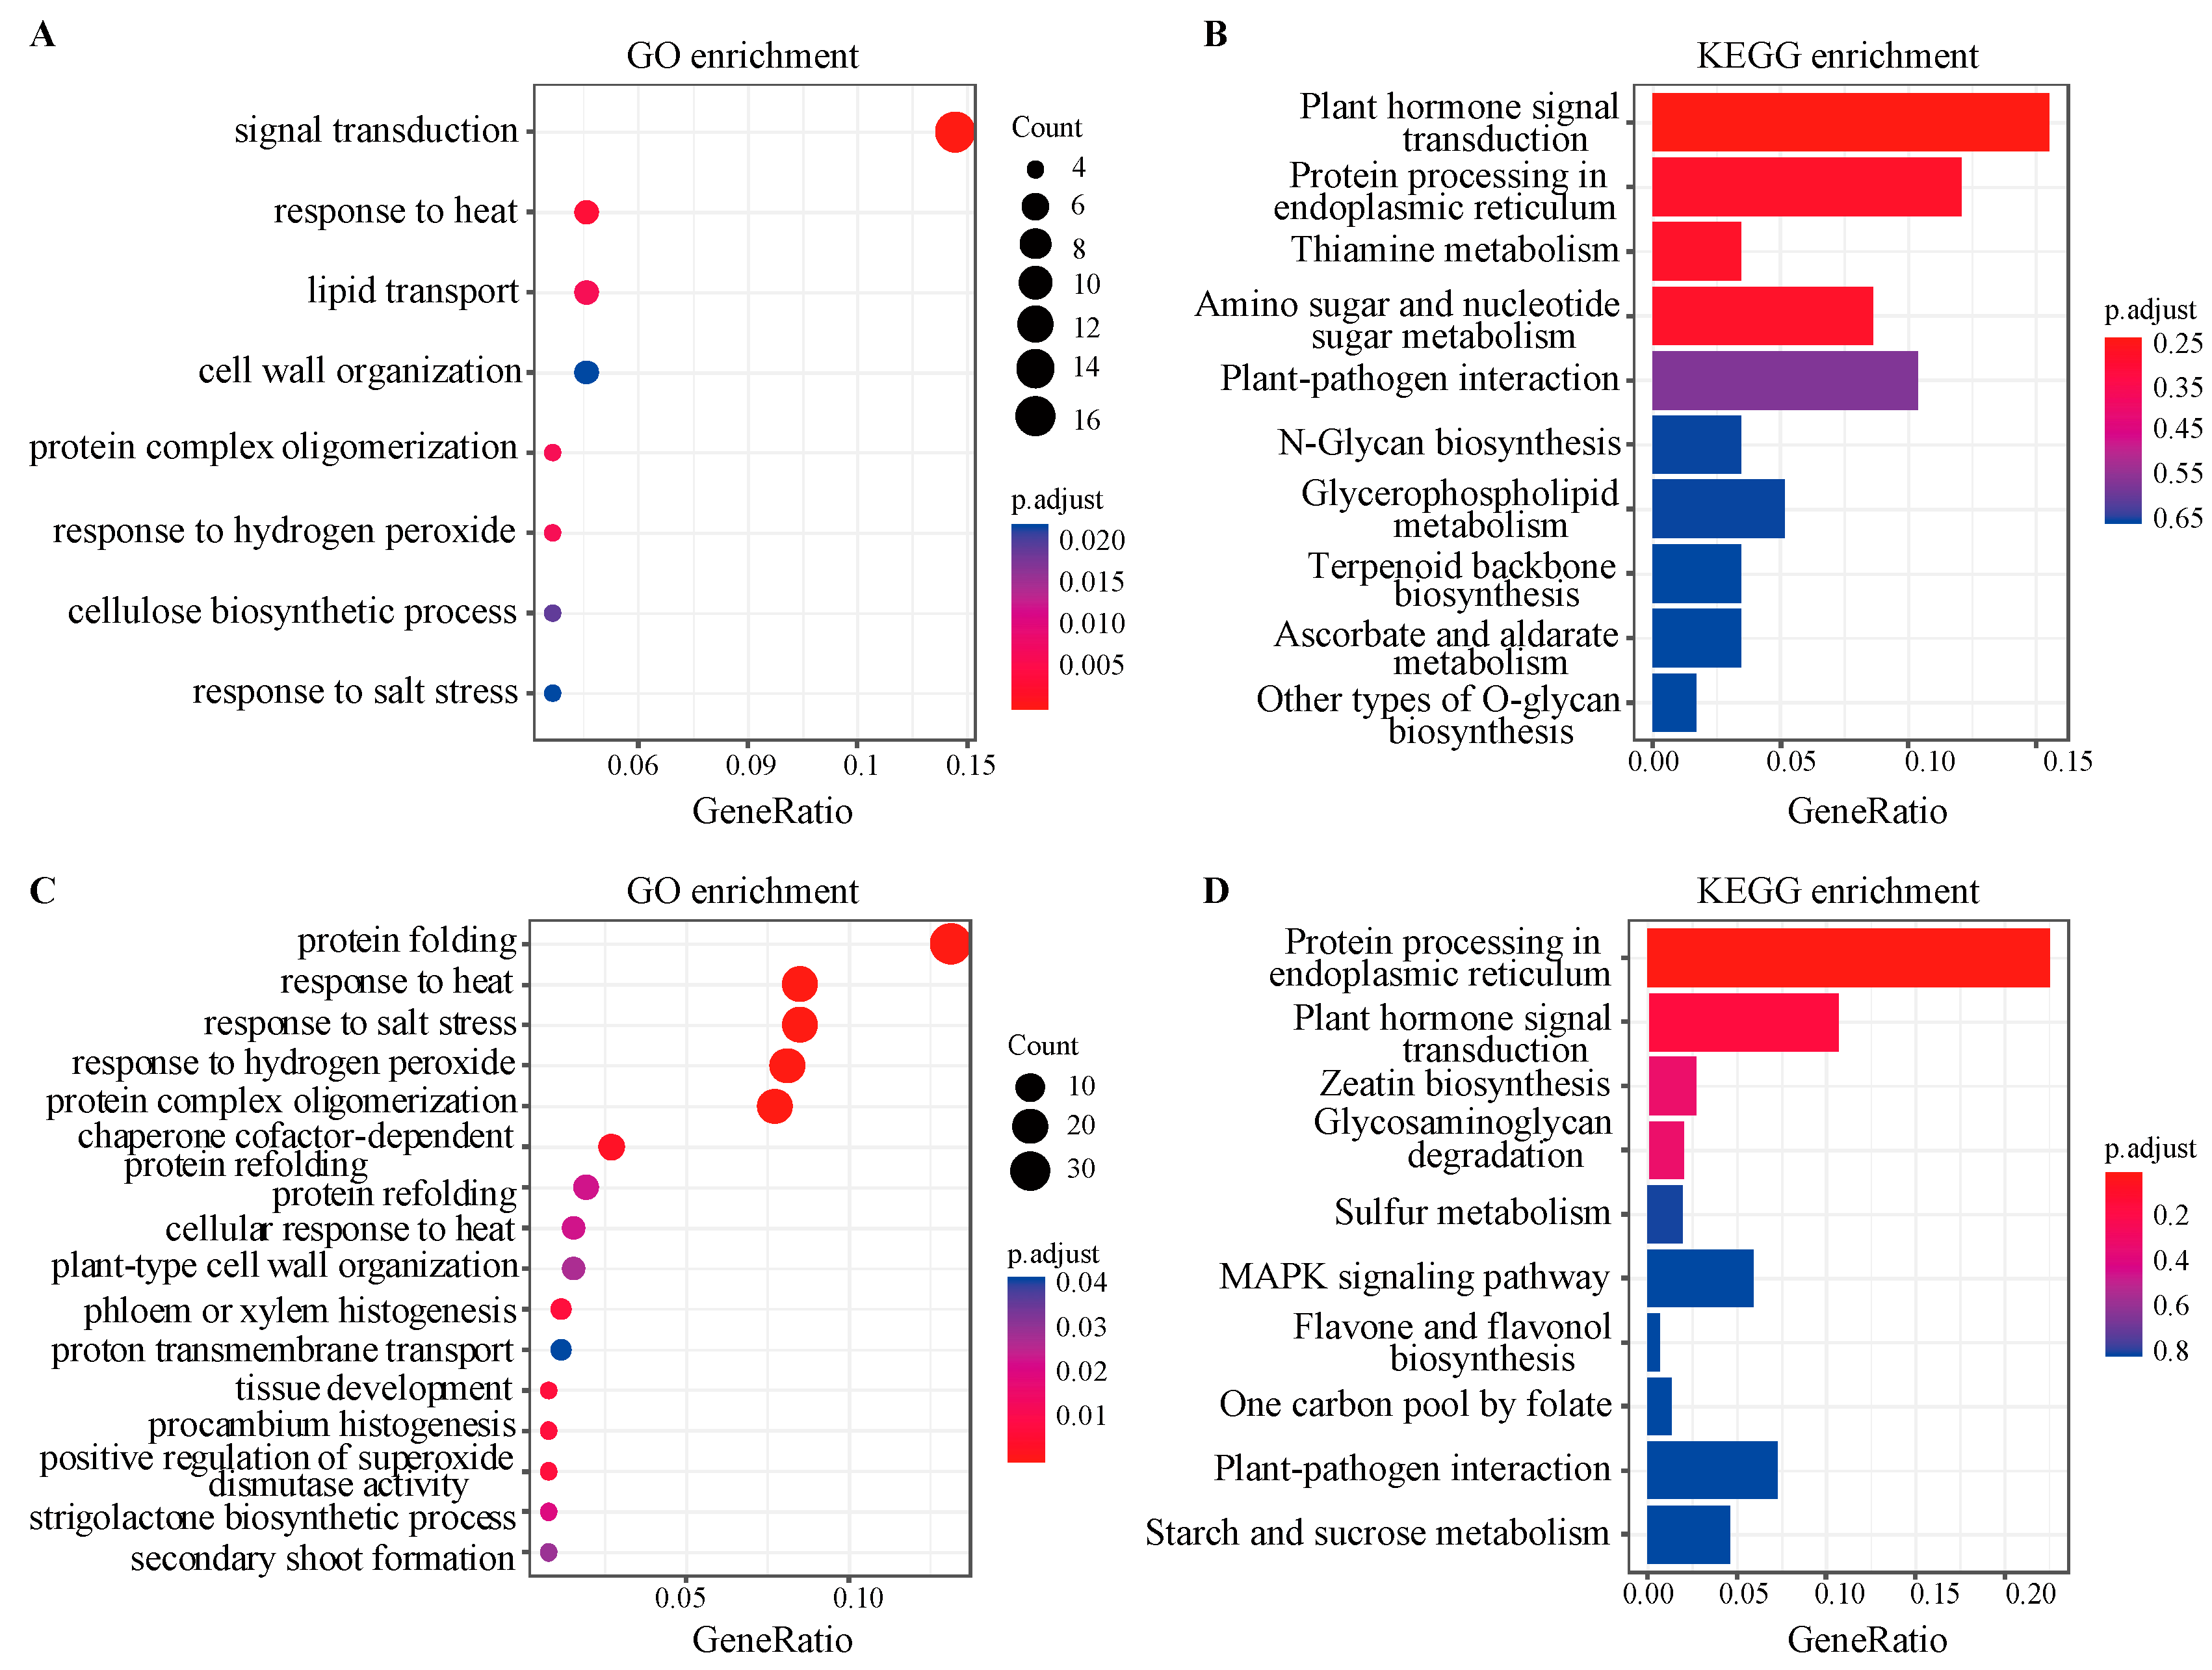
3.3. Functional Enrichment Analysis of Biologically Significant Module

With an aim to characterize the features of biologically significant modules, GO and KEGG enrichment analyses were conducted. GO analysis demonstrated that signal transduction, response to heat, lipid transport, protein complex oligomerization, and response to hydrogen peroxide were the obviously overrepresented biological processes in the tan module (Figure 5A). There were 10 enriched GO terms for the green module, including protein folding, response to hydrogen peroxide, protein complex oligomerization, response to heat, response to salt stress, chaperone cofactor-dependent protein refolding, phloem or xylem histogenesis, tissue development, procambium histogenesis, and positive regulation of superoxide dismutase activity (Figure 5C). KEGG analysis suggested that there was no significantly enriched pathway for the tan module after adjustment of the p-value (Figure 5B). The total number of genes assigned to plant hormone signal transduction was the highest among the identified pathways (Figure 5B). For the green module, protein processing in the endoplasmic reticulum was the only enriched pathway (Figure 5D). The number of genes associated with plant hormone signal transduction was the second largest among the detected pathways (Figure 5D). For both the modules, genes associated with plant hormone signal transduction included the following seven components: auxin (IAA), cytokinin (CK), gibberellin (GA), abscisic acid (ABA), salicylic acid (SA), jasmonic acid (JA), and brassinosteroid (BR) signaling.

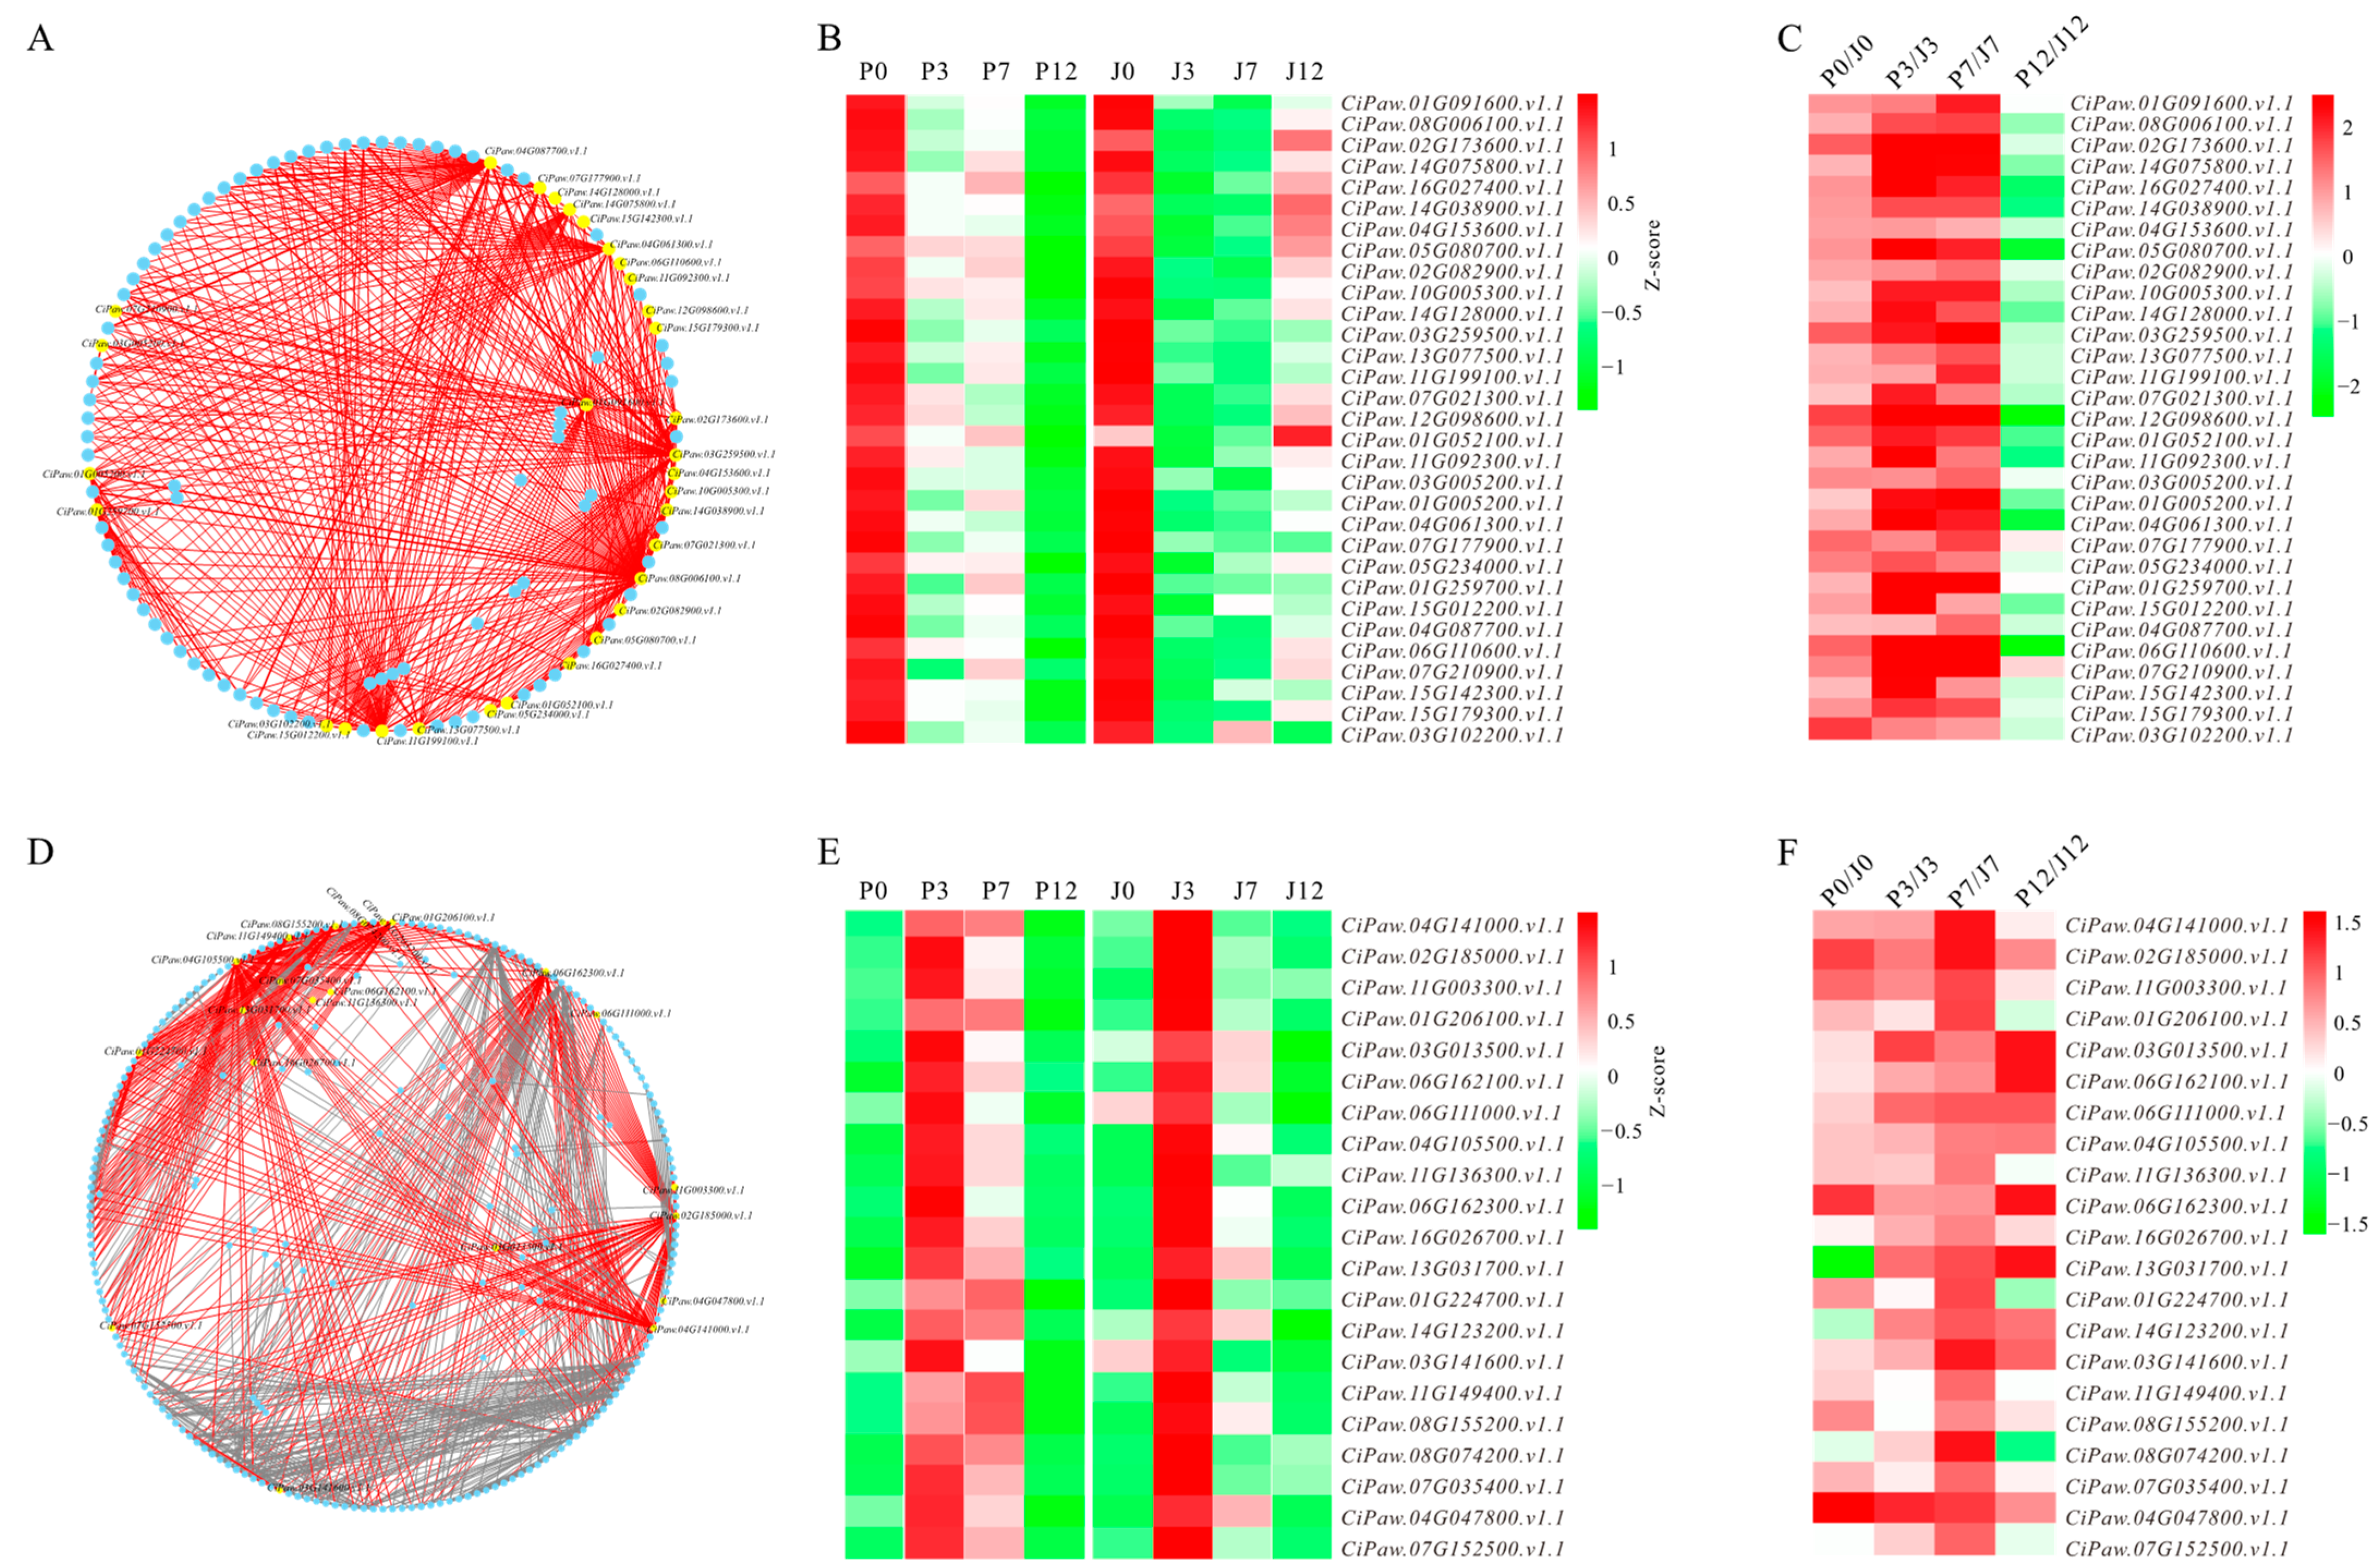
3.4. Identification of Hub Genes from Biologically Significant Modules

To identify the hub genes of the biologically significant modules, genes with an absolute kME > 0.9 were screened. A total of 31 hub genes were detected to represent the tan module (Figure 6A, Table S4). Of these genes, there were ten stress response genes, two signal transduction genes, two transport genes, two hemicellulose synthesis genes, two secondary metabolism genes, two lipid metabolism genes, one amino acid biosynthesis gene, one DNA binding gene, one sugar metabolism gene, one DNA cleavage gene, one translation gene, one energy metabolism gene, one protein degradation gene, one cellulose synthesis gene, one catalytic hydrolysis gene, and two function unknown genes (Table S4). As for the green module, 21 hub genes were identified. These included six protein synthesis, degradation, or modification genes, five stress response genes, three cell wall organization genes, two signal transduction genes, two transport genes, one transcription gene, one cellulose degradation gene, and one function unknown gene (Figure 6D, Table S4). Among the fifty-two hub genes, eight were identified as transcription factors (TFs; Table S4). There were six TFs in the tan module, including GATA transcription factor, mitogen-activated protein kinase, early-responsive to dehydration (ERD), heat stress transcription factor A-2e-like (HsfA2e), dehydration-responsive element-binding protein (DREB), and auxin-responsive protein SAUR76-like (Table S4). TFs in the green module were BTB/POZ domain-containing protein and auxin response factor (Table S4). Although the hub genes of the tan module showed similarly decreased expression profiles for both cultivars after grafting (Figure 6B), their expression levels were contrastingly different between cultivars, with ‘Jinhua’ being continuously lower than ‘Pawnee’ from 0 to 12 DAG (Figure 6C). The expressions of hub genes in the green module were obviously upregulated at 3 and 7 DAG for ‘Pawnee’, while they were only upregulated at 3 DAG for ‘Jinhua’ (Figure 6E). Meanwhile, the expression levels of these hub genes were lower in ‘Jinhua’ than in ‘Pawnee’ throughout the sampling period (Figure 6F).

3.5. Promoter Variants of Hub Genes

To identify whether the promoter sequences of the 52 hub genes differed between ‘Pawnee’ and ‘Jinhua’, whole genome re-sequencing was conducted in our study. In total, 372.53 M and 293.92 M reads with good sequencing quality (Q30 ≥ 93.70%) were generated from ‘Pawnee’ and ‘Jinhua’ re-sequencing libraries, respectively (Table S5). After quality control, the two libraries produced over 293.91 M clean reads (Table S5). The clean reads of ‘Pawnee’ and ‘Jinhua’ libraries separately covered 94.77% and 93.70% of the reference genome, with an average depth of 78.43× and 61.76× (Table S5). In total, 48 out of 52 hub genes displayed the presence of single-nucleotide polymorphisms (SNPs) and/or insertions/deletions (InDels) polymorphisms within the promoter regions between the two cultivars (Table S6). Interesting, the eight hub genes that were annotated as transcription factors all showed sequence polymorphisms between the two cultivars (Table S6).

4. Discussion

WGCNA has become a popular approach for investigating the key pathways and genes that might be functionally relevant to certain traits [26]. In pecan, the survival rates of patch budding varied with cultivars. To explore the key pathways and hub genes that potentially determined the differentiation of grafting success rates, we used a typical easy-to-survive cultivar and a classical difficult-to-survive cultivar for WGCNA. By using this approach, two co-expression networks (tan and green modules) exhibited significant association with the different cultivars and were considered to be biologically significant.
During grafting, the graft partners inevitably suffer from various oxidative stresses due to mechanical injury. Graft-induced oxidative stresses mainly include wounding, hypoxia, and pathogen attack [27,28,29]. Beside these, heat stress may also impose on the scion part, as pecan patch budding is generally conducted during growing seasons with high temperature, and a deficiency of energy supply further makes the scion sensitive to hot weather. In plants, stress would induce a strong antioxidant response to protect against the toxic effect of reactive oxygen species (ROS) [30]. It was reported that a timely and effective reduction in ROS levels was an important prerequisite for successful grafting [3,31]. In our study, response to heat (GO:0009408), response to hydrogen peroxide (GO:0042542), and positive regulation of superoxide dismutase activity (GO:1901671) were the obviously enriched categories in the tan and/or green modules (Figure 5), where expressions of ‘Jinhua’ were generally lower than those of ‘Pawnee’ (Figure 4b). These results suggested that the difficult-to-survive cultivar might have a low ability to cope with oxidative stress. Therefore, oxidative stress detoxification was likely to be a critical pathway for the successful grafting of pecan.
Hormones are essential for oxidative stress resistance and wound healing, the two indispensable elements of a successful grafting [32]. In plants, hormones including IAA, GA, CK, and BR modulate both cell development and stress adaptation [33]. As for grafting, those hormones may primarily regulate cell division, elongation, and differentiation, and therefore work as growth-promoting regulators [4,34,35]. ABA was likely to function mainly as a stress hormone, as its level was observed to be decreased during grafting [36]. SA is an indispensable defense hormone that induces immunity against microbial ingressions [37]. JA interacts with other hormones including IAA, CK, GA, BR, ABA, SA, and ethylene, acting as a core component in the hormone signal network [38,39]. In our research, considerable genes were assigned to the signal transduction of hormones (ko04075), including IAA, CK, GA, BR, ABA, and SA for the tan and green modules. The variance in transcriptional levels of hormone-signaling genes might confer different stress resistance and wound healing capacity between ‘Pawnee’ and ‘Jinhua’. This raised the possibility that hormone signaling was also a pivotal pathway for pecan grafting.
During the development of a graft union, callus and vascular bundles take pivotal roles in transporting nutrients and signals. GO categories such as regulation of cell cycle (GO:0051726), organelle organization (GO:0006997), microtubule-based process (GO:0007017), chromatin assembly (GO:0031497), and DNA replication (GO:0044786; GO:0090329; GO:0101017) are basic cellular processes needed for callus proliferation and tissue regeneration [40]. Interestingly, these GO terms were not overrepresented in either tan or green modules. It seemed that cell proliferation and vascular bundle development were not the key pathways leading to a low grafting survival rate of pecan.
The hub gene, as a representative of a module, is more critical than other genes, since its deficiency can interfere with the pathway function [41]. In total, we obtained 52 hub genes in the tan and green modules, suggesting their central roles in response to grafting. Among these hub genes, quite a number were associated with stress response for the two modules, further demonstrating the importance of oxidative stress response in successful pecan grafting. These hub genes showed variation in expression between species at specific time points. Gene expression differences within species result mainly from changes in cis-regulatory elements (i.e., promoters, insulators, and enhancers) and trans-acting factors (i.e., transcription factors, chromatin regulators, and environmental signals) [42,43,44]. Whole-genome re-sequencing suggested that cis-regulatory region variations (promoter polymorphisms) might be one of the pivotal factors leading to the mRNA differences between ‘Pawnee’ and ‘Jinhua’ for most of the hub genes (48 out of 52). These 48 hub genes with both promoter variants and expression differences between genotypes were probably the critical ones for grafting, since their expression divergences were likely due to their own sequences’ polymorphisms. Among the forty-eight hub genes, eight were annotated as TFs and thus might serve as dominant regulators in the networks, as TFs act as signaling hubs coordinating the expression of multiple downstream genes [45].
Several hub genes including ERD, HsfA2e, DREB, Calmodulin-like protein (CML), and pathogenesis-related protein 1 (PR-1) have been well documented to be positive regulators of stress response [46,47,48,49,50]. In our study, the low expressions of ERD, HsfA2e, DREB, CML, PR-1, and ARF in the difficult-to-survive cultivar (‘Jinhua’) might confer a weak stress resistance and therefore result in low survival rate during grafting.

5. Conclusions

In the present study, WGCNA was performed according to the transcriptome data of two cultivars’ (‘Pawnee’ and ‘Jinhua’) exposure to budding. Our study implied that the two pathways (oxidative detoxification and hormone signaling) and the 48 hub genes were pivotal for the successful grafting of pecan. These results suggest that inducing proper hormone signaling and reducing stress imposed on the graft union through manipulating hub genes would contribute to the improvement of pecan grafting success rate.

Supplementary Materials

The following supporting information can be downloaded at: https://www.mdpi.com/article/10.3390/f14040835/s1, Table S1: The used WGCNA commands; Table S2: Summary for the RNA-seq; Table S3: Genes with expression variation; Table S4: Hub genes in tan and green modules; Table S5: Summary for genome re-sequencing; Table S6: Hub genes with promoter polymorphisms.

Author Contributions

Conceptualization, M.Z. and J.X.; methodology, Z.M.; formal analysis, Z.M.; investigation, L.H.; resources, X.J.; data curation, X.J. and Y.Z.; writing—original draft preparation, Z.M.; writing—review and editing, Z.M., M.Z. and J.X.; funding acquisition, Z.M. and J.X. All authors have read and agreed to the published version of the manuscript.

Funding

This research was funded by National Natural Science Foundation of China (31901347), Key Research and Development Plan of Jiangxi Province (20223BBF61014), and the Central Government Demonstration Project of Forestry Science and Technology (su [2022]TG11).

Data Availability Statement

Data are contained within the article or Supplementary Materials.

Conflicts of Interest

The authors declare no conflict of interest.

References

  1. Melnyk, C.W. Plant grafting: Insights into tissue regeneration. Regeneration 2017, 4, 3–14. [Google Scholar] [CrossRef] [PubMed]
  2. Loupit, G.; Cookson, S.J. Identifying molecular markers of successful graft union formation and compatibility. Front. Plant Sci. 2020, 11, 610352. [Google Scholar] [CrossRef] [PubMed]
  3. Irisarri, P.; Binczycki, P.; Errea, P.; Martens, H.J.; Pina, A. Oxidative stress associated with rootstock–scion interactions in pear/quince combinations during early stages of graft development. J. Plant Physiol. 2015, 176, 25–35. [Google Scholar] [CrossRef] [PubMed]
  4. Liu, Y.; Liu, H.; Zhang, T.; Liu, J.; Sun, X.; Sun, X.; Wang, W.; Zheng, C. Interactions between rootstock and scion during grafting and their molecular regulation mechanism. Sci. Hortic. 2023, 308, 111554. [Google Scholar] [CrossRef]
  5. Mo, Z.; Feng, G.; Su, W.; Liu, Z.; Peng, F. Transcriptomic analysis provides insights into grafting union development in pecan (Carya illinoinensis). Genes 2018, 9, 71. [Google Scholar] [CrossRef]
  6. Yuan, H.; Zhao, L.; Qiu, L.; Xu, D.; Tong, Y.; Guo, W.; Yang, X.; Shen, C.; Yan, D.; Zheng, B. Transcriptome and hormonal analysis of grafting process by investigating the homeostasis of a series of metabolic pathways in Torreya grandis cv. Merrillii. Ind. Crop. Prod. 2017, 108, 814–823. [Google Scholar] [CrossRef]
  7. Assunção, M.; Santos, C.; Brazão, J.; Eiras-Dias, J.; Fevereiro, P. Understanding the molecular mechanisms underlying graft success in grapevine. BMC Plant Biol. 2019, 19, 396. [Google Scholar] [CrossRef]
  8. Liang, C.; Sayed Haidar Abbas, R.; Yu, S.; Zuhair, M.M.; Abdullah, F.S.; Fayez, M.S.; Muna, O.A.; Bandar, H.A.; Ahmed Mohajja, A.; Schreurs, N.M.; et al. Bioinformatics role of the WGCNA analysis and co-expression network identifies of prognostic marker in lung cancer. Saudi J. Biol. Sci. 2022, 29, 3519–3527. [Google Scholar]
  9. Wu, J.; Zhao, X.; Lin, Z.; Shao, Z. A system level analysis of gastric cancer across tumor stages with RNA-seq data. Mol. Biosyst. 2015, 11, 1925–1932. [Google Scholar] [CrossRef]
  10. Friedman, N.; Linial, M.; Nachman, I.; Pe’er, D. Using Bayesian networks to analyze expression data. J. Comput. Biol. 2000, 7, 601–620. [Google Scholar] [CrossRef]
  11. Segal, E.; Shapira, M.; Regev, A.; Pe’er, D.; Botstein, D.; Koller, D.; Friedman, N. Module networks: Identifying regulatory modules and their condition-specific regulators from gene expression data. Nat. Genet. 2003, 34, 166–176. [Google Scholar] [CrossRef]
  12. Langfelder, P.; Horvath, S. WGCNA: An R package for weighted correlation network analysis. BMC Bioinform. 2008, 9, 559. [Google Scholar] [CrossRef] [PubMed]
  13. Pu, L.; Wang, M.; Li, K.; Feng, T.; Zheng, P.; Li, S.; Yao, Y.; Jin, L. Identification micro-RNAs functional modules and genes of ischemic stroke based on weighted gene co-expression network analysis (WGCNA). Genomics 2020, 112, 2748–2754. [Google Scholar] [CrossRef] [PubMed]
  14. Ai, D.; Wang, Y.; Li, X.; Pan, H. Colorectal cancer prediction based on weighted gene co-expression network analysis and variational auto-encoder. Biomolecules 2020, 10, 1207. [Google Scholar] [CrossRef] [PubMed]
  15. Yang, H.; Wang, Y.; Zhang, Z.; Li, H. Identification of KIF18B as a hub candidate gene in the metastasis of clear cell renal cell carcinoma by weighted gene co-expression network analysis. Front. Genet. 2020, 11, 905. [Google Scholar] [CrossRef]
  16. Yao, Q.; Song, Z.; Wang, B.; Qin, Q.; Zhang, J. Identifying key genes and functionally enriched pathways in Sjögren’s syndrome by weighted gene co-expression network analysis. Front. Genet. 2019, 10, 1142. [Google Scholar] [CrossRef]
  17. Li, Z.X.; Zhang, W.L.; Jue, D.W.; Liu, X.; Jiang, Y.S.; Tang, J.M. Transcriptome changes induced by Botrytis cinerea stress and weighted gene co-expression network analysis (WGCNA) in Actinidia chinensis. Plant Mol. Biol. Rep. 2022, 40, 389–401. [Google Scholar] [CrossRef]
  18. Wang, Y.; Wang, Y.; Liu, X.; Zhou, J.; Deng, H.; Zhang, G.; Xiao, Y.; Tang, W. WGCNA analysis identifies the hub genes related to heat stress in seedling of rice (Oryza sativa L.). Genes 2022, 13, 1020. [Google Scholar] [CrossRef]
  19. Xie, L.; Dong, C.; Shang, Q. Gene co-expression network analysis reveals pathways associated with graft healing by asymmetric profiling in tomato. BMC Plant Biol. 2019, 19, 373. [Google Scholar] [CrossRef]
  20. Fan, Y.; Zheng, Y.; Teixeira da Silva, J.A.; Yu, X. Comparative transcriptomics and WGCNA reveal candidate genes involved in petaloid stamens in Paeonia lactiflora. J. Hortic. Sci. Biotech. 2021, 96, 588–603. [Google Scholar] [CrossRef]
  21. Mo, Z.; Chen, Y.; Lou, W.; Jia, X.; Zhai, M.; Xuan, J.; Guo, Z.; Li, Y. Identification of suitable reference genes for normalization of real-time quantitative PCR data in pecan (Carya illinoinensis). Trees 2020, 34, 1233–1241. [Google Scholar] [CrossRef]
  22. Bentley, N.; Grauke, L.; Ruhlman, E.; Klein, R.R.; Kubenka, K.; Wang, X.; Klein, P. Linkage mapping and QTL analysis of pecan (Carya illinoinensis) full-siblings using genotyping-by-sequencing. Tree Genet. Genomes 2020, 16, 83. [Google Scholar] [CrossRef]
  23. Zhang, R.; Peng, F.; Li, Y. Pecan production in China. Sci. Hortic. 2015, 197, 719–727. [Google Scholar] [CrossRef]
  24. Lovell, J.T.; Bentley, N.B.; Bhattarai, G.; Jenkins, J.W.; Sreedasyam, A.; Alarcon, Y.; Bock, C.; Boston, L.B.; Carlson, J.; Cervantes, K. Four chromosome scale genomes and a pan-genome annotation to accelerate pecan tree breeding. Nat. Commun. 2021, 12, 4125. [Google Scholar] [CrossRef] [PubMed]
  25. Ma, L.; Zhang, M.; Chen, J.; Qing, C.; He, S.; Zou, C.; Yuan, G.; Yang, C.; Peng, H.; Pan, G. GWAS and WGCNA uncover hub genes controlling salt tolerance in maize (Zea mays L.) seedlings. Theor. Appl. Genet. 2021, 134, 3305–3318. [Google Scholar] [CrossRef]
  26. Ko, D.K.; Brandizzi, F. Network-based approaches for understanding gene regulation and function in plants. Plant J. 2020, 104, 302–317. [Google Scholar] [CrossRef]
  27. Muneer, S.; Ko, C.H.; Soundararajan, P.; Manivnnan, A.; Park, Y.G.; Jeong, B.R. Proteomic study related to vascular connections in watermelon scions grafted onto bottle-gourd rootstock under different light intensities. PLoS ONE 2015, 10, e0120899. [Google Scholar] [CrossRef]
  28. Mo, Z.; He, H.; Su, W.; Peng, F. Analysis of differentially accumulated proteins associated with graft union formation in pecan (Carya illinoensis). Sci. Hortic. 2017, 224, 126–134. [Google Scholar] [CrossRef]
  29. Rezaee, R.; Vahdati, K.; Grigoorian, V.; Valizadeh, M. Walnut grafting success and bleeding rate as affected by different grafting methods and seedling vigour. J. Hortic. Sci. Biotech. 2008, 83, 94–99. [Google Scholar] [CrossRef]
  30. Ahmad, P.; Sarwat, M.; Sharma, S. Reactive oxygen species, antioxidants and signaling in plants. J. Plant Biol. 2008, 51, 167–173. [Google Scholar] [CrossRef]
  31. Aloni, B.; Karni, L.; Deventurero, G.; Levin, Z.; Cohen, R.; Katzir, N.; Lotan-Pompan, M.; Edelstein, M.; Aktas, H.; Turhan, E. Physiological and biochemical changes at the rootstock-scion interface in graft combinations between Cucurbita rootstocks and a melon scion. J. Hortic. Sci. Biotech. 2008, 83, 777–783. [Google Scholar] [CrossRef]
  32. Cookson, S.J.; Clemente Moreno, M.J.; Hevin, C.; Nyamba Mendome, L.Z.; Delrot, S.; Trossat-Magnin, C.; Ollat, N. Graft union formation in grapevine induces transcriptional changes related to cell wall modification, wounding, hormone signalling, and secondary metabolism. J. Exp. Bot. 2013, 64, 2997–3008. [Google Scholar] [CrossRef] [PubMed]
  33. Planas-Riverola, A.; Gupta, A.; Betegón-Putze, I.; Bosch, N.; Ibañes, M.; Caño-Delgado, A.I. Brassinosteroid signaling in plant development and adaptation to stress. Development 2019, 146, dev151894. [Google Scholar] [CrossRef]
  34. Jin, M.; Liu, Y.; Shi, B.; Yuan, H. Exogenous IAA improves the seedling growth of Syringa villosa via regulating the endogenous hormones and enhancing the photosynthesis. Sci. Hortic. 2023, 308, 111585. [Google Scholar] [CrossRef]
  35. Sharma, A.; Zheng, B. Molecular responses during plant grafting and its regulation by auxins, cytokinins, and gibberellins. Biomolecules 2019, 9, 397. [Google Scholar] [CrossRef]
  36. Xu, C.; Zhang, Y.; Zhao, M.; Liu, Y.; Xu, X.; Li, T. Transcriptomic analysis of melon/squash graft junction reveals molecular mechanisms potentially underlying the graft union development. PeerJ 2021, 9, e12569. [Google Scholar] [CrossRef]
  37. Peng, Y.; Yang, J.; Li, X.; Zhang, Y. Salicylic acid: Biosynthesis and signaling. Annu. Rev. Plant Biol. 2021, 72, 761–791. [Google Scholar] [CrossRef]
  38. Yang, J.; Duan, G.; Li, C.; Liu, L.; Han, G.; Zhang, Y.; Wang, C. The crosstalks between jasmonic acid and other plant hormone signaling highlight the involvement of jasmonic acid as a core component in plant response to biotic and abiotic stresses. Front. Plant Sci. 2019, 10, 1349. [Google Scholar] [CrossRef]
  39. Jang, G.; Yoon, Y.; Choi, Y.D. Crosstalk with jasmonic acid integrates multiple responses in plant development. Int. J. Mol. Sci. 2020, 21, 305. [Google Scholar] [CrossRef]
  40. Ikeuchi, M.; Iwase, A.; Rymen, B.; Lambolez, A.; Kojima, M.; Takebayashi, Y.; Heyman, J.; Watanabe, S.; Seo, M.; De Veylder, L. Wounding triggers callus formation via dynamic hormonal and transcriptional changes. Plant Physiol. 2017, 175, 1158–1174. [Google Scholar] [CrossRef]
  41. Chang, H.C.; Chu, C.P.; Lin, S.J.; Hsiao, C.K. Network hub-node prioritization of gene regulation with intra-network association. BMC Bioinform. 2020, 21, 101. [Google Scholar] [CrossRef]
  42. Goncalves, A.; Leigh-Brown, S.; Thybert, D.; Stefflova, K.; Turro, E.; Flicek, P.; Brazma, A.; Odom, D.T.; Marioni, J.C. Extensive compensatory cis-trans regulation in the evolution of mouse gene expression. Genome Res. 2012, 22, 2376–2384. [Google Scholar] [CrossRef] [PubMed]
  43. Mack, K.L.; Nachman, M.W. Gene regulation and speciation. Trends Genet. 2017, 33, 68–80. [Google Scholar] [CrossRef] [PubMed]
  44. Shi, X.; Ng, D.W.; Zhang, C.; Comai, L.; Ye, W.; Jeffrey Chen, Z. Cis-and trans-regulatory divergence between progenitor species determines gene-expression novelty in Arabidopsis allopolyploids. Nat. Commun. 2012, 3, 950. [Google Scholar] [CrossRef]
  45. Tripathi, P.; Rabara, R.C.; Rushton, P.J. A systems biology perspective on the role of WRKY transcription factors in drought responses in plants. Planta 2014, 239, 255–266. [Google Scholar] [CrossRef] [PubMed]
  46. Wu, G.; Tian, N.; She, F.; Cao, A.; Wu, W.; Zheng, S.; Yang, N. Characteristics analysis of early responsive to dehydration genes in Arabidopsis thaliana (AtERD). Plant Signal. Behav. 2022, 2105021. [Google Scholar] [CrossRef]
  47. Yokotani, N.; Ichikawa, T.; Kondou, Y.; Matsui, M.; Hirochika, H.; Iwabuchi, M.; Oda, K. Expression of rice heat stress transcription factor OsHsfA2e enhances tolerance to environmental stresses in transgenic Arabidopsis. Planta 2008, 227, 957–967. [Google Scholar] [CrossRef]
  48. Rehman, S.; Mahmood, T. Functional role of DREB and ERF transcription factors: Regulating stress-responsive network in plants. Acta Physiol. Plant 2015, 37, 178. [Google Scholar] [CrossRef]
  49. Wang, M.; Zhang, X.; Li, Q.; Chen, X.; Li, X. Comparative transcriptome analysis to elucidate the enhanced thermotolerance of tea plants (Camellia sinensis) treated with exogenous calcium. Planta 2019, 249, 775–786. [Google Scholar] [CrossRef]
  50. Breen, S.; Williams, S.J.; Outram, M.; Kobe, B.; Solomon, P.S. Emerging insights into the functions of pathogenesis-related protein 1. Trends Plant Sci. 2017, 22, 871–879. [Google Scholar] [CrossRef]
Figure 1. Venn diagrams depicting the number of differentially expressed genes (DEGs) during the graft process. (A) Number of DEGs in ‘Pawnee’. (B) Number of DEGs in ‘Jinhua’. P3/P0, P7/P0, and P12/P0 represent the DEGs of ‘Pawnee’ at 3, 7, and 12 days after grafting (DAG), respectively. J3/J0, J7/J0, and J12/J0 represent the DEGs of ‘Jinhua’ at 3, 7, and 12 DAG, respectively.
Forests 14 00835 g001
Figure 2. Soft threshold determination of gene co-expression network. (A) Analysis of the scale-free topology model fit index for various soft thresholds. (B) Analysis of the mean connectivity for various soft thresholds. Numbers adjacent to the spots are power values.
Forests 14 00835 g002
Figure 3. Hierarchical clustering of differentially expressed genes. The y-axis on the clustering indicates expression dissimilarity between neighboring genes. Each branch in the clustering represents an individual gene. The colored strips correspond to the module designation for the clusters of co-expressed genes.
Forests 14 00835 g003
Figure 4. Identification of statistically significant modules. (A) Relevance between modules and traits. Numbers in the heatmap indicate correlation coefficients. * indicates p < 0.05. ** suggests p < 0.01. *** represents p < 0.001. Coltime is the abbreviation of collection time. (B) The eigengene expression values of tan (top) and green (bottom) modules. P0 to P12 indicates ‘Pawnee’ expressions at 0 to 12 days after grafting. J0 to J12 indicates ‘Jinhua’ expressions at 0 to 12 days after grafting.
Forests 14 00835 g004
Figure 5. Enrichment analysis of module genes. (A) Gene ontology (GO) enrichment analysis of tan module. (B) Kyoto Encyclopedia of Genes and Genomes (KEGG) enrichment analysis of tan module. (C) GO enrichment analysis of green module. (D) KEGG enrichment analysis of green module.
Forests 14 00835 g005
Figure 6. Hub genes and expression patterns. (A) Gene co-expression network. (B) Expression profiles of hub genes. (C) log2 transformed fold changes of hub genes between ‘Pawnee’ and ‘Jinhua’ in tan module. (D) Gene co-expression network. (E) Expression profiles of hub genes. (F) log2 transformed fold changes of hub genes between ‘Pawnee’ and ‘Jinhua’ in green module. Note that only genes with high co-expression (weight > 0.15) are used for network construction. For the network, yellow nodes are the identified hub genes and red edges represent the connections of hub genes. Mean expression levels are used for profile detection and fold change comparison. Expression profiles within each cultivar are independently z-score normalized (b and e). P0 to P12 indicates ‘Pawnee’ expressions at 0 to 12 days after grafting. J0 to J12 indicates ‘Jinhua’ expressions at 0 to 12 days after grafting.
Forests 14 00835 g006
Disclaimer/Publisher’s Note: The statements, opinions and data contained in all publications are solely those of the individual author(s) and contributor(s) and not of MDPI and/or the editor(s). MDPI and/or the editor(s) disclaim responsibility for any injury to people or property resulting from any ideas, methods, instructions or products referred to in the content.

