Article

Underlying Mechanisms of Urban Green Areas’ Influence on Residents’ Health—A Case Study from Belgrade, Serbia

by
Isidora Simović
1,
Jelena Tomićević Dubljević
2,
Oliver Tošković
3,
Maja Vujčić Trkulja
4 and
Ivana Živojinović
5,6,7,*
1
BioSense Institute, Centre for Biosystems, University of Novi Sad, Dr Zorana Đinđića 1, 21000 Novi Sad, Serbia
2
Department of Landscape Architecture and Horticulture, Faculty of Forestry, University of Belgrade, Kneza Višeslava 1, 11030 Belgrade, Serbia
3
Laboratory for Experimental Psychology, Faculty of Philosophy, University of Belgrade, Čika Ljubina 18-20, 11000 Belgrade, Serbia
4
Faculty of Applied Ecology Futura, Singidunum University, Požeška 83a, 11000 Belgrade, Serbia
5
Institute of Forest, Environmental and Natural Resource Policy, University of Natural Resources and Life Sciences, Vienna (BOKU), Feistmantelstrasse 4, 1180 Vienna, Austria
6
European Forest Institute, Forest Policy Research Network, Feistmantelstrasse 4, 1180 Vienna, Austria
7
Center for Bioeconomy, University of Natural Resources and Life Sciences, Vienna (BOKU), Peter-Jordan-Straße 82/II, 1190 Vienna, Austria
*
Author to whom correspondence should be addressed.
Forests 2023, 14(4), 765; https://doi.org/10.3390/f14040765
Submission received: 16 March 2023 / Revised: 5 April 2023 / Accepted: 6 April 2023 / Published: 7 April 2023
(This article belongs to the Special Issue Forest, Trees, Human Health and Wellbeing)

Abstract

:
The positive impacts of urban forests on residents’ health are widely acknowledged. However, the methods used to quantify and demonstrate this relation are still a focus of research. The aim of the paper is to examine the relationship between the size and quality of different urban green areas to residents’ health based on the face-to-face survey and remote sensing data at 12 locations in Belgrade. The socio-economic and self-perceived health characteristics were analyzed. Based on green areas’ size and pollution, municipalities were divided into “less green” and “green”. Vegetation quality was assessed by Sentinel-2 vegetation indexes (VI). Results show that residents in less green and green municipalities differ in physical, social, and emotional health. The quality of green areas was inversely proportional to the amount of money spent on medications and the number of doctor’s visits indicating potential mechanisms of the health benefits of green areas. The lack of facilities led to different appreciation among residents. Results suggest that the quality of green infrastructure is more important than the amount in promoting residents’ health. Relating the characteristics of green areas to visitors proved to improve the correlation between residents’ health and the quality of green areas.

1. Introduction

Urban areas are expanding progressively and, by 2050, almost 85% of Europe’s population is expected to live in cities which will increase environmental pollution, heat island effects, and negative effects related to climate change [1]. Therefore, interdisciplinary actions must be taken to improve the well-being of citizens [2]. Human health is defined as “a state of physical, mental and social well-being, and not merely the absence of disease or infirmity. Health can be considered a dynamic state: it is not fixed or absolute but constantly responding to environmental, social, biological, emotional, and cognitive conditions” [1,2]. The definition of health varies widely among researchers and many have studied health based on a questionnaire on subjective or self-perceived health rather than the medical parameters [3,4,5,6,7,8,9]. Studies furthermore demonstrated a positive relationship between the amount of green areas in people’s surroundings and their perceived health [7,10,11,12]. Therefore, it proved to be important to look at the relationship between human health and the natural environment in cities. The role of nature is crucial for the health of the urban population (as the source of food, water, energy, and air) and it has a major role in providing overall well-being (spaces for socialization, inspiration, and relief from everyday life) [1,13]. A recent review study by Pinto et al. [14] showed that health (mental and physical) and good social relations were the most investigated well-being dimensions in scholarly literature focusing on ecosystem services and well-being dimensions. Such studies and official reports recognized that both the quality and quantity of urban green areas are beneficial to human health and well-being [1,2,13,15,16]. The availability of good quality green areas has been proven to encourage more physical activity, which further has mental health benefits, and benefits are greater in green areas as opposed to those in less natural environments [17,18]. The recent COVID-19 pandemic clearly showed how much green areas in cities are important for strengthening physical and mental well-being of the urban population [19,20].
These aforementioned issues have been addressed in various ways since by using high vs. low amount and quality of green space as a criterion [21,22,23,24,25,26]. Studies showed that people from greener areas live longer, and have better mental health [27,28] and better self-rated health [12,29,30]. Comparing the responses of people who live in different locations that each has a different level of greenery, it is possible to estimate how their life in these areas reflected their well-being [31]. Some studies assessed the level of greenness by taking into consideration buffer zones of greenery in the neighborhood: 300 m [32], 500 m [33], 10–15 min walking distance [34], etc. The results vary from study to study stating that smaller buffer sizes may be more important for health [35] while others found that ‘neighborhoods’ are often much larger than hypothesized [36], or simply that distance of urban green areas as a factor that influences users’ health did not prove to contribute much [22].
Other aspects of urban greenery’s relation to health were assessed, such as the degree of greenery, the quality of the content, the size, the function, and the design [37,38,39,40,41], and it was assessed through the size, openness, maintenance, and cleanliness [37,42]. In terms of environmental quality, the few studies available imply that psychological restoration is greater for environments known to be of good quality [43]. However, the quality of green areas is defined differently by various scientists, and its measures include biodiversity [44] which may be regarded as both species richness and the perceived abundance of species resulting in greater restoration for both [24,45,46,47]; pristineness and aesthetic value of the environment (e.g., absence of litter and degradation) which has also been linked to beneficial restorative effects [48,49,50]; perceived quality (assessed by users based on the facilities and other parameters) [51], and scientists further turned towards the land use and vegetation indexes [52], even developing indexes that cover several aspects of green areas [53].
Wellmann et al. [54] describe remote sensing data sets on environmental characterization as having a great potential for the creation of operational networks of greening monitoring. Labib et al. [55] cite vegetation indexes (normalized difference vegetation index—NDVI, soil-adjusted vegetation index—SAVI, and enhanced vegetation index—EVI) as the second-most commonly used approaches to measuring greenness within exposure areas following land use metrics. The combination of the aforementioned is also common. NDVI has been used for comparing parks on different scales and cited to have advantages over traditional methods [56]. The other vegetation indices were used as ecological indicators (SAVI, global vegetation index—GVI) suggesting SAVI is the best for the calculation of green area quantity [57]. Su et al. [58] linked the measurements of green areas’ health parameters and found that higher NDVI was related to better health even in the coarse spatial resolution. Even when taking various buffer zones and various sensors, greater values of vegetation index were linked to better-perceived health, better mental health, and greater physical activity. Wood et al. [59], on the other hand, contested that satellite imagery does not properly identify smaller pocket parks that have significant associations with mental health improvements, and Hooper et al. [60] cite access to such small green spaces within 400 m as the main reason for their contribution to residents’ health. Furthermore, the improvement of spatial resolution of satellite data will reduce the problem of mixed pixels, therefore, reducing one potential component of measurement error that could bias epidemiological inference. The use of open-access satellite images should be encouraged [61] as well as finer resolution sources of other data used to represent green space. Therefore, the contribution of Sentinel’s improvement in that regard is significant as stated previously by Labib et al. [62].
Despite the advancement in research and technology, mechanisms by which green space characteristics influence the overall health of residents are still to be determined; this is especially important for governmental agencies and management [21,63,64]. Zhang et al. [65] found that urban green areas have a positive effect on the health of residents even without their direct use but the relation is stronger with the intensive use of these spaces. This positive effect of urban greenery is generally known, but there is still a struggle to prove to what extent the quality of greenery frequented the most reflects on visitors’ health and how to measure this dependence [29,66].
Therefore, the aim of this research was to study the relationship between socioeconomic and self-reported health characteristics with the quality of urban green infrastructure using an innovative approach in remote sensing data analysis. Namely, the study relates particular park visitors to the vegetative activities of greenery they are exposed to, taking into consideration only the green areas they visit the most. To understand the structure of the users and the manner in which they use green areas, the analysis focused on the types of green space use, frequency of visits, preferences towards outdoor spaces, and their facilities. Our hypothesis is that analyzing the data from a particular park and its visitors would reveal a stronger correlation between greenery and health compared to the approach, considering the health of all inhabitants and all parks at the municipality level. To test this, we divided the municipalities into “green” and “less green” categories based on the degree of urbanization and pollution, and examined the impact of urban green areas on the well-being of residents. An individual-level analysis was focusing solely on the health of frequent visitors and the quality of the park they visit the most. Finally, we compared the results of this approach with the previous one.

2. Materials and Methods

This paper builds on the data collected via survey with citizens and remote sensing. A survey was conducted with the Belgrade inhabitants, who reported on their self-perceived health characteristics, as well as their attitude towards vising urban green areas in Belgrade. These survey data are contrasted with the data on green areas—clustered in “less green” and “green” and the quality of greenery. Comparing correlations from both analyses, we aimed at supporting the results gained from each method.

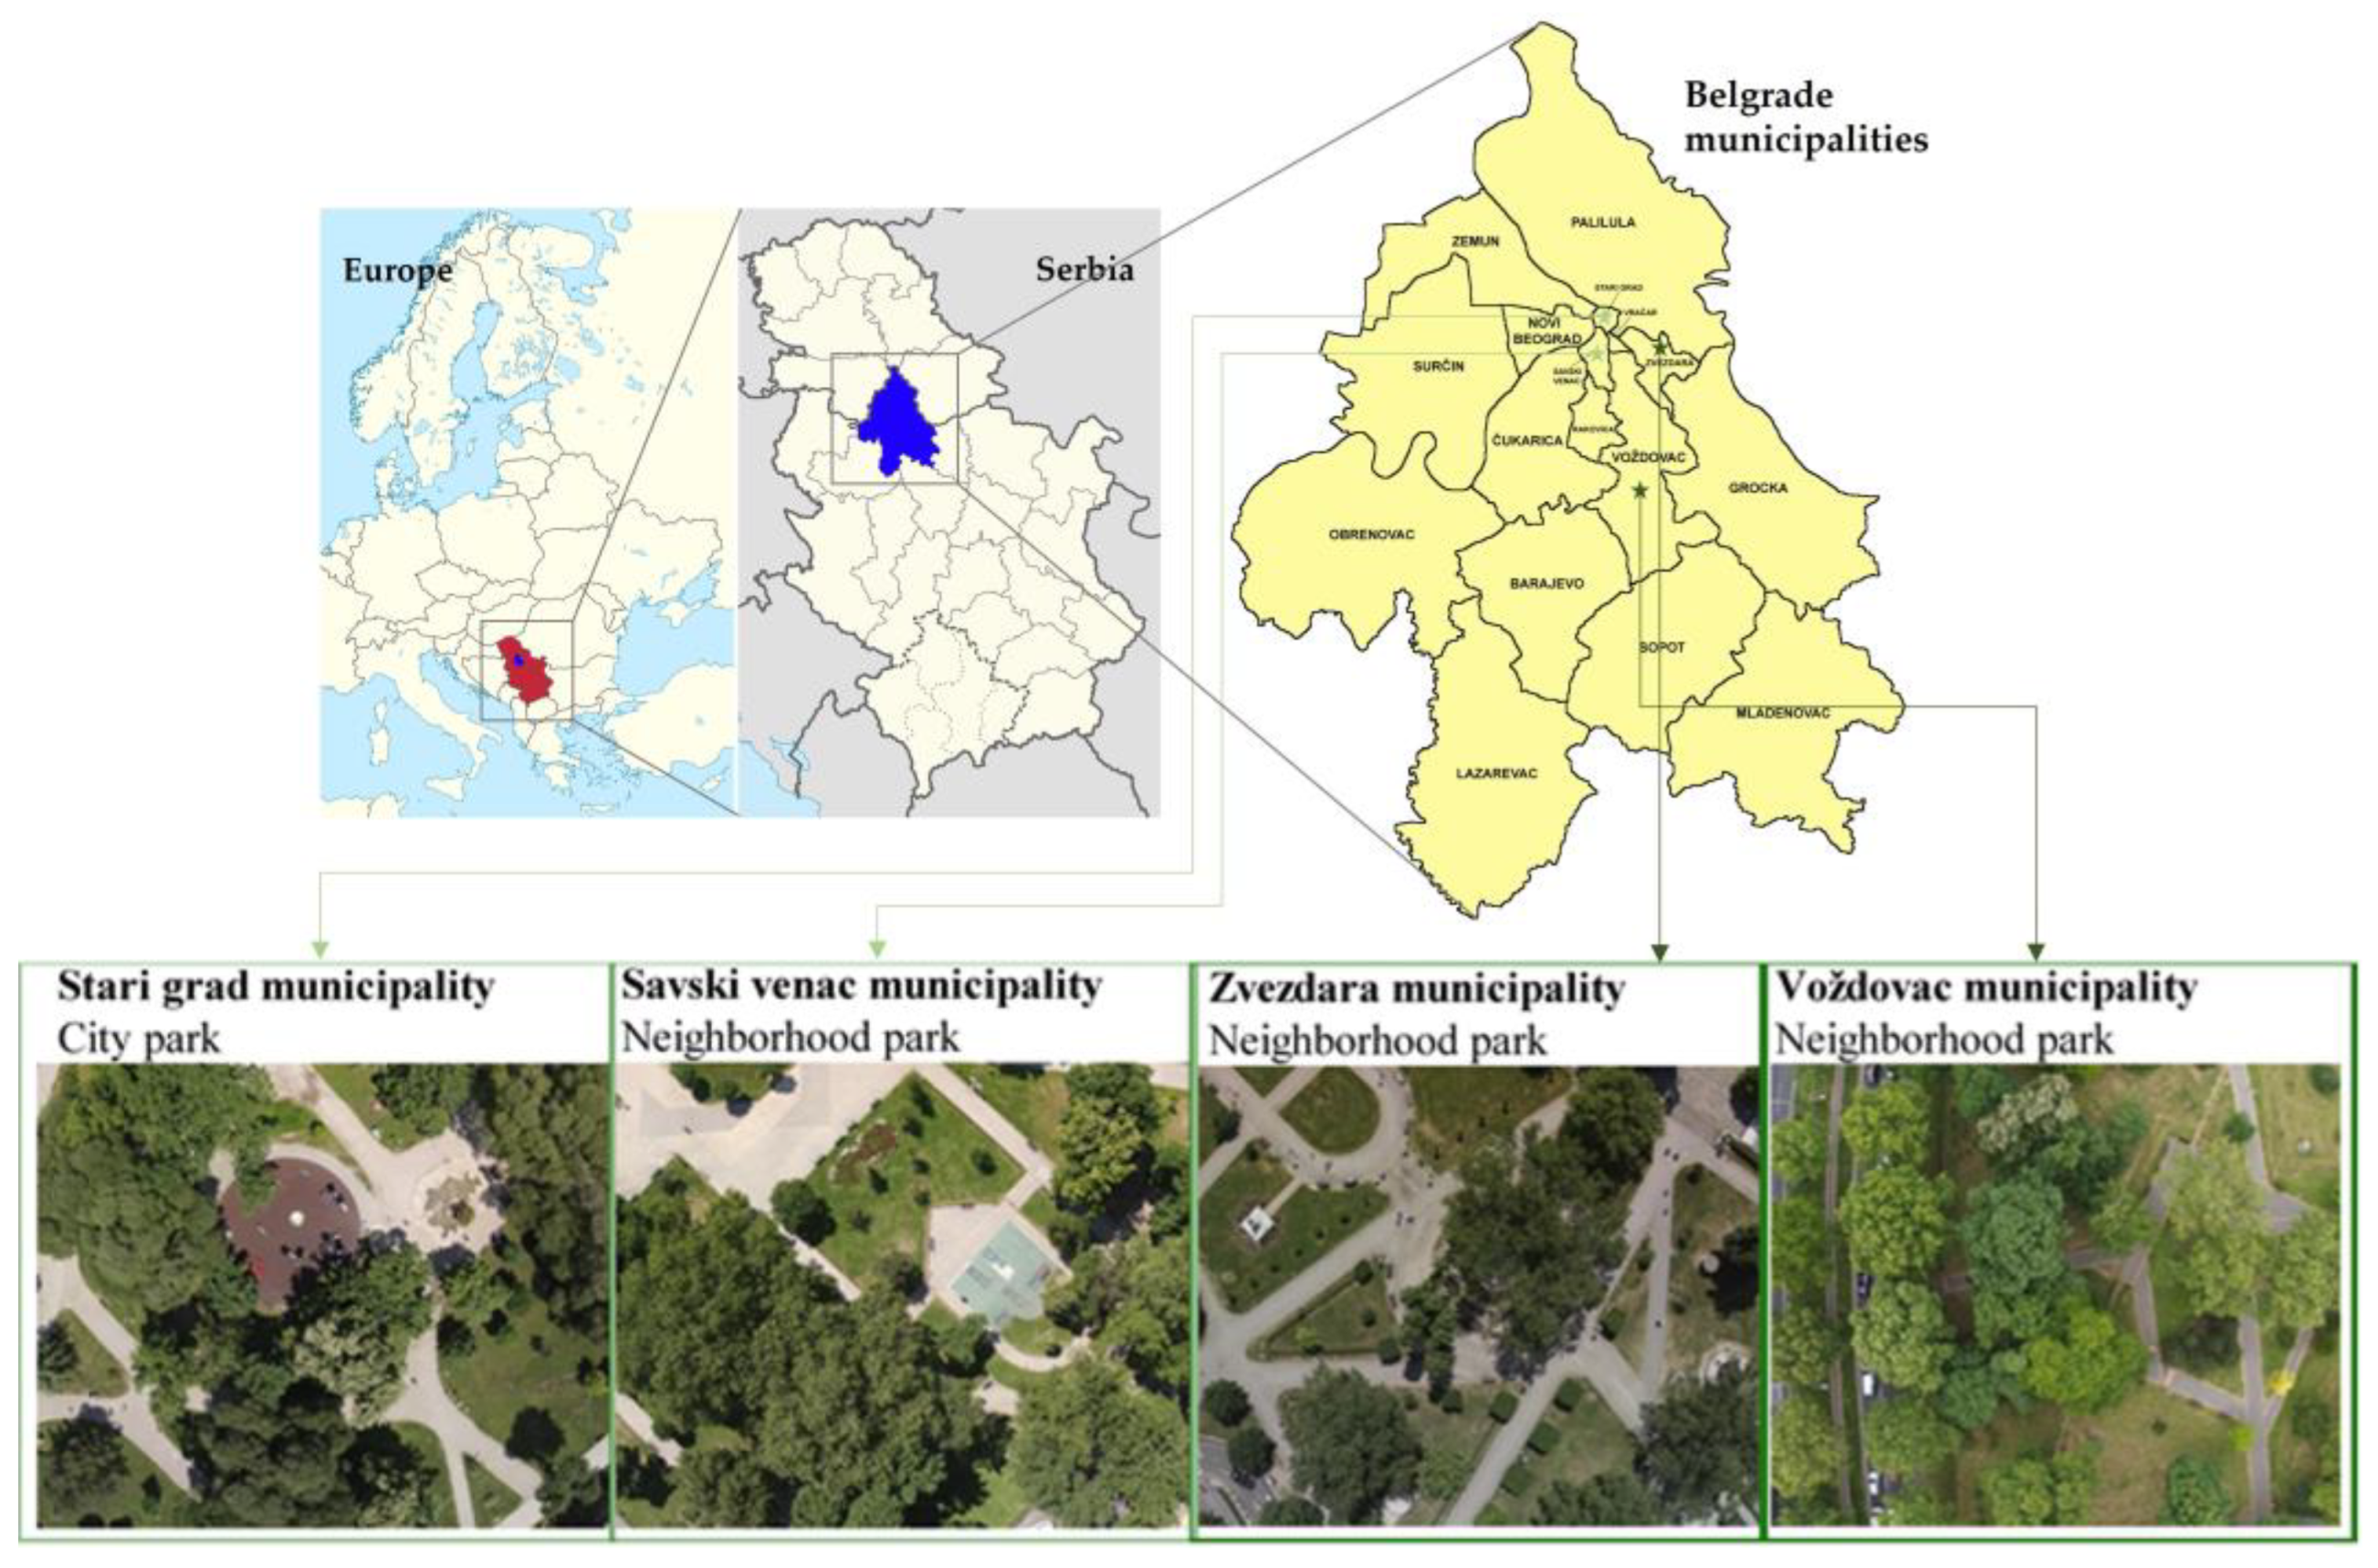
2.1. Location of the Study

The research was conducted in four Belgrade municipalities: Zvezdara, Voždovac, Stari Grad, and Savski venac (Figure 1). In each municipality, 3 urban green areas were selected, which was, in total, 12 study locations (Table 1). Selected areas vary in many aspects including size, function, design, facilities, and location. Some of them are parks that are used for daily recreation while the others are smaller green areas that are also tourist attractions. All of these different types of urban green areas are represented in each municipality (Table 1). Therefore, the study area covered small parks, neighborhood parks, city parks, central city parks, and urban forests. The central city park is a park that is centrally located within the city and has the capacity to serve and attract residents from all over the city, due to its location, size, uniqueness, and quality, or due to the attractive offers. The city park is a park that has the capacity to serve and attract residents of several city municipalities, it is larger in size, of high quality, and easily accessible. The neighborhood park is a park in the residential area that serves residents of blocks, can be of different sizes, equipped with basic equipment for passive and active recreation, visually appealing and easy to access. The small park is a small urban park (less than 1 hectare), accessible to the public, and provides the population with conditions for rest and children’s play. It often occupies the surface of a plot, and it can be formed around the monument, in the squares. Urban forests are green areas primarily intended for the low-level intensity of recreation and environmental protection. These areas should present barriers to the extension of the urban area [67].

2.2. Survey on Health-Related Issues

Face-to-face surveys with the visitors of these urban green areas were conducted on-site, during the autumn period, during October and November 2018. The respondents were asked to fill in a questionnaire during their leisure time in the green areas. The survey was conducted on weekdays and on the weekend, during daylight (between 10 a.m. and 7 p.m.). The weather was partly sunny to sunny with an average temperature that was usual for the autumn in Serbia. Each interview lasted approximately 15–20 min. The variety, in terms of days and periods of the day, helped us recruit diverse respondents, covering different social groups from various backgrounds and age groups. The survey respondents were selected via systematic sampling in which every second visitor was interviewed, respecting representatives of both genders equally [68]. In total, a survey was conducted with 405 respondents, with almost equal distribution among 4 municipalities (Table S1).
The questionnaire was designed based on a similar work that looked at subjective self-perceived health characteristics in regards to urban green areas [22,38]. It included three sets of questions: socio-demographic characteristics of the respondents, self-estimation of health parameters (open-ended and yes/no questions related to the respondents’ perceived chronic physical and mental health), and recreational aspects of the park (rating its elements by their use and the effects that they have on physical and mental well-being, recorded on a 5-step Likert scale) as well as the distance from home. We used the term “self-reported nervous disorders” to describe the perceived nervous health problems of the respondents and whether a doctor diagnosed them or not. Under the term “medication”, we considered the prescribed or non-prescribed use of tranquilizers, antidepressants, and other supplements. For the analysis of the self-estimated health, the questionnaire included questions about annual visits to the health center and monthly expenses for medications. The respondents retained their right not to specify whether a doctor prescribed the medication or if it was non-prescription medication use. For the estimation of the importance of urban green areas, we included questions about respondents’ impressions of the effects greenery has on physical, emotional, and social health, regularity of park visits, green spaces’ usage to walk, rest, run, as well as the performance of common activities, the importance of benches, lawns, paths, trees, water elements and landscapes for the mood, and preference for indoor or outdoor space. Different types of questions were employed to investigate the various dimensions of the views of the examinees and, particularly, to ensure that accurate information was obtained [69].
All the respondents were taken into account for the analysis of socio-economic variables and comparison on the municipality level (less and more green municipalities). A different approach was used for the statistical analysis of the relationship between the quality of the greenery and the health aspects. In the latter, we focused exclusively on the frequent users of city parks and urban forests. Frequent users are those spending 120 min or more per week in parks, as suggested by White et al. [70], and visiting that particular park at least 80% of the time.

2.3. Urban Greenery Data

2.3.1. Less Green and Green Municipalities—Secondary Data

Secondary environmental data on selected municipalities were collected from spatial plans and Plan of the general regulation system of green areas in Belgrade [71] as well as the reports from the City Institute for Public Health [72]. Two parameters were used for the segregation of less and more green municipalities. The first parameter was the total size of green areas and their percentual share in the total area of the municipality. The second parameter was the air quality data that is proved to be related to respiratory disorders [72,73,74] and soundscape data related to nervous disorders [75]. Belgrade municipalities that have the highest percentage of registered patients with respiratory disorders are also the municipalities that have the lowest air quality, combined with the highest concentrations of airborne pollutants registered at the measuring points [6,75].
After dividing municipalities into “less green municipalities” and “green municipalities”, we used socio-economic data to contrast with a survey on the characteristics of greenery in order to prove our hypothesis.

2.3.2. Remote Sensing Data

The shape and position of the analyzed urban green areas were marked on the orthophoto with Google Maps and then the vegetation indices were calculated according to their georeferenced position. For the calculation of biological parameters, we excluded paved surfaces and park furniture from the remote sensing images. Aligned with the survey on the socio-economic variables, during two successive years (2017 and 2018), we tracked the vegetative activity of greenery in selected urban parks in Belgrade in 4 different municipalities. A variety of broadband and hyperspectral vegetation indexes were tested (normalized difference vegetation index and enhanced vegetation index) to determine the differences in the quality of vegetation in different parks. To compare the same category of urban green areas, a survey covered the same size and type of parks in each municipality, comparing urban forests among each other, as well as central city parks and neighborhood parks.
Multi-year, high-resolution data acquisition from the Sentinel-2 platform was conducted in order to create a database of appropriate density for time series analysis. Due to the fact that the data were all acquired at the same time from the same satellite images, values were comparable and reflected differences in VI rather than optical differences. Images in which the cloud is directly above the observed area or creates a shadow on this surface were excluded. The frequency of satellite flight was around 5 days, but around 30% of images were cloud-free and used for calculation. Even with the exclusion of the cloud-contaminated images, 73 images were used for the calculation of both indexes. The spatial resolution of 10 m × 10 m allowed adequate calculation of the indexes. Surfaces other than vegetation were extracted and only vegetation was taken in the calculation. The NDVI index was chosen as it is the most commonly used index in ecological disciplines of remote sensing [76], but due to a large number of factors that affect its values (atmosphere, background, soil moisture, etc.) alternatives such as optimized vegetation index (EVI) and others were explored. EVI should better represent the physiological processes in the plant, excluding the influence of external factors. The red edge part of the spectrum is used to calculate the NDRE (normalized difference red-edge index), which Sentinel-2 registers exclusively in the resolution of 20 m × 20 m. For this study area, this resolution was too low.
The Sentinel-2 images have already been calibrated and atmospherically corrected, so the calculated values of the spectral responses were obtained. The values of vegetation indices NDVI and EVI for a given area were obtained by overlapping images of the red and NIR part of the spectrum, according to the standard formula, using the Qgis program. The calculation included mean values and median values of the indexes. The medians were calculated to exclude the possibility that low index values of individual pixels significantly affect the mean value of vegetation indices. The assumption is that each time series consists of systematic patterns (a set of identifiable components) and a random “noise” (error) that makes it difficult to identify the patterns. Most time series analyses involve some form of “noise” filtering to make a pattern visible [77]. Data smoothing methods are expected to maintain the integrity of vegetation dynamics while removing the noise component [78,79,80,81]. Our data were filtered using Fourier transformation and Savitzky–Golay filter. This reduces irregularities (random fluctuations) in the time series, which makes it easier to observe the behavior of the series.

2.4. Statistical Analysis

Numerical variables are shown in tables as mean values and their standard deviations while categorical variables are expressed through percentages and frequencies. For the analysis of data, t-test was used for independent samples and for testing health parameters, while multiple regression was used in relation to the way visitors use urban green areas. The threshold for the significance was a p-value less than 0.05.
For the collection and processing of remote sensing data, we used PyCharm 2018.1 EAP JetBrains, QGIS, and IBM SPSS Statistics for Windows 21.0. The data were analyzed in SPSS software (Statistical Package for Social Sciences version 18) (SPSS, Chicago, IL, USA). The Shapiro–Wilk test was used to test for normality. As the results have a normal distribution, differences in the values of vegetation indices among parks as well as their relation to health data were analyzed using the ANOVA test.

3. Results

3.1. Descriptive Statistics and Analysis of Socio-Economic Factors

For the representative results, the respondents (n = 405) were carefully selected to balance the female and male respondents, and the ratio was 51% (208) to 49% (197), respectively. The diversity of respondents was reflected in the level of education (54% of higher, secondary 40%, and 5% of elementary education) as well as in marital status (married 45%) (Table S1). The age of the participants varied from 18 to 82 (mean 40.8 years). The respondents spent not more than 15 min walking to the park and visited the park, on average, 3 to 5 times a week, spending, on average, over an hour in the park.
Respondents identified that they mostly use the green areas for common activities and walking. They sometimes visit parks for running and jogging and most visitors hardly ever come to green areas for sitting and relaxing. Visitors in general value greenery the most followed by paths they use for walking and running. Results show that water elements are more important than benches and lawns according to respondents’ preferences (Table S3).

3.2. Self-Perceived Health Data Analysis

To relate the importance of urban green areas for the physical and mental health of the users, the respondents were first asked about their general health condition, regarding the respiratory infections, nervous disorders, and then about the use of medications and frequency of visits to a doctor.
Results show that about 26% of respondents suffer from pollen allergies. While 22% of them reported suffering from acute respiratory infections, only about 14% suffer from chronic respiratory diseases and 10% use medications regularly. About 8% reported suffering from nervous disorders and 17% use tranquilizers (both regularly or at times) (Table S2).

3.3. Less Green and Green Municipalities

Based on the size and air pollution, municipalities were divided into two groups: “less green municipalities” and “green municipalities” (Table 2). These data illustrate the main environmental characteristics (air quality and soundscape) of analyzed municipalities as well as a number of respiratory and nervous disorders reported by the City Institute for Public Health in Belgrade. Taking these values into account, as well as the size of green areas, we made divisions into less green municipalities that are socio-ecologically vulnerable, and green municipalities that are socio-ecologically the healthiest municipalities.
The maximum concentrations proposed by the City Institute for Public Health differ from those proposed by the World Health Organization global air quality and noise guidelines. Unlike the values shown in Table 2, the maximum concentrations according to WHO of CO is 4 mg/m³, SO2 is 40 µg/m3, and NO2 is 25 µg/m3 [82]. Similarly, the limit for daily noise is 53 dBA, and for night noise is 40 dBA [83].

3.4. Visitors’ Perceptions towards Green Areas and Their Influence on Human Health in Green and Less Green Municipalities

For finding the relation between the green areas and health aspect, we first divided municipalities according to the amount of greenery (less green: Savski venac and Stari Grad and more green municipalities: Voždovac and Zvezdara), and correlated the data with different parameters from the questionnaire.
t-tests for independent samples showed differences between municipalities on some of the proposed variables that were tested. Those that significantly differed among green and less green municipalities are shown in Table 3 while the list of all the variables is listed in Table S3.
Table 3 shows that respondents living in and visiting less green municipalities evaluate better physical, emotional, and social health and, consequently, health in total. There are fewer joint activities in less green municipalities; people also estimate that bench, lawn, pathway, greenery, and water elements contribute more to the mood in less green municipalities, spend more time outdoors, and estimate that their landscape contributes less to mood than in municipalities with more greenery. No significant relation was found regarding the frequency of visits to health professionals or the amount of money they spent on medication.

3.5. Differences between All Municipalities Regarding Health Aspects

The relationship between health and the visits to urban green areas was evaluated by taking into account the usual frequency and the average duration of visits to green space weekly. On one hand, respondents estimated spending free time outdoors in the local parks, and on the other hand, the yearly frequencies of their visits to a doctor and monthly expenses on medications. Data were further filtered taking into account only the respondents spending more than 120 min weekly in parks and visiting a particular park more than 80% of the time. This individual approach allowed us to relate the quality of greenery in the park to the health of visitors who spent almost all of their leisure time in that park.
We compared several health aspects (number of a variety of diseases, number of visits to a doctor, amount of money spent on medications) and green space usage factors (how much they believe greenery affects their physical, emotional, and social health; how often they visit parks or use green spaces to walk, rest, run, perform common activities; how important for their mood are benches, lawns, paths, trees, water elements, and landscapes, and do they prefer an indoor or outdoor space) among four municipalities. These differences were tested using ANOVA variance analysis.
Further analysis of health data included the recognition of the exact parameters of self-reported total health that differed significantly among municipalities. Unlike the previously more general approach (less green and green municipalities to the categories of health aspects), this approach regards more specific aspects of self-reported health parameters. Each of the health aspects tested in “green” and “less green” municipalities (physical, emotional, social, and total) is calculated based on a series of parameters (e.g., number of doctor visits, money residents spend on medications, consumption of antidepressants, etc.). Thus we calculated the relation of each parameter with the quality of the greenery in each park.
The amount of money spent on medication reported in local currency and given in euros in brackets was the highest in Stari grad 1121.50 dinars (EUR 9.59) and lowest in Voždovac 706.50 dinars (EUR 6.04). Residents of Zvezdara and Savski venac are similar in this aspect and spent 893.50 dinars (EUR 7.64) and 841.50 (EUR 7.19), respectively (Table S4). The standard deviation was below 1.5% for all the municipalities.
Analysis of variance proved that there are differences among municipalities in terms of the monthly expenses users have for medications (Table 4). The differences were significant only between those from municipalities Voždovac and Stari Grad. Other users spent similar amounts of money on medications.
The number of doctor visits was the highest in Stari grad (3.26 times per year); residents of Savski venac frequented doctors the least (2.69 times per year), followed by Voždovac residents (2.89), and Zvezdara (3.21) (Table S5). Although there were differences between municipalities in the number of doctor visits, they were not statistically significant (p > 0.05).
The differences based on analysis of variance showed that the z score (Table 5) for parameters in the amount of money spent on medications monthly and doctor visits yearly are not significant among municipalities (p = 0.135). Analysis of variance shows that neither the number of doctor visits nor the collective z score differs significantly among park visitors in different municipalities.

3.6. Results of Remote Sensing Analysis of Quality of Green Areas

Vegetative indexes that can be calculated from Sentinel-2 satellite images are NDVI, EVI, and NDRE. As for the first two, the resolution is 10 × 10 m and allows the monitoring of smaller parks and the exclusion of non-greenery parts of the parks. NDRE has a resolution of 20 × 20 m and proved to be too coarse for the neighborhood parks and, therefore, was altogether excluded from the analysis.
During 2 successive years of vegetation monitoring (at the time of conduction of the questionnaire survey), NDVI values were consistent in the differences among municipalities and were the highest in Voždovac (0.7023, std 0.14) and the lowest in Stari grad municipality (0.55, std 0.08). Greenery in Zvezdara and Savski venac was somewhat similar (0.5809, std 0.12 and 0.6357, std 0.11, respectively) (Table S6). Analysis of variance showed that the differences were significant among all the municipalities except among Zvezdara and Stari grad (Table 6).
On the other hand, EVI values were consistently higher than NDVI and varied more (Table S7). Similarly to NDVI, EVI values were highest in Voždovac municipality (0.8025, std 0.61), the lowest in Zvezdara municipality (0.5895, std 0.34) and Stari grad (0.5963, std 0.29), while in Savski venac, EVI was 0.6378 with the standard deviation 0.30 (Table S7). EVI failed to detect the same differences as NDVI, and only between Voždovac and Zvedara and Stari grad and Voždovac municipalities were the differences statistically significant (Table 7).

4. Discussion

This study examined the self-reported health and mental well-being perceived from visiting four different green space types, which were selected based on the high vs. low amount and quality of green space, their main use, and location in the city. Such criteria were used previously [21,22,23,24,25,26]. In this study, the purposive selection was made so that the number of male and female respondents was as equal as possible. Some other studies in Belgrade showed that males visit green areas more, usually for active recreation, unlike females who mainly use them for passive types of recreation [10]. Another study by Vujcic et al. [6] had more female respondents, which indicates that this variable is subject to the study’s condition therefore, generalizations are hard to make. What was similar between these studies and ours is that number of respondents with higher education was dominant, as well as that the mean age was around 40 years. In terms of health characteristics, we saw that almost a quarter of respondents suffered from pollen allergies, and a bit less from acute respiratory infections, while only less than one-fifth reported chronic respiratory diseases. Just 8% of respondents reported suffering from nervous disorders and 17% used tranquilizers (both regularly or at times). As in other studies, it is quite hard to relate chronic respiratory diseases or pollen allergies based on green space usage factors [6], thus we just aimed for descriptive quantification of variables.
The municipalities in this study were separated based on both—the amount of green area (m2) and the percentage of greenery (%). Voždovac and Zvezdara municipalities have significantly more green areas than municipalities Savski venac and Stari Grad. It is important to stress the fact that the official data from the Secretariate for Environmental Protection [73] shows that not only do these municipalities have less greenery, but they also have higher levels of air and noise pollution. There are discrepancies between the standards of the Secretariate for Environmental Protection in Serbia and the maximum values proposed by WHO, but our municipalities fit both regarding the differences in “green” and “less green” criteria. Although values of air pollutants and noise are above the proposed limits, there is a significant difference between municipalities Voždovac and Zvezdara and those “less green”—Stari grad and Savski venac. The users of “less green” and “green” municipalities differ in common activities and preferences towards outdoor activities and rank the importance of the landscape elements and facilities differently. Residents of greener municipalities perceive landscapes and views as more important and conduct more common activities in green areas than residents of less green areas. With the bigger number of parks and surfaces under the greenery, there are more opportunities for activities (i.e., physical as previously proven by Jansen et al. [84]) and users realize the importance of greenery and put it high on their priority scale. On the other hand, residents of less green areas recognize the lack of greenery, lawns, water elements as well as facilities such as benches and paths, and evaluate them as very important; they spend less time outdoors, and do not perceive the contribution of green areas to their physical, emotional nor social health.
Comparing green to less green municipalities, we come to the conclusion that perceptions of total health, physical, emotional, and social health differ significantly. When we solely look at the amount of greenery and analyze the differences among municipalities, there are seemingly no significant differences in the quantitative variables such as the amount of money they spend on medications or the number of visits to a doctor. A study by Schmidt [85] might offer an explanation for this as it showed that the presence of only larger trees in green areas was associated with lower overall medication sales, suggesting these large trees “are more beneficial with respect to heart disease and mental health than smaller trees” and are also “more effective in reducing environmental stressors like urban heat, air pollution, and noise”. Our results suggest that even taking into consideration air and noise pollution apart from the quantity of greenery does not account for all the contributions of urban green areas to the health of its residents.
Therefore, we addressed another research question—the size and shape of the buffer zone were taken into account for the contribution to one’s health. We explored the contribution per municipality but took into account different categories of parks. With that, we covered different green areas including pocket parks (small parks) that were cited as the most important by Wood et al. [59], small green spaces (neighborhood parks) that are important due to their proximity [60], medium-size parks (city parks and central city parks) that induce physical activities [84], and even urban forests. Our study area covered all 4 categories of green areas in each municipality, and thus different buffer zones were covered within each study area. Access to natural environments in cities for recreation may be substantially constrained by distance and availability of resources and time to visit them [1]. Depending on the source, buffer zones vary from 300 m (European Commission’s recommendations that public open spaces should be within 300 m of residences) up to 800 m [55] or reflect the walking distances up to 10 min walk from home as in the research of Cutts et al., Kaczynski et al., Kim et al., and Stewart et al. [86,87,88,89]. Chaix et al. [90] even introduced “self-described neighborhoods” suggesting that they may be more informative than researcher-defined neighborhoods. Our results showed that most of the frequent users of parks in the survey were willing to walk up to 15 min from home. Thus, our finding is more in accordance with the results of Sugiyama et al.’s [34] study that defined a neighborhood as any area within a 10- to 15-min walk from home. They combined their result with the data on public health physical activity guidelines (≥150 min per week) in the RESIDE study where they proved that residents prioritize high-quality parks over short-distance walking. Similar studies, on the other hand, have noted that visitors of urban green spaces prefer short travel distances to green spaces, the presence of trees and open areas, and they connected these to their better health and well-being [91,92,93].
As the size and the distance of green area correlations with the residents’ health varied drastically depending on the methodology and the approach, the focus of research shifted towards the quality of greenery. The quality was, however, defined differently among researchers and was assessed through aesthetic values such as pristineness, absence of garbage, and degradation [48,49,50], and the size and the openness apart from maintenance and cleanliness [42], etc. Facilities proved to be important by Zhang et al. [51] as they were evaluated by the examinees as the perceived quality of parks. Another approach to validate the quality of urban green areas is to quantify biodiversity [44] either as the species richness or as the perceived abundance of species [24,45,46,47]. Therefore, the quantification of parks’ quality still proved to be a challenging task. Thus vegetative indexes were introduced for the objective and timely quantification of the quality of green areas. Almanza et al. [52] combined vegetation indexes with land use using NDVI as a measure of greenness exposure and Rugel et al. [53] developed an index that covered NDVI and EVI with different size buffer zones. However, Labib et al. [55] concluded that at the personal scale, the relationships remain largely unexplored. These authors indicated that different spatial approaches to assessing availability exposure (e.g., in terms of buffer distances, scales, and data) influence the strength and significance of associations with health indicators. Moreover, even using “self-described neighborhoods“ may not be representative as an individual’s perceived neighborhood may not represent where they spend their time [90,94].
For a clear analysis of the benefits of greenery for the residents’ well-being, we explored another approach which was more personal and at an individual level. We filtered the data and selected users based on the amount of time they spent in parks. White et al. [70] suggested that the visible relation between greenery and the users’ health is when they spend at least 120 min a week in parks. Thus, we selected the respondents based on the minimum time (120 min) spent in that particular park and visiting it at least 80% of the time. These visitors frequented parks, on average, 3–5 times a week, similar to a study by Tomićević et al. [10]. This setup is an improvement in regard to the personalization of the relationship between vegetative indexes and users’ health. Not only have we chosen various types of parks, and selected users that spend sufficient time in the surveyed areas, but we also measured the differences in vegetative activities only among the parks that users frequented most of the time. Previous attempts to use VI for the assessment of green areas have drawn attention to the limitations of the coarse resolution. Dadvand et al. [95] concluded that the low spatial resolution of satellite imagery misses the small green spaces and limits the research on the level of exposure to green areas. Su et al. [58] compared 3 sensors and 4 buffer zones and found that even though high values of vegetation indexes were consistently related to better-perceived health, better mental health, and greater physical activity, the green space characterized by finer spatial resolution had larger health associations. Markevych et al. [61] and Labib and Harris [62] suggested, in particular, the use of open-access Sentinel-2 satellite images. Our research is improved in regard to time and space resolution as we used Sentinel-2 images (10 × 10 m resolution) and, for representative differences among parks, we used two full vegetation seasons aligned with the survey conducted with the questionnaire. In this way, we avoided the possibility that current problems that might appear in certain green areas (disease outbreaks, heat waves, lack of water, etc.) show unrepresentative results. Personalization in using vegetative indexes for the assessment of their contribution to residents’ health improved the relations between the respondents’ self-reported well-being and the characteristics of the parks they were visiting. When relating health parameters with the NDVI values per municipality, relationships were stronger and significant even for individual parameters and quantitative variables. Even though the differences are not significant among each municipality and for all the parameters, they were still in line with the NDVI values having lower values in the municipalities where the amount of money spent on medications and the number of doctor visits is higher and vice versa. Therefore, residents of the municipality with the highest NDVI spent the least money on medications and visited doctors the least. This is in line with the previous research of Kardan et al. [96] who proved that more trees in the neighborhood are related to lower amounts of medications. Significant differences are also reflected in the number of total diseases that are the greatest in the municipality Stari grad where the NDVI values are the lowest. In the same municipality, residents value greenery and water elements the most as they are scarce.
NDRE with the resolution 20 × 20 m was excluded as the small green areas included a lot of mixed pixels, and were, therefore, not representative of the vegetative activity of greenery. To capture the differences among parks, we further explored the EVI index as it is, by definition, improved in the sense that the background variation does not reflect its values. However, EVI varies more than the NDVI and did not show significant differences between all the municipalities, but only between Zvezdara and Voždovac, and Stari Grad and Voždovac. On the other hand, both EVI and NDVI had the highest values in Voždovac municipality and the lowest in municipalities Stari Grad and Zvezdara. It aligned well with the amount of money residents spent on medication, the number of diseases, and the number of doctor visits. In Voždovac municipality, residents spent the least money on medications, have fewer diseases, and visited doctors less than the residents of Stari Grad and Zvezdara.
Greener neighborhoods show better self-estimated health in total but also all the segments of health—emotional, social, and physical, compared to less green municipalities. Municipalities covered with substantially more green areas in Belgrade do not have the best quality of greenery. Analysis based solely on the amount of greenery, air, and noise pollution showed weak relations to the health of residents. However, shifting to a more personal level and regarding only frequent users of parks as well as measuring only the vegetative activity of that particular park significantly improves the correlation between the health of trees and residents. This research proves the need for a more individual approach and confirms the good potential of using vegetative indexes for the quantification of parks’ quality. With the coverage of various categories of parks and the inclusion of the interviewees that spend significant time in urban green areas, the relationship between the quality of greenery and residents’ health becomes more clear and stronger. Our research further shows variations in preferences in terms of facilities in parks and the dominant use of the parks, therefore, providing clear information for policy-makers and urban park managers. Further research might focus on the exploration of the liaison between parks’ contents and users’ visits and determine whether the facilities are an important factor for deciding on the park which visitors frequent the most.
One of the main strengths of our methodology is the clear and measurable relationship between the greenery of a park and the health of its visitors. However, this approach has a limitation in not accounting for the indirect contribution of urban green areas to the health of residents who do not visit parks. Thus, future research could investigate the broader impacts of green spaces on the health of all residents, including those who may not visit urban green areas. Moreover, our study focused only on the city of Belgrade, and future studies could expand the scope to other cities and regions to explore how the relationship between urban green areas and health varies across different contexts. Finally, investigating the specific aspects of greenery, such as the quality and quantity of vegetation or the type of activities that can be conducted in green spaces, could shed light on the mechanisms that underlie the relationship between urban green areas and health.

5. Conclusions

By unpacking some of the main aspects related to the quality of green areas and self-perceived health benefits, this study contributes to improving the existing knowledge on these aspects in Belgrade, which are also relevant for other areas. The role of green infrastructure quality proved to be crucial for residents’ health in total. Some of the health aspects differed between residents in green and less green areas. However, a more personal approach reveals the direct codependency and the mechanisms by which greenery influences one’s health. This especially reflects to quantifiable variables of self-estimated health parameters. Users of parks with less vegetative activity and quality have significantly more diseases, spend more money on medication, and visit doctors more frequently. Likewise, residents of municipalities with the highest vegetative indexes perceive the important role of greenery for their health and all its aspects. Residents of municipalities that lack greenery value it more and recognize the need for parks and their facilities.
In terms of the practical relevance of this research, we recommend wide communication of these results to managers of urban green areas, and also other city authorities in Belgrade. Such information is crucial for informed decision-making and improved management of green areas. Increasing awareness of the importance of green areas in cities for the overall health of its citizens but also improvement of other environmental aspects is needed. Study results indicate prioritizing proper maintenance of the existing green areas for reaching the full potential over increasing the green coverage. Further studies should also take into account features of greenery, facilities, and accessibility in addition to the two-dimensional remote sensing, which depicts tree canopy cover. In this way, even more detailed analyses and correlations could be made.

Supplementary Materials

The following supporting information can be downloaded at: https://www.mdpi.com/article/10.3390/f14040765/s1, Table S1: Main socio-demographic characteristics of the respondents; Table S2: Self-perceived health aspects; Table S3: Descriptive statistics for all tested variables from questionnaire; Table S4: The amount of money spent on medications monthly for each municipality; Table S5: The number of doctor visits yearly for each municipality; Table S6: NDVI values per municipality; Table S7: EVI values per municipality.

Author Contributions

Conceptualization, I.S., J.T.D. and O.T.; methodology, I.S., J.T.D. and O.T.; formal analysis, I.S., M.V.T. and I.Ž.; investigation, I.S., J.T.D. and M.V.T.; resources, I.S., J.T.D. and I.Ž.; data curation, O.T.; writing—original draft preparation, I.S., J.T.D. and I.Ž.; writing—review and editing, I.S., J.T.D. and I.Ž.; supervision, J.T.D.; funding acquisition, I.Ž. All authors have read and agreed to the published version of the manuscript.

Funding

The work of I.Ž. was supported by the CLEARING HOUSE project, which has received funding from the European H2020 Research and Innovation program under the Grant Agreement number 821242.

Institutional Review Board Statement

Not applicable.

Informed Consent Statement

Informed consent was obtained from all subjects involved in the study.

Data Availability Statement

The data presented in this study are available upon request from the corresponding author.

Acknowledgments

The English proofreading of our paper and costs of its publishing were supported by BOKU University, for which we are very grateful.

Conflicts of Interest

The authors declare no conflict of interest.

References

  1. Wheeler, B.; Lovell, B.; Fleming, L.; Bland, E.; WHO. Nature, Biodiversity and Health: An Overview of Interconnections; University of Exeter Colledge of Medicine and Health, Eropean Cetre for Environment and Human Health: Exete, UK, 2021; ISBN 9789289055581. [Google Scholar]
  2. Lee, A.C.K.; Maheswaran, R. The Health Benefits of Urban Green Spaces: A Review of the Evidence. J. Public Health 2011, 33, 212–222. [Google Scholar] [CrossRef] [PubMed] [Green Version]
  3. Garrett, J.K.; White, M.P.; Elliott, L.R.; Grellier, J.; Bell, S.; Bratman, G.N.; Economou, T.; Gascon, M.; Lõhmus, M.; Nieuwenhuijsen, M.; et al. Applying an Ecosystem Services Framework on Nature and Mental Health to Recreational Blue Space Visits across 18 Countries. Sci. Rep. 2023, 13, 2209. [Google Scholar] [CrossRef] [PubMed]
  4. Grigoletto, A.; Toselli, S.; Zijlema, W.; Marquez, S.; Triguero-Mas, M.; Gidlow, C.; Grazuleviciene, R.; Van de Berg, M.; Kruize, H.; Maas, J.; et al. Restoration in Mental Health after Visiting Urban Green Spaces, Who Is Most Affected? Comparison between Good/Poor Mental Health in Four European Cities. Environ. Res. 2023, 223, 115397. [Google Scholar] [CrossRef] [PubMed]
  5. Liu, Q.; Zhang, Y.; Lin, Y.; You, D.; Zhang, W.; Huang, Q.; van den Bosch, C.C.K.; Lan, S. The Relationship between Self-Rated Naturalness of University Green Space and Students’ Restoration and Health. Urban For. Urban Green. 2018, 34, 259–268. [Google Scholar] [CrossRef]
  6. Vujcic, M.; Tomicevic-Dubljevic, J.; Zivojinovic, I.; Toskovic, O. Connection between Urban Green Areas and Visitors’ Physical and Mental Well-Being. Urban For. Urban Green. 2019, 40, 299–307. [Google Scholar] [CrossRef]
  7. Van den Berg, M.; van Poppel, M.; van Kamp, I.; Andrusaityte, S.; Balseviciene, B.; Cirach, M.; Danileviciute, A.; Ellis, N.; Hurst, G.; Masterson, D.; et al. Visiting Green Space Is Associated with Mental Health and Vitality: A Cross-Sectional Study in Four European Cities. Health Place 2016, 38, 8–15. [Google Scholar] [CrossRef]
  8. Pietilä, M.; Neuvonen, M.; Borodulin, K.; Korpela, K.; Sievänen, T.; Tyrväinen, L. Relationships between Exposure to Urban Green Spaces, Physical Activity and Self-Rated Health. J. Outdoor Recreat. Tour. 2015, 10, 44–54. [Google Scholar] [CrossRef]
  9. Korpela, K.M.; Ylén, M.; Tyrväinen, L.; Silvennoinen, H. Favorite Green, Waterside and Urban Environments, Restorative Experiences and Perceived Health in Finland. Health Promot. Int. 2010, 25, 200–209. [Google Scholar] [CrossRef] [Green Version]
  10. Tomićević, J.; Živojinović, I.; Tijanić, A. Urban Forests and the Needs of Visitors: A Case Study of Košutnjak Park Forest, Serbia. Environ. Eng. Manag. J. 2017, 16, 2325–2335. [Google Scholar] [CrossRef]
  11. Mitchell, R.; Popham, F. Greenspace, Urbanity and Health: Relationships in England. J. Epidemiol. Community Health 2007, 61, 681–683. [Google Scholar] [CrossRef] [Green Version]
  12. Maas, J.; Verheij, R.A.; Groenewegen, P.P.; De Vries, S.; Spreeuwenberg, P. Green Space, Urbanity, and Health: How Strong Is the Relation? J. Epidemiol. Community Health 2006, 60, 587–592. [Google Scholar] [CrossRef] [Green Version]
  13. Babí Almenar, J.; Elliot, T.; Rugani, B.; Philippe, B.; Navarrete Gutierrez, T.; Sonnemann, G.; Geneletti, D. Nexus between Nature-Based Solutions, Ecosystem Services and Urban Challenges. Land Use Policy 2021, 100, 104898. [Google Scholar] [CrossRef]
  14. Pinto, L.V.; Inácio, M.; Ferreira, C.S.S.; Ferreira, A.D.; Pereira, P. Ecosystem Services and Well-Being Dimensions Related to Urban Green Spaces—A Systematic Review. Sustain. Cities Soc. 2022, 85, 104072. [Google Scholar] [CrossRef]
  15. Hansen, R.; Buizer, M.; Buijs, A.; Pauleit, S.; Mattijssen, T.; Fors, H.; van der Jagt, A.; Kabisch, N.; Cook, M.; Delshammar, T.; et al. Transformative or Piecemeal? Changes in Green Space Planning and Governance in Eleven European Cities. Eur. Plan. Stud. 2022, 1–24. [Google Scholar] [CrossRef]
  16. Nilsson, K.; Åkerlund, U.; Konijnendijk, C.C.; Alekseev, A.; Caspersen, O.H.; Guldager, S.; Kuznetsov, E.; Mezenko, A.; Selikhovkin, A. Implementing Urban Greening Aid Projects—The Case of St. Petersburg, Russia. Urban For. Urban Green. 2007, 6, 93–101. [Google Scholar] [CrossRef]
  17. Konijnendijk, C.C. Evidence-Based Guidelines for Greener, Healthier, More Resilient Neighbourhoods: Introducing the 3–30–300 Rule. J. For. Res. 2022. [Google Scholar] [CrossRef]
  18. Forest Research. Benefits of Green Infrastructure Report to Defra and CLG; Prepared by Land Regeneration and Urban Greenspace; Centre for Forestry and Climate Change, Forest Research: Farnham, UK, 2010. [Google Scholar]
  19. Derks, J.; Giessen, L.; Winkel, G. COVID-19-Induced Visitor Boom Reveals the Importance of Forests as Critical Infrastructure. For. Policy Econ. 2020, 118, 102253. [Google Scholar] [CrossRef]
  20. Da Schio, N.; Phillips, A.; Fransen, K.; Wolff, M.; Haase, D.; Ostoić, S.K.; Živojinović, I.; Vuletić, D.; Derks, J.; Davies, C.; et al. The Impact of the COVID-19 Pandemic on the Use of and Attitudes towards Urban Forests and Green Spaces: Exploring the Instigators of Change in Belgium. Urban For. Urban Green. 2021, 65, 127305. [Google Scholar] [CrossRef]
  21. Raymond, C.M.; Frantzeskaki, N.; Kabisch, N.; Berry, P.; Breil, M.; Nita, M.R.; Geneletti, D.; Calfapietra, C. A Framework for Assessing and Implementing the Co-Benefits of Nature-Based Solutions in Urban Areas. Environ. Sci. Policy 2017, 77, 15–24. [Google Scholar] [CrossRef]
  22. Picavet, H.S.J.; Milder, I.; Kruize, H.; de Vries, S.; Hermans, T.; Wendel-Vos, W. Greener Living Environment Healthier People?: Exploring Green Space, Physical Activity and Health in the Doetinchem Cohort Study. Prev. Med. 2016, 89, 7–14. [Google Scholar] [CrossRef]
  23. Sullivan, N.; Donnelly, A.; Macintyre, T.; Warrington, G. Investigating the Impact of Green Exercise on Population Health and Well-Being in a Small Community in Ireland: A Novel Approach Using a Natural Laboratory Ecosystem. Int. J. Environ. Health 2016, 18, 34–40. [Google Scholar] [CrossRef]
  24. Dallimer, M.; Irvine, K.N.; Skinner, A.M.J.; Davies, Z.G.; Rouquette, J.R.; Maltby, L.L.; Warren, P.H.; Armsworth, P.R.; Gaston, K.J. Biodiversity and the Feel-Good Factor: Understanding Associations between Self-Reported Human Well-Being and Species Richness. Bioscience 2012, 62, 47–55. [Google Scholar] [CrossRef] [Green Version]
  25. Hauru, K.; Lehvävirta, S.; Korpela, K.; Kotze, D.J. Closure of View to the Urban Matrix Has Positive Effects on Perceived Restorativeness in Urban Forests in Helsinki, Finland. Landsc. Urban Plan. 2012, 107, 361–369. [Google Scholar] [CrossRef]
  26. Lafortezza, R.; Carrus, G.; Sanesi, G.; Davies, C. Benefits and Well-Being Perceived by People Visiting Green Spaces in Periods of Heat Stress. Urban For. Urban Green. 2009, 8, 97–108. [Google Scholar] [CrossRef]
  27. Gascon, M.; Triguero-Mas, M.; Martínez, D.; Dadvand, P.; Forns, J.; Plasència, A.; Nieuwenhuijsen, M.J. Mental Health Benefits of Long-Term Exposure to Residential Green and Blue Spaces: A Systematic Review. Int. J. Environ. Res. Public Health 2015, 12, 4354–4379. [Google Scholar] [CrossRef] [Green Version]
  28. James, P.; Banay, R.F.; Hart, J.E.; Laden, F. A Review of the Health Benefits of Greenness. Curr. Epidemiol. Rep. 2015, 2, 131–142. [Google Scholar] [CrossRef] [Green Version]
  29. Triguero-Mas, M.; Dadvand, P.; Cirach, M.; Martínez, D.; Medina, A.; Mompart, A.; Basagaña, X.; Gražulevičiene, R.; Nieuwenhuijsen, M.J. Natural Outdoor Environments and Mental and Physical Health: Relationships and Mechanisms. Environ. Int. 2015, 77, 35–41. [Google Scholar] [CrossRef] [Green Version]
  30. De Vries, S.; van Dillen, S.M.E.; Groenewegen, P.P.; Spreeuwenberg, P. Streetscape Greenery and Health: Stress, Social Cohesion and Physical Activity as Mediators. Soc. Sci. Med. 2013, 94, 26–33. [Google Scholar] [CrossRef] [Green Version]
  31. White, M.P.; Alcock, I.; Wheeler, B.W.; Depledge, M.H. Would You Be Happier Living in a Greener Urban Area? A Fixed-Effects Analysis of Panel Data. Psychol. Sci. 2013, 24, 920–928. [Google Scholar] [CrossRef]
  32. Dzhambov, A.; Hartig, T.; Markevych, I.; Tilov, B.; Dimitrova, D. Urban Residential Greenspace and Mental Health in Youth: Different Approaches to Testing Multiple Pathways Yield Different Conclusions. Environ. Res. 2018, 160, 47–59. [Google Scholar] [CrossRef]
  33. Dadvand, P.; Villanueva, C.M.; Font-Ribera, L.; Martinez, D.; Basagaña, X.; Belmonte, J.; Vrijheid, M.; Gražulevičienė, R.; Kogevinas, M.; Nieuwenhuijsen, M.J. Risks and Benefits of Green Spaces for Children: A Cross-Sectional Study of Associations with Sedentary Behavior, Obesity, Asthma, and Allergy. Environ. Health Perspect. 2014, 122, 1329–1335. [Google Scholar] [CrossRef]
  34. Sugiyama, T.; Francis, J.; Middleton, N.J.; Owen, N.; Giles-corti, B. Associations Between Recreational Walking and Attractiveness, Size, and Proximity of Neighborhood Open Spaces. Am. J. Public Health 2010, 100, 1752–1757. [Google Scholar] [CrossRef]
  35. Annerstedt, M.; Östergren, P.; Björk, J.; Grahn, P.; Skärbäck, E.; Währborg, P. Green Qualities in the Neighbourhood and Mental Health–Results from a Longitudinal Cohort Study in Southern Sweden. BMC Public Health 2012, 12, 1. [Google Scholar] [CrossRef] [Green Version]
  36. Duncan, D.; Kawachi, I.; Subramanian, S.V.; Aldstadt, J.; Melly, S.; Williams, D. Examination of How Neighborhood Definition Influences Measurements of Youths’ Access to Tobacco Retailers: A Methodological Note on Spatial Misclassification. Am. J. Epidemiol. 2014, 179, 373–381. [Google Scholar] [CrossRef] [Green Version]
  37. Krajter Ostoić, S.; Konijnendijk van den Bosch, C.C.; Vuletić, D.; Stevanov, M.; Živojinović, I.; Mutabdžija-Bećirović, S.; Lazarević, J.; Stojanova, B.; Blagojević, D.; Stojanovska, M.; et al. Citizens’ Perception of and Satisfaction with Urban Forests and Green Space: Results from Selected Southeast European Cities. Urban For. Urban Green. 2017, 23, 93–103. [Google Scholar] [CrossRef]
  38. Carrus, G.; Scopelliti, M.; Lafortezza, R.; Colangelo, G.; Ferrini, F.; Salbitano, F.; Agrimi, M.; Portoghesi, L.; Semenzato, P.; Sanesi, G. Go Greener, Feel Better? The Positive Effects of Biodiversity on the Well-Being of Individuals Visiting Urban and Peri-Urban Green Areas. Landsc. Urban Plan. 2015, 134, 221–228. [Google Scholar] [CrossRef]
  39. Hazeu, G.W.; Schuiling, C.; Dorland, G.J.; Roerink, G.J.; Naeff, H.S.D.; Smidt, R.A. Landelijk Grondgebruiksbestand Nederland; Alterra-Rapport 2548; Alterra, Wageningen-UR: Wageningen, The Netherlands, 2014; Volume 7. [Google Scholar]
  40. López-Mosquera, N.; Sánchez, M. Cognitive and Affective Determinants of Satisfaction, Willingness to Pay, and Loyalty in Suburban Parks. Urban For. Urban Green. 2014, 13, 375–384. [Google Scholar] [CrossRef]
  41. Hofmann, M.; Westermann, J.R.; Kowarik, I.; der Meer, E. Perceptions of Parks and Urban Derelict Land by Landscape Planners and Residents. Urban For. Urban Green. 2012, 11, 303–312. [Google Scholar] [CrossRef]
  42. Akpinar, A. How Is Quality of Urban Green Spaces Associated with Physical Activity and Health? Urban For. Urban Green. 2016, 16, 76–83. [Google Scholar] [CrossRef]
  43. Wyles, K.J.; White, M.P.; Hattam, C.; Pahl, S.; King, H.; Austen, M. Are Some Natural Environments More Psychologically Beneficial Than Others? The Importance of Type and Quality on Connectedness to Nature and Psychological Restoration. Environ. Behav. 2019, 51, 111–143. [Google Scholar] [CrossRef]
  44. Wood, E.; Harsant, A.; Dallimer, M.; Cronin de Chavez, A.; Mceachan, R.R.C.; Hassall, C.; Wolf, K.L.; Barthel, S. Not All Green Space Is Created Equal: Biodiversity Predicts Psychological Restorative Benefits From Urban Green Space. Front. Psychol. 2018, 9, 2320. [Google Scholar] [CrossRef] [PubMed] [Green Version]
  45. Cracknell, D.; White, M.P.; Pahl, S.; Nichols, W.J.; Depledge, M.H. Marine Biota and Psychological Examination of Dose–Response Effects in an Aquarium Setting. Environ. Behav. 2016, 48, 1242–1269. [Google Scholar] [CrossRef] [PubMed]
  46. Lindemann-Matthies, P.; Junge, X.; Matthies, D. The Influence of Plant Diversity on People’s Perception and Aesthetic Appreciation of Grassland Vegetation. Biol. Conserv. 2010, 143, 195–202. [Google Scholar] [CrossRef] [Green Version]
  47. Fuller, R.A.; Irvine, K.N.; Devine-Wright, P.; Warren, P.H.; Gaston, K.J. Psychological Benefits of Greenspace Increase with Biodiversity. Biol. Lett. 2007, 3, 390–394. [Google Scholar] [CrossRef] [Green Version]
  48. Wyles, K.J.; Pahl, S.; Thomas, K.; Thompson, R.C. Factors That Can Undermine the Psychological Benefits of Coastal Environments: Exploring the Effect of Tidal State, Presence, and Type of Litter. Environ. Behav. 2016, 48, 1095–1126. [Google Scholar] [CrossRef] [Green Version]
  49. Maguire, G.S.; Miller, K.K.; Weston, M.A.; Young, K. Being beside the Seaside: Beach Use and Preferences among Coastal Residents of South-Eastern Australia. Ocean Coast. Manag. 2011, 54, 781–788. [Google Scholar] [CrossRef]
  50. Pretty, J.; Peacock, J.; Sellens, M.; Griffin, M. The Mental and Physical Health Outcomes of Green Exercise. Int. J. Environ. Health Res. 2005, 15, 319–337. [Google Scholar] [CrossRef]
  51. Zhang, Y.; Van den Berg, A.E.; Van Dijk, T.; Weitkamp, G. Quality over Quantity: Contribution of Urban Green Space to Neighborhood Satisfaction. Int. J. Environ. Res. Public Health 2017, 14, 535. [Google Scholar] [CrossRef]
  52. Almanza, E.; Jerrett, M.; Dunton, G.; Seto, E.; Ann, M. Health & Place A Study of Community Design, Greenness, and Physical Activity in Children Using Satellite, GPS and Accelerometer Data. Health Place 2012, 18, 46–54. [Google Scholar] [CrossRef] [Green Version]
  53. Rugel, E.J.; Henderson, S.B.; Carpiano, R.M.; Brauer, M. Beyond the Normalized Di Ff Erence Vegetation Index (NDVI): Developing a Natural Space Index for Population-Level Health Research. Environ. Res. 2017, 159, 474–483. [Google Scholar] [CrossRef]
  54. Wellmann, T.; Lausch, A.; Andersson, E.; Knapp, S.; Cortinovis, C.; Jache, J.; Scheuer, S.; Kremer, P.; Mascarenhas, A.; Kraemer, R.; et al. Remote Sensing in Urban Planning: Contributions towards Ecologically Sound Policies? Landsc. Urban Plan. 2020, 204, 103921. [Google Scholar] [CrossRef]
  55. Labib, S.M.; Lindley, S.; Huck, J.J. Spatial Dimensions of the Influence of Urban Green-Blue Spaces on Human Health: A Systematic Review. Environ. Res. 2020, 180, 108869. [Google Scholar] [CrossRef]
  56. Bilgili, C.; Satir, O.; Müftüoğlu, V. Using NDVI Values for Comparing Parks in Different Scales. J. Food Agric. Environ. 2013, 1111, 2451–2457. [Google Scholar]
  57. Bilgili, C.; Satir, O.; Müftüoğlu, V.; Özyavuz, M. A Simplified Method For The Determination And Monitoring of Green Areas In Urban Parks Using Multispectral Vegetation Indices. J. Environ. Prot. Ecol. 2014, 15, 1059–1065. [Google Scholar]
  58. Su, J.G.; Dadvand, P.; Nieuwenhuijsen, M.J.; Bartoll, X.; Jerrett, M. Associations of Green Space Metrics with Health and Behavior Outcomes at Different Buffer Sizes and Remote Sensing Sensor Resolutions. Environ. Int. 2019, 126, 162–170. [Google Scholar] [CrossRef]
  59. Wood, L.; Hooper, P.; Foster, S.; Bull, F. Public Green Spaces and Positive Mental Health-Investigating the Relationship between Access, Quantity and Types of Parks and Mental Wellbeing. Health Place 2017, 48, 63–71. [Google Scholar] [CrossRef]
  60. Hooper, P.; Boruff, B.; Beesley, B.; Badland, H.; Giles-Corti, B. Testing Spatial Measures of Public Open Space Planning Standards with Walking and Physical Activity Health Outcomes: Findings from the Australian National Liveability Study. Landsc. Urban Plan. 2018, 171, 57–67. [Google Scholar] [CrossRef]
  61. Markevych, I.; Schoierer, J.; Hartig, T.; Chudnovsky, A.; Hystad, P.; Dzhambov, A.M.; de Vries, S.; Triguero-Mas, M.; Brauer, M.; Nieuwenhuijsen, M.J.; et al. Exploring Pathways Linking Greenspace to Health: Theoretical and Methodological Guidance. Environ. Res. 2017, 158, 301–317. [Google Scholar] [CrossRef]
  62. Labib, S.M.; Harris, A. The Potentials of Sentinel-2 and LandSat-8 Data in Green Infrastructure Extraction, Using Object Based Image Analysis (OBIA) Method. Eur. J. Remote Sens. 2018, 51, 231–240. [Google Scholar] [CrossRef]
  63. European Commission. Towards an EU Research and Innovation Policy Agenda for Nature-Based Solutions & Re-Naturing Cities. Final Report of the Horizon 2020 Expert Group on Nature-Based Solutions and Re-Naturing Cities; European Commission: Brussels, Belgium, 2015. [Google Scholar]
  64. Fors, H.; Molin, J.F.; Murphy, M.A.; Konijnendijk van den Bosch, C. User Participation in Urban Green Spaces—For the People or the Parks? Urban For. Urban Green. 2015, 14, 722–734. [Google Scholar] [CrossRef] [Green Version]
  65. Zhang, L.; Tan, P.Y.; Gan, D.R.Y.; Samsudin, R. Assessment of Mediators in the Associations between Urban Green Spaces and Self-Reported Health. Landsc. Urban Plan. 2022, 226, 104503. [Google Scholar] [CrossRef]
  66. Dadvand, P.; Tischer, C.; Estarlich, M.; Llop, S.; Dalmau-Bueno, A.; López-Vicente, M.; Valentín, A.; de Keijzer, C.; Fernández-Somoano, A.; Lertxundi, N.; et al. Lifelong Residential Exposure to Green Space and Attention: A Population-Based Prospective Study. Environ. Health Perspect. 2017, 125, 97016. [Google Scholar] [CrossRef] [PubMed] [Green Version]
  67. Službeni list grada Beograda. In General Regulation Plan, in Serbian: Plan Generalne Regulacije; City of Belgrade, Secretary for information: Belgrade, Serbia, 2019.
  68. Bankovic, S. Methods and Techniques of Scientific Work (in Serbian); Faculty of Forestry, University of Belgrade, Zavod za udžbenike i nastavna sredstva: Belgrade, Serbia, 2003. [Google Scholar]
  69. Tomicevic, J. Towards Participatory Management: Linking People, Resources and Management. A Socio-Economic Study of Tara National Park. Culterra Schriftenreihe des Instituts für Landespflege der Albert-Ludwigs-Universität Freiburg; Universität Freiburg: Freiburg, Germany, 2005; Die Deutsche Bibliothek—CIP-Einheitsaufnahme; ISBN 3933390303. [Google Scholar]
  70. White, M.P.; Alcock, I.; Grellier, J.; Wheeler, B.W.; Hartig, T.; Warber, S.L.; Bone, A.; Depledge, M.H.; Fleming, L.E. Spending at Least 120 Minutes a Week in Nature Is Associated with Good Health and Wellbeing. Sci. Rep. 2019, 9, 7730. [Google Scholar] [CrossRef] [PubMed] [Green Version]
  71. Official Gazette of the City of Belgrade. The General Regulation Plan of the System of Green Areas of Belgrade; Official Gazette of the City of Belgrade, Urbanistički zavod Beograda: Belgrade, Serbia, 2019. [Google Scholar]
  72. City Institute for Public Health. A Statistical Review of Healthcare Activity in the City of Belgrade for 2012; City Institute for Public Health: Belgrade, Serbia, 2013. [Google Scholar]
  73. City Institute for Public Health; Secretariat for Environmental Protection. Quality Analysis of the Environment of the City of Belgrade for 2011; City Institute for Public Health, Secretariat for Environmental Protection: Belgrade, Serbia, 2012; ISBN 978-86-7550-067-4. [Google Scholar]
  74. Blagojević, B. Zagađena Životna Sredina i Lekvoite Biljke; Fakultet Zaštite na Radu: Niš, Serbia, 2003. [Google Scholar]
  75. Vujcic, M.; Tomicevic-Dubljevic, J.; Obratov-Petkovic, D.; Ocokoljic, M. Influence of medical plants on human health and urban environment. Agricult. For. 2015, 61, 219–226. [Google Scholar] [CrossRef] [Green Version]
  76. Sanz, E.; Saa-Requejo, A.; Díaz-Ambrona, C.H.; Ruiz-Ramos, M.; Rodríguez, A.; Iglesias, E.; Esteve, P.; Soriano, B.; Tarquis, A.M. Normalized Difference Vegetation Index Temporal Responses to Temperature and Precipitation in Arid Rangelands. Remote Sens. 2021, 13, 840. [Google Scholar] [CrossRef]
  77. Shumway, R.; Stoffer, D. Time Series Analysis and Its Applications with R Examples; Springer: New York, NY, USA, 2011; Volume 9, ISBN 978-1-4419-7864-6. [Google Scholar]
  78. Cao, R.; Chen, J.; Shen, M.; Tang, Y. An Improved Logistic Method for Detecting Spring Vegetation Phenology in Grasslands from MODIS EVI Time-Series Data. Agric. For. Meteorol. 2015, 200, 9–20. [Google Scholar] [CrossRef]
  79. Hird, J.N.; McDermid, G.J. Noise Reduction of NDVI Time Series: An Empirical Comparison of Selected Techniques. Remote Sens. Environ. 2009, 113, 248–258. [Google Scholar] [CrossRef]
  80. Hermance, J.F. Stabilizing High-order, Non-classical Harmonic Analysis of NDVI Data for Average Annual Models by Damping Model Roughness. Int. J. Remote Sens. 2007, 28, 2801–2819. [Google Scholar] [CrossRef]
  81. Beck, P.S.A.; Atzberger, C.; Høgda, K.A.; Johansen, B.; Skidmore, A.K. Improved Monitoring of Vegetation Dynamics at Very High Latitudes: A New Method Using MODIS NDVI. Remote Sens. Environ. 2006, 100, 321–334. [Google Scholar] [CrossRef]
  82. WHO. WHO Global Air Quality Guidelines. Coast. Estuar. Process. 2021, 1–360. [Google Scholar]
  83. Héroux, M.E.; Babisch, W.; Belojevic, G.; Brink, M.; Janssen, S.; Lercher, P.; Paviotti, M.; Pershagen, G.; Waye, K.P.; Preis, A.; et al. WHO Environmental Noise Guidelines for the European Region. Euronoise 2015, 2015, 2589–2593. [Google Scholar]
  84. Jansen, M.; Ettema, D.; Kamphuis, C.; Pierik, F.H.; Dijst, M. How Do Type and Size of Natural Environments Relate to Physical Activity Behavior? Health Place 2017, 46, 73–81. [Google Scholar] [CrossRef]
  85. Schmidt, C.W. Not All Greenness Is the Same: Associations with Health Are More Nuanced than We Thought. Environ. Health Perspect. 2022, 130, 64001. [Google Scholar] [CrossRef]
  86. Cutts, B.B.; Darby, K.J.; Boone, C.G.; Brewis, A. City Structure, Obesity, and Environmental Justice: An Integrated Analysis of Physical and Social Barriers to Walkable Streets and Park Access. Soc. Sci. Med. 2009, 69, 1314–1322. [Google Scholar] [CrossRef]
  87. Kaczynski, A.T.; Besenyi, G.M.; Stanis, S.A.W.; Koohsari, M.J.; Oestman, K.B.; Bergstrom, R.; Potwarka, L.R.; Reis, R.S. Are Park Proximity and Park Features Related to Park Use and Park-Based Physical Activity among Adults ? Variations by Multiple Socio-Demographic Characteristics. Int. J. Behav. Nutr. Phys. Act. 2014, 11, 1–14. [Google Scholar] [CrossRef] [Green Version]
  88. Kim, J.-H.; Lee, C.; Sohn, W. Urban Natural Environments, Obesity, and Health-Related Quality of Life among Hispanic Children Living in Inner-City Neighborhoods. Int. J. Environ. Res. Public Health 2016, 13, 121. [Google Scholar] [CrossRef] [Green Version]
  89. Stewart, O.T.; Moudon, A.V.; Littman, A.J.; Seto, E.; Saelens, B.E. Why Neighborhood Park Proximity Is Not Associated with Total Physical Activity. Health Place 2018, 52, 163–169. [Google Scholar] [CrossRef]
  90. Chaix, B.; Merlo, J.; Evans, D.; Leal, C.; Havard, S. Neighbourhoods in Eco-Epidemiologic Research: Delimiting Personal Exposure Areas. A Response to Riva, Gauvin, Apparicio and Brodeur. Soc. Sci. Med. 2009, 69, 1306–1310. [Google Scholar] [CrossRef]
  91. Arnberger, A.; Eder, R. Are Urban Visitors’ General Preferences for Green-Spaces Similar to Their Preferences When Seeking Stress Relief? Urban For. Urban Green. 2015, 14, 872–882. [Google Scholar] [CrossRef]
  92. Bjerke, T.; Østdahl, T.; Thrane, C.; Strumse, E. Vegetation Density of Urban Parks and Perceived Appropriateness for Recreation. Urban For. Urban Green. 2006, 5, 35–44. [Google Scholar] [CrossRef]
  93. Bullock, C. The Benefits of urban green space and the built environment—an economic perspective. In Special Issue 18th IAPS-Conference; IAPS: Vienna, Austria, 2004; pp. 27–34. [Google Scholar]
  94. Stewart, T.; Duncan, S.; Chaix, B.; Kestens, Y.; Schipperijn, J.; Schofield, G. A Novel Assessment of Adolescent Mobility: A Pilot Study. Int. J. Behav. Nutr. Phys. Act. 2015, 12, 18. [Google Scholar] [CrossRef] [PubMed] [Green Version]
  95. Dadvand, P.; Sunyer, J.; Basagaña, X.; Ballester, F.; Lertxundi, A.; Fernández-Somoano, A.; Estarlich, M.; García-Esteban, R.; Mendez, M.A.; Nieuwenhuijsen, M.J. Surrounding Greenness and Pregnancy Outcomes in Four Spanish Birth Cohorts. Environ. Health Perspect. 2012, 120, 1481–1487. [Google Scholar] [CrossRef] [PubMed]
  96. Kardan, O.; Gozdyra, P.; Misic, B.; Moola, F.; Palmer, L.J.; Paus, T.; Berman, M.G. Neighborhood Greenspace and Health in a Large Urban Center. Sci. Rep. 2015, 5, 11610. [Google Scholar] [CrossRef] [PubMed] [Green Version]
Figure 1. Study location and aerial photography of parks from 4 municipalities.
Forests 14 00765 g001
Table 1. Study areas with main characteristics.
MunicipalityNo. of RespondentsName of the ParkTypeSize (ha)
Savski venac105ManježNeighborhood park2.6
Hajd parkCity park6.2
Topčider parkCentral city park10.7
Stari grad100Pionir parkCity park3.3
Park KalemegdanCentral city park49.6
Devojački parkSmall park0.3
Voždovac100Voždovac parkNeighborhood park1.9
Park ŠumiceCentral city park14.3
Banjica forestUrban forest39.6
Zvezdara100Park Ćirilo i MetodijeNeighborhood park1.9
Park Slavujev potokSmall park1.2
Zvezdara forestUrban forest107
Table 2. Secondary environmental and related health data per municipality and data on green areas per municipality in relation to the total area.
MunicipalitiesAir Quality → Respiratory Disorders *Soundscapes → Nervous Disorders *Green AreasDivision of Municipalities
CO (3 mg/m³) **SO2 (50 µg/m³) **NO2 (40 µg/m³) **Respiratory Disorders (%)Day (55–65 dBA) **Night (45–55 dBA) **Nervous Disorders (%)Green Areas (m2)Green Areas (%)
Savski venac7.36133.8105.2~1007369121,561,245.240.2Less green municipalities
Stari grad7.12144.8103.78474605919,038.010.1
Zvezdara5.94108.896.33969662,219,126,665.162.4Green municipalities
Voždovac5.2477.984.95866572,35,326,673.640.7
* Source: official reports published by the City Institute for Public Health [72] (CIPH, 2013) and the Secretariat for Environmental Protection [73] (SEP, 2012); ** maximum concentrations proposed by the City Institute for Public Health.
Table 3. Descriptive statistics for significant variables (list of all variables is in Table S3).
Descriptive Statistics of Significant Tested VariablesSignificance of Differences between Means (Only Those That Showed Significant Value)
MunicipalityNMeanStd. DeviationStd. Error Mean tDfSig.
self-estimated health characteristicshealth totalLess green mun.2054.08940.921850.06438Eq. var. ass.5.1934030.000
Green mun.2003.65670.743410.05257Eq. var. not ass.5.207389.2910.000
physical healthLess green mun.2054.171.0170.071Eq. var. ass.4.1314030.000
Green mun.2003.741.1050.078Eq. var. not ass.4.126398.4100.000
emotional healthLess green mun.2053.971.1500.080Eq. var. ass.5.6894030.000
Green mun.2003.331.1340.080Eq. var. not ass.5.690402.9550.000
social healthLess green mun.2054.131.1900.083Eq. var. ass.1.9574030.051
Green mun.2003.911.0330.073Eq. var. not ass.1.960397.6810.051
recreational aspectcommon activitiesLess green mun.2053.211.3730.096Eq. var. ass.−2.3714030.018
Green mun.2003.521.1650.082Eq. var. not ass.−2.376395.4040.018
facilitiesbenchesLess green mun.2053.681.1860.083Eq. var. ass.1.9674030.050
Green mun.2003.461.0930.077Eq. var. not ass.1.969401.7060.050
lawnLess green mun.2053.881.0740.075Eq. var. ass.3.3084030.001
Green mun.2003.521.1340.080Eq. var. not ass.3.306400.4810.001
pathsLess green mun.2054.620.6420.045Eq. var. ass.7.6844030.000
Green mun.2003.971.0320.073Eq. var. not ass.7.642331.5870.000
greeneryLess green mun.1354.300.8650.074Eq. var. ass.8.7883330.000
Green mun.2003.131.3680.097Eq. var. not ass.9.555331.6900.000
water
elements
Less green mun.2054.27.8470.059Eq. var. ass.3.9254030.000
Green mun.2003.901.0580.075Eq. var. not ass.3.914380.4560.000
landscapes
and views
Less green mun.2053.850.8700.061Eq. var. ass.−3.2014030.001
Green mun.2004.130.8980.064Eq. var. not ass.−3.199401.6870.001
personal preferencesoutdoorsLess green mun.2053.371.1320.079Eq. var. ass.8.4094030.000
Green mun.2002.500.9400.066Eq. var. not ass.8.428393.0340.000
Bolded values—values of t-test significant on p < 0.05 level.
Table 4. Analysis of variance for the amount of money spent monthly per municipality.
ANOVA
Municipality Mean DifferenceStd. ErrorSig.95% Confidence Interval
Lower BoundUpper Bound
VoždovacZvezdara−187.00000146.474220.743−574.2916200.2916
Savski venac−135.00476144.719980.926−517.6579247.6484
Stari grad−415.00000 *146.474220.029−802.2916−27.7084
ZvezdaraVoždovac187.00000146.474220.743−200.2916574.2916
Savski venac51.99524144.719981.000−330.6579434.6484
Stari grad−228.00000146.474220.537−615.2916159.2916
Savski venacVoždovac135.00476144.719980.926−247.6484517.6579
Zvezdara−51.99524144.719981.000−434.6484330.6579
Stari grad−279.99524144.719980.282−662.6484102.6579
Stari gradVoždovac415.00000 *146.474220.02927.7084802.2916
Zvezdara228.00000146.474220.537−159.2916615.2916
Savski venac279.99524144.719980.282−102.6579662.6484
* The mean difference is significant at the 0.05 level.
Table 5. The z score for 2 parameters (amount of money spent on medications monthly and doctor visits yearly) for all municipalities.
Descriptive Statistics
MunicipalitiesNMeanStd. Std. Er.95% Confidence Interval for MeanMinimumMaximum
Lower BoundUpper Bound
Voždovac100−0.100.600.06−0.220.01−0.901.31
Zvezdara1000.030.780.07−0.120.18−0.902.41
Savski venac105−0.070.940.09−0.250.10−0.903.85
Stari grad1000.141.000.10−0.040.34−0.903.40
Total4050.000.850.04−0.080.08−0.903.85
Table 6. Analysis of variance for the NDVI values per municipality.
ANOVA
Municipality Mean DifferenceStd. ErrorSig.95% Confidence Interval
Lower BoundUpper Bound
VoždovacZvezdara0.12143 *0.019000.0000.07110.1718
Savski venac0.06659 *0.019000.0030.01630.1169
Stari grad0.15226 *0.019000.0000.10190.2026
ZvezdaraVoždovac−0.12143 *0.019000.000−0.1718−0.0711
Savski venac−0.05484 *0.019000.025−0.1052−0.0045
Stari grad0.030830.019000.488−0.01950.0812
Savski venacVoždovac−0.06659 *0.019000.003−0.1169−0.0163
Zvezdara0.05484 *0.019000.0250.00450.1052
Stari grad0.08567 *0.019000.0000.03530.1360
Stari gradVoždovac−0.15226 *0.019000.000−0.2026−0.1019
Zvezdara−0.030830.019000.488−0.08120.0195
Savski venac−0.08567 *0.019000.000−0.1360−0.0353
* The mean difference is significant at the 0.05 level.
Table 7. Analysis of variance for the EVI values per municipality.
ANOVA
Municipality Mean DifferenceStd. ErrorSig.95% Confidence Interval
Lower BoundUpper Bound
VoždovacZvezdara 0.21299 * 0.06392 0.012 0.0333 0.3926
Savski venac 0.16466 0.06392 0.087 −0.0150 0.3443
Stari grad 0.20617 * 0.06392 0.017 0.0265 0.3858
ZvezdaraVoždovac −0.21299 * 0.06392 0.012 −0.3926 −0.0333
Savski venac −0.04832 0.06392 0.903 −0.2280 0.1313
Stari grad −0.00682 0.06392 1.000 −0.1865 0.1728
Savski venacVoždovac −0.16466 0.06392 0.087 −0.3443 0.0150
Zvezdara 0.04832 0.06392 0.903 −0.1313 0.2280
Stari grad 0.04151 0.06392 0.936 −0.1381 0.2211
Stari gradVoždovac −0.20617 * 0.06392 0.017 −0.3858 −0.0265
Zvezdara 0.00682 0.06392 1.000 −0.1728 0.1865
Savski venac −0.04151 0.06392 0.936 −0.2211 0.1381
* The mean difference is significant at the 0.05 level.
Disclaimer/Publisher’s Note: The statements, opinions and data contained in all publications are solely those of the individual author(s) and contributor(s) and not of MDPI and/or the editor(s). MDPI and/or the editor(s) disclaim responsibility for any injury to people or property resulting from any ideas, methods, instructions or products referred to in the content.

