


Plant Traits Variably Respond to Plant–Soil Interactions during Secondary Succession on the Loess Plateau
by
 ,
,
Zemin Ai
1,
Jiayi Li
1,
Xinghua Li
1,
Jiaoyang Zhang
2,
Hongfei Liu
3,4,
Hongwei Xu
3,4,
Guobin Liu
3,4 and
Sha Xue
3,4,* 1
College of Geomatics, Xi’an University of Science and Technology, Xi’an 710054, China
2
School of Resources and Environment, Anhui Agricultural University, Hefei 230036, China
3
State Key Laboratory of Soil Erosion and Dryland Farming on the Loess Plateau, Institute of Soil and Water Conservation, Northwest A&F University, Xianyang 712100, China
4
Institute of Soil and Water Conservation, Chinese Academy of Sciences & Ministry of Water Resources, Xianyang 712100, China
*
Author to whom correspondence should be addressed.
Forests 2023, 14(4), 726; https://doi.org/10.3390/f14040726
Submission received: 28 February 2023
/
Revised: 29 March 2023
/
Accepted: 31 March 2023
/
Published: 1 April 2023
(This article belongs to the Topic Plants Nutrients)
Abstract
:Knowledge of plant photosynthesis, biomass, and stress resistance could contribute to exploring the growth and restoration of vegetation. However, the response of these plant traits to plant–soil interactions at different successional stages remains poorly understood, which limits the understanding of secondary succession. A greenhouse experiment was designed to test the effects of rhizosphere soils collected from early- (EarlySoil), mid- (MidSoil), and late-successional (LateSoil) plant communities on plant traits of early-, mid-, and late-successional species (EarlySp, MidSp, and LateSp, respectively). We found that plant traits reacted in a specific direction to plant–soil interactions at different successional stages. Specifically, compared with treatments of plants growing in their own soil, the net photosynthetic rate and single-photon avalanche diode significantly increased in LateSp–EarlySoil (treatment of plants growing in soil) (20%–31%) and LateSp–MidSoil (10%–18%); the maximum quantum efficiency of photosystem II increased in MidSp–EarlySoil (1%) and LateSp–MidSoil (4%); belowground soluble sugar concentrations decreased in LateSp–EarlySoil (33%) and LateSp–MidSoil (45%); leaf, stem, and root biomass increased in MidSp–EarlySoil (76%–123%), LateSp–EarlySoil (180%–342%), and LateSp–MidSoil (83%–137%), and in turn they decreased in EarlySp–MidSoil (40%–73%) and EarlySp–LateSoil (53%–67%). The results indicated that soil conditioned by pre-successional species (early- or mid-successional species) would be conducive to plant functional traits of subsequent successional species (mid- or late-successional species). Constrained redundancy analysis and path analysis suggested that water-soluble ammonium N, total N, and available N concentrations were key soil factors affecting early-, mid-, and late-successional species, respectively. Our findings confirm the directionality of succession and provide new information for plant population dynamics during secondary succession.
1. Introduction
Secondary succession is a process of ecological succession, which pre-existing communities have been disturbed or destroyed, and then are replaced by subsequent species. During secondary succession, changes in soil properties affect plant growth [1]. This effect is known as plant–soil interaction, which refers to the changes in soil properties induced by plants, which, in turn, affect the growth of subsequent plant [2]. Previous studies have investigated the relationship between plant biomass and plant–soil interactions at different successional stages, and found that early-successional species biomass decreased but late-successional species biomass increased when species growing in foreign soil conditions compared with in their own soil conditions [3]. The effects of plant–soil interactions on plant functional traits have been extensively studied. However, most of the emphasis has been on plant biomass, with less attention given to other functional traits that can affect plant growth, which limits our prediction of plant community dynamics during secondary succession.
Leaf photosynthetic capacity is a useful tool to assess plant competitiveness and adaptability [4], and reflects the response of plants to different soil conditions [5,6,7]. For instance, rapid plant growth and biomass accumulation are facilitated by a high photosynthetic capacity of plants under suitable soil conditions [5]. Non-structural carbohydrates (NSCs) are the ultimate products of photosynthesis and mainly include soluble sugars and starch. NSCs are crucial for the growth and physiological activities of plants [8] and are associated with integrated defense mechanisms in plants. Previous studies showed that NSC concentrations increased to enhance plant resistance when plants were exposed to environmental stresses [9,10]. The soil environment influences photosynthesis, growth rate and yield of plants [11,12]. Therefore, it is crucial to explore the response of plant functional traits to plant–soil interactions during secondary succession, especially photosynthetic characteristics and NSC content.
Soil nutrients and microbial characteristics are two important factors affecting plant growth [13,14]. Microorganisms are commonly found in plant rhizosphere soil, and affect plant growth directly through reciprocity or pathogenicity, and indirectly through their involvement in nutrient regulation [2,15]. Soil nutrient status is a crucial limiting factor for vegetation growth [16], particularly nitrogen (N) and phosphorus (P) in arid and semi-arid regions [16,17]. Previous studies have shown that soil N influences tree leaf traits and explains their variation well [18]. The effects of soil N on leaf traits of herbaceous plants have also been demonstrated [19]. Additionally, N plays a vital role in ecosystem material cycling, limiting net primary production (NPP) in terrestrial ecosystems, and influencing patterns of secondary succession [20]. Therefore, identifying the main soil factors affecting plant traits can aid in understanding the mechanisms underlying plant–soil interactions during secondary succession.
In this study, we aimed to investigate the response of plant functional traits to plant–soil interactions during secondary succession. To achieve this, we conducted a greenhouse experiment using rhizospheric soil collected from pure early-, mid-, and late-successional communities. Previous research has shown that soil conditioned by pre-successional species (mid- or early-successional species) tends to promote the growth of subsequent successional species (late- or mid-successional species), potentially accelerating species replacement. Conversely, soil conditioned by subsequent successional species tends to inhibit the growth of pre-successional species, potentially reducing species competitiveness, slowing species replacement, and stabilizing communities [2,3,21]. Based on these findings, our hypothesis 1 was that the photosynthetic characteristics and biomasses of subsequent successional species would be promoted when grown in soil conditioned by pre-successional species, and vice versa. Additionally, our hypothesis 2 was that non-structural carbohydrate concentration, a key factor in plant stress resistance, would be affected by plant–soil interactions. We expected that NSC concentrations of subsequent successional species would be reduced when grown in soil conditioned by pre-successional species, and vice versa. We will also explore the main soil nutrient factors that affect plant traits during secondary succession to explain the mechanisms underlying the changes in plant traits. Therefore, revealing the main soil nutrient factors affecting plant traits can help explain the underlying mechanisms of plant–soil interactions during secondary succession.
2. Materials and Methods
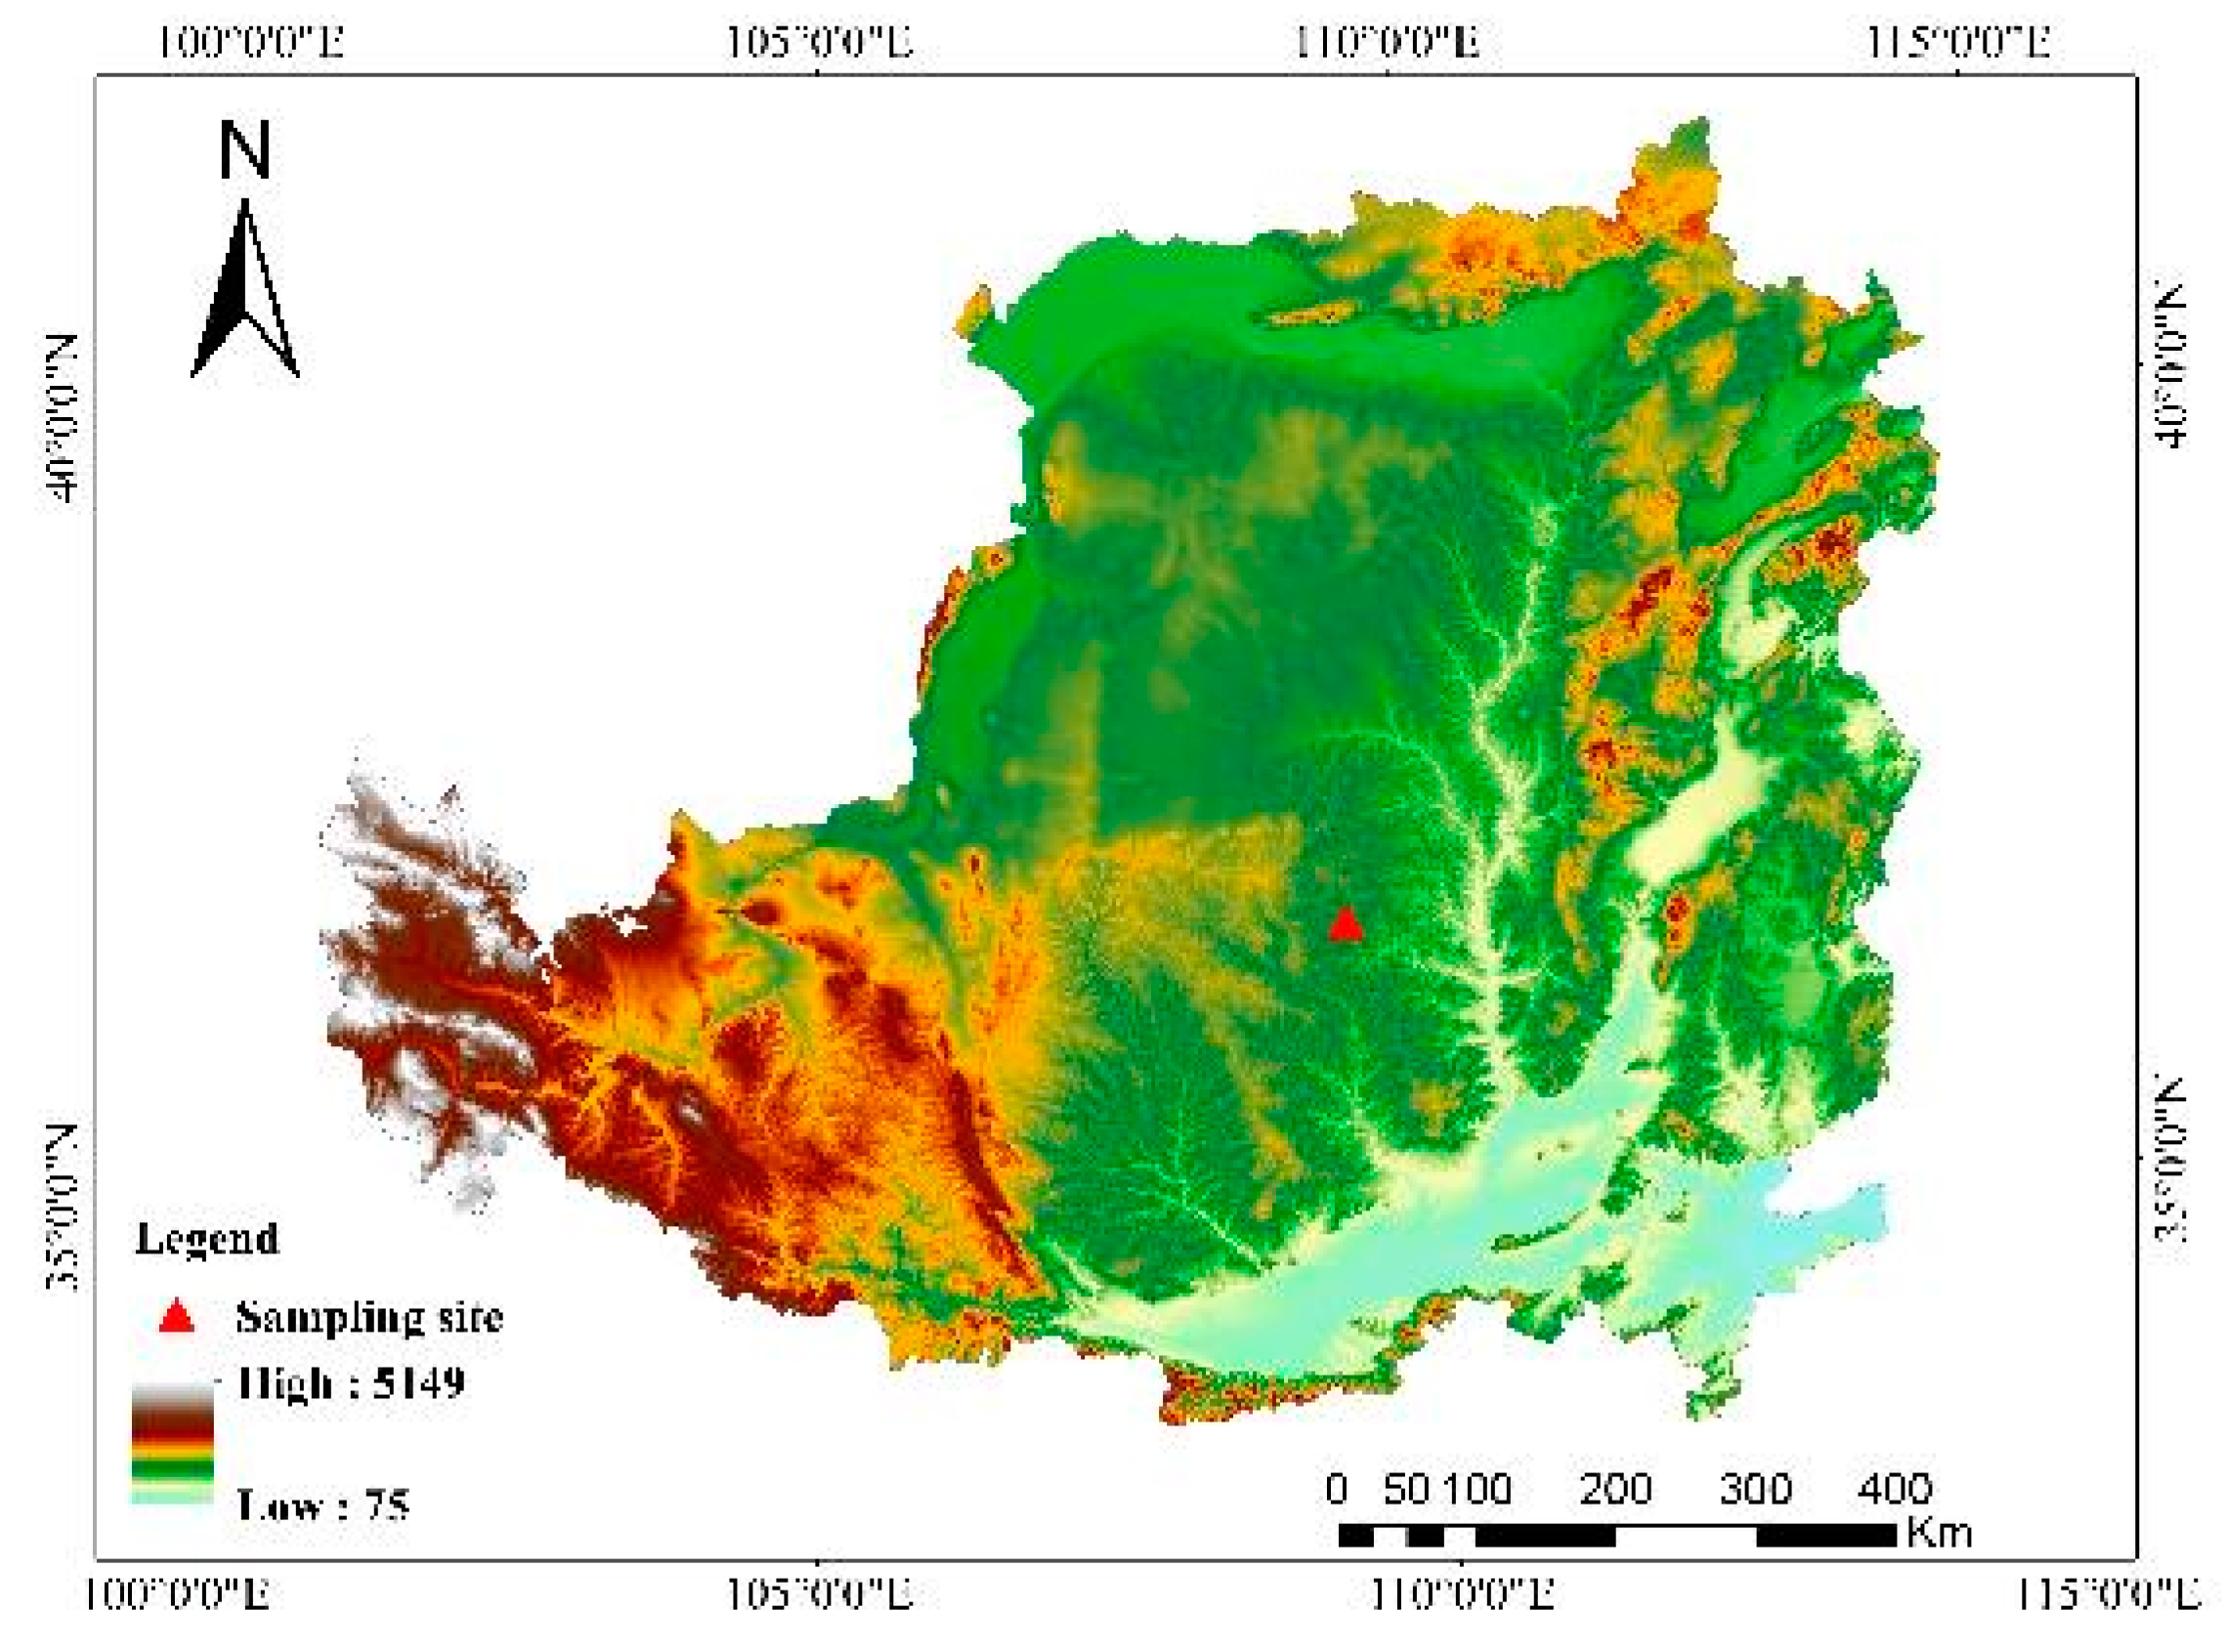
To test our hypotheses, we selected three typical vegetation species of secondary succession in the Loess Plateau: Setaria viridis (early-successional species), Artemisia sacrorum (mid-successional species), and Bothriochloa ischaemum (late-successional species) [22,23]. The sampling sites (minimum 20 m × 20 m) were located at Ansai Research Station (ARS) of the Chinese Academy of Sciences, Shaanxi Province, China (36°51′ N, 109°19′ E, 1068–1309 m a.s.l.) (Figure 1). Rhizospheric soils were obtained by shaking the soil strongly attached to plant roots in the 5–20 cm soil layer of three plant communities at sampling sites in April 2015 [21,24,25]. The collected soils were then sent to the laboratory without delay for preservation and finally transported to the Institute of Soil and Water Conservation for greenhouse experiments. Seeds of the three plant species were collected from ARS in the previous year.
2.1. Greenhouse Experiment
The greenhouse experiment was conducted at the State Key Laboratory of Soil Erosion and Dryland Farming on the Loess Plateau in Yangling, Shaanxi, China (34°12′ N, 108°7′ E, 530 m a.s.l.). The region has an average annual temperature of 12.9 °C, an average annual precipitation of 637.6 mm, and a seasonal semi-arid climate with a frost-free period of 211 days.
The collected soils were sieved (<0.5 cm) and then homogenized. Pots were polyvinyl chloride (PVC) round containers (20 cm high, 15 cm in diameter). The pots were filled with the collected soils. As an example of the rhizospheric soil for S. viridis (EarlySoil), the soil was packed into 35 pots with the same weight: 10 pots were planted with S. viridis (EarlySp), 10 pots were planted with A. sacrorum (MidSp), 10 pots were planted with B. ischaemum (LateSp), and 5 pots were used as black controls. The rhizospheric soils of A. sacrorum (MidSoil) and B. ischaemum (LateSoil) were treated as the soil of S. viridis. In addition, the three soils were mixed in equal proportions to create a mixed soil. The mixed soil was packed into 45 pots, 35 of which (MixSoil) were treated as S. viridis soil, and the remaining 10 of which (MMixSoil) were planted with the three plant species. The seeds were sown in early May 2015 in the corresponding soils, and the plant density per pot was controlled to maintain the same number of plants. Soil moisture content was controlled per pot by weighing (80% of field holding capacity).
2.2. Photosynthesis, SPAD Readings, and Chlorophyll Fluorescence
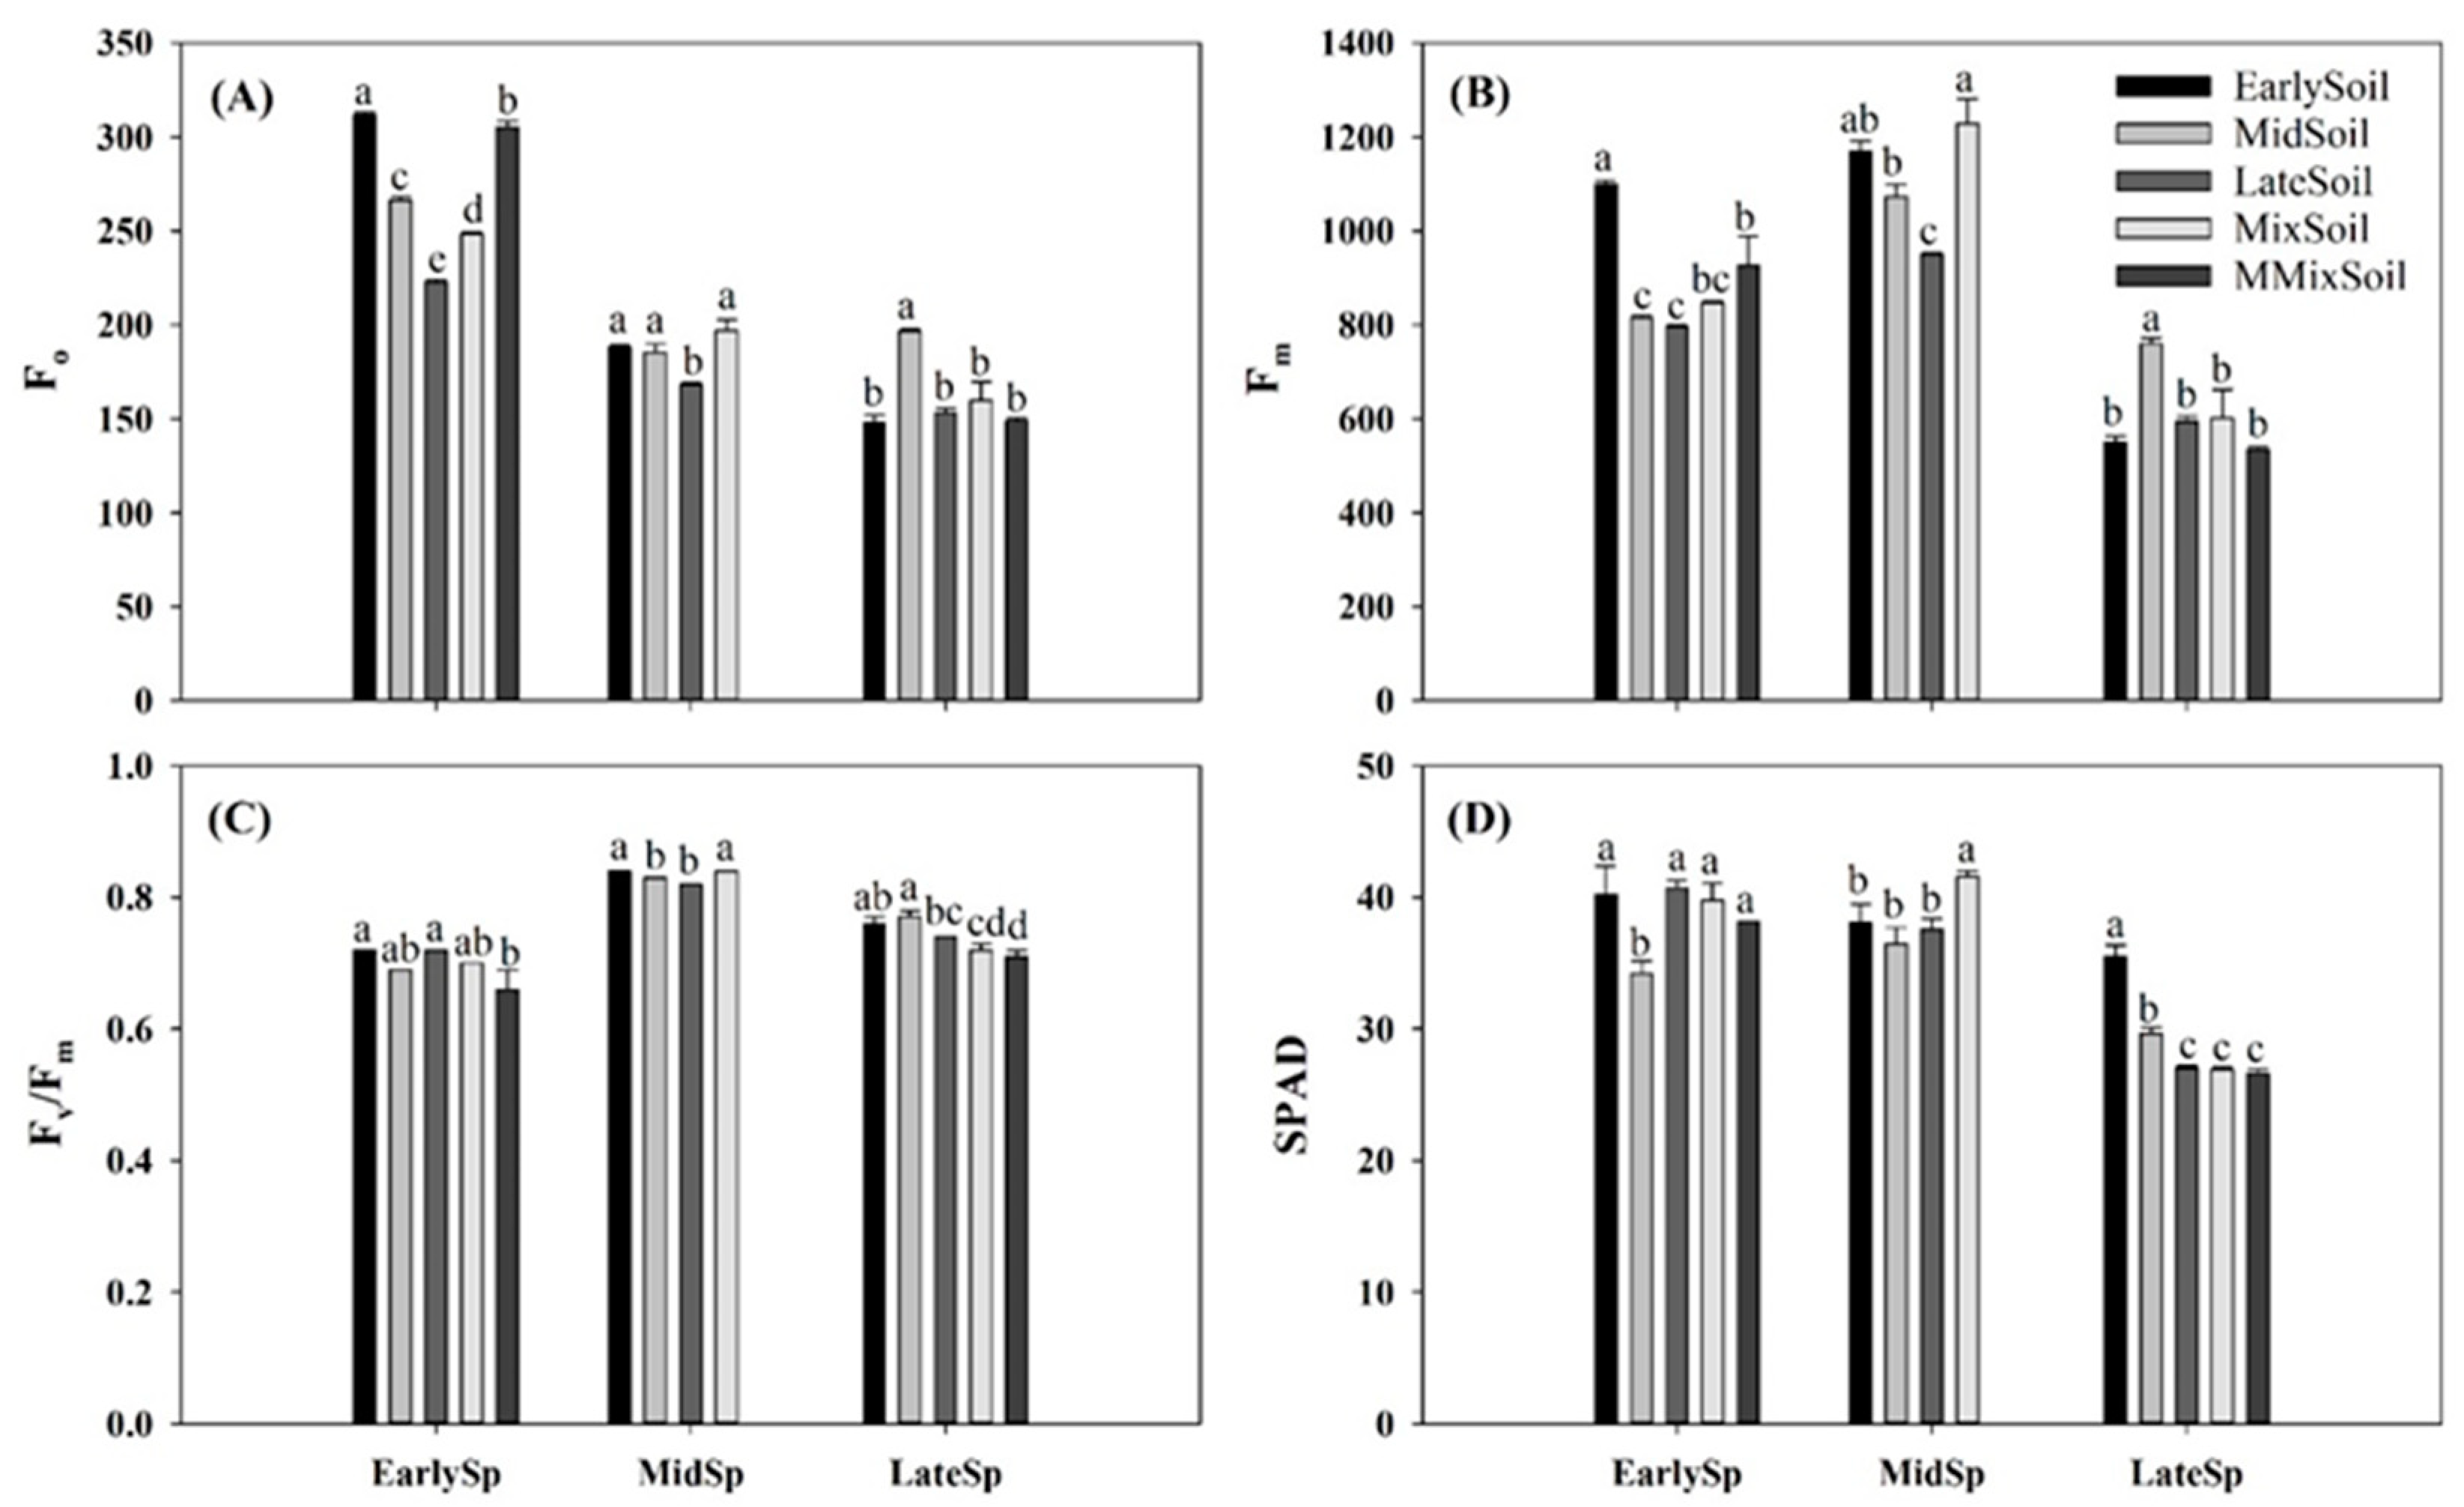
Four pots with plants were randomly selected from each treatment. Three leaves from different individual plants in each pot were marked and used for photosynthesis, chlorophyll fluorescence, and single-photon avalanche diode (SPAD) value measurements. Net photosynthetic rate (Pn), stomatal conductance (Gs), transpiration rate (Tr), and intercellular CO2 concentration (Ci) were measured in the morning (between 8:30 and 11:30 am) using an open gas-exchange system (LI-6400XT, Li-Cor Inc., Lincoln, NE, USA). For measurements, the standard measurement conditions were as follows: temperature at 25 °C, relative humidity of approx. 30%, saturating photon flux density at 1200 μmol m–2 s−1, and CO2 concentration of 380–400 μmol mol–1. After photosynthesis measurements, SPAD values were calculated in the afternoon using a SPAD-502 (Konica Minolta Sensing Inc., Osaka, Japan), and three measurements were taken near the midpoint of each marked leaf and averaged. Chlorophyll fluorescence emissions from the surface of leaves were measured by a leaf chamber fluorometer (LI-6400XT, Li-Cor Inc., Lincoln, NE, USA). The minimum fluorescence (Fo) and maximum fluorescence (Fm) were measured in leaves after 2 h of dark adaption. Variable fluorescence (Fv) was calculated as Fm−Fo, and the maximum quantum efficiency of photosystem II (Fv/Fm) was calculated as (Fm−Fo)/Fm.
2.3. Plant and Soil Samples
In September 2015, the samples in four pots were divided into leaves, stems, and roots. The plants were then dried at 65 °C to constant weights and weighed. After biomass treatments, the leaves and stems were combined as the aboveground part and the roots constituted the belowground part. The two parts were crushed and sieved (<1 mm) to be used for the determination of NSCs and nutrient concentrations in the tissues. The soil samples were well mixed and passed through a 2 mm sieve, then divided into three sub-samples. Storage of the sub-sample for soil enzyme activity determination was at −80 °C. Storage of the sub-sample for water-soluble nutrient determination was at 4 °C. The final sub-sample was air-dried and passed through 1 and 0.25 mm mesh sieves for soil nutrient determination.
2.4. Laboratory Analysis
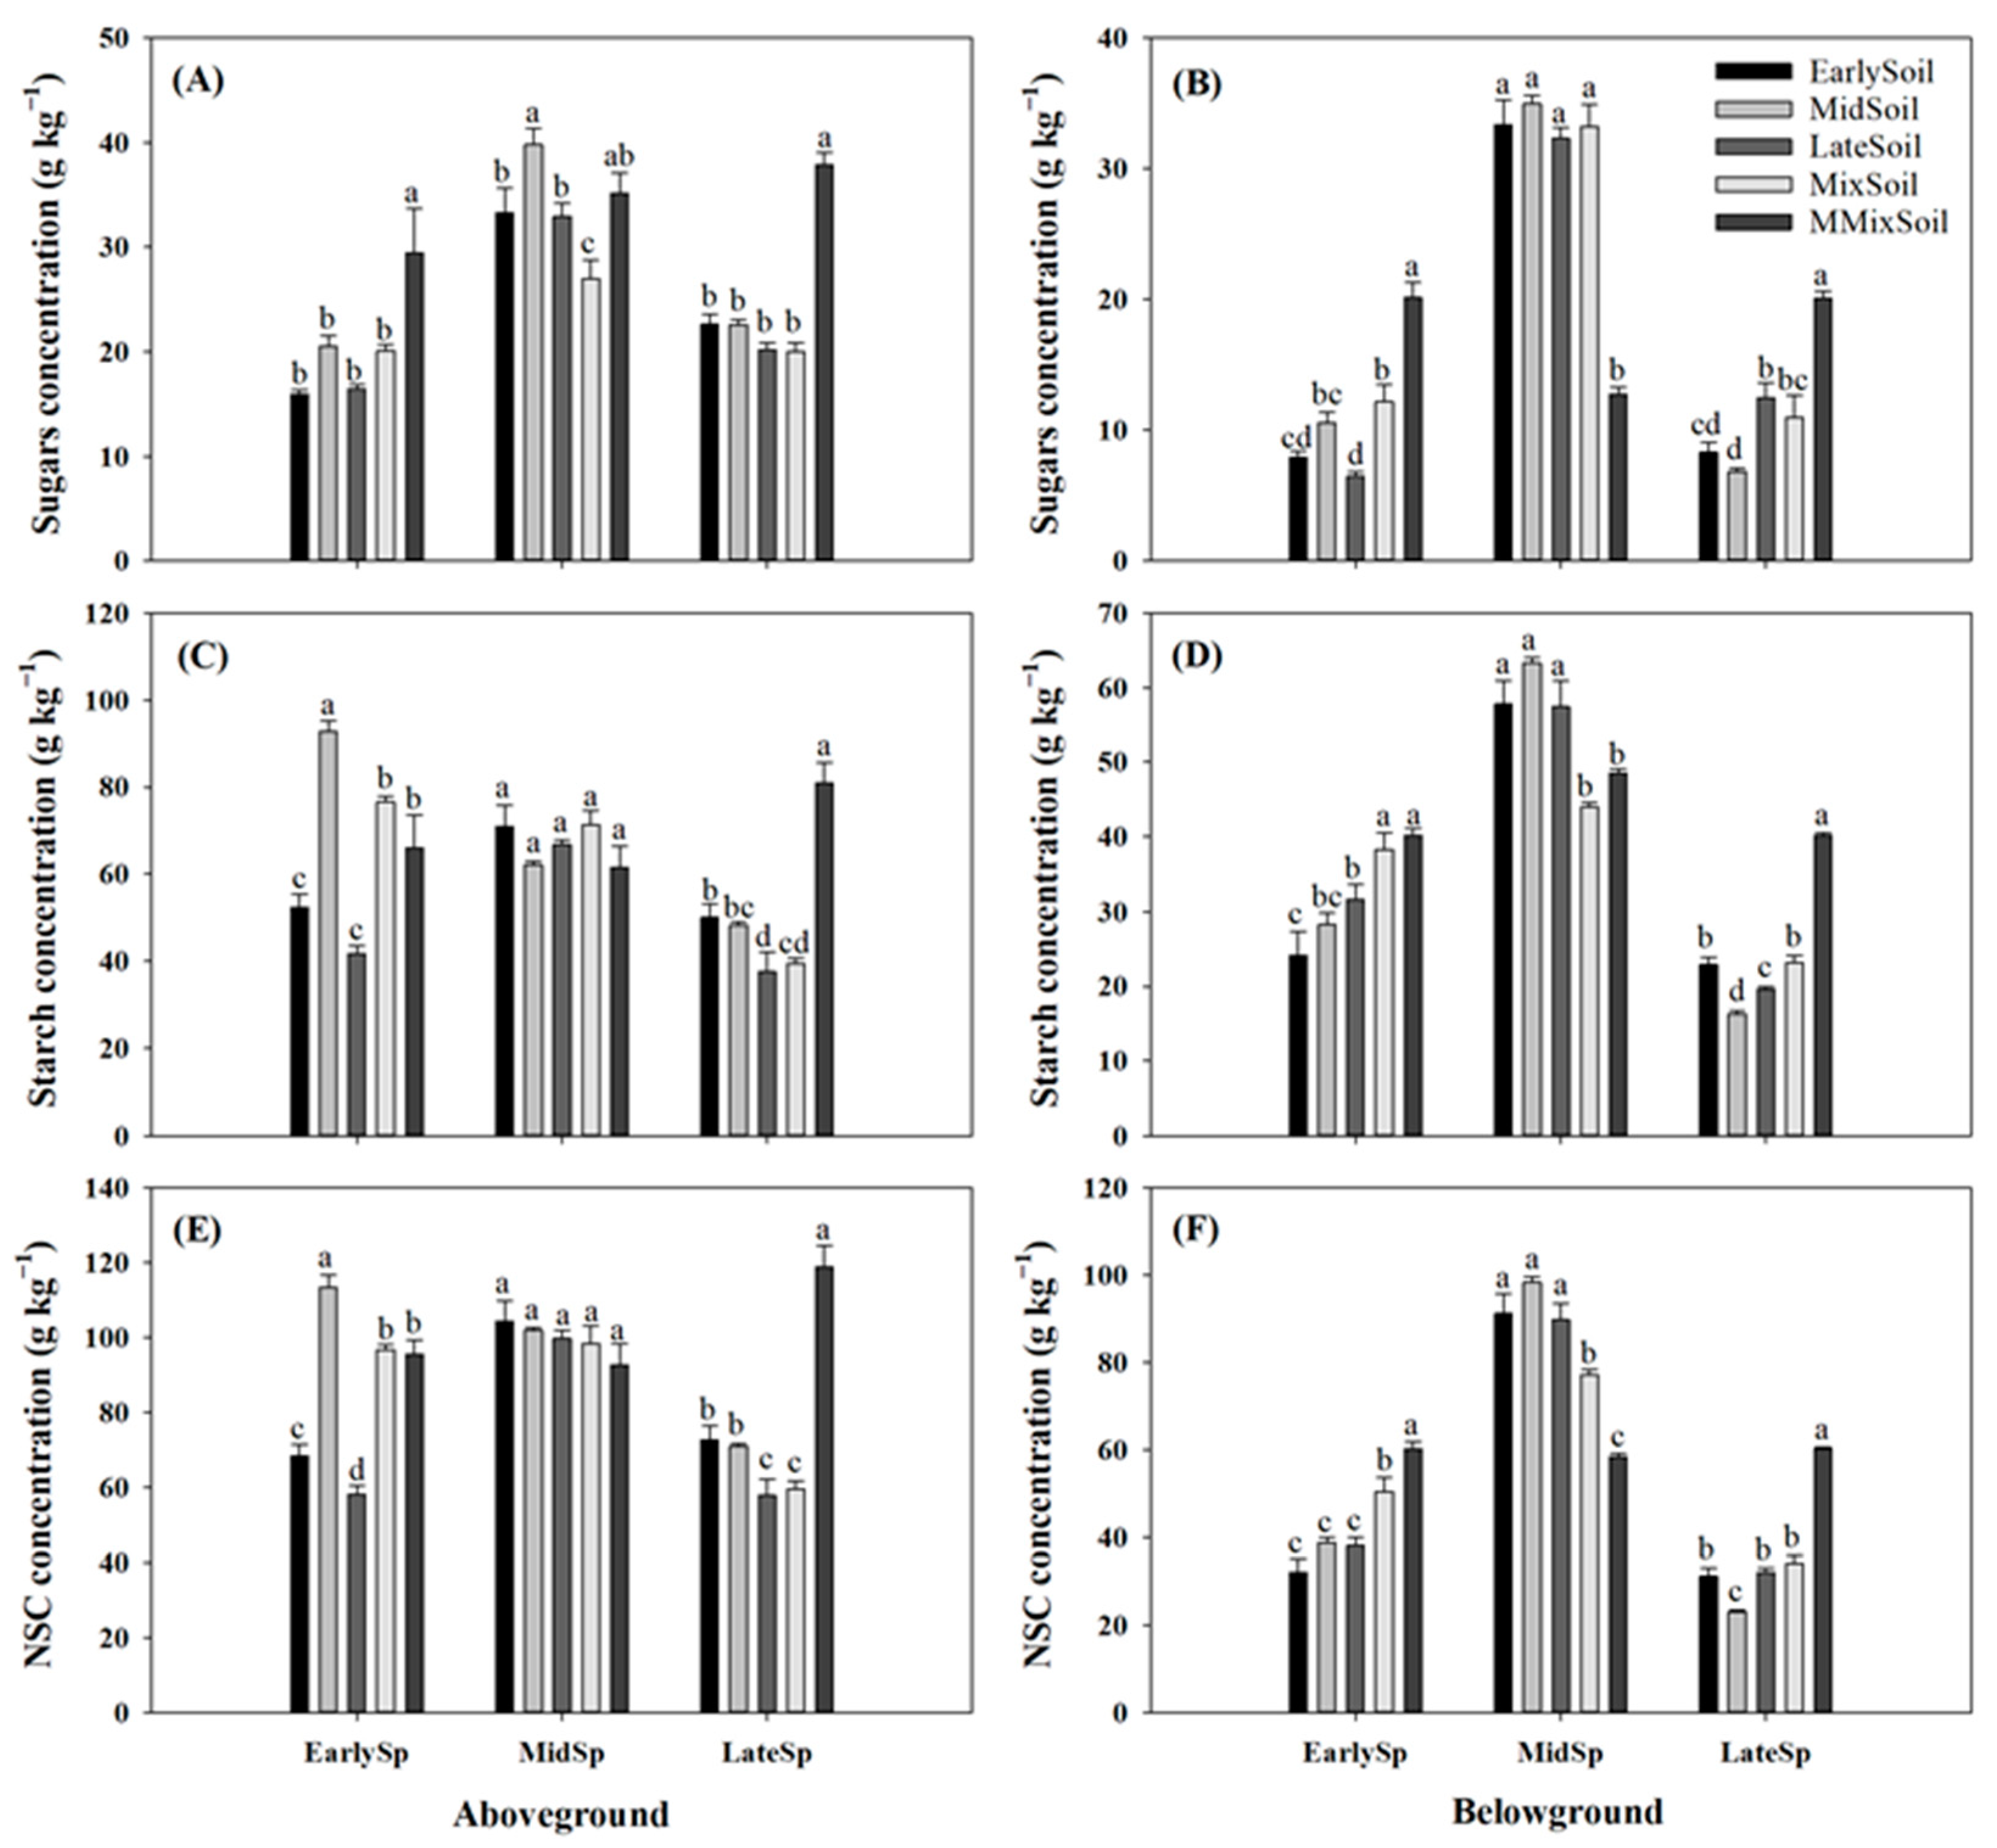
Soluble sugar and starch content in the plant tissues were determined by the anthrone method. A total of 0.1 g of sample powder was placed in 2 mL of 80% ethanol solution in a water bath at 80 °C for 30 min, followed by centrifugation at 5000× g for 5 min. The supernatant was then transferred and the residue was extracted twice more, as described above. The supernatant was added to the anthrone reagent (2 g anthrone in 100 mL 95% H2SO4) and incubated in a boiling water bath. After cooling, the soluble sugar concentration was determined at 620 nm with a spectrophotometer (Shimadzu, Kyoto, Japan). The residue left in the centrifuge tube after sugar extraction was dried and used for starch extraction. A total of 2 mL of distilled water was added to the residue and pasted in a boiling water bath for 15 min. The residue was further hydrolyzed with 2 mL 9.2 mol/L HClO4 for 15 min. The samples were then spiked with 4 mL of distilled water and centrifuged at 5000× g for 5 min. The procedure was repeated and the supernatants were analyzed spectrophotometrically for starch at 620 nm. Calculation of the starch content in the dry matter was carried out by a conversion factor of 0.9 [26].
The organic carbon (C) content in the plant tissues was determined using the H2SO4-K2Cr2O7 oxidation method; the total N (TN) content in the tissues was determined by the standard Kjeldahl method; the total P (TP) content in the tissues was determined by Mo-Sb colorimetry, antimony, and scandium colorimetry; and the total potassium content in the tissues was determined using a flame photometer.
The determination of soil organic C (SOC) and TN was similar to the methods used in plant tissues. Soil TP was determined using HClO4-H2SO4 digestion followed by the Mo-Sb colorimetric method. Soil ammonium N (AN) and nitrate N (NN) were analyzed colorimetrically on an Alpkem autoanalyzer (OI Analytical, College Station, TX, USA). The soil available N (SAN) concentration was calculated as AN concentration + NN concentration. Soil available P (SAP) was extracted with NaHCO3 and then determined by melt-molybdenum, antimony, and scandium colorimetry. The water-soluble organic C (WSOC) concentration was determined with a Liquid TOC II Analyzer (Elementar Company, Langenselbold, Germany). Water-soluble nitrate N (WSNN) and total N (WSTN) were determined by the alkaline potassium persulfate digestion ultraviolet spectrophotometer method. Water-soluble ammonium N (WSAN) was measured using a continuous flow analyzer (San++, SKALAR, Breda, The Netherlands). The water-soluble organic N (WSON) concentration was calculated as WSTN − WSNN − WSAN. Total water-soluble P (WSTP) was determined by the method of potassium persulphate oxidation-molybdenum blue colorimetry. The soil pH was determined at a 1:2.5 ratio of soil–water suspension with an automatic titrator (Metrohm 702, Metrohm Ltd., Herisau, Switzerland).
The sub-samples were stored in a 25 °C incubator for seven days to restore respiration. A total of 0.5 M K2SO4 was added to the samples and shaken for 1 h. The soil microbial biomass C was determined by a CHCl3 fumigation-incubation method (FI) [27]. The concentration of organic C was determined by a Liquid TOC II Analyzer (Elementar Company, Langenselbold, Germany). The calculation of biomass C was as follows:
where EC = organic C extracted from fumigated soil—organic C extracted from non-fumigated soil, and kC = 0.38 [27]. Soil microbial biomass N was determined by the CHCl3 fumigation–extraction method (FE) [28]. Biomass N was calculated as the flush of total K2SO4-extractable N (K2SO4-extractable N of fumigated soil minus that of biomass N extract after 24 h of CHCl3 fumigation) divided by kN of 0.54 [28].
Cmin = EC/kC
Soil β-1,4-glucosidase (BG), acid phosphatase (Acid P), β-1,4-N-acetylgluco-saminidase (NAG), L-leucine aminopeptidase (LAP), β-1,4-xylosidase (BX), aryl sulfatase (ASF), cellobiohydrolase (CBH), and alanine aminopeptidase (APP) activities were determined using synthetic fluorogenic substrates. A total of 50 mM CH3COOH buffer of the corresponding soil pH was added to the sub-samples and shaken well. Aliquots of 50 μL were pipetted into black polystyrene 96-well microplates (Brand, GmbH & Co. KG, Wertheim, Germany) along with 150 μL associated substrates. Fluorescence was measured with a microplate reader (Labsystems Multiskan MS, Helsinki, Finland) after incubation in a constant temperature incubator for the corresponding time. The enzyme activities were then calculated from the standard curve.
2.5. Statistical Analysis
Differences in plant photosynthesis, NSCs, and biomass between different soil treatments were assessed using one-way Analyses of Variance (ANOVA) and multiple comparisons, and the means were then compared using the Duncan’s multiple range test (p < 0.05). All the analyses were performed with the statistical software SPSS 20 (IBM, New York, NY, USA). Assessment of the relationship between the soil nutrients and the functional plant traits was conducted using Pearson’s correlation analysis. Redundancy analysis (RDA) was performed with CANOCO5 (Microcomputer Power, Ithaca, NY, USA) to understand the effect of the soil nutrients on the plant functional traits. Structural equation modeling (SEM) was performed with AMOS SPSS expansion pack to gain a mechanistic understanding of the effect of the soil nutrients on the plant functional traits. All the histograms were drawn using SigmaPlot 12.5 (Systat Software, San Jose, CA, USA).
3. Results
3.1. Photosynthesis
The effects of the soil feedback on the photosynthetic traits were significant, except for Gs of mid- and late-successional species (Figure 2 and Figure 3). Compared with treatments of plants growing in their own soil, Pn significantly increased in EarlySp–LateSoil (31%), LateSp–EarlySoil (20%), and LateSp–MidSoil (18%), respectively (Figure 2A); Tr was significantly decreased in LateSp–MixSoil (24%) and LateSp–MMSoil (30%), respectively (Figure 2D); Fo and Fm significantly decreased (9%–29%) in EarlySp–MidSoil, EarlySp–LateSoil, and MidSp–LateSoil, respectively (Figure 3A,B); Fv/Fm increased in MidSp–EarlySp (1%) and LateSp–MidSoil (4%), respectively (Figure 3C); and SPAD values increased in LateSp–EarlySoil (31%) and LateSp–MidSoil (10%), respectively (Figure 2D).
3.2. Non-Structural Carbohydrates and Biomass
The soluble sugar, starch, and NSC concentrations in aboveground tissues (AG-sugar, AG-starch, and AG-NSC) and in belowground tissues (BG-sugar, BG-starch, and BG-NSC) varied significantly between the treatments, except for AG-starch and AG-NSC in mid-successional species (Figure 4). Compared with the treatments of plants growing in their own soil, AG-starch concentrations increased in EarlySp–MidSoil (77%), LateSp–EarlySoil (33%) and LateSp–MidSoil (29%), respectively (Figure 4C); and AG-NSC concentrations increased in EarlySp–MidSoil (66%), LateSp–EarlySoil (26%) and LateSp–MidSoil (23%), respectively (Figure 4E); however, BG-sugar significantly decreased in LateSp–EarlySoil (33%) and LateSp–MidSoil (45%), respectively.
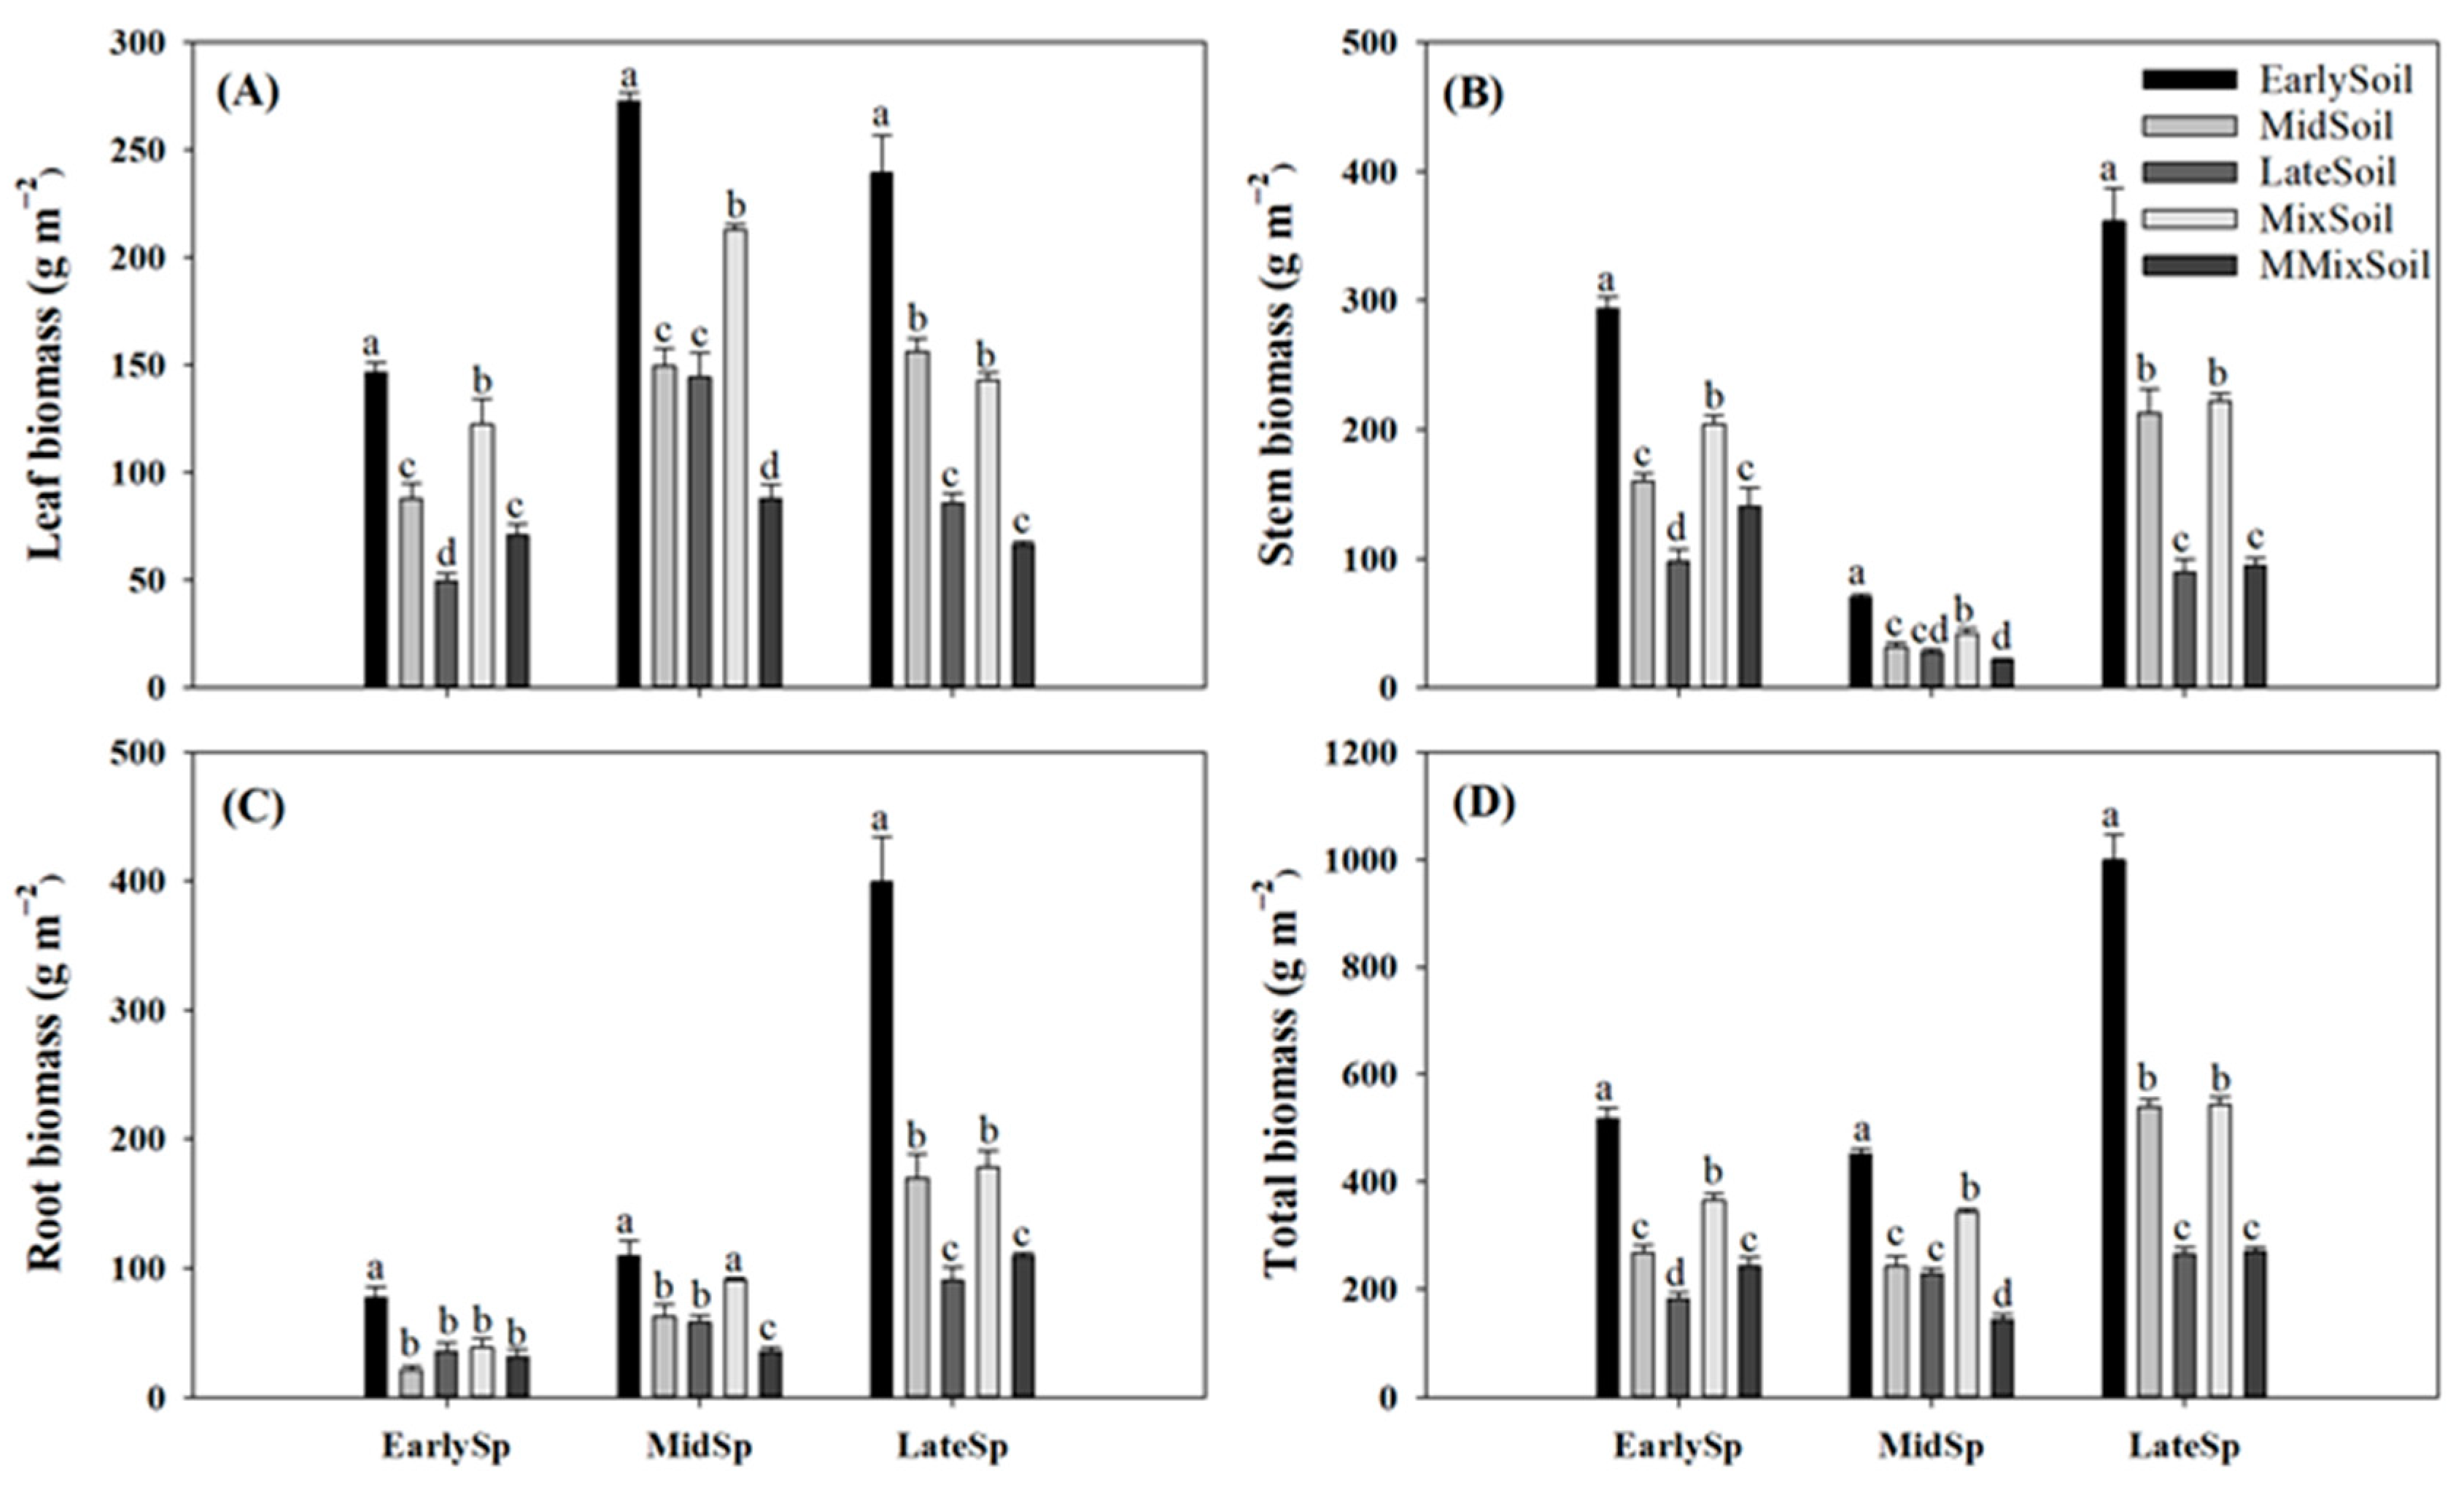
Compared with the treatments of plants growing in their own soil, leaf, stem, root, and total biomass significantly decreased in EarlySp–MidSoil (40%–73%) and EarlySp–LateSoil (53%–67%), respectively (Figure 5); and leaf, stem, root, and total biomass increased in MidSp–EarlySoil (76%–123%), LateSp–EarlySoil (180%–342%) and LateSp–MidSoil (83%–137%), respectively. However, no significant difference was observed in biomass between MidSp–LateSoil and the treatment of plants growing in their own soil.
3.3. Constrained RDA and Path Analyses
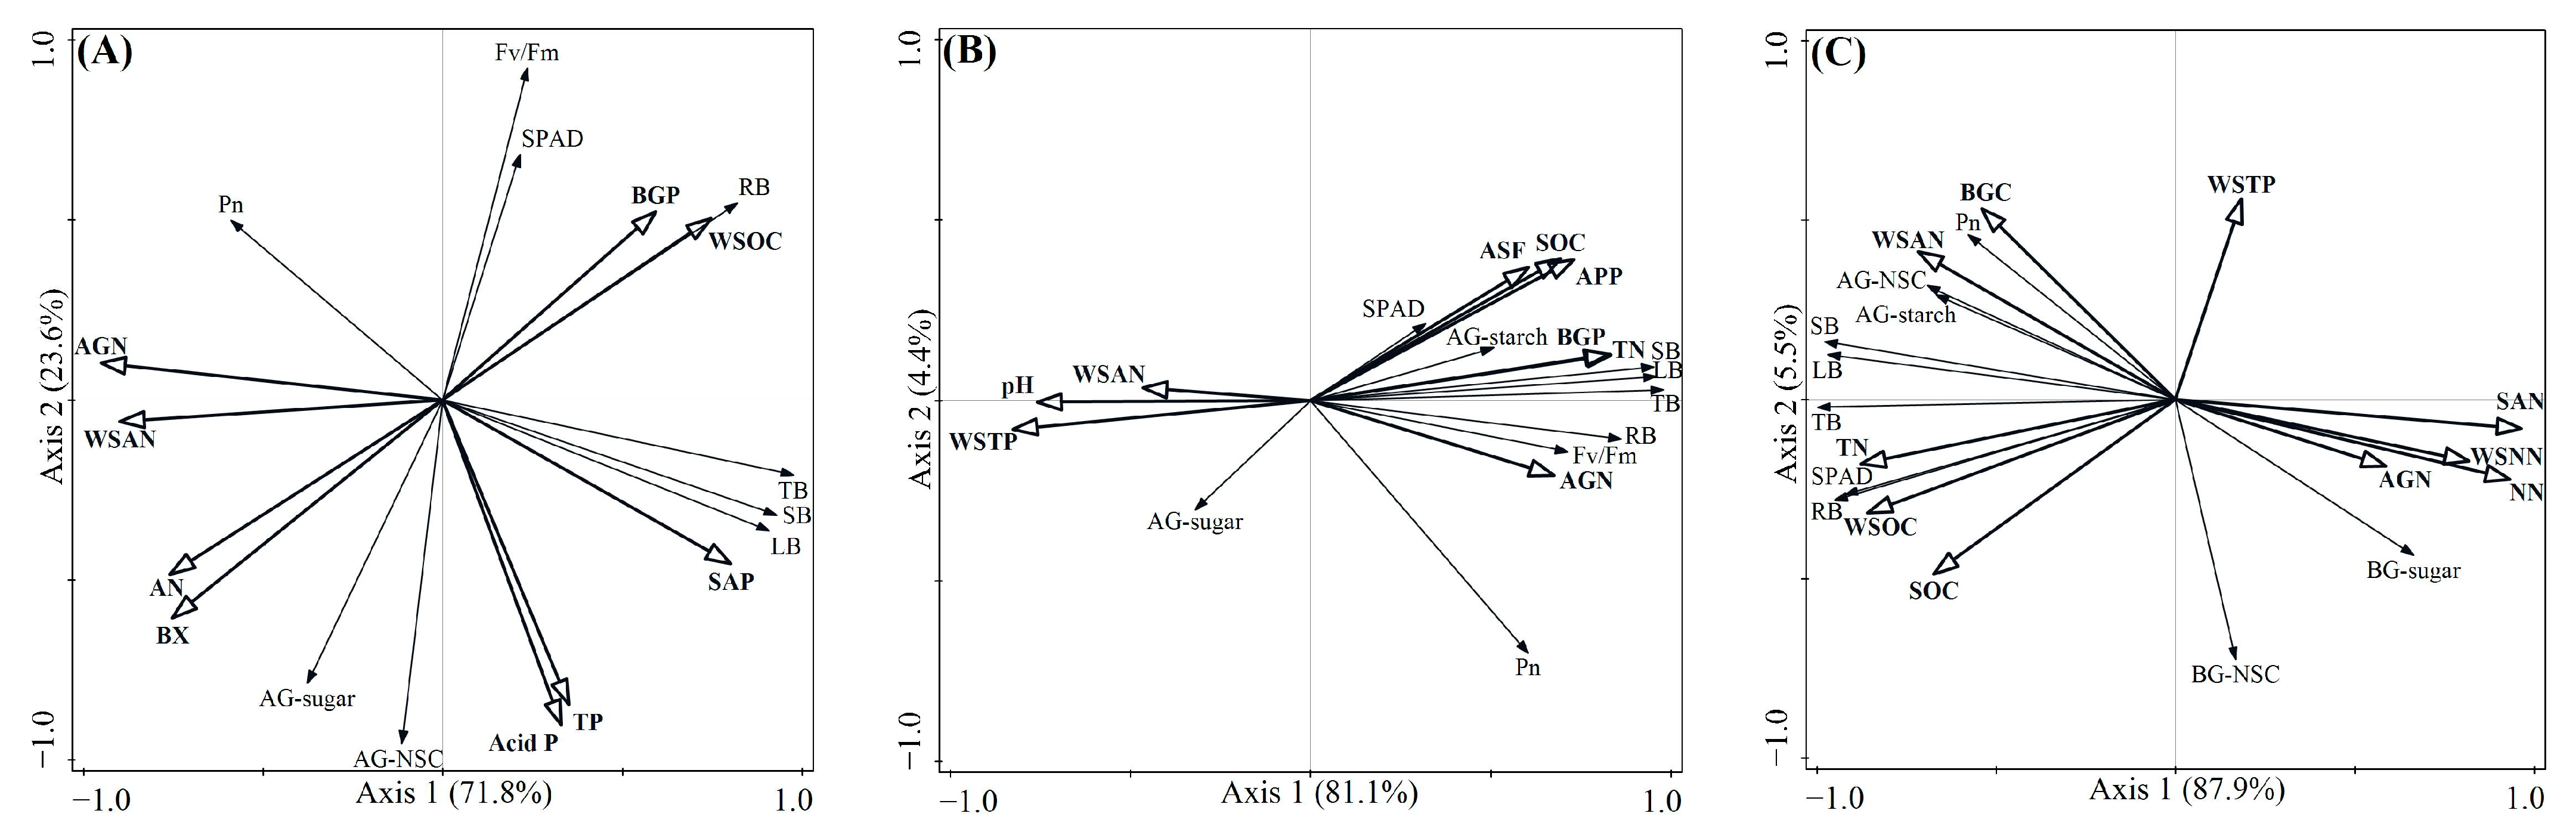
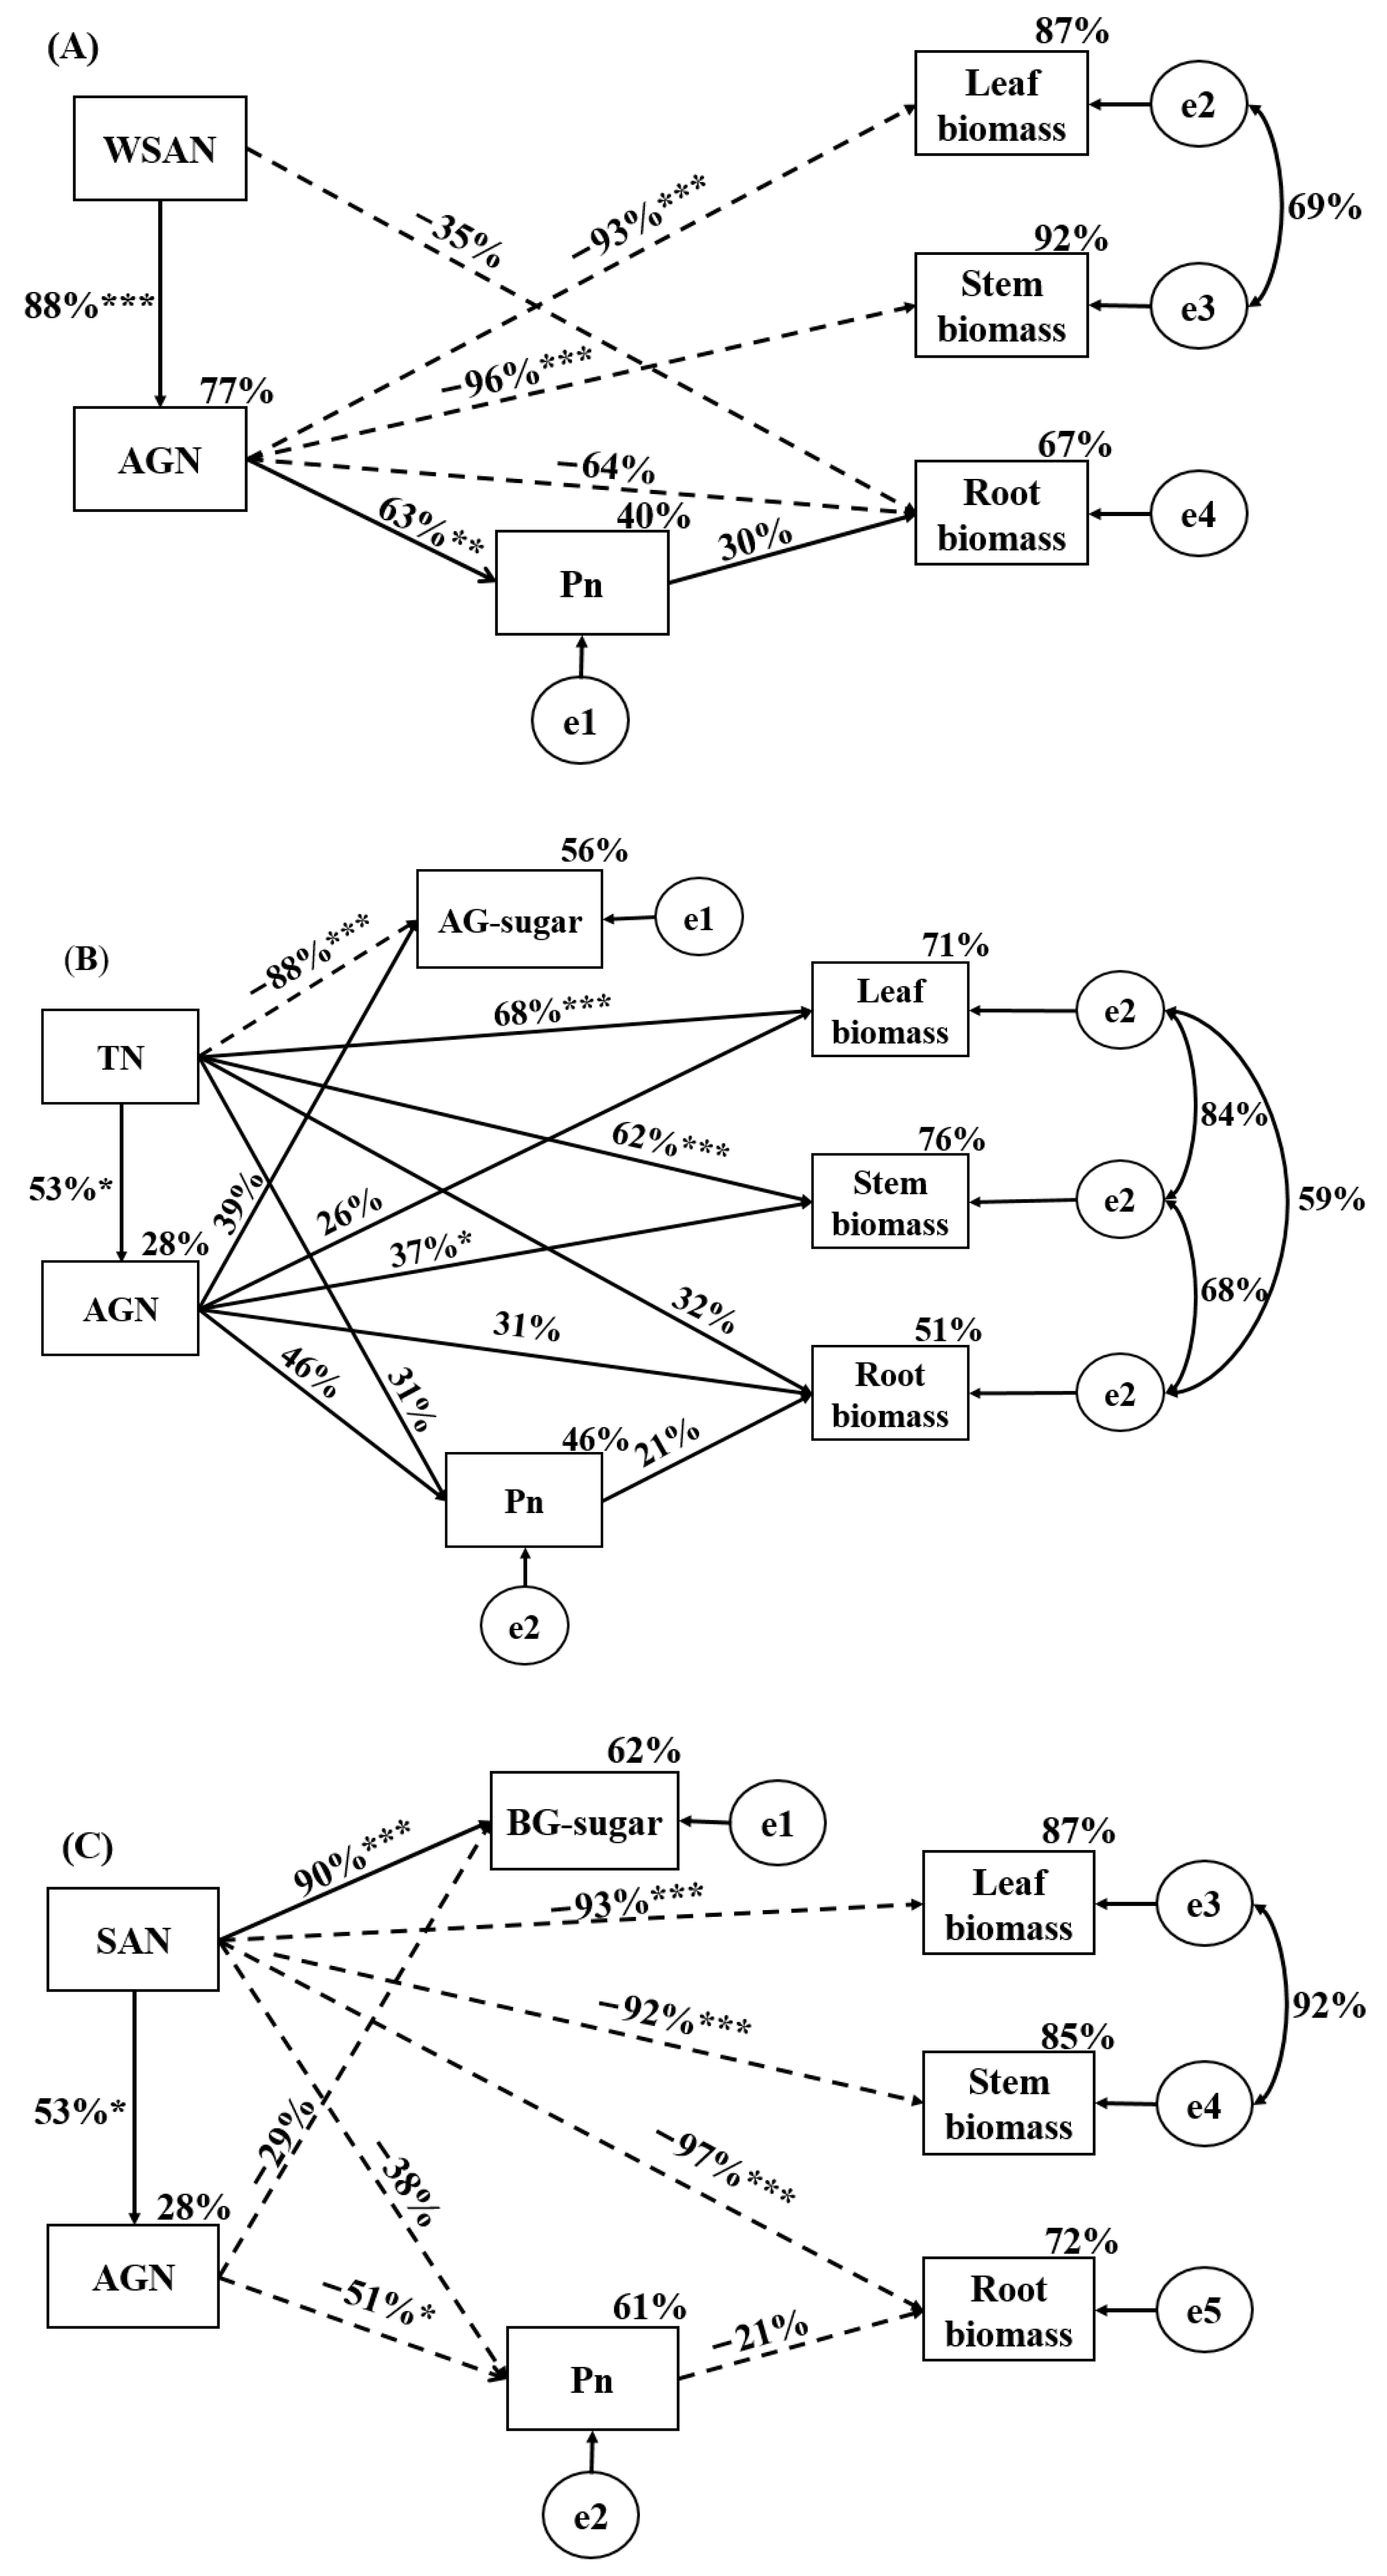
The constrained RDA revealed the relationship between the plant functional traits and soil fertility factors according to the length and angle of the axes (Figure 6A–C). BX activity, TN, and SAN concentrations were the most significant soil fertility factors influencing traits of early-, mid-, and late-successional species, with explanations of 19.2% (p = 0.002), 57.2% (p = 0.004), and 81.8% (p = 0.002), respectively. The path analyses showed good consistency with the data describing the effects of soil fertility factors on traits at early-, mid-, and late-successional stages (Figure 7A–C). The SEM explained 40% of the variation in Pn, 87% of the variation in leaf biomass, 92% of the variation in stem biomass, and 67% of the variation in root biomass at the early-successional stage (Figure 7A). The SEM explained 46% of the variation in Pn, 56% of the variation in AG-sugar, 71% of the variation in leaf biomass, 76% of the variation in stem biomass, and 51% of the variation in root biomass at the mid-successional stage (Figure 7B). The SEM explained 61% of the variation in Pn, 66% of the variation in AG-NSC, 87% of the variation in leaf biomass, 85% of the variation in stem biomass, and 72% of the variation in root biomass at the late-successional stage (Figure 7C).
4. Discussion
4.1. Effects of Soil Feedback on Photosynthesis
The Pn of late-successional species significantly increased in soil conditioned by early- and mid-successional species, consistent with hypothesis 1 that photosynthesis of subsequent successional species is promoted by soil conditioned by pre-successional species. Increases in photosynthesis usually promote growth [29], and might contribute to enhancing the dominance of species. Thus, we speculate that subsequent successional species could gain an advantage in competition with pre-successional species through strong photosynthetic capacity and gradually replace pre-successional species. Our results showed that high photosynthetic rates may be the driving force of species replacement and demonstrate the directionality of succession. Against our hypothesis 1, however, the Pn of early-successional species increased remarkably in soil conditioned by late-successional species. This phenomenon may be related to the uptake and use of WSAN by early-successional species, because WSAN is extremely easy to be absorbed and effectively used by plants [30]. Adequate N supply allows plants to allocate more N to the chloroplast, promoting photosynthesis [31], which confirms our path analysis that WSAN concentration was the main soil factor affecting the Pn of early-successional species (Figure 7A).
Photoenergy driving photosynthesis is captured by chlorophyll molecule [32], so the effects of soil conditions on photosynthesis can also be reflected by chlorophyll fluorescence. When the photosynthetic tissues of plants are exposed to stress, nonphotochemical quenching (NPQ) processes can increase, leading to a decrease in Fm [33]. Our Fm values indicated that the photochemical efficiency of pre-successional species was reduced in soil conditioned by subsequent successional species, suggesting that pre-successional species may be subjected to soil environmental stress when entering subsequent successional species communities. In the present study, the results of different photosynthetic indicators (Pn and Fm) of early-successional species in response to soil conditioned by late-successional species were opposite, suggesting the specificity of plant–soil interactions on plant photosynthetic traits. As a sensitive indicator of plant photosynthetic performance, Fv/Fm frequently decreases when plants are exposed to environmental stresses [34]. In the present study, the Fv/Fm of subsequent successional species did not significantly reduce and was in the general range of species under suitable conditions (0.75–0.85) [34] in soil conditioned by pre-successional species. Our results indicate that the growth of subsequent successional species may not be inhibited by soil conditioned by pre-successional species, contributing to the diversification of plant communities.
4.2. Effects of Soil Feedback on NSCs
Non-structural carbohydrates provide energy for the growth and metabolism of plants [35], and their levels reflect the balance between photosynthesis and the carbon demand of plants. Therefore, NSC concentration can be used as an indicator of eco-physiological activity and growth [36]. The BG-sugar of late-successional species decreased significantly in soil conditioned by early- and mid-successional species, supporting hypothesis 2. Previous studies have showed that the resistance of plants is associated with high NSC concentrations, especially sugars [9]. Therefore, our study suggests that subsequent successional species may not be inhibited by soil conditioned by pre-successional species. N levels are among the many factors that affect the NSC content of plants. Soil N can affect the balance between the gain, loss, and utilization of carbon [37] and the photosynthetic product allocation patterns of plants [38,39]. The path analysis indicated that soil TN concentration had a negative effect on the AG-sugar of mid-successional species (Figure 7B). It can therefore be inferred that the resistance of mid-successional species would weaken when soil N concentrations increased. However, this conjecture is limited to herbaceous plants, since no significant relationship between soil N concentration and leaf soluble sugar concentration of woody plants was identified in previous studies [40]. Interestingly, the soluble sugar, starch, and NSC concentration of early- and late-successional species significantly increased under mixture (Figure 7), potentially due to the plants having more carbon allocated to storage in interspecific competitive conditions [41].
4.3. Effects of Soil Feedback on Biomass
The leaf, stem, and root biomass of pre-successional species significantly decreased in soil conditioned by subsequent successional species and vice versa, consistent with hypothesis 1. The data reported herein indicated that the effects of soil feedback on biomass, either facilitated or inhibited, were closely related to the successional stage of plants and soils, consistent with a previous study [3]. In contrast to the previous study [3], however, late-successional species grew better in early soil than in late soil. The reason for the difference might be related to the plant growth period. Specifically, biomass was measured at the first growth period in our experiment, whereas it was measured at the second growth period in previous studies. Interestingly, the biomass of early-successional species in late soil was more significantly reduced than that in middle soil. By contrast, the biomass of late-successional species in early soil was more significantly increased than that in middle soil. Thus, our results proved evidence for successional directionality and that reverse succession was inhibited. The path analyses showed that WSAN, TN, and SAN concentrations were the main soil factors affecting the biomass of early-, mid-, and late-successional species, respectively, which helps to explain successional directionality here. N is generally the most limiting factor in plant productivity [42], and the ability to absorb different forms of N varies between plant species [43]. Thus, the successional directionality may be related to soil N nutrient status and the N forms of preferential uptake by plants.
5. Conclusions
Our study aimed to explore the response of plant traits to plant–soil interactions during secondary succession in grassland. Photosynthetic traits (Pn, Fv/Fm, and SPAD) and biomass were promoted, and stress resistance traits (BG-sugar) were inhibited when subsequent successional species growing in soil conditioned by pre-successional species. Our results show that the growth of subsequent successional species is promoted by plant–soil interactions during secondary succession, confirming the directionality of succession and providing new information for predicting vegetation succession trends. Furthermore, WSAN, TN, and SAN concentrations play a key role in influencing the plant traits of early-, mid-, and late-successional species, respectively, explaining the underlying mechanisms of plant trait response. Additional studies are needed to investigate the response of plant traits to plant–soil interactions during secondary succession under natural field conditions.
Author Contributions
Conceptualization, Z.A. and S.X.; Data curation, J.L. and X.L.; Formal analysis, Z.A., J.L. and X.L.; Funding acquisition, Z.A. and S.X.; Investigation, Z.A., J.Z. and H.L.; Supervision, G.L.; Validation, J.Z., H.L. and H.X.; Writing—original draft, Z.A. and J.L.; Writing—review & editing, G.L. and S.X. All authors have read and agreed to the published version of the manuscript.
Funding
This research was funded by the National Natural Science Foundation of China (41907409), the PhD Start-up Fund of Xi’an University of Science and Technology (2018QDJ047), the Shaanxi Science Fund for Distinguished Young Scholars (2021JC-50), and the scientific and technological innovation team program of innovation talents promotion plan by Shaanxi of China (2023-CX-TD-37).
Institutional Review Board Statement
Not applicable.
Informed Consent Statement
Not applicable.
Data Availability Statement
The data are available from the corresponding author on reasonable request.
Conflicts of Interest
The authors declare no conflict of interest.
References
- Zhang, W.; Ren, C.; Deng, J.; Zhao, F.; Yang, G.; Han, X.; Tong, X.; Feng, Y. Plant functional composition and species diversity affect soil C, N, and P during secondary succession of abandoned farmland on the Loess Plateau. Ecol. Eng. 2018, 122, 91–99. [Google Scholar] [CrossRef]
- Bever, J.D.; Westover, K.M. Incorporating the soil community into plant population dynamics: The utility of the feedback approach. J. Ecol. 1997, 85, 561–573. [Google Scholar] [CrossRef]
- Kardol, P.; Bezemer, T.M.; Van Der Putten, W.H. Temporal variation in plant–soil feedback controls succession. Ecol. Lett. 2006, 9, 1080–1088. [Google Scholar] [CrossRef]
- Chazdon, R.L.; Pearcy, R.W.; Lee, D.W.; Fetcher, N. Photosynthetic Responses of Tropical Forest Plants to Contrasting Light Environments; Springer: Boston, MA, USA, 1996. [Google Scholar] [CrossRef]
- Shipley, B. Net assimilation rate, specific leaf area and leaf mass ratio: Which is most closely correlated with relative growth rate? A meta-analysis. Funct. Ecol. 2006, 20, 565–574. [Google Scholar] [CrossRef]
- Sarker, U.; Oba, S. Drought stress enhances nutritional and bioactive compounds, phenolic acids and antioxidant capacity of Amaranthus leafy vegetable. BMC Plant Biol. 2018, 18, 258. [Google Scholar] [CrossRef] [PubMed] [Green Version]
- Luo, X.; Dai, Y.; Zheng, C.; Yang, Y.; Chen, W.; Wang, Q.; Chandrasekaran, U.; Du, J.; Liu, W.; Shu, K. The ABI4-RbohD/VTC2 regulatory module promotes Reactive Oxygen Species (ROS) accumulation to decrease seed germination under salinity stress. New Phytol. 2021, 229, 950–962. [Google Scholar] [CrossRef]
- Dietze, M.C.; Sala, A.; Carbone, M.S.; Czimczik, C.I.; Mantooth, J.A.; Richardson, A.D.; Vargas, R. Nonstructural carbon in woody plants. Annu. Rev. Plant Biol. 2014, 65, 667–687. [Google Scholar] [CrossRef] [PubMed] [Green Version]
- Wiley, E.; Rogers, B.J.; Hodgkinson, R.; Landhäusser, S.M. Nonstructural carbohydrate dynamics of lodgepole pine dying from mountain pine beetle attack. New Phytol. 2016, 209, 550–562. [Google Scholar] [CrossRef] [Green Version]
- Goodsman, D.W.; Lusebrink, I.; Landhäusser, S.M.; Erbilgin, N.; Lieffers, V.J. Variation in carbon availability, defense chemistry and susceptibility to fungal invasion along the stems of mature trees. New Phytol. 2013, 197, 586–594. [Google Scholar] [CrossRef]
- Bresson, J.; Vasseur, F.; Dauzat, M.; Koch, G.; Granier, C.; Vile, D. Quantifying spatial heterogeneity of chlorophyll fluorescence during plant growth and in response to water stress. Plant Methods 2015, 11, 23. [Google Scholar] [CrossRef] [PubMed] [Green Version]
- Abbaspour, H.; Saeidi-Sar, S.; Afshari, H.; Abdel-Wahhab, M. Tolerance of mycorrhiza infected pistachio (Pistacia vera L.) seedling to drought stress under glasshouse conditions. J. Plant Physiol. 2012, 169, 704–709. [Google Scholar] [CrossRef] [PubMed]
- De Deyn, G.; Raaijmakers, C.; Van der Putten, W. Plant community development is affected by nutrients and soil biota. J. Ecol. 2004, 92, 824–834. [Google Scholar] [CrossRef]
- Heinze, J.; Gensch, S.; Weber, E.; Joshi, J. Soil temperature modifies effects of soil biota on plant growth. J. Plant Ecol. 2017, 10, 808–821. [Google Scholar] [CrossRef] [Green Version]
- Kuzyakov, Y.; Xu, X. Competition between roots and microorganisms for nitrogen: Mechanisms and ecological relevance. New Phytol. 2013, 198, 656–669. [Google Scholar] [CrossRef]
- Zhang, W.; Zhao, J.; Pan, F.; Li, D.; Chen, H.; Wang, K. Changes in nitrogen and phosphorus limitation during secondary succession in a karst region in southwest China. Plant Soil 2015, 391, 77–91. [Google Scholar] [CrossRef]
- Akram, M.A.; Wang, X.; Hu, W.; Xiong, J.; Zhang, Y.; Deng, Y.; Ran, J.; Deng, J. Convergent variations in the leaf traits of desert plants. Plants 2020, 9, 990. [Google Scholar] [CrossRef]
- Zhang, J.; Li, X.; Chen, M.; Huang, L.; Li, M.; Zhang, X.; Cao, Y. Response of plant, litter, and soil C: N: P stoichiometry to growth stages in Quercus secondary forests on the Loess Plateau, China. J. For. Res. 2022, 33, 1–13. [Google Scholar] [CrossRef]
- Cechin, I.; Valquilha, É.M. Nitrogen effect on gas exchange characteristics, dry matter production and nitrate accumulation of Amaranthus cruentus L. Braz. J. Bot. 2019, 42, 373–381. [Google Scholar] [CrossRef]
- LeBauer, D.S.; Treseder, K.K. Nitrogen limitation of net primary productivity in terrestrial ecosystems is globally distributed. Ecology 2008, 89, 371–379. [Google Scholar] [CrossRef] [Green Version]
- van de Voorde, T.F.; van der Putten, W.H.; Martijn Bezemer, T. Intra- and interspecific plant–soil interactions, soil legacies and priority effects during old-field succession. J. Ecol. 2011, 99, 945–953. [Google Scholar] [CrossRef]
- Kou, M.; Jiao, J.; Yin, Q.; Wang, N.; Wang, Z.; Li, Y.; Yu, W.; Wei, Y.; Yan, F.; Cao, B. Successional trajectory over 10 years of vegetation restoration of abandoned slope croplands in the hill-gully region of the Loess Plateau. Land Degrad. Dev. 2016, 27, 919–932. [Google Scholar] [CrossRef]
- Du, F.; Shao, H.-B.; Shan, L.; Liang, Z.-S.; Shao, M.-A. Secondary succession and its effects on soil moisture and nutrition in abandoned old-fields of hilly region of Loess Plateau, China. Colloids Surf. B Biointerfaces 2007, 58, 278–285. [Google Scholar] [CrossRef] [PubMed]
- Jing, J.; Bezemer, T.M.; Van der Putten, W.H. Complementarity and selection effects in early and mid-successional plant communities are differentially affected by plant–soil feedback. J. Ecol. 2015, 103, 641–647. [Google Scholar] [CrossRef]
- Garcia, C.; Roldan, A.; Hernandez, T. Ability of different plant species to promote microbiological processes in semiarid soil. Geoderma 2005, 124, 193–202. [Google Scholar] [CrossRef]
- Osaki, M.; Shinano, T.; Tadano, T. Redistribution of carbon and nitrogen compounds from the shoot to the harvesting organs during maturation in field crops. Soil Sci. Plant Nutr. 1991, 37, 117–128. [Google Scholar] [CrossRef]
- Vance, E.D.; Brookes, P.C.; Jenkinson, D.S. An extraction method for measuring soil microbial biomass C. Soil Biol. Biochem. 1987, 19, 703–707. [Google Scholar] [CrossRef]
- Brookes, P.; Landman, A.; Pruden, G.; Jenkinson, D. Chloroform fumigation and the release of soil nitrogen: A rapid direct extraction method to measure microbial biomass nitrogen in soil. Soil Biol. Biochem. 1985, 17, 837–842. [Google Scholar] [CrossRef]
- Kirschbaum, M.U. Does enhanced photosynthesis enhance growth? Lessons learned from CO2 enrichment studies. Plant Physiol. 2011, 155, 117–124. [Google Scholar] [CrossRef] [Green Version]
- Guo, S.; Brück, H.; Sattelmacher, B. Effects of supplied nitrogen form on growth and water uptake of French bean (Phaseolus vulgaris L.) plants. Plant Soil 2002, 239, 267–275. [Google Scholar] [CrossRef]
- Onoda, Y.; Hikosaka, K.; Hirose, T. Allocation of nitrogen to cell walls decreases photosynthetic nitrogen-use efficiency. Funct. Ecol. 2004, 18, 419–425. [Google Scholar] [CrossRef]
- Ralph, P.J.; Gademann, R. Rapid light curves: A powerful tool to assess photosynthetic activity. Aquat. Bot. 2005, 82, 222–237. [Google Scholar] [CrossRef]
- Baker, N.R. Chlorophyll fluorescence: A probe of photosynthesis in vivo. Annu. Rev. Plant Biol. 2008, 59, 89–113. [Google Scholar] [CrossRef] [Green Version]
- Björkman, O.; Demmig, B. Photon yield of O2 evolution and chlorophyll fluorescence characteristics at 77 K among vascular plants of diverse origins. Planta 1987, 170, 489–504. [Google Scholar] [CrossRef] [PubMed]
- Du, Y.; Lu, R.; Xia, J. Impacts of global environmental change drivers on non-structural carbohydrates in terrestrial plants. Funct. Ecol. 2020, 34, 1525–1536. [Google Scholar] [CrossRef]
- Würth, M.K.; Pelaez-Riedl, S.; Wright, S.J.; Körner, C. Non-structural carbohydrate pools in a tropical forest. Oecologia 2005, 143, 11–24. [Google Scholar] [CrossRef] [PubMed]
- Wang, F.; Chen, F.; Wang, G.G.; Mao, R.; Fang, X.; Wang, H.; Bu, W. Effects of experimental nitrogen addition on nutrients and nonstructural carbohydrates of dominant understory plants in a Chinese fir plantation. Forests 2019, 10, 155. [Google Scholar] [CrossRef] [Green Version]
- Glynn, C.; Herms, D.A.; Egawa, M.; Hansen, R.; Mattson, W.J. Effects of nutrient availability on biomass allocation as well as constitutive and rapid induced herbivore resistance in poplar. Oikos 2003, 101, 385–397. [Google Scholar] [CrossRef]
- Müller, I.; Schmid, B.; Weiner, J. The effect of nutrient availability on biomass allocation patterns in 27 species of herbaceous plants. Perspect. Plant Ecol. Evol. Syst. 2000, 3, 115–127. [Google Scholar] [CrossRef] [Green Version]
- Mo, Q.; Chen, Y.; Yu, S.; Fan, Y.; Peng, Z.; Wang, W.; Li, Z.; Wang, F. Leaf nonstructural carbohydrate concentrations of understory woody species regulated by soil phosphorus availability in a tropical forest. Ecol. Evol. 2020, 10, 8429–8438. [Google Scholar] [CrossRef]
- Wu, X.; Du, X.; Fang, S.; Kang, J.; Xia, Z.; Guo, Q. Impacts of competition and nitrogen addition on plant stoichiometry and non-structural carbohydrates in two larch species. J. For. Res. 2021, 32, 2087–2098. [Google Scholar] [CrossRef]
- Lemus, R.; Parrish, D.J.; Abaye, O. Nitrogen-use dynamics in switchgrass grown for biomass. Bioenergy Res. 2008, 1, 153–162. [Google Scholar] [CrossRef]
- Weigelt, A.; Bol, R.; Bardgett, R.D. Preferential uptake of soil nitrogen forms by grassland plant species. Oecologia 2005, 142, 627–635. [Google Scholar] [CrossRef] [PubMed]
Figure 1.
Geographical location of the study area.

Figure 2.
Effects of soil feedback on net photosynthetic rate (Pn) (A), stomatal conductance (Gs) (B), intercellular CO2 concentration (Ci) (C), and transpiration rate (Tr) (D) of early-, mid-, and late-successional species. EarlySp, MidSp and LateSp represent early-, mid- and late-successional species, respectively; EarlySoil, MidSoil and LateSoil represent soils conditioned by early-, mid- and late-successional species, respectively; MixSoil represents a mixture of soils conditioned by early-, mid- and late-successional species, and MMixSoil represents MixSoil planted with early-, mid- and late-successional species, same below. Error bars are standard errors (n = 4). Different letters above the bars indicate significant differences at p < 0.05.

Figure 3.
Effects of soil feedback on Fo (A), Fm (B), Fv/Fm (C), and SPAD values (D) in early-, mid-, and late-successional species. Error bars are standard errors (n = 4). Different letters above the bars indicate significant differences at p < 0.05.
Figure 3.
Effects of soil feedback on Fo (A), Fm (B), Fv/Fm (C), and SPAD values (D) in early-, mid-, and late-successional species. Error bars are standard errors (n = 4). Different letters above the bars indicate significant differences at p < 0.05.

Figure 4.
Effects of soil feedback on soluble sugars (A,B), starch (C,D), and NSC (E,F) concentrations in above- and belowground organs of early-, mid-, and late-successional species. Error bars are standard errors (n = 4). Different letters above the bars indicate significant differences at p < 0.05.

Figure 5.
Effects of soil feedback on leaf (A), stem (B), root (C), and total (D) biomass in early-, mid-, and late-successional species. Error bars are standard errors (n = 4). Different letters above the bars indicate significant differences at p < 0.05.
Figure 5.
Effects of soil feedback on leaf (A), stem (B), root (C), and total (D) biomass in early-, mid-, and late-successional species. Error bars are standard errors (n = 4). Different letters above the bars indicate significant differences at p < 0.05.

Figure 6.
Bidimensional graphs from redundancy representing the relationship between the functional traits of early- (A), mid- (B), and late-successional species (C) and soil fertility factors. AGN plant aboveground N, BGC plant belowground C, BGP plant belowground P, LB leaf biomass, SB stem biomass, RB root biomass, TB total biomass.

Figure 7.
Structural equation modeling of the selected soil fertility variables for functional traits of early- (A), mid- (B), and late-successional species (C). Solid and dashed arrows represent positive and negative correlations, respectively. *** p < 0.001, ** p < 0.01, * p < 0.05.
Figure 7.
Structural equation modeling of the selected soil fertility variables for functional traits of early- (A), mid- (B), and late-successional species (C). Solid and dashed arrows represent positive and negative correlations, respectively. *** p < 0.001, ** p < 0.01, * p < 0.05.

Disclaimer/Publisher’s Note: The statements, opinions and data contained in all publications are solely those of the individual author(s) and contributor(s) and not of MDPI and/or the editor(s). MDPI and/or the editor(s) disclaim responsibility for any injury to people or property resulting from any ideas, methods, instructions or products referred to in the content. |
© 2023 by the authors. Licensee MDPI, Basel, Switzerland. This article is an open access article distributed under the terms and conditions of the Creative Commons Attribution (CC BY) license (https://creativecommons.org/licenses/by/4.0/).
Share and Cite
MDPI and ACS Style
Ai, Z.; Li, J.; Li, X.; Zhang, J.; Liu, H.; Xu, H.; Liu, G.; Xue, S. Plant Traits Variably Respond to Plant–Soil Interactions during Secondary Succession on the Loess Plateau. Forests 2023, 14, 726. https://doi.org/10.3390/f14040726
AMA Style
Ai Z, Li J, Li X, Zhang J, Liu H, Xu H, Liu G, Xue S. Plant Traits Variably Respond to Plant–Soil Interactions during Secondary Succession on the Loess Plateau. Forests. 2023; 14(4):726. https://doi.org/10.3390/f14040726
Chicago/Turabian StyleAi, Zemin, Jiayi Li, Xinghua Li, Jiaoyang Zhang, Hongfei Liu, Hongwei Xu, Guobin Liu, and Sha Xue. 2023. "Plant Traits Variably Respond to Plant–Soil Interactions during Secondary Succession on the Loess Plateau" Forests 14, no. 4: 726. https://doi.org/10.3390/f14040726
Note that from the first issue of 2016, this journal uses article numbers instead of page numbers. See further details here.