

An Ensemble Model for Forest Fire Occurrence Mapping in China
by
 , ,
, ,
Yakui Shao
1,† ,
,
Zhongke Feng
1,* ,
,
Meng Cao
2,†, 
Wenbiao Wang
3,*,
Linhao Sun
1,
Xuanhan Yang
4,
Tiantian Ma
4,
Zanquan Guo
2,
Shahzad Fahad
4,
Xiaohan Liu
1 and
Zhichao Wang
4,* 1
Precision Forestry Key Laboratory of Beijing, Beijing Forestry University, Beijing 100083, China
2
Forest Steppe Fire Prevention Research Center, China Fire and Rescue Institute, Beijing 102202, China
3
Yili Desert and Ecological Science and Technology Center, Elion Resources Group, Beijing 100026, China
4
Surveying and 3S Engineering Research Center, Beijing Forestry University, Beijing 100083, China
*
Authors to whom correspondence should be addressed.
†
These authors contributed equally to this work.
Forests 2023, 14(4), 704; https://doi.org/10.3390/f14040704
Submission received: 15 February 2023
/
Revised: 23 March 2023
/
Accepted: 24 March 2023
/
Published: 29 March 2023
(This article belongs to the Special Issue Forest Fires Prediction and Detection)
Abstract
:Assessing and predicting forest fires has long been an arduous task. Nowadays, the rapid advancement of artificial intelligence and machine learning technologies have provided a novel solution to forest fire occurrence assessment and prediction. In this research, we developed a novel hybrid machine-learning-technique algorithm to improve forest fire prediction based on random forest (RF), gradient-boosting decision tree (GBDT), support vector machine (SVM), and other machine learning models. The dataset we employed was satellite fire point data from 2010 to 2018 from the Chinese Department of Fire Prevention. The efficacy and performance of our methods were examined by validating the model fit and predictive capability. The results showed that the ensemble model LR (logistic regression)-RF-SVM-GBDT outperformed the single RFSVMGBDT model and the LR-RF-GBDT integrated framework, displaying higher accuracy and greater robustness. We believe that our newly developed hybrid machine-learning algorithm has the potential to improve the accuracy of predicting forest fire occurrences, thus enabling more efficient firefighting efforts and saving time and resources.
1. Introduction
Large-scale forest fires can result in considerable environmental damage, atmospheric pollution, decreased wildlife populations, altered soil composition, and the potential for significant loss of human life and property [1]. On the other hand, small-scale forest fires can be beneficial for plant regeneration, eradication of pests and diseases, and increased soil fertility [2]. China is one of the countries of the world most prone to forest fires. Moreover, forest fire risk prediction is a critical component of effective fire management and strategic planning. Therefore, the identification of hazard areas based on fire maps is critical to the development of effective fire management plans and the proper allocation of firefighting resources [3,4].
Forest fires are driven by a combination of natural (e.g., topographical, vegetative, climatic and meteorological) and anthropogenic (human-influenced) factors [5]. Accordingly, methods for predicting forest fires include forest fire weather forecasting, forest fire occurrence forecasting, and forest fire behavior forecasting [6]. In forest fire weather forecasting, conventional methods predict the likelihood of a forest fire occurring in relation to meteorological conditions, without consideration of the ignition source [7]. In contrast, forecasts of forest fire occurrence should take into account a variety of factors, including meteorological changes, forest fuel-material conditions, and the potential risk of fire occurrence, in order to evaluate the probability of forest fires [8]. Technically, the prognostication of various indicators, such as the rate of propagation and the rate of energy release, or fire intensity, shortly following a forest fire, is known as forest fire behavior forecasting [9]. Only a comprehensive combination of these factors can result in a precise prediction [10].
Research on forest fire occurrence prediction methods and techniques can be divided into three categories: physical approaches, statistical approaches, and machine learning (ML) approaches [11,12]. Nowadays, researchers are increasingly devoting attention to ML algorithms, such as random forest, support vector machine (SVM), gradient boosting decision tree (GBDT), and multilayer perceptron, which can effectively predict the occurrence of forest fires. When used alone, these ML methods can simplify the implementation process of the model, and model optimization and adjustment can also be more easily achieved [12]. However, especially when used in isolation, these ML methods also have some drawbacks. For example, the utilization of ML methods necessitates immense datasets for training and validation and is heavily reliant on the quality of the data. Additionally, its intricate nature and propensity to rapidly evolve exacerbate its incapacity to effectively process complex, ever-altering problems and capitalize on the information and potential features of the data. Therefore, from our point of view, single ML prediction models have inherent limitations. The conceptual basis and technical characteristics of ensemble techniques possess considerable potential to contribute to the forecasting of forest fire risk [13].
In this study, our aim was to produce high-quality forest fire occurrence maps. Mapping the potential for forest fires is essential for forest fire risk assessment. Current research is confined to specific geographic regions, and there is a paucity of studies on the national-level distribution and predictive analysis of forest fires. To support an extensive spatial analysis, satellite hotspot data are an efficient and effective method to provide scientific data support for forest fire management and can provide the most direct and pertinent data for forest fire risk assessment. Accordingly, the objectives of this study are to (i) evaluate the difference between single ML models and ensemble models for the assessment of forest fire occurrence likelihood in China; (ii) determine the best integration of single ML models; (iii) employ geographic spatial analysis tools, such as standard deviation ellipses and centroid displacement, for the identification of high-risk areas and the assessment of the evolution characteristics of historical forest fires in China; and (iv) develop models utilizing readily available data to enhance the applicability and generality of model-building techniques.
2. Data and Methods
2.1. The Study Area
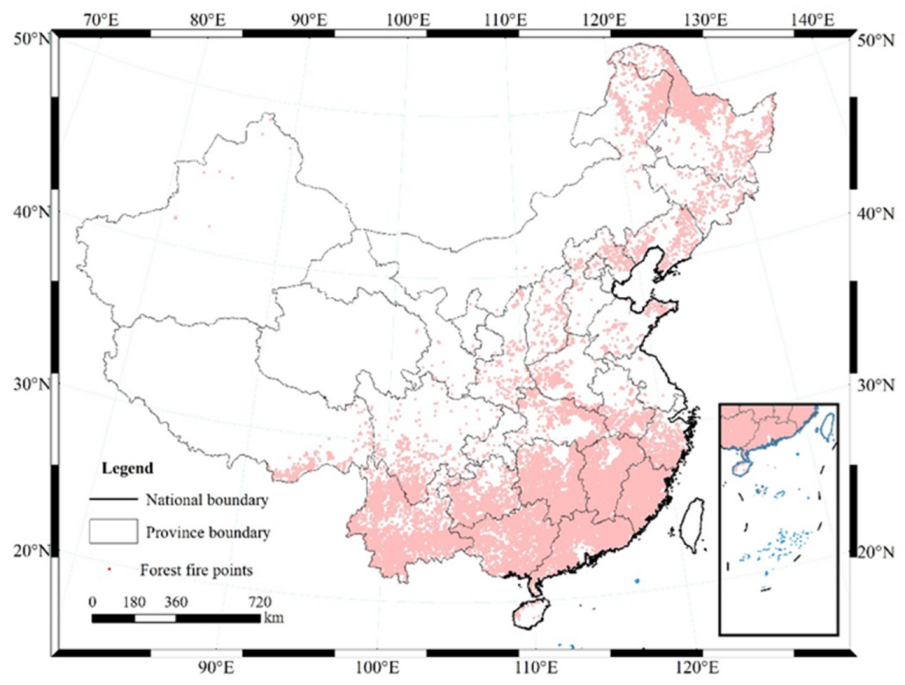
China encompasses multiple climatic zones, ranging from tropical to subtropical and temperate, exhibiting a complex and diverse spectrum of climates with pronounced north–south variations. Its topography is characterized by highlands and plateaus in the west and comparatively lower regions in the east, with an abundance of mountains, hills, and other geographic entities [14]. Dense woodlands are situated in the mountainous parts of the southeastern and southwestern regions, and there is a vast expanse of desert in the northwestern region [15]. In comparison with developed countries with well-established forestry industries, China has a comparatively lower-quality of forest resource and a geographically imbalanced regional distribution. China is still a country with insufficient forest coverage and a relatively fragile ecological environment. As shown in Figure 1, we selected 121,691 forest fire points.
2.2. Data Sources and Method
The China National Satellite Monitoring Hotspot Data from 2010 to 2018, which were produced by the Forest Fire Warning and Monitoring Information Center of the Ministry of Emergency Management [16], served as an essential data source in our research. The primary elements in this dataset consisted of temporal information, longitudinal and latitudinal coordinates, and land type.
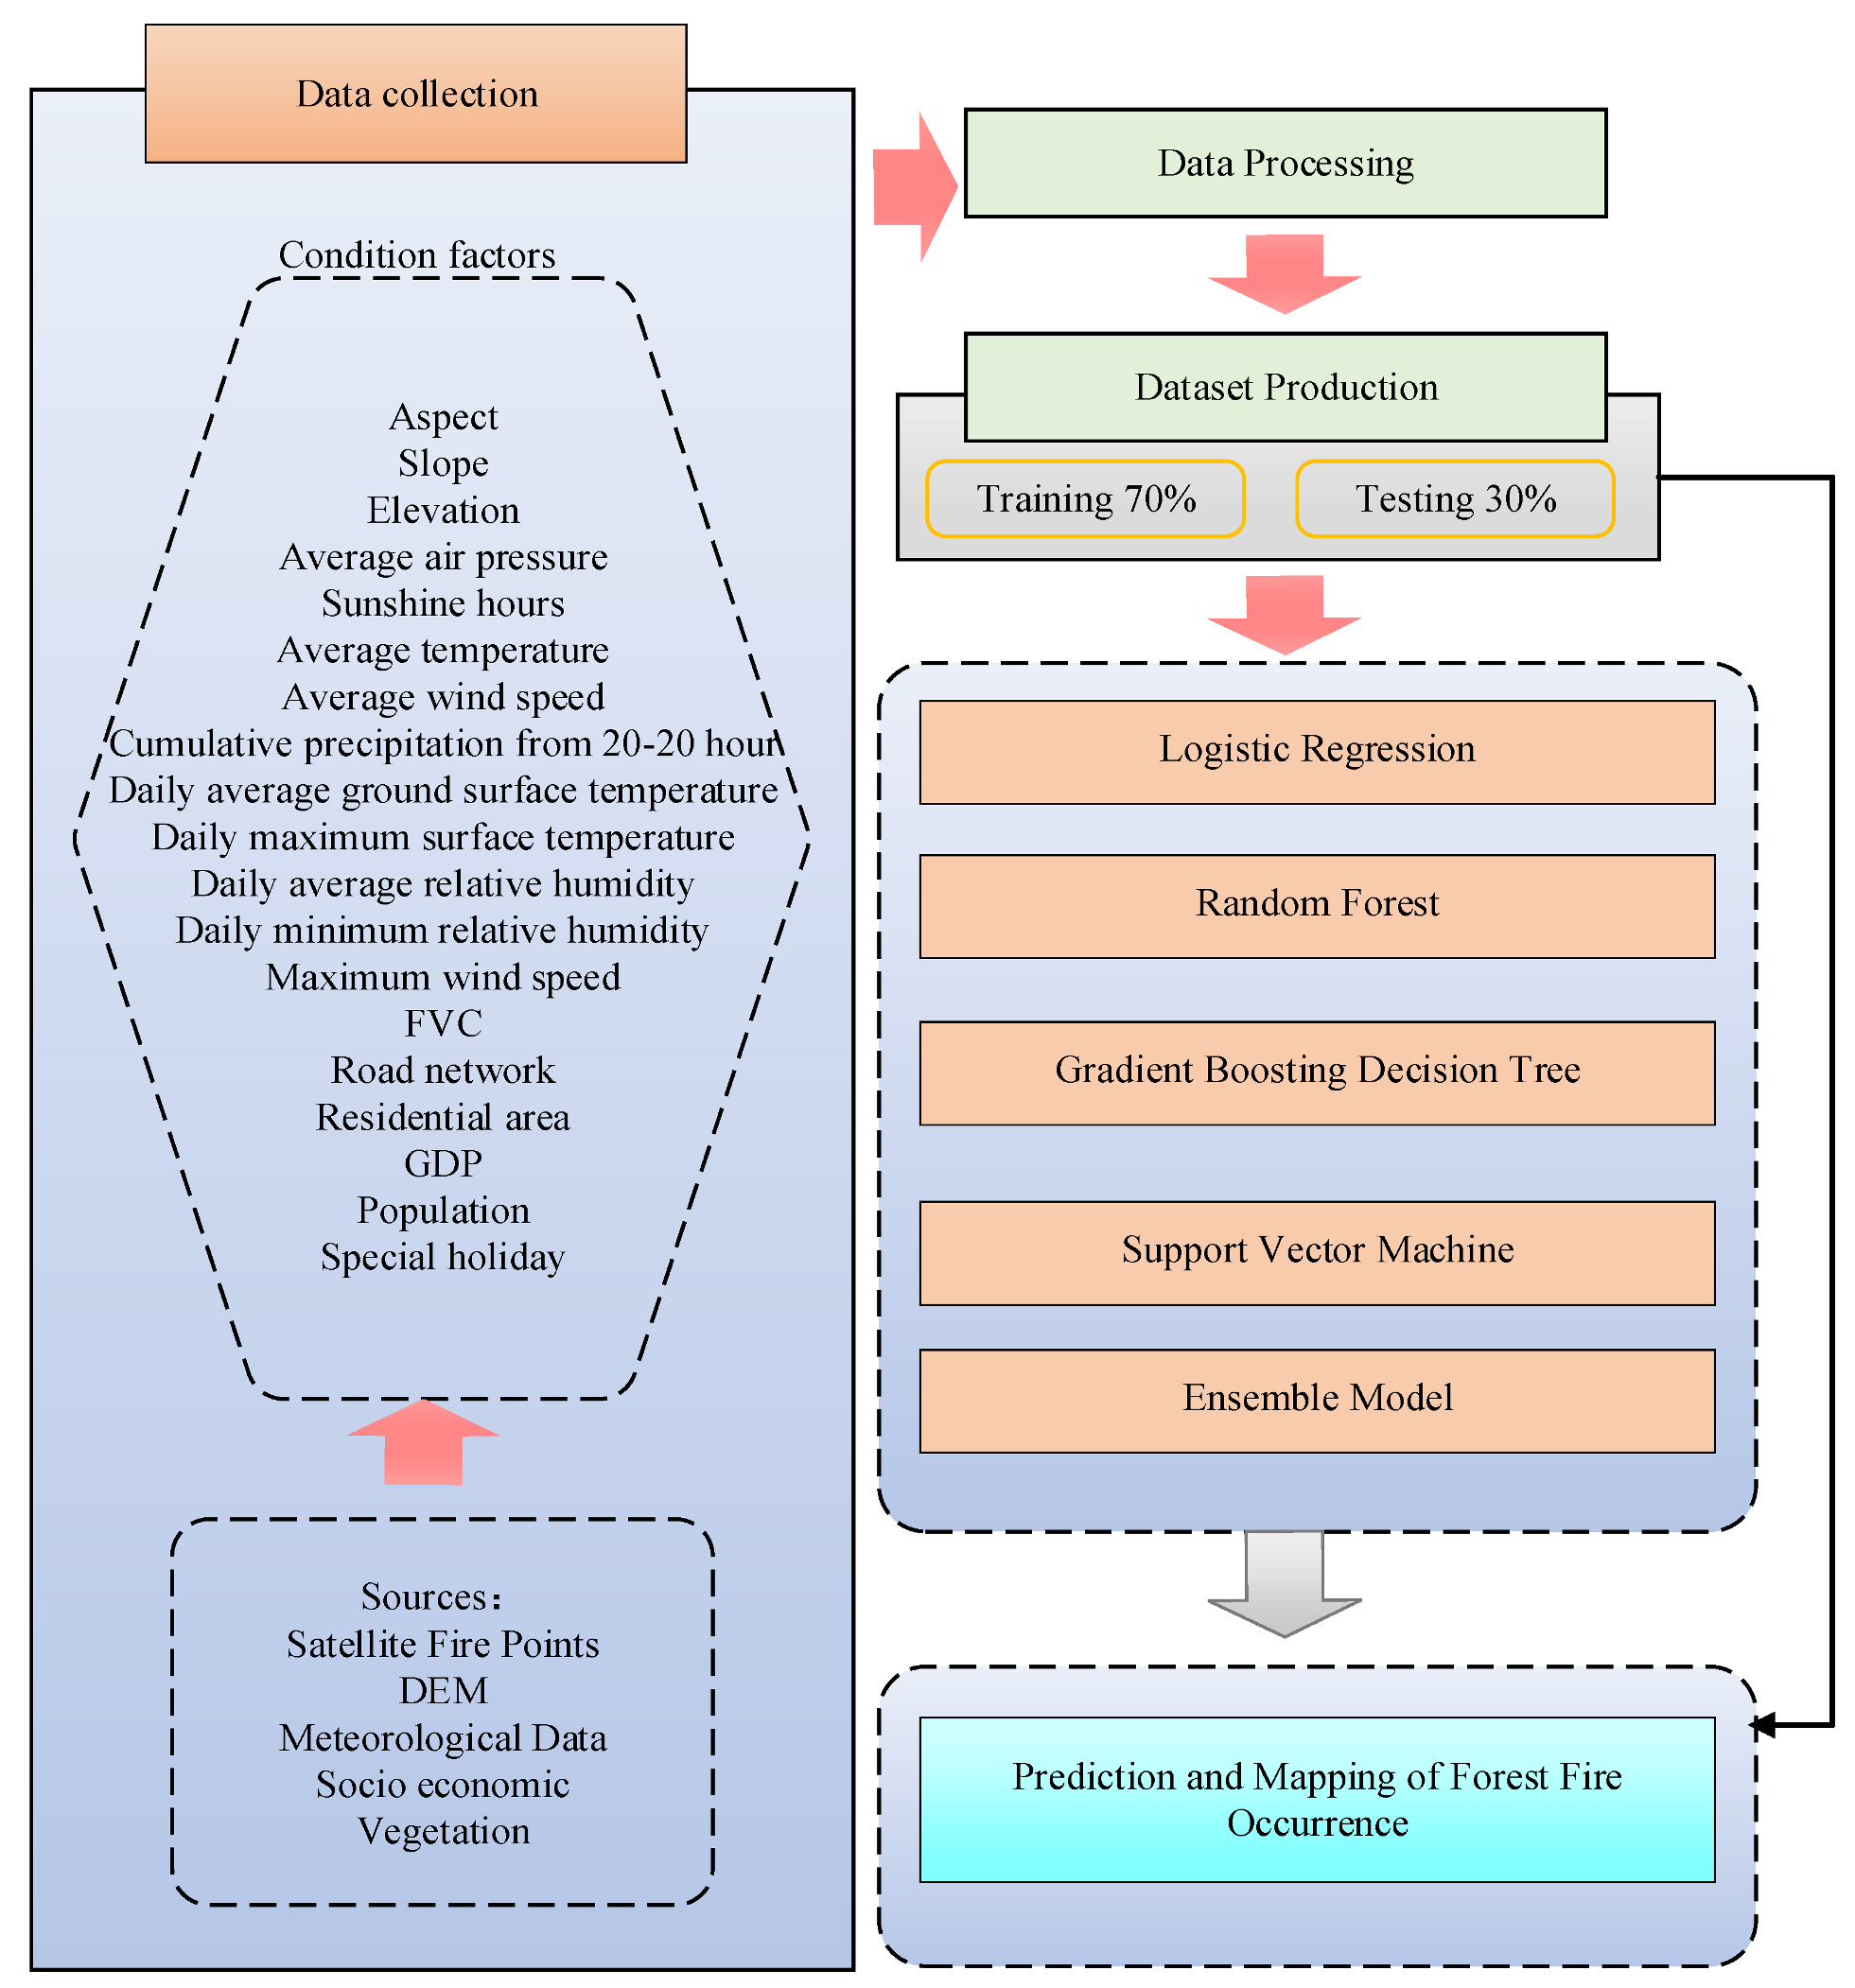
As shown in the technology roadmap (Figure 2), at the data processing stage, we filtered the forest fire data (121,691 items) from the raw dataset. Then, a binary classification was applied to the attribute, with a value of “1” indicating fire locations and a value of “0” indicating non-fire locations. In the next step, we randomly generated approximately the same number of non-fire points (127,257). Meanwhile, we validated the prediction model using independent data in pursuit of greater reliability of the final results.
At the dataset production stage, two subsets of the forest fire ignition points were randomly selected (70% of the data were used for training, and 30% of the data were used for validation). The determinants of forest fire occurrence (with reference to our previous studies) were identified for analysis [8,12]. To be specific, we selected the following condition factors: weather variables (mean temperature, average air pressure, average wind speed, daily average relative humidity, daily minimum relative humidity, maximum wind speed, and sunshine hours), topography (aspect, slope, and elevation), socioeconomic (road network, residential area, Gross Domestic Product, population, and special holiday (Qingming Festival, Hungry Ghost Festival, Spring Festival, Lantern Festival, etc.)), and vegetation (FVC), with topography, vegetation, population, and economic data being obtained from the Resource and Environmental Science Data Center of the Chinese Academy of Sciences (https://www.resdc.cn (accessed on 8 December 2021) and data on roads and residential areas being obtained from https://www.webmap.cn (accessed on 18 December 2020).
2.2.1. Mann–Kendall Mutation Test
The Mann–Kendall mutation test is a method for examining temporal variability for possible mutational changes, with the salient benefits of straightforward implementation, high accuracy, broad assessment scope, minimal human interference, and an elevated degree of quantification [17]. The sequence of values generated by the time series x of n samples can be regarded as a representation of the underlying temporal dynamics. By analyzing this sequence, it is possible to gain insight into the temporal evolution of the system that produced the data [18]:
The resulting sequence is a random-order series, obeying the normal scoring variables to calculate [19]:
where represents the expected value, the variance represents the variance, and the is a typical normal distribution. That is, the statistical order is derived from the time series order , the statistics sequence by time series reverse is calculated, the above process is repeated, and is calculated. If the UF or UB value is greater than 0, the time series is up and down; when these values are above or below the critical line (significance level line), it is obviously up or down, and the range beyond the critical line is determined as the mutation time region of the critical line [20].
2.2.2. Standard Deviation Ellipse
Standard Deviational Ellipse (SDE) is a useful method for spatial statistics that effectively reveals the properties of the spatial distribution of geographical elements in general [21,22]. The center of the standard deviation ellipse, as well as the center of gravity of the geographical element, reflects the relative position of the forest fire occurrence on the spatial distribution in two dimensions. The equation to quantify the alteration in the position and orientation of the center is as follows [23]:
where and are the coordinates of variable ; denotes the average center of the variable; and is the full count of variables. The direction of the long axis of the ellipse reflects the direction of the main trend of the distribution of forest fire occurrence in two dimensions; the direction is perpendicular to the short axis; the long and short axes show the distribution range of the geographical elements; and the x-axis length and y-axis length of the ellipse distribution formulae are as follows [24]:
where and denote the geographic coordinates (latitude and longitude) of the fire location, and and represent the specific latitude and longitude coordinates of the grid fire points. The ratio of the long and short axes is the flatness ratio, which can reflect the spatial distribution of forest fires.
2.2.3. Logistic Regression
Logistic regression (LR) is classified as a statistical model known as a “generalized linear model”. Although LR is not an unsupervised ML model, it has achieved good results in forest fire prediction [26,27]. The formula of the LR model is as follows [28]:
The LR model attains a classification effect by identifying a monotone differentiable function that links the true label of the classification task to the estimated value of the linear regression model. We set the probability of a forest fire occurring as and the probability of it not occurring as ; therefore, the occurrence ratio (i.e., the ratio of the probability of being satisfied to the probability of being dissatisfied) is , and is positively related to . The model was used in this study for wildfire susceptibility mapping by adding a fitted link function to a typical linear regression model. A logistic regression model is the model most commonly used to study dichotomous problems, because it is simple, parallelizable, and interpretable [29].
2.2.4. Random Forest
The random forest (RF) model is a classifier proposed by Breiman (2001) that uses multiple decision trees to train and predict samples [30]. A categorical regression tree (CART) is employed as the meta-classifier while employing a bagging sampling to generate multiple training sets. Furthermore, a put-back sampling method is utilized to draw a subset of training samples, and a split attribute set is randomly chosen to train the sub-regression tree model. The final result is generated by a multiple decision tree vote [31]. The formula of the RF model is as follows [32]:
where is the number of decision trees, is an independent identically distributed random vector, is the input vector, and the final prediction is the mean of each regression subtree . The number of random features and trees determines the final predictive power of the model.
2.2.5. Gradient Boosting Decision Tree
A gradient-boosted decision tree (GBDT) is an iterative decision tree algorithm that consists of multiple decision trees, with the conclusions of all the trees adding up to give the final answer [34]. GBDT determines the parameters for the next decision tree by loss function reduction using the following equation [35]:
where denotes the decision tree; denotes the parameters of the tree; is the number of trees, denotes the loss function of the decision tree , and is used to denote the current decision tree.
GBDT can explain the non-linear relationship between variables and does not assume a linear relationship between predictor variables and response variables. The model predicts with high accuracy and solves the problem of multiple covariance, but the GBDT model needs to perform a large number of sorting operations in the process of implementation, and how to implement an efficient sorting method is a challenge in itself [36].
2.2.6. Support Vector Machine
Support vector machine (SVM) models are a class of generalized linear classifier proposed by Vapnik (1995) for binary classification of data by supervised learning [37,38]. The fundamental concept is that a non-linear mapping is applied to the input vector so as to transform it into a high-dimensional feature space, and the optimal classification hyperplane is then established in this space in order to augment the divergence between positive and negative examples [39,40]. In the case of non-separability, the following equation [39] is used to introduce the relaxation variable :
Then, for misclassification introduce , with the following equation [41]:
SVM has been demonstrated to be advantageous in addressing issues with limited datasets, non-linear difficulties, and high-dimensional datasets; however, it is relatively inefficient and time-consuming when utilized with large samples [42].
2.2.7. Ensemble Model and Validation
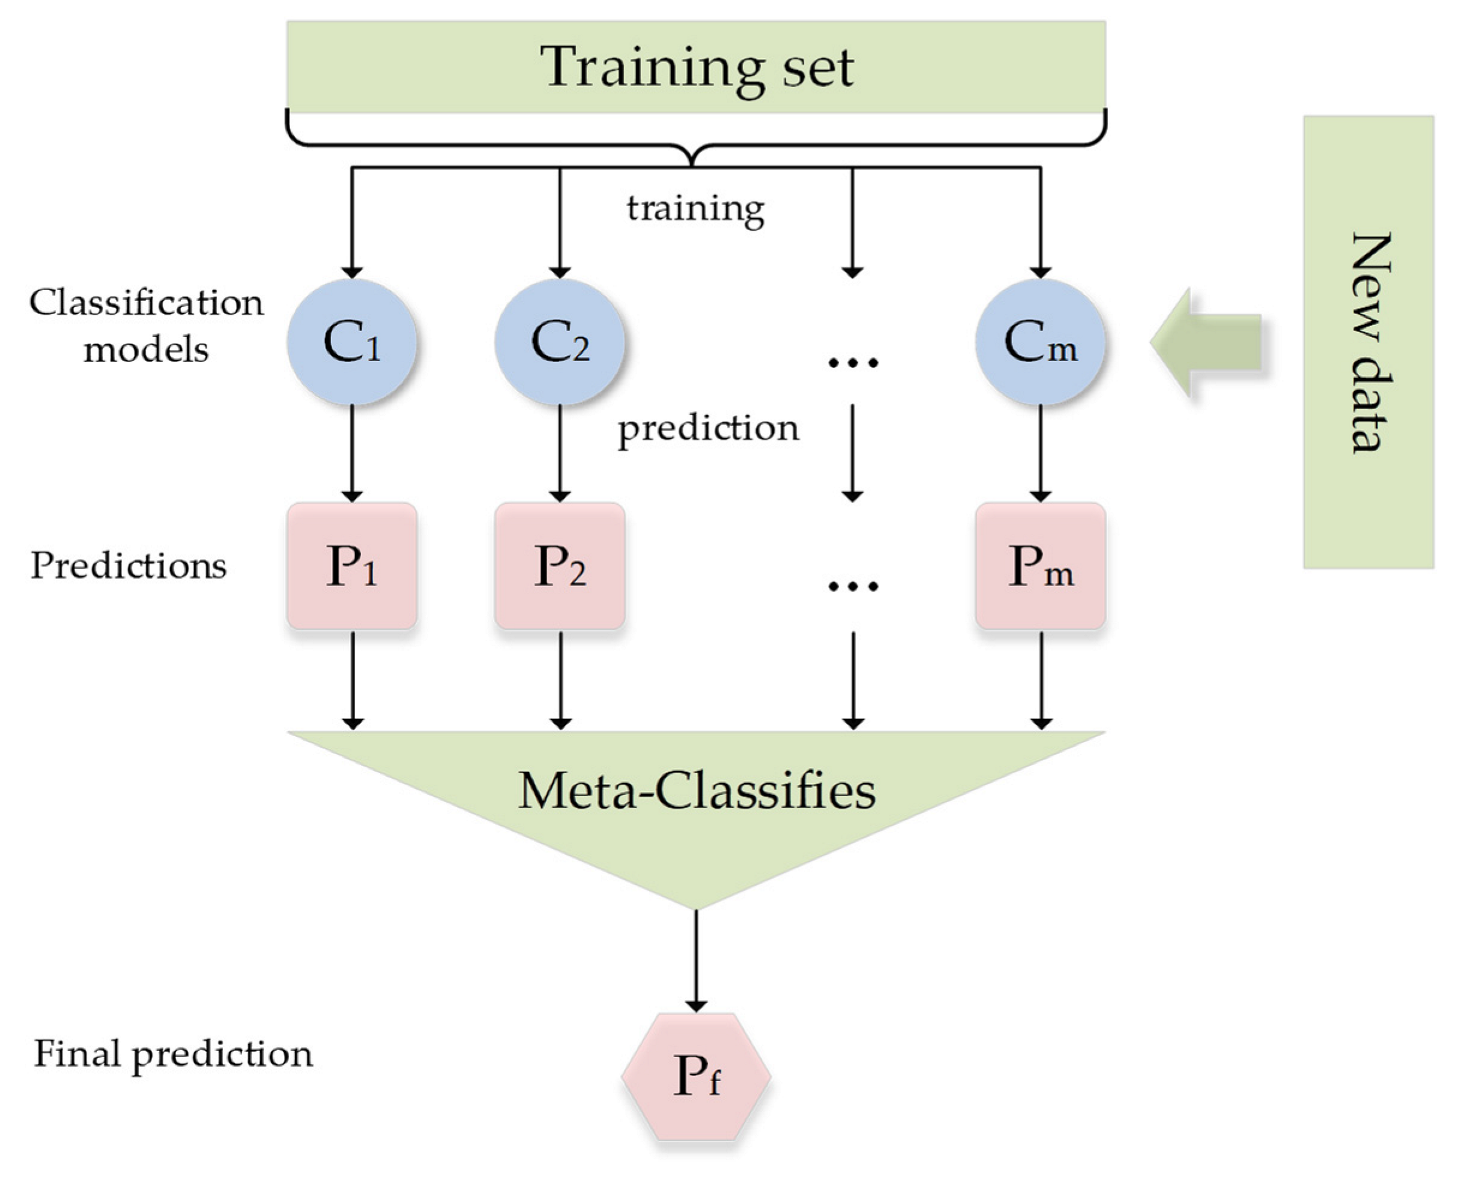
The prediction of the jth base model for the ith training sample is used as the jth feature value for the ith sample in the new training set, and final training is based on the new training set. Similarly, the prediction process goes through the predictions of all the base models to form a new test set, and finally, the predictions are made on the test set. The base models (base classifiers) used are RF, GBDT, SVM, and the target classifier is logistic regression, as shown in Figure 3.
In order to make a valid comparison of the predictive efficacy of the models for forest fire probability [12], accuracy, precision, AUC, and recall should be taken into account [12]. The percentage of samples that the classifier correctly identifies as belonging to a given dataset is known as accuracy. The precision indicates how many of the samples that were expected to be positive were actually positive. The recall indicates if the model has a tendency to underestimation. The calculation formulae for these indicators are as follows [43]:
TP and TN are the numbers of positive and negative samples correctly predicted, and FP and FN are the numbers of positive and negative samples incorrectly predicted. AUC (area under curve) is defined as the area under the ROC curve and the coordinate axis. As a value to visually evaluate the goodness of the model, the closer the AUC is to 1.0, the higher the authenticity of the detection method, and the better the prediction effect [44].
3. Results
3.1. Changing Trends
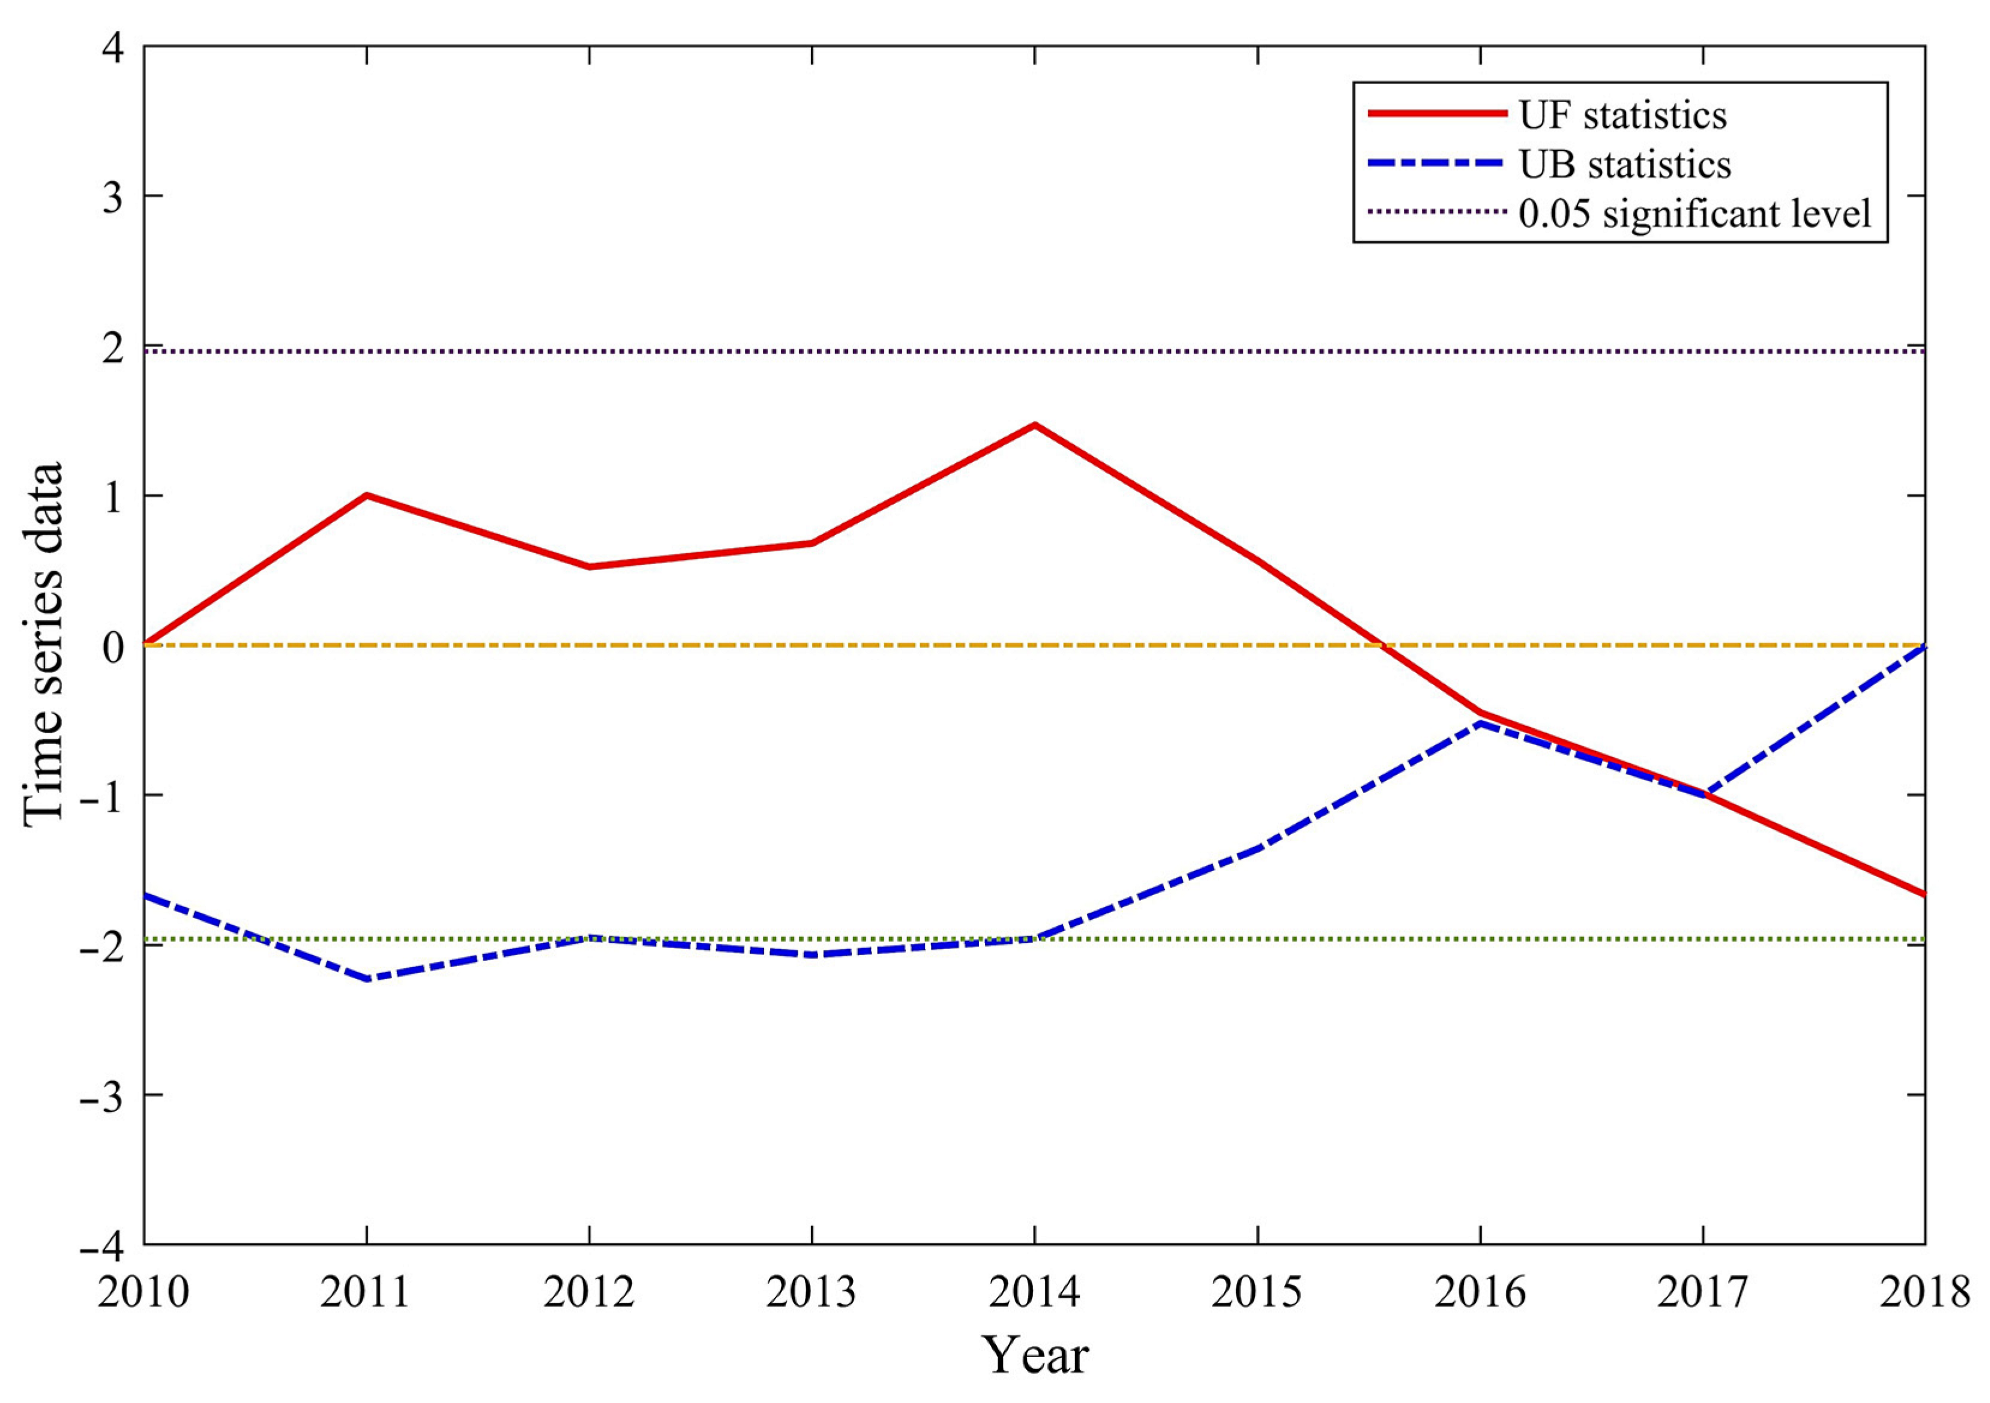
Figure 4 shows the result of the Mann–Kendall test for forest fires in China from 2010 to 2018. An analysis of the UF values of forest fires in China between 2010 and 2018 reveals a fluctuating downward trend. From 2010 to 2015, the UF values were greater than zero, indicating an upward trend in the number of hotspots. However, from 2016 to 2018, UF values declined to below zero, indicating a downward trend in the number of hotspots. Nonetheless, the UF curve never exceeded the 0.05 (±1.96) confidence line, indicating that both the upward and downward trends were of low significance.
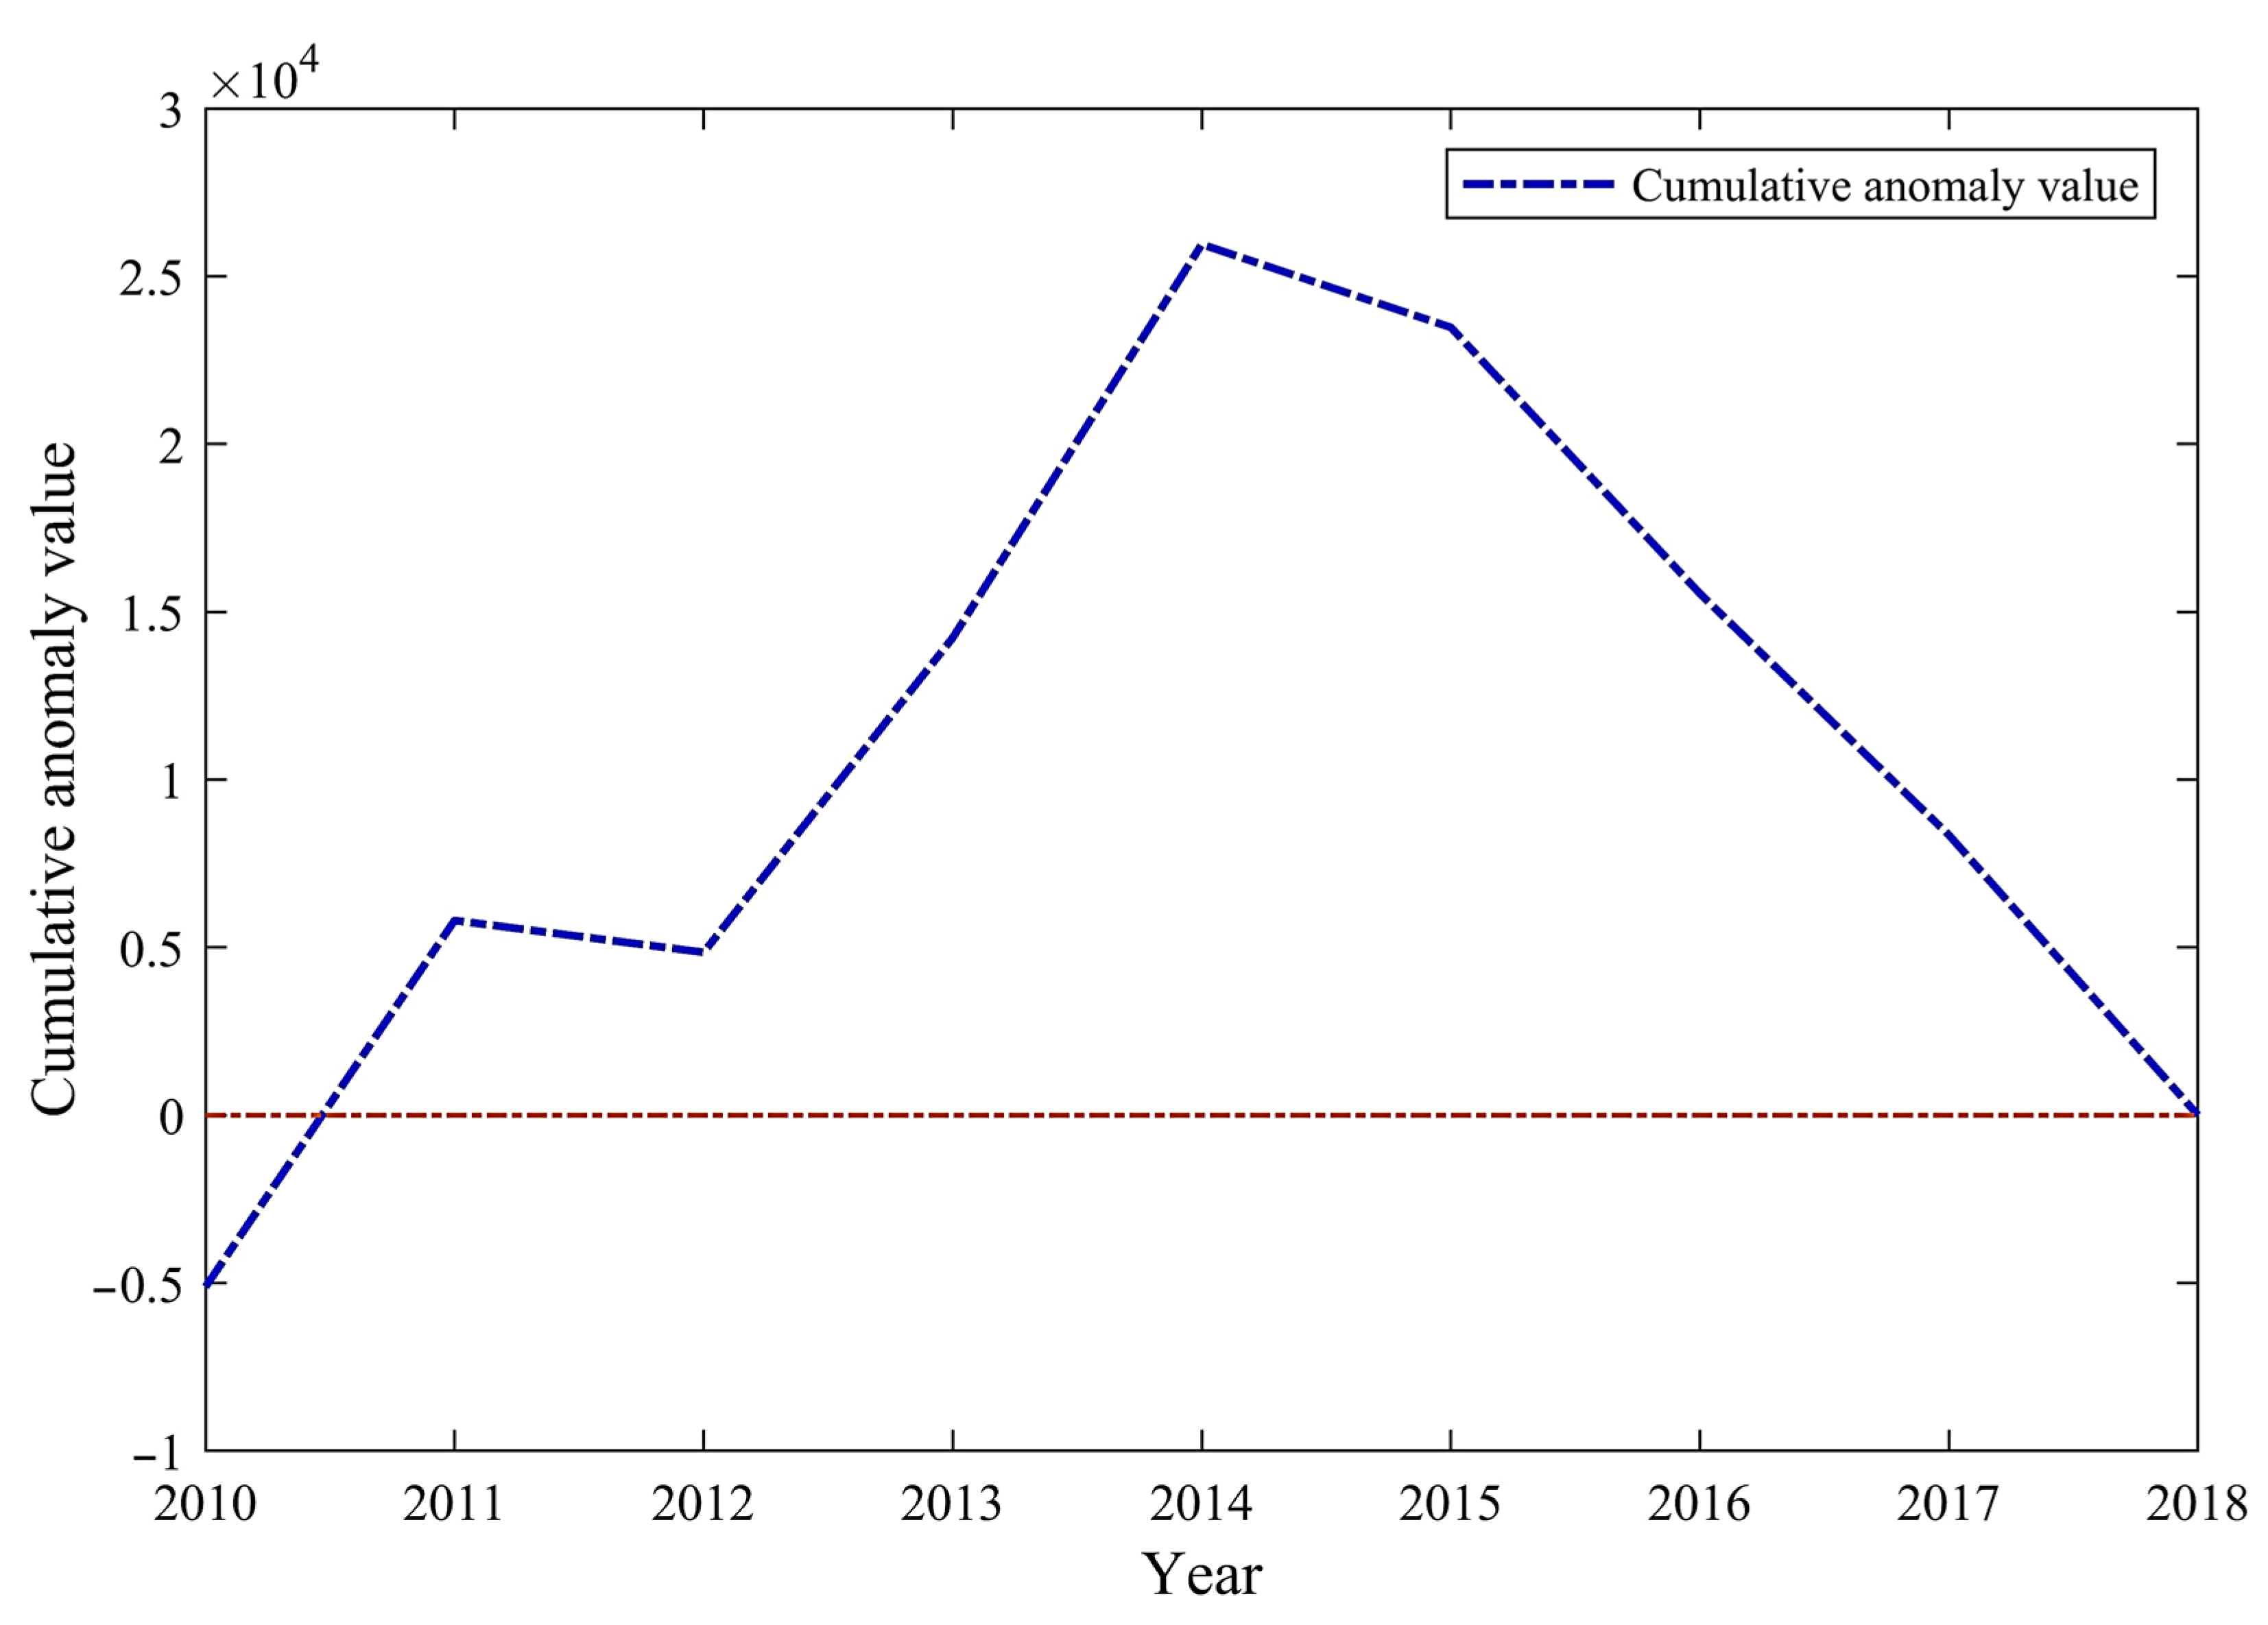
Figure 5 presents a cumulative anomaly curve of forest fire points in China from 2010 to 2018. This curve indicates the total number of anomalies for each year. For 2017, a significant alteration in the cumulative-distance leveling curve (illustrated in Figure 5) is observed. The intersection of UF and UB within the confidence line at this point confirms that it is a viable point to identify a dramatic transformation in the number of national hotspots from 2010 to 2018.
3.2. The Result of Standard Deviation Ellipse Analysis
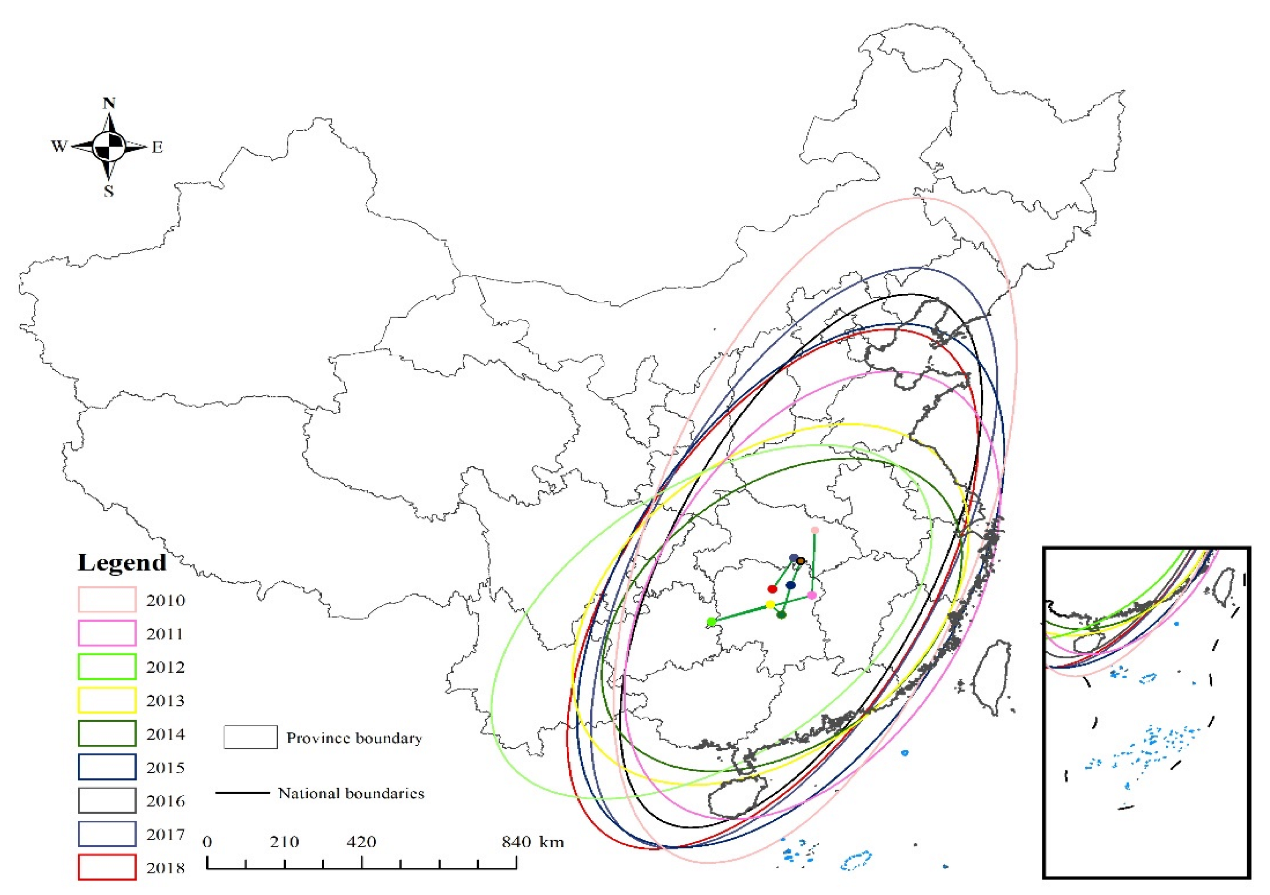
By plotting the standard deviation ellipses of fire points in China from 2010 to 2018, it is possible to visually reflect the spatial clustering characteristics and temporal changes of fire points. As shown in Table 1, between 2010 and 2011 and 2015 and 2018, the azimuths of the fire points fluctuated in the range of 18°–28°. However, between 2012 and 2014, the azimuths of the fire points increased to 40°–50°, suggesting a noticeable shift of the fire points towards the east. Despite the angle of shift not being extremely large, the overall pattern still demonstrated a southwest–northeast orientation.
The short semi-axis of the national fire point predominantly oscillated between 650 and 750 km, with a decrease from 740.77 km to 586.32 km from 2015 to 2016. In contrast, the long semi-axis of the fire point experienced a slight overall contraction from 1759.23 km to 1446.08 km from 2010 to 2018, albeit exhibiting a slight augmentation trend from 2014 to 2017. The national fire point has been contracting in the north–south direction in accordance with the short and long semi-axes yet has remained relatively stable in the east–west direction. Furthermore, the rate of flattening has seen a slight decrease from 2010 to 2014, followed by a slight increase from 2014 to 2018.
It is evident that the trend of east–west expansion of the fire point occurrence area from 2010 to 2014 was considerably more intense than that of the north–south expansion. This implies that the influence of the fire point occurrence area in the east–west direction was becoming more pronounced. Conversely, from 2014 to 2018, the trend of east–west expansion was much weaker than that of the north–south expansion, indicating that the influence of the fire point occurrence area in the north–south direction was increasing. This is further evidenced by the overall flattening rate from 2010 to 2018.
As shown in Figure 6, over the time period from 2010 to 2012, there was a tendency for the center of gravity of the fire points to move in a southwestern direction. Conversely, from 2012 to 2018, the center of gravity of the fire points shifted to a northeasterly direction. Between 2010 and 2018, the center of gravity of fire points was predominantly located in the provinces of Hubei and Hunan, eventually shifting to Hunan. During the 2010–2011 period, this center of gravity moved southward by 329.299 km, and then by 462.434 km during the 2011–2012 period, indicating a notable rise in fire occurrences in the southern region. In contrast, northward movement was observed in the 2012–2017 period, with a slight southward shift in 2013–2014, representing a minor increase in the number of fires in the south.
The majority of the area encompassed by the standard deviation ellipse is situated to the east of the Heihe–Tengchong line, which is largely due to the frequent occurrence of fires caused by human activity.
3.3. Accuracy Assessment
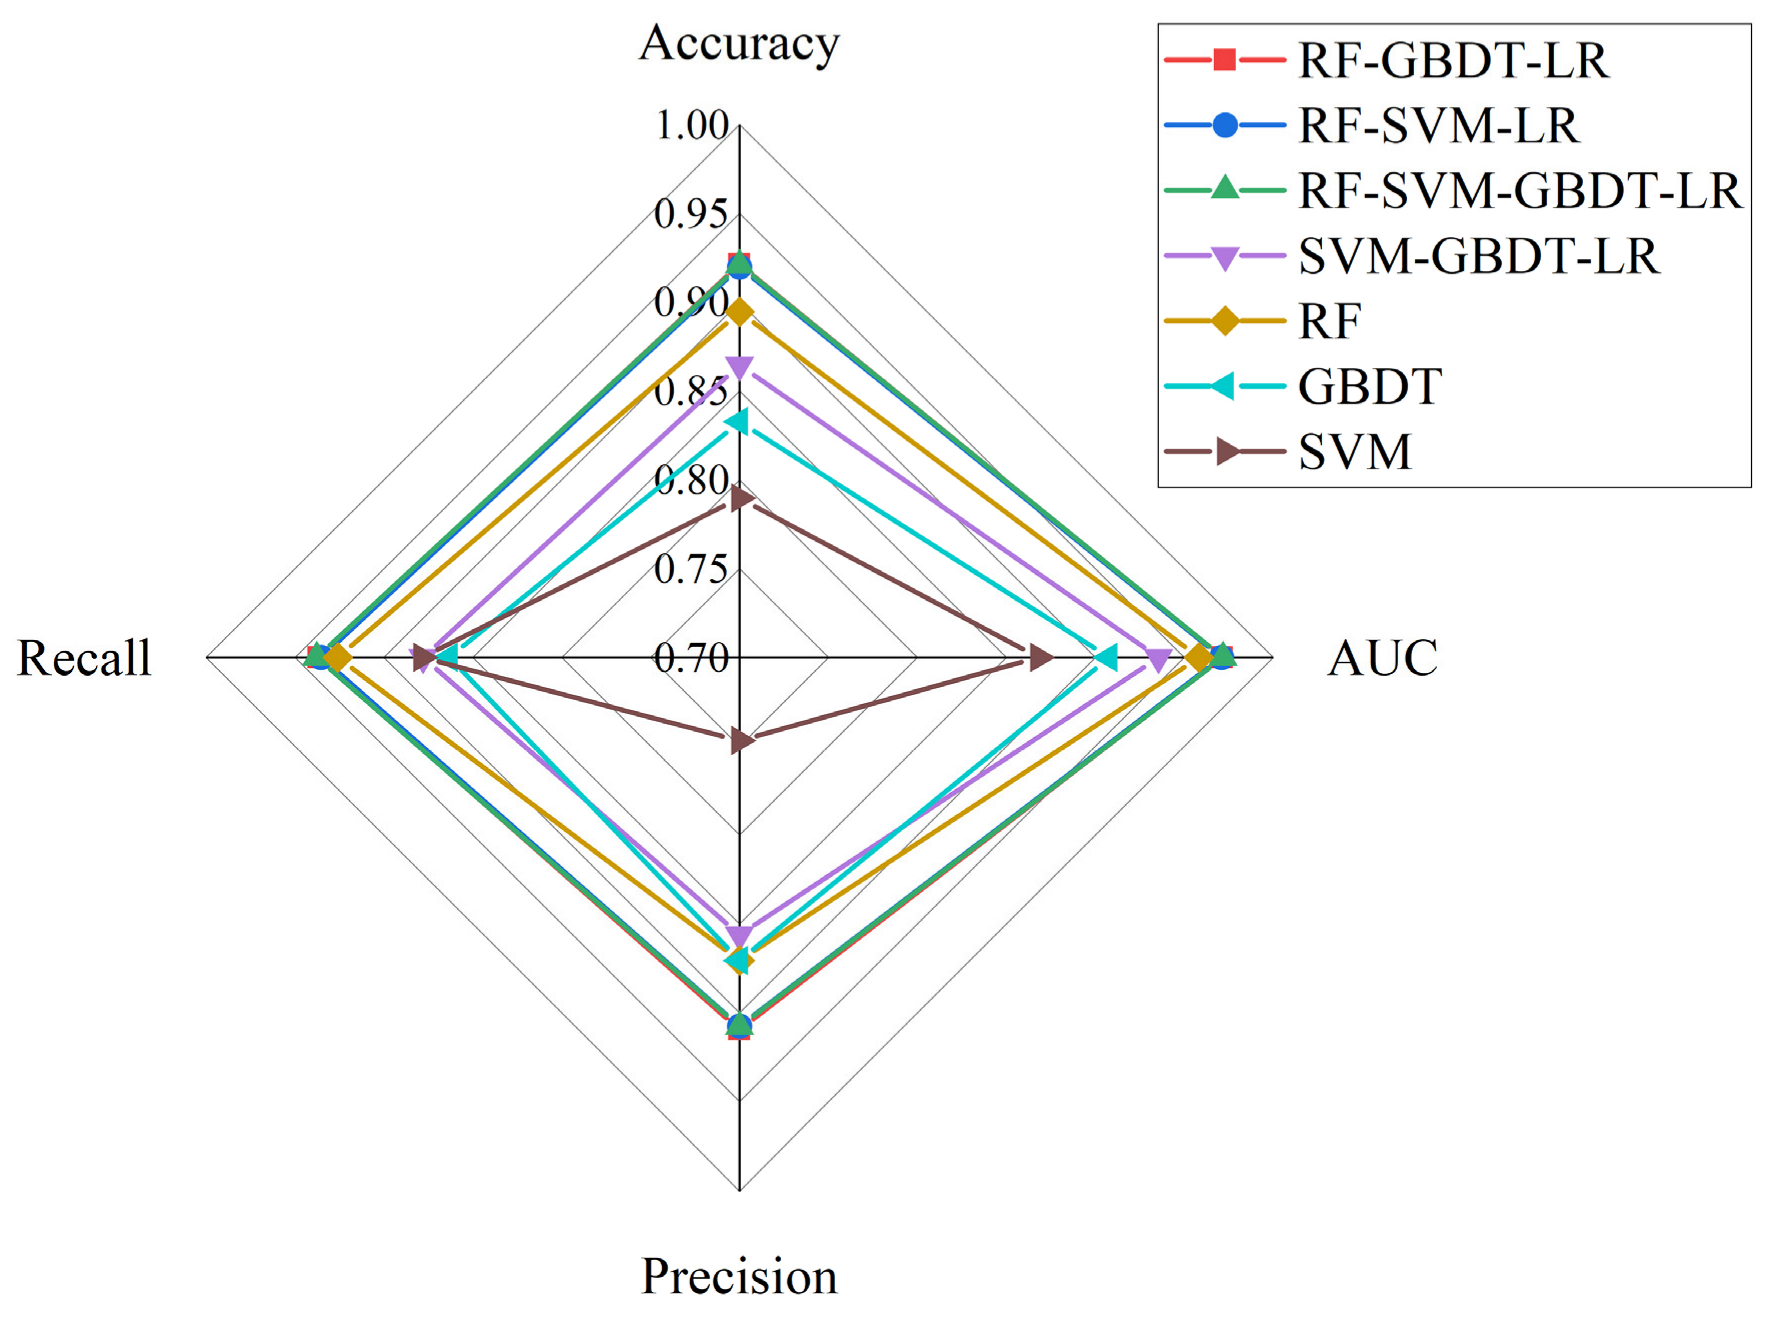
The effectiveness of the individual machine-learning models and the hybrid models was validated using accuracy, AUC, precision, and recall metrics. According to the validation results (shown in Figure 7), the higher accuracy values indicate that the models have better predictions for positive samples, and the order of the accuracy values for these models is LR-RF-SVM-GBDT > LR-RF-GBDT > LR-RF-SVM > RF > GBDT > SVM, with SVM performing the worst. LR-RF-SVM-GBDT performed best, with accuracy of 92.10%, precision of 90.80%, AUC of 97.17%, and recall of 93.77%; LR-RF-GBDT performed second only to LR-RF-SVM-GBDT, with accuracy of 92.14%, precision of 90.90%, AUC of 97.12%, and recall of 93.66%; and SVM performed the worst, with accuracy of 78.97%, precision of 74.67%, AUC of 86.81%, and recall of 87.88%. In this study, the number of GBDT weak learners was set to 100, the learning rate was 0.1, the number of RF decision trees was set to 50, and the SVM kernel function selected was RBF 3.4.
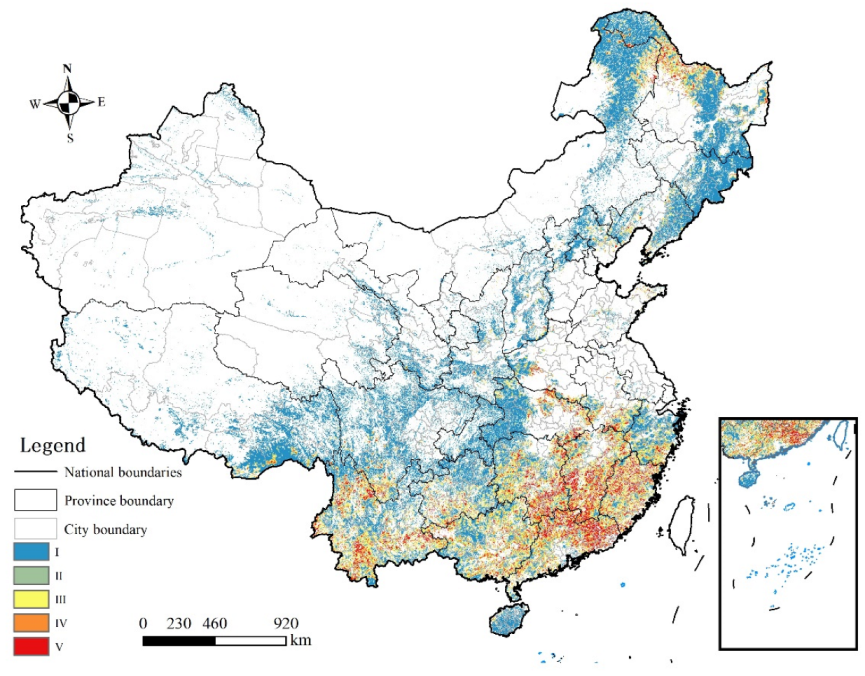
The predicted probabilities are divided into five classes, according to their likelihood of occurrence. Class I ranges from 0 to 0.2 and indicates a very low probability; Class II from 0.2 to 0.4, representing a low probability; Class III from 0.4 to 0.6, indicating medium probability; Class IV from 0.6 to 0.8, exhibiting a high probability; and Class V from 0.8 to 1, signifying a very high probability. As shown in Figure 8, Our results indicate that high-risk zone V is mainly located in the northeast (Heihe and Daxinganling regions of Heilongjiang Province), south China (Heyuan city and Qingyuan city in Guangdong Province, Fuzhou city and Ningde city in Fujian Province), southwest China (Pu’er city and Lijiang city in Yunnan Province, Panzhihua city in Sichuan Province), and south-central China (Hengyang city and Liuzhou city in Hunan Province, Ji’an city in Jiangxi Province). The spatial distribution of forest fires in China is characterized by a clear geographical distribution, with the regions with a high probability of forest fires being mainly concentrated in the northeastern region (Heilongjiang Province’s Daxing’anling area, Liaoning Province, etc.), the southwestern region (Chongqing, Sichuan, Guizhou, Yunnan provinces), and the southeastern region (some areas of Fujian Province and Guangdong Province). The findings of this research are in line with those of our previous studies [12]. The success of the method proposed in this paper is evidently demonstrated by the high accuracy and effectiveness of the combined model in comparison with each individual model. For the same dataset, Ma Wenyuan et al. [5] utilized the random forest algorithm for predicting forest fire occurrence in Shanxi Province, with an area under the curve (AUC) of 0.92. In comparison, our integrated approach achieved an AUC of 0.97, demonstrating a superior performance.
4. Discussion and Conclusions
Forecasting and mapping forest fires is a useful tool for managing fire risk, preventing fires, and extinguishing blazes [45]. The complexity of large-scale forest fire prediction modeling necessitates the expeditious and precise assessment of the probability and magnitude of forest fire hazard in different regions of China, in order to optimize the accuracy and dependability of the model and evaluate the potential for future forest fires at varying locations and times [12]. The utilization of combined forecasting models can promote the robustness and precision of forecasting outcomes to some degree by combining the benefits of multiple models in an appropriate way [46]. By exploiting the benefits of various model algorithms and handling intricate input data, this research can generate results that are more consistent with the modeling function, thereby tackling issues such as high dimensionality and sample disproportion, and enhancing the precision and dependability of the model.
Based on our prior research [12], this study proposes and empirically evaluates a novel hybrid integrated model—a technique that amalgamates multiple models to augment machine learning, synthesizing topographical, meteorological, vegetation, and socio-human aspects—for predicting the incidence of forest fires in China. Our findings show that the model is successful in the prediction of forest fires. Through the combination of numerous elementary models to generate a combined model with enhanced performance, the model has the potential to address multiple intractable problems that cannot be resolved using a single model. This makes the model highly advantageous in many established machine learning frameworks. However, due to time and data constraints, there are some limits to the accuracy of the individual models, and further research is needed to determine the most effective strategies for improving accuracy after integrating them. Additionally, it is difficult to assess which model is most appropriate in a given context, as the availability and quantity of data vary in different environments. Nevertheless, the ensemble learning model we constructed is most effective in high-dimensional datasets as it can capture intricate relationships between variables and address class imbalance issues by balancing the weights of different classes.
Our hybrid model necessitates the utilization of multiple classifiers, thereby necessitating additional computational resources and time. If the classifiers used in the ensemble learning model exhibit deficiencies in certain categories of data, their prediction results may detrimentally affect the overall performance of the ensemble model. Exploring dissimilar combinations of methods and models to produce robust and powerful models for predicting natural hazards is an ongoing and promising field of research [47]. The relative influence of the same driver of forest fire occurrence can vary in importance between regions and models and can have diverse effects on the likelihood and magnitude of forest fires [48]. Consequently, it is imperative to select forest fire drivers and assorted models for predicting the likelihood and frequency of forest fires. It is suggested that distinct data and driving factors for the characteristics of forest fires in disparate locales should be utilized to construct models. This is because the manifestation of forest fires in disparate regions may be affected by dissimilar factors; when constructing models, therefore, these factors must be taken into account, with suitable data and methods being chosen based on the actual state of affairs. Additionally, our forthcoming forest fire occurrence forecasts should be amalgamated with big data platforms [49]. To enhance the accuracy of forecasting and predicting forest fires, existing forecasting models must be constantly upgraded and expanded, and a combination of array clusters and integrated models must be utilized to efficiently process large amounts of data, enhance the effectiveness of data analysis, and facilitate real-time anticipation of forest fire emergence.
Author Contributions
Conceptualization, Z.F., Z.W., Y.S., M.C. and W.W.; data curation, Y.S. and M.C.; formal analysis, Y.S., Z.W. and M.C.; funding acquisition, Z.F. and W.W.; investigation, Y.S., Z.W., W.W. and Z.F.; methodology, Y.S., Z.W. and M.C.; project administration, Z.F., Z.W., Y.S. and M.C.; resources, Z.F., Y.S. and M.C.; supervision, Z.F., Y.S. and M.C.; validation, Z.F., Y.S., M.C., L.S., X.Y. and T.M.; visualization, Y.S. and M.C.; writing—original draft, Y.S. and M.C.; writing—review and editing, Z.F., Y.S., M.C., L.S., X.Y., T.M., S.F., X.L., Z.W., W.W. and Z.G. All authors have read and agreed to the published version of the manuscript.
Funding
This research was funded by the Forest Grassland Fire Disaster Scene Three-dimensional Wind Field Detection Technology and Key Equipment Research (2021YFC3001902), and the China Fire and Rescue Institute and Emergency Management-level Project (XFKYB202302).
Institutional Review Board Statement
Not applicable.
Informed Consent Statement
Not applicable.
Data Availability Statement
The data used to support the findings of this study are available from the corresponding author upon request.
Acknowledgments
We would like to thank the editors and reviewers for their valuable opinions and suggestions that improved this research.
Conflicts of Interest
The authors declare no conflict of interest.
References
- Tinner, W.; Hubschmid, P.; Wehrli, M.; Ammann, B.; Conedera, M. Long-term forest fire ecology and dynamics in southern Switzerland. J. Ecol. 1999, 87, 273–289. [Google Scholar] [CrossRef]
- Johnstone, J.F.; Allen, C.D.; Franklin, J.F.; Frelich, L.E.; Harvey, B.J.; Higuera, P.E.; Mack, M.C.; Meentemeyer, R.K.; Metz, M.R.; Perry, G.L.; et al. Changing disturbance regimes, ecological memory, and forest resilience. Front. Ecol. Environ. 2016, 14, 369–378. [Google Scholar] [CrossRef]
- Jaiswal, R.K.; Mukherjee, S.; Raju, K.D.; Saxena, R. Forest fire risk zone mapping from satellite imagery and GIS. Int. J. Appl. Earth Obs. Geoinf. 2002, 4, 1–10. [Google Scholar] [CrossRef]
- Pourtaghi, Z.S.; Pourghasemi, H.R.; Aretano, R.; Semeraro, T. Investigation of general indicators influencing on forest fire and its susceptibility modeling using different data mining techniques. Ecol. Indic. 2016, 64, 72–84. [Google Scholar] [CrossRef]
- Ma, W.; Feng, Z.; Cheng, Z.; Chen, S.; Wang, F. Study on driving factors and distribution pattern of forest fires in Shanxi province. J. Cent. South Univ. For. Technol. 2020, 40, 57–69. [Google Scholar] [CrossRef]
- Shu, L.F.; Zhang, X.L.; Dai, X.A.; Tian, X.R.; Wang, M.Y. Forest Fire Research (Ⅱ): Fire Forecast. World For. Res. 2003, 16, 4. [Google Scholar]
- Tian, X.R.; McRae, D.J.; Shu, L.F.; Zhao, F.J.; Wang, M.Y. Changes of forest fire danger and the evaluation of the fwi system application in the daxing’anling region. Sci. Silvae Sin. 2010, 46, 127–132. [Google Scholar]
- Shao, Y.; Wang, Z.; Feng, Z.; Sun, L.; Yang, X.; Zheng, J.; Ma, T. Assessment of China’s forest fire occurrence with deep learning, geographic information and multisource data. J. For. Res. 2022, 1–14. [Google Scholar] [CrossRef]
- Zhao, F.; Shu, L.F.; Zhou, R.L.; Xiao, X.M.; Wang, M.Y.; Zhao, F.J.; Wang, Q.H. Evaluating fire behavior simulators in southwestern China forest area. Chin. J. Appl. Ecol. 2017, 28, 3144–3154. [Google Scholar] [CrossRef]
- Zhu, Z.; Zhao, F.; Wang, Q.; Deng, X.; Gao, Z. Research Progress in Forest Fire Occurrence Prediction Models. World For. Res. 2022, 35, 26–31. [Google Scholar] [CrossRef]
- Naderpour, M.; Rizeei, H.M.; Ramezani, F. Forest Fire Risk Prediction: A Spatial Deep Neural Network-Based Framework. Remote Sens. 2021, 13, 2513. [Google Scholar] [CrossRef]
- Shao, Y.; Feng, Z.; Sun, L.; Yang, X.; Li, Y.; Xu, B.; Chen, Y. Mapping China’s Forest Fire Risks with Machine Learning. Forests 2022, 13, 856. [Google Scholar] [CrossRef]
- Bazi, I.E.; Laachfoubi, N. A comparative study of Named Entity Recognition for Arabic using ensemble learning approaches. In Proceedings of the 2015 IEEE/ACS 12th International Conference of Computer Systems and Applications (AICCSA), Marrakech, Morocco, 17–20 November 2015; pp. 1–6. [Google Scholar]
- Liu, G.; Shao, Q.; Fan, J.; Ning, J.; Rong, K.; Huang, H.; Liu, S.; Zhang, X.; Niu, L.; Liu, J. Change Trend and Restoration Potential of Vegetation Net Primary Productivity in China over the Past 20 Years. Remote Sens. 2022, 14, 1634–1659. [Google Scholar] [CrossRef]
- Ning, J.; Liu, J.; Kuang, W.; Xu, X.; Zhang, S.; Yan, C.; Li, R.; Wu, S.; Hu, Y.; Du, G.; et al. Spatiotemporal patterns and characteristics of land-use change in China during 2010–2015. J. Geogr. Sci. 2018, 28, 547–562. [Google Scholar] [CrossRef] [Green Version]
- Li, Y.; Feng, Z.; Chen, S.; Zhao, Z.; Wang, F. Application of the Artificial Neural Network and Support Vector Machines in Forest Fire Prediction in the Guangxi Autonomous Region, China. Discret. Dyn. Nat. Soc. 2020, 2020, 5612650. [Google Scholar] [CrossRef] [Green Version]
- Yue, S.; Pilon, P.; Cavadias, G. Corrigendum to “Power of the Mann-Kendall and Spearman’s rho tests for detecting monotonic trends in hydrological series”. J. Hydrol. 2002, 264, 262–263. [Google Scholar] [CrossRef]
- Zhang, Y.; Tan, X. Analysis on the variation trend and abrupt change of water level and discharge of Dongping Lake in recent 13 years. Haihe Water Resour. 2022, 1, 77–80. [Google Scholar]
- Zhang, L.; Zhu, Z.; Xi, X.; Wang, H.; Wang, F. Analysis of drought evolution in the Xilin River Basin based on Standardized Precipitation Evapotranspiration Index. Arid Zone Res. 2020, 37, 819–829. [Google Scholar] [CrossRef]
- Feng, X.; Zhong, Y.; Chen, L.; Fu, Y. Evolution of spatial pattern of county regional economy in Yangtze River economic belt. Econ. Geogr. 2016, 36, 18–25. [Google Scholar] [CrossRef]
- Lefever, D.W. Measuring Geographic Concentration by Means of the Standard Deviational Ellipse. Am. J. Sociol. 1926, 32, 88–94. [Google Scholar] [CrossRef]
- Li, J.; Zheng, B.; Wang, J. Spatial-temporal heterogeneity of hand, foot and mouth disease in China from 2008 to 2018. J. Geo-Inf. Sci. 2021, 23, 419–430. [Google Scholar]
- Wu, W.; Zhong, K.; Xu, J. Research on spatiotemporal evolution and influencing factors of county economic differences in Guangdong province. Sci. Surv. Mapp. 2021, 46, 156–163. [Google Scholar] [CrossRef]
- Yuan, J.; Bian, Z.; Yan, Q.; Gu, Z.; Yu, H. An Approach to the Temporal and Spatial Characteristics of Vegetation in the Growing Season in Western China. Remote Sens. 2020, 12, 945–960. [Google Scholar] [CrossRef] [Green Version]
- Feng, Z.; Shi, R. Spatio-temporal features and the association of Ground-level PM2.5 concentration and its emission in China. J. Geo-Inf. Sci. 2021, 23, 1221–1230. [Google Scholar]
- Deng, O.; Li, Y.; Feng, Z.; Zhang, D. Model and zoning of forest fire risk in Heilongjiang province based on spatial Logistic. Trans. Chin. Soc. Agric. Eng. 2012, 28, 200–205. [Google Scholar]
- Liang, H.; Wang, W.; Guo, F.-T.; Lin, F.; Lin, Y. Comparing the application of logistic and geographically weighted logistic regression models for Fujian forest fire forecasting. Acta Ecol. Sin. 2017, 37, 4128–4141. [Google Scholar]
- Chen, D. Prediction of forest fire occurrence in Daxing’an Mountains based on logistic regression model. For. Resour. Manag. 2019, 2, 116–122. [Google Scholar] [CrossRef]
- Peng, C.-Y.J.; Lee, K.L.; Ingersoll, G.M. An Introduction to Logistic Regression Analysis and Reporting. J. Educ. Res. 2002, 96, 3–14. [Google Scholar] [CrossRef]
- Breiman, L. Random Forests. Mach. Learn. 2001, 45, 5–32. [Google Scholar] [CrossRef] [Green Version]
- Chen, Y.; Zheng, W.; Li, W.; Huang, Y. Large group activity security risk assessment and risk early warning based on random forest algorithm. Pattern Recognit. Lett. 2021, 144, 1–5. [Google Scholar] [CrossRef]
- Zhang, F.; Zhang, Y.; Chen, J.; Zhai, X.; Hu, Q. Performance of multiple machine learning model simulation of process characteristic indicators of different flood types. Prog. Geogr. 2022, 41, 1239–1250. [Google Scholar] [CrossRef]
- Chen, W.; Zhang, S.; Li, R.; Shahabi, H. Performance evaluation of the GIS-based data mining techniques of best-first decision tree, random forest, and naïve Bayes tree for landslide susceptibility modeling. Sci. Total Environ. 2018, 644, 1006–1018. [Google Scholar] [CrossRef]
- Friedman, J. Greedy Function Approximation: A Gradient Boosting Machine. Ann. Stat. 2001, 29, 1189–1232. [Google Scholar] [CrossRef]
- Wang, S.; Li, J.; Wang, Y.; Li, Y. Radar HRRP Target Recognition Based on Gradient Boosting Decision Tree. In Proceedings of the 2016 9th International Congress on Image and Signal Processing, BioMedical Engineering and Informatics (CISP-BMEI), Datong, China, 15–17 October 2016; pp. 1013–1017. [Google Scholar]
- Zou, Y.; Chen, Y.; Deng, H. Gradient Boosting Decision Tree for Lithology Identification with Well Logs: A Case Study of Zhaoxian Gold Deposit, Shandong Peninsula, China. Nat. Resour. Res. 2021, 30, 3197–3217. [Google Scholar] [CrossRef]
- Vapnik, V. The Nature of Statistical Learning Theory; Springer: New York, NY, USA, 2000. [Google Scholar]
- Yu, H. Support Vector Machine. In Encyclopedia of Database Systems; Liu, L., ÖZsu, M.T., Eds.; Springer US: Boston, MA, USA, 2009; pp. 2890–2892. [Google Scholar] [CrossRef]
- Suthaharan, S. Support Vector Machine. In Machine Learning Models and Algorithms for Big Data Classification: Thinking with Examples for Effective Learning; Suthaharan, S., Ed.; Springer US: Boston, MA, USA, 2016; pp. 207–235. [Google Scholar]
- Huang, Y.; Zhao, L. Review on landslide susceptibility mapping using support vector machines. Catena 2018, 165, 520–529. [Google Scholar] [CrossRef]
- Chen, W.; Pourghasemi, H.R.; Naghibi, S.A. A comparative study of landslide susceptibility maps produced using support vector machine with different kernel functions and entropy data mining models in China. Bull. Eng. Geol. Environ. 2018, 77, 647–664. [Google Scholar] [CrossRef]
- Cervantes, J.; Garcia-Lamont, F.; Rodríguez-Mazahua, L.; Lopez, A. A comprehensive survey on support vector machine classification: Applications, challenges and trends. Neurocomputing 2020, 408, 189–215. [Google Scholar] [CrossRef]
- Pang, Y.; Li, Y.; Feng, Z.; Feng, Z.; Zhao, Z.; Chen, S.; Zhang, H. Forest Fire Occurrence Prediction in China Based on Machine Learning Methods. Remote Sens. 2022, 14, 5546–5568. [Google Scholar] [CrossRef]
- Gao, K.; Feng, Z.; Wang, S. Using Multilayer Perceptron to Predict Forest Fires in Jiangxi Province, Southeast China. Discret. Dyn. Nat. Soc. 2022, 2022, 6930812. [Google Scholar] [CrossRef]
- Tariq, A.; Shu, H.; Siddiqui, S.; Munir, I.; Sharifi, A.; Li, Q.; Lu, L. Spatio-temporal analysis of forest fire events in the Margalla Hills, Islamabad, Pakistan using socio-economic and environmental variable data with machine learning methods. J. For. Res. 2022, 33, 183–194. [Google Scholar] [CrossRef]
- Zhou, C.; Yin, K.; Cao, Y.; Li, Y. Landslide susceptibility assessment by applying the coupling method of radial basis neural network and adaboost: A case study from the three gorges reservoir area. Earth Sci. 2020, 45, 1865–1876. [Google Scholar]
- Tuyen, T.T.; Jaafari, A.; Yen, H.P.H.; Nguyen-Thoi, T.; Phong, T.V.; Nguyen, H.D.; Van Le, H.; Phuong, T.T.M.; Nguyen, S.H.; Prakash, I.; et al. Mapping forest fire susceptibility using spatially explicit ensemble models based on the locally weighted learning algorithm. Ecol. Inform. 2021, 63, 101292. [Google Scholar] [CrossRef]
- Gao, C.; Lin, H.; Hu, H.; Song, H. A review of models of forest fire occurrence prediction in China. Chin. J. Appl. Ecol. 2020, 31, 3227–3240. [Google Scholar] [CrossRef]
- Zhao, X.; Feng, Z.; Zhou, Y.; Lin, Y. Key Technologies of Forest Resource Examination System Development in China. Engineering 2020, 6, 491–494. [Google Scholar] [CrossRef]
Figure 1.
Study area (data not available for Hong Kong, Macao, and Taiwan).

Figure 2.
Technology roadmap.

Figure 3.
Schematic diagram of the hybrid model.

Figure 4.
M-K mutation test curve.

Figure 5.
Cumulative-distance leveling curve.

Figure 6.
2010–2018 China forest fire standard deviation ellipse.

Figure 7.
Comparison of model validation results.

Figure 8.
Forest fire zoning in China (Classes I/II/III/IV/V indicate very low, low, medium, high, and very high probability, respectively).
Figure 8.
Forest fire zoning in China (Classes I/II/III/IV/V indicate very low, low, medium, high, and very high probability, respectively).


Table 1.
Standard deviation for oval-shaped parameters of forest fire occurrence in mainland China, 2010–2018.
Table 1.
Standard deviation for oval-shaped parameters of forest fire occurrence in mainland China, 2010–2018.
| Year | XStdDist (km) | YStdDist (km) | Rotation | Oblateness |
|---|---|---|---|---|
| 2010 | 721.16664 | 1759.22921 | 18.69649 | 2.43942 |
| 2011 | 694.68923 | 1218.07257 | 26.48714 | 1.75341 |
| 2012 | 657.32663 | 1142.30164 | 49.48381 | 1.73780 |
| 2013 | 692.69959 | 1052.93852 | 41.68827 | 1.52005 |
| 2014 | 692.69959 | 930.13757 | 45.00268 | 1.34277 |
| 2015 | 740.76901 | 1444.86086 | 27.73375 | 1.95049 |
| 2016 | 586.31607 | 1451.95680 | 23.84648 | 2.47641 |
| 2017 | 663.13500 | 1585.20545 | 24.58760 | 2.39047 |
| 2018 | 672.25122 | 1446.07839 | 28.09483 | 2.15110 |
Disclaimer/Publisher’s Note: The statements, opinions and data contained in all publications are solely those of the individual author(s) and contributor(s) and not of MDPI and/or the editor(s). MDPI and/or the editor(s) disclaim responsibility for any injury to people or property resulting from any ideas, methods, instructions or products referred to in the content. |
© 2023 by the authors. Licensee MDPI, Basel, Switzerland. This article is an open access article distributed under the terms and conditions of the Creative Commons Attribution (CC BY) license (https://creativecommons.org/licenses/by/4.0/).
Share and Cite
MDPI and ACS Style
Shao, Y.; Feng, Z.; Cao, M.; Wang, W.; Sun, L.; Yang, X.; Ma, T.; Guo, Z.; Fahad, S.; Liu, X.; et al. An Ensemble Model for Forest Fire Occurrence Mapping in China. Forests 2023, 14, 704. https://doi.org/10.3390/f14040704
AMA Style
Shao Y, Feng Z, Cao M, Wang W, Sun L, Yang X, Ma T, Guo Z, Fahad S, Liu X, et al. An Ensemble Model for Forest Fire Occurrence Mapping in China. Forests. 2023; 14(4):704. https://doi.org/10.3390/f14040704
Chicago/Turabian StyleShao, Yakui, Zhongke Feng, Meng Cao, Wenbiao Wang, Linhao Sun, Xuanhan Yang, Tiantian Ma, Zanquan Guo, Shahzad Fahad, Xiaohan Liu, and et al. 2023. "An Ensemble Model for Forest Fire Occurrence Mapping in China" Forests 14, no. 4: 704. https://doi.org/10.3390/f14040704
Note that from the first issue of 2016, this journal uses article numbers instead of page numbers. See further details here.