Article

Difference in Response of Caragana intermedia Photosynthesis to Soil Water Content in Different Afforestation Years and Related Threshold Effects in Alpine Sandy Lands

1
Institute of Forestry, Chinese Academy of Forestry, Beijing 100091, China
2
Qinghai Gonghe Desert Ecosystem and Research Station, Gonghe 813005, China
3
Chinese Academy of Forestry, Beijing 100091, China
4
Institute of Ecological Protection and Restoration, Chinese Academy of Forestry Sciences, Beijing 100091, China
5
School of Architecture, Inner Mongolia University of Technology, Hohhot 010051, China
*
Author to whom correspondence should be addressed.
Forests 2023, 14(4), 701; https://doi.org/10.3390/f14040701
Submission received: 1 January 2023 / Revised: 15 February 2023 / Accepted: 17 March 2023 / Published: 29 March 2023
(This article belongs to the Section Forest Hydrology)

Abstract

:
This study was carried out to clarify the response of photosynthesis physiology of Caragana intermedia, an excellent tree species for wind protection and sand fixation, to soil water content (SWC) and to determine the relevant threshold ranges in the sandy lands of Qinghai-Tibet Plateau. In this study, based on the three-year forest experiment from 2017a to 2019a, C. intermedia in different afforestation years (2013a, 2011a, 2008a, 2006a, 2001a and 1986a) were selected for experimental analysis, the response process of leaf photosynthesis of C. intermedia to SWC changes was studied, and the physiological mechanism and growth suitability of C. intermedia to adapt to an alpine desert environment were clarified. The results showed that SWC played a critical role in the photosynthesis of C. intermedia in the sandy lands of Qinghai-Tibet Plateau. Afforestation years are negatively correlated with Pn, gs and Tr, but positively correlated with WUE; the longer the afforestation years, the higher demand for soil moisture. Regarding the relative roles of SWC and photosynthetic parameters, we demonstrated that this showed a significant square relationship (p < 0.001), while stomatal closure induced by the photosynthesis decline was important under dryness stress. The no-productivity and no-efficiency water (NPNEW) for the photosynthesis physiology of trees in different afforestation years were 3.31–3.64%; 3.33–4.06%; 3.08–3.63%; 3.36–3.85%; 1.45–4.02% and 3.39–5.50%, and the highest productivity with the highest availability of water (HPHAW) were 6.65–7.19%; 6.74–7.36%; 7.36–7.91%; 6.10–7.51%; 6.57–8.19% and 6.52–8.35%. Plantations in different afforestation years could survive safely in the sandy lands of Qinghai-Tibet Plateau. However, the productivity of trees decreased with the increase length of afforestation years; thus, we should pay attention to their growth status and make timely management adjustments in the future. These results provide important information for theoretical support for the diagnosis of ecological adaptability and field water management of C. intermedia in the sandy lands of Qinghai-Tibet Plateau and provide a reference for the adaptability evaluation and water–carbon cycle simulation of plantations in the sandy lands of Qinghai-Tibet Plateau against the background of global climate change.

1. Introduction

Drylands, which cover 41% of the mainland surface and are an important part of the terrestrial system, are facing the threat of desertification [1], and their regions will expand globally in the future [2]. A changing climate will influence the ecological process and hydrological cycle in arid areas through warmer and drier conditions, which pose an increasing threat to vegetation growing in fragile arid ecosystems [3,4,5]. The increase in drought stress will reduce the potential benefits of climate warming on plant photosynthesis in cold environments [6]; thus, drought is considered the key limiting factor that threatens the growth and sustainability of vegetation in arid regions, including having negative effects of climate change on soil moisture deficit and atmospheric drought [7,8]. The proportion of global climate drought is increasing significantly, and the accelerated occurrence in the frequency and intensity of extreme droughts is determined by both soil moisture deficit and atmospheric drought [9]. The vegetation ecosystem is seriously restricted by the amount of soil water supply, and the low soil moisture status will affect the vegetation pattern and spatial distribution [10]. Extreme drought can even lead to a significant decrease of net primary productivity and large-scale tree death [11]. Therefore, accurately quantifying the impact of current soil moisture stress on plant productivity is essential for evaluating the growth and sustainability of vegetation in arid and semi-arid areas.
Soil moisture is the direct reservoir of plants, which determines the amount of water that can be extracted from the roots of plants [2] and is the main factor that affects the vegetation ecology and hydrological cycle in arid areas [12]. The index used to discuss the availability of soil water is soil water content (SWC) [13]. The dynamic change in soil moisture status directly affects the physiological activities of trees leaves, such as moisture status, photosynthesis and respiration [14], and plants correspondingly adapt to the shifting effect of soil moisture by changing leaf water potential, regulating stomata and secreting osmotic substances [15]. However, photosynthesis is the best parameter to reflect the response of plant growth to soil moisture among these physiological parameters [16]. Relevant research showed that the relationship between plant photosynthetic physiological parameters and soil moisture was not really a simple linear one, but rather, a certain threshold effect of soil moisture [17]. Plants can coordinate the relationship between carbon assimilation and water consumption according to different water conditions and determine the “high efficiency water threshold” [17] or “economic water threshold” [18] according to water use efficiency and net photosynthetic rate. Understanding the response of plant photosynthetic physiological indexes to SWC and the threshold effect are also hot issues in ecological research [8].
Qinghai Gonghe Basin, located in the northeast of Qinghai-Tibet Plateau, is the transitional zone between Qilian Mountain and Kunlun Mountain, and it is also a major source of sandstorms in northwest China [19]. The alpine ecosystem of Qinghai-Tibet Plateau is vulnerable to climate change [9,20], and its influencing mechanism has become the focus of global climate change research [21]. In order to improve the sandstorm situation in the region, the government has adopted ecological protection and restoration programs such as afforestation and closing hillsides for afforestation. However, the most important of the vegetation restoration measures is choosing suitable tree species and reasonable management [22], because inappropriate large-scale planting of vegetation might give rise to some difficult problems such as stunting, aging trees and dry soil layer [23]. Furthermore, the self-development of trees would be affected by the absorption and utilization of foreign substances and the adaptability to environmental changes with the extension of afforestation years [24,25,26]. C. intermedia is the main afforestation tree species in Gonghe Basin [19]; however, the relationship between plant productivity and soil hydrology at different ages is still unclear, and whether the hydrological conditions in Gonghe Basin will restrict its growth is still uncertain. Thus, it is necessary to study the response mechanism of C. intermedia to dryness stress in this region. In this study, the effects of soil moisture on the photosynthetic physiology of C. intermedia in different afforestation years were determined through in-situ experiments in the forest, and the lower limit and the best state of soil moisture in natural habitats were explored. The research results can provide a reference for adaptability evaluation of C. intermedia against the background of global climate change, as well as provide a scientific basis for understanding vegetation growth adaptability in alpine sandy land and ensure a virtuous circle of the alpine ecosystem and normal function of ecological service. Our aims are (1) to reveal the response mechanism of photosynthetic physiology of C. intermedia to soil water changes, and (2) to explore the threshold of lower limit SWC for irreversible physiological stress and optimal limit SWC for maximum photosynthetic rates.

2. Materials and Methods

2.1. Study Site

The experimental site is situated in Shazhuyu Township (99°45′~100°30′ E, 36°03′~36°40′ N), that is located at an altitude of 2871~3870 m in Gonghe Basin in the northeast of Qinghai Tibet Plateau, bordering Qinghai Lake in the north and Yellow River in the south. The climate in this region is cold, dry and windy, with plenty of sunshine, drought and little rain; the average annual temperature is only 2.4 °C, the frost-free period is 91 days, and the average annual precipitation is 246.3 mm, with extremely uneven spatial and temporal distribution, while more than 83% of the precipitation events occur from May to September [27]. The annual average potential evaporation is 1716.1 mm, the annual average wind days are 50.6 d, the annual average wind speed is 2.7 m/s, the main wind direction is north-northwest, and the annual average sandstorm days are 20.7 d [19]. The vegetation type in the study region is artificial forest, and the main vegetation includes C. intermedia, Populus cathayan, Populus simonii, Caragana korshinskii, Salix cheilophila, Salix cheilophila, Hippophae rhamnoide, etc. The basic details of the sample land are shown in Table 1. With the extension of afforestation years, the plant height, base diameter and crown width of C. intermedia have increased.

2.2. Experimental Materials

In this experiment, C. intermedia was selected as the research object, and C. intermedia plantations planted in 2013a (an average year), 2011a, 2008a, 2006a, 2001a and 1986a were selected as sample plots. Three healthy C. intermedia trees with the same growth were selected as standard plants in each sample plot, and we measured photosynthetic indicators in the growing season (June to August). Statistics of meteorological (using Dynomet-1k monitoring instrument) and SWC (using moisture sensor ECH2O monitoring) data were obtained from automatic monitoring instruments in sample plots. The data treatment was described below.

2.3. Experimental Methods

The meteorological factors during the sampling period were continuously monitored by the Dynamet-1k scientific research automatic weather station for a long period. Data were recorded every 30 min, including atmospheric Temperature (T), Relative Humidity (RH), Solar Radiation (SR) and Wind Speed (WS); afterwards, we calculated the coefficient of variation (CV = SD/mean × 100) and vapor pressure deficit (VPD) according to the above statistics. The meteorological conditions were basically the same during the sampling period except for VPD (presented in Table 2).
Soil moisture sensors with ECH2O were installed in six plantation plots in different afforestation years. Probes were inserted into depths of 0–10, 10–20, 20–30 and 30–40 cm and data were automatically collected every 30 min for long-term monitoring of SWC. The soil water absorbed by plants is mainly stored in the root zone layer. Our previous research also determined that the water absorption layer of C. intermedia was mainly in the shallow layer [28]. Therefore, the SWC in this study was the average value of the 0–40 cm soil layer.
The photosynthetic parameters were measured several times during the vegetation growing season (June to August) from 2017a to 2019a. When measuring photosynthetic parameters with the Li-6400XT instrument, a lateral branch extending southward was selected from the middle and upper part of each canopy of the three standard trees, and three leaves with complete maturity and healthy growth were selected as measurement objects. The measurement time was from 8 am to 4 pm, and the observation was made every 2 h; the average value of each time period was taken for data statistics. Net photosynthetic rate (Pn, μmol·m−2·s−1), transpiration rate (Tr, μmol·m−2·s−1) and stomatal conductance (gs, μmol·m−2·s−1) were recorded. According to the above data, the water use efficiency and stomatal limitation value of C. intermedia were calculated by using the following formula:
WUE = Pn/Tr
Ls = 1 − Ci/Ca

2.4. Data Analysis

Excel and the R software package (version 3.6.3) were used for data analysis and table drawing, and a binary regression model was established in the R software package so as to obtain the relationship between photosynthetic physiological indicators and SWC. Simpl Fit, Correlation Plot and Box-plot diagrams were drawn using Origin 2021, and Pearson correlation analysis was used for correlation analysis.

3. Results

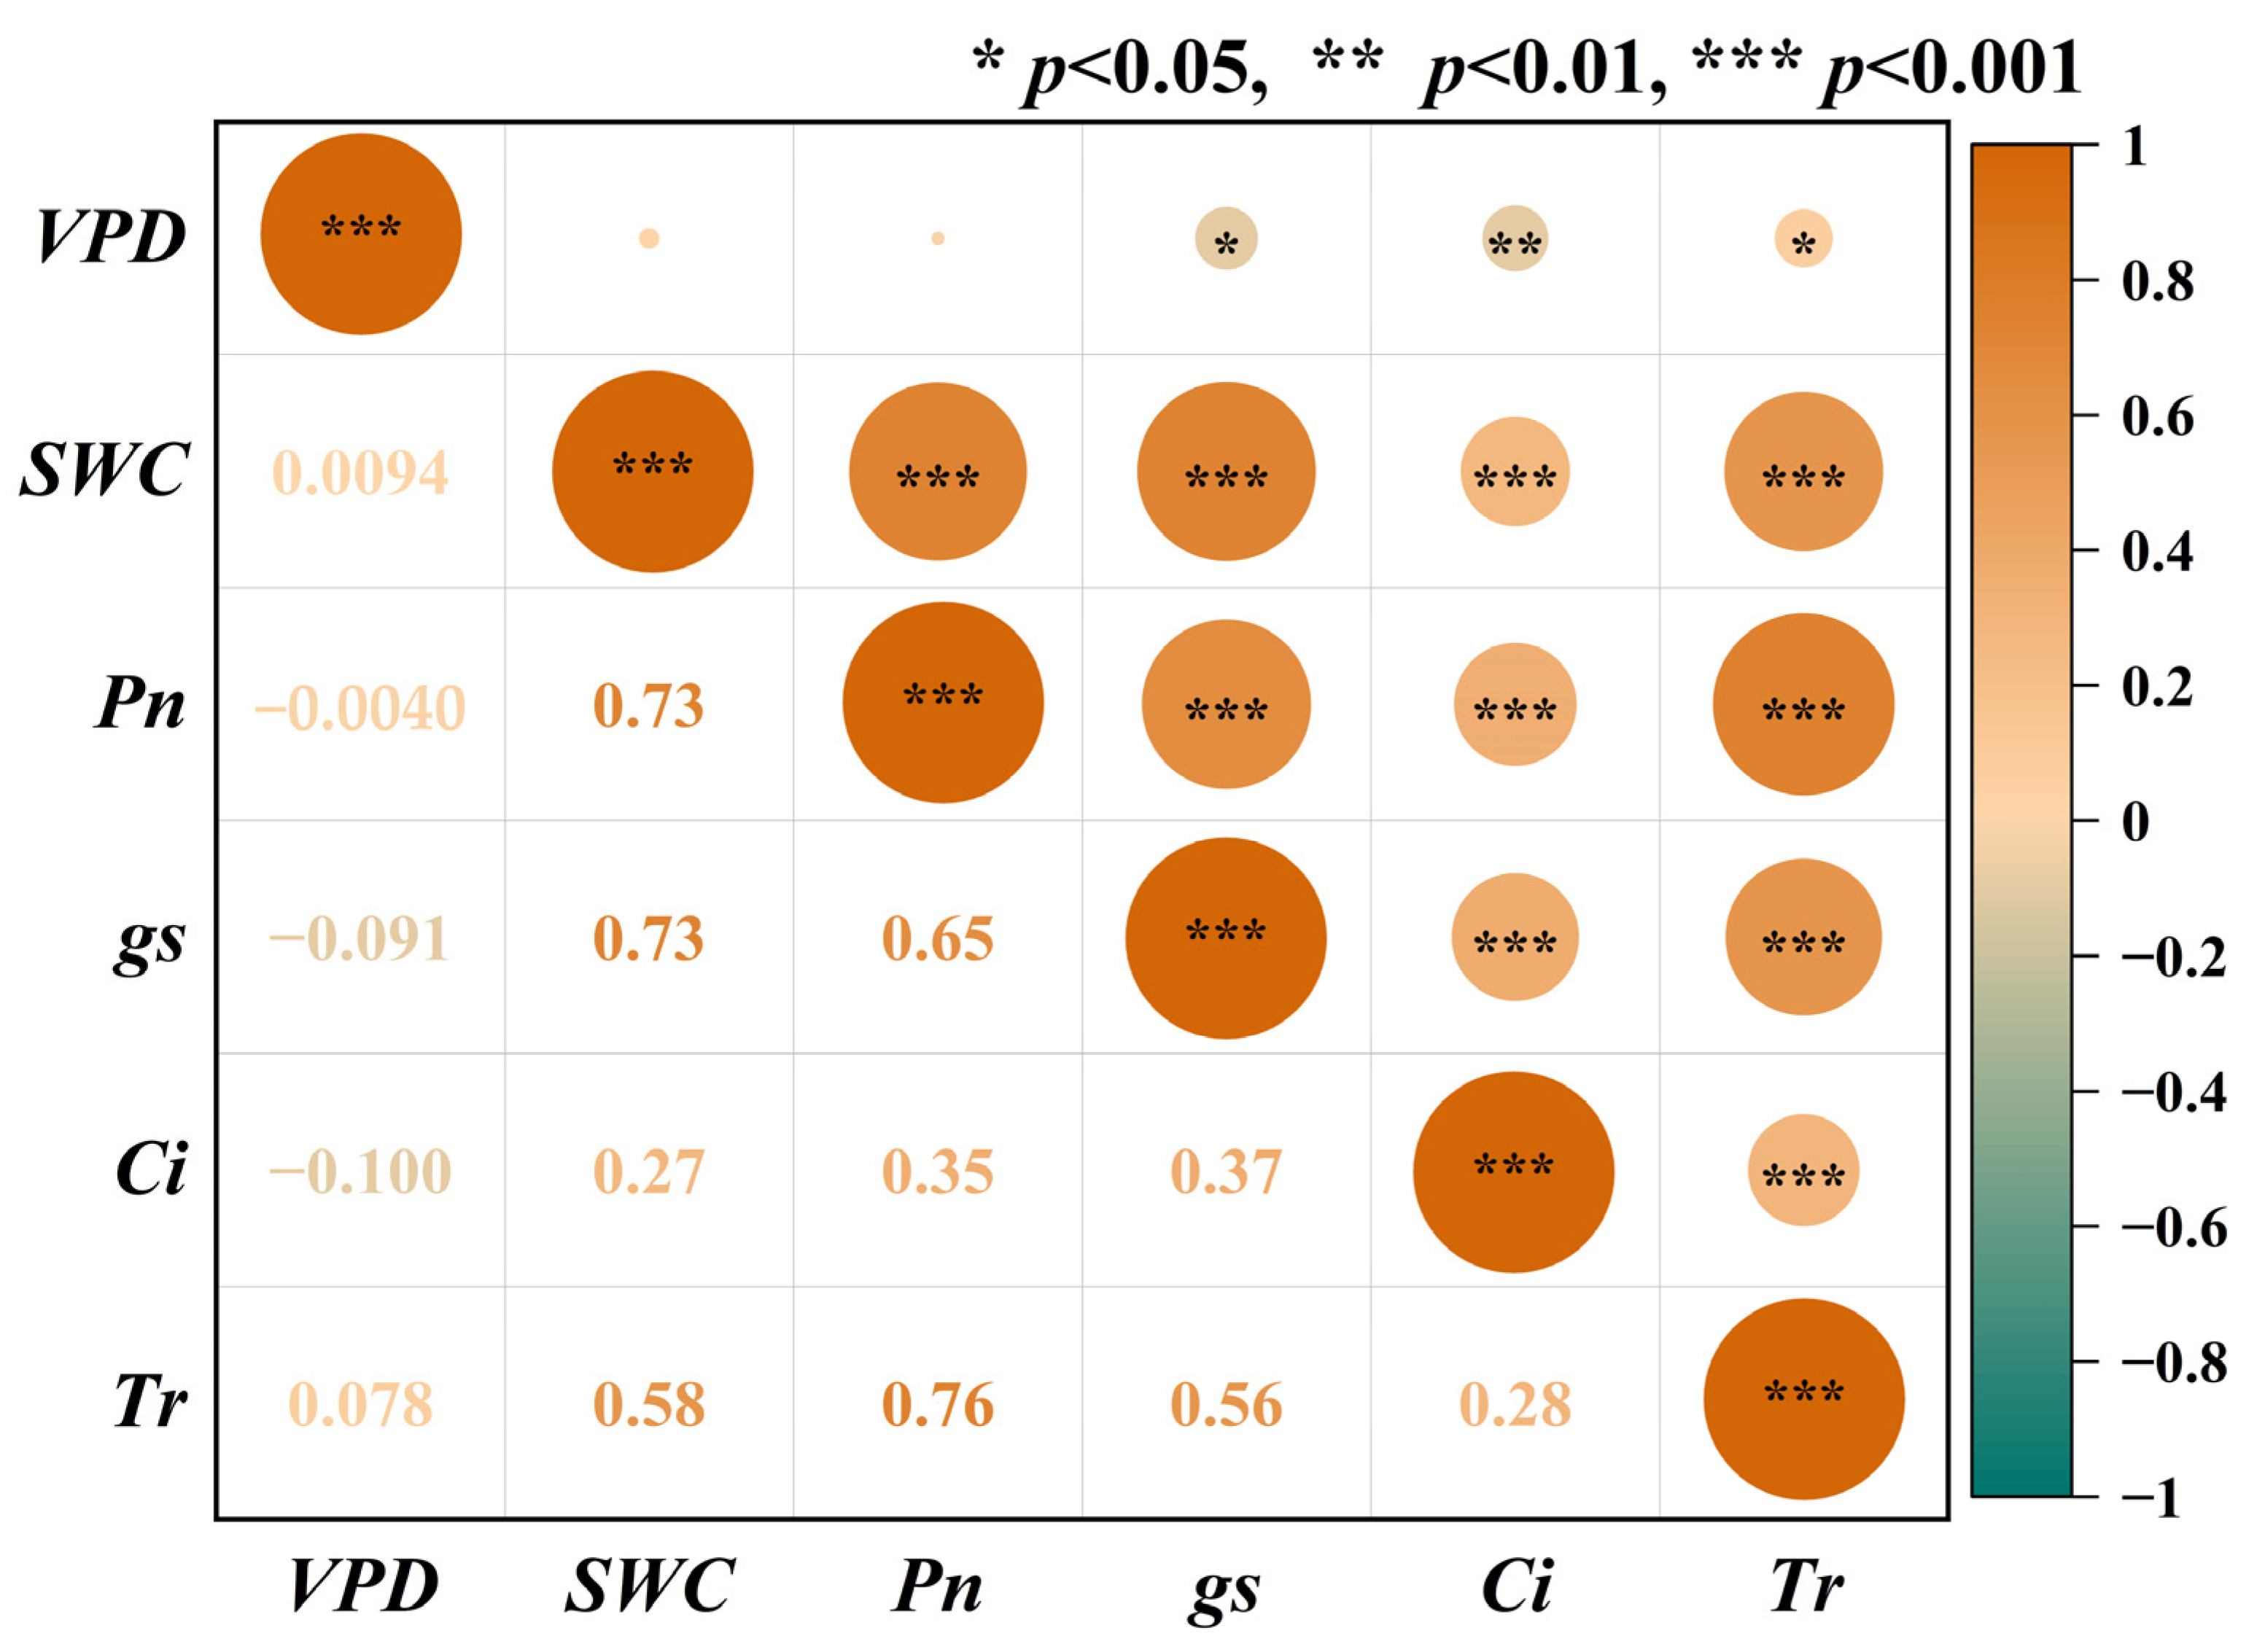
3.1. Response of Photosynthetic Parameters to SWC and VPD

We performed Pearson correlation analysis among photosynthetic parameters to VPD and SWC (Figure 1) in order to evaluate their response. We found that there was an extremely significant positive correlation among photosynthetic parameters (p < 0.001), which were also positively correlated with SWC. The correlation coefficients of Ci with other photosynthetic parameters and SWC were in the range of 0.27–0.37, and of SWC with Pn and gs was 0.73. For VPD, in contrast, the correlation was not significant with SWC and Pn (p > 0.05). However, VPD was negatively correlated with gs and Ci (p < 0.05) but positively correlated with Tr, while simultaneously, the correlation coefficient was less than 0.1.

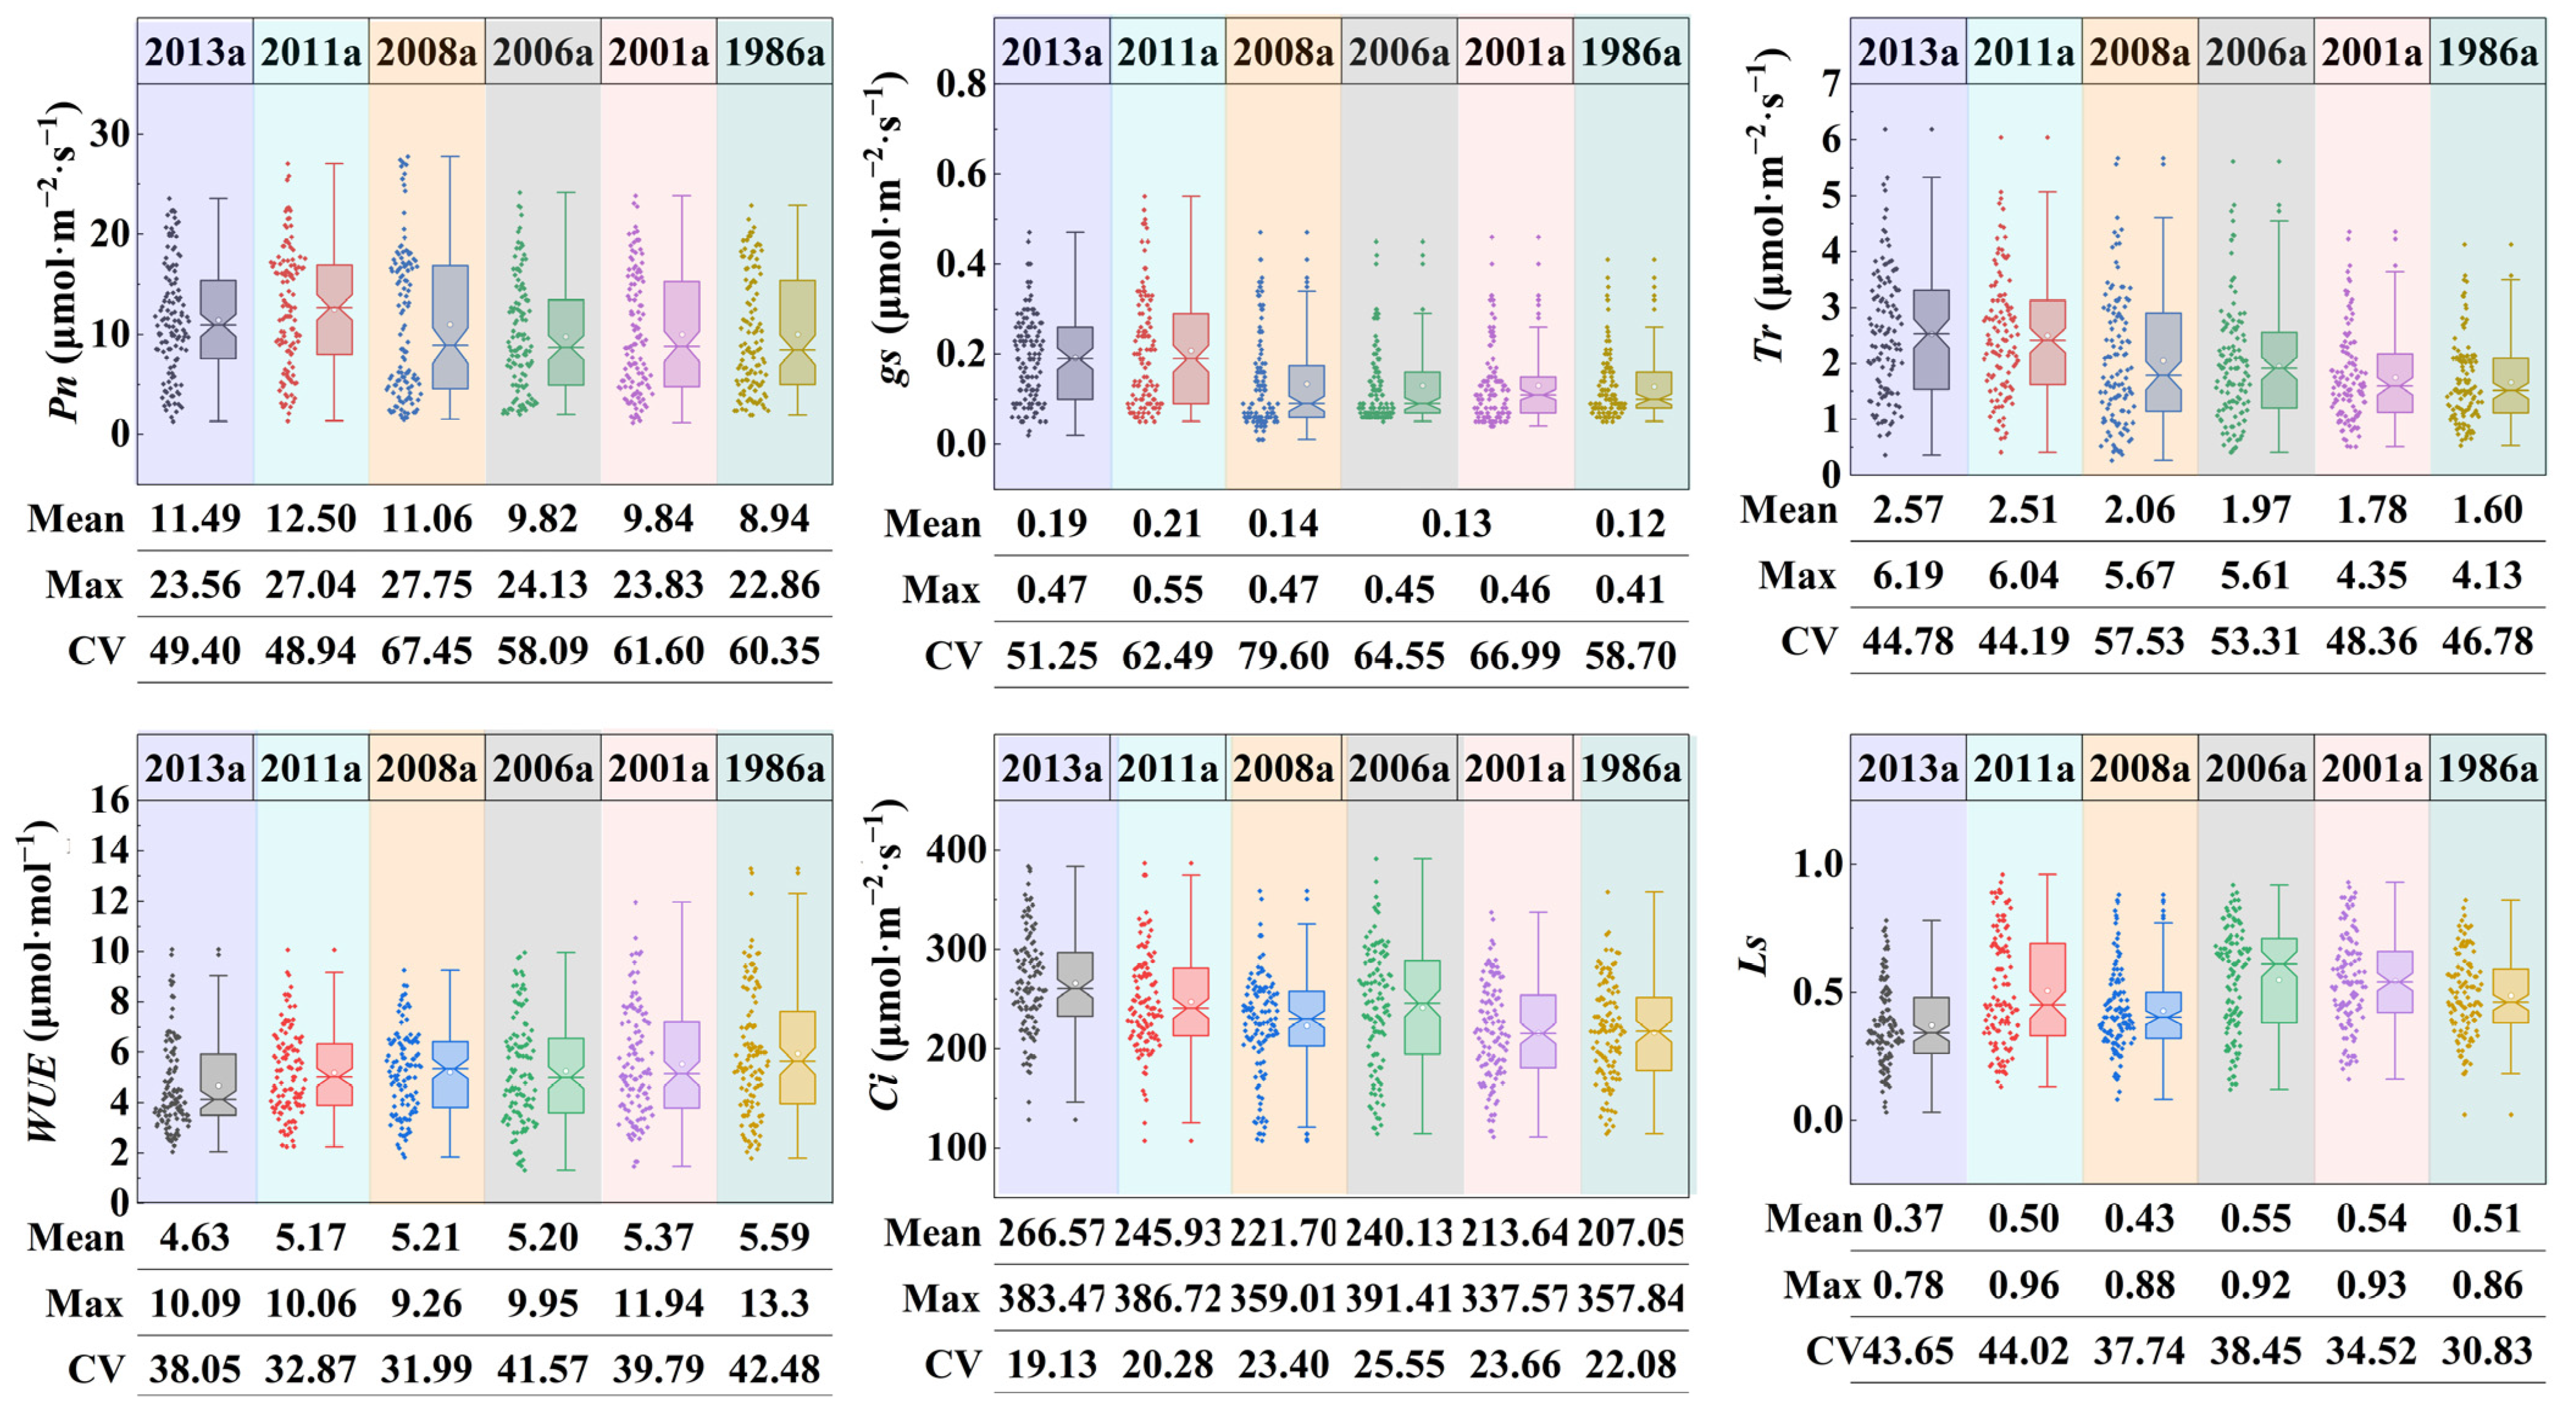
3.2. Characteristics of Photosynthetic Parameters of Plantations in Different Afforestation Years

The changes in photosynthetic parameters obtained from C. intermedia with the different afforestation years, which were positively correlated with Pn, gs, Tr and Ci while negatively correlated with WUE and Ls, were different (Figure 2 and Table 3). We found that the CV of Ci was below 30, and the CV of other parameters was above 30, indicating that the differences in photosynthetic parameters were obvious across the different sampling dates. The peak values of Pn and gs slightly increased and then slowly decreased, while Tr consistently decreased with the extension of afforestation years, which showed that the maximum photosynthetic capacity of plantation decreased with the growth of the afforestation years in the growing season. We also observed that photosynthetic physiological characteristics had significant annual changes by analyzing the correlation between the photosynthetic parameters and the afforestation years. Specifically, the afforestation years were significantly negatively correlated with Pn and Tr (p < 0.05, R2 > 0.83), and significantly positively correlated with WUE (p < 0.05, R2 = 0.82), suggesting that afforestation time is accompanied by poor photosynthetic capacity, and also maintains high water use efficiency.

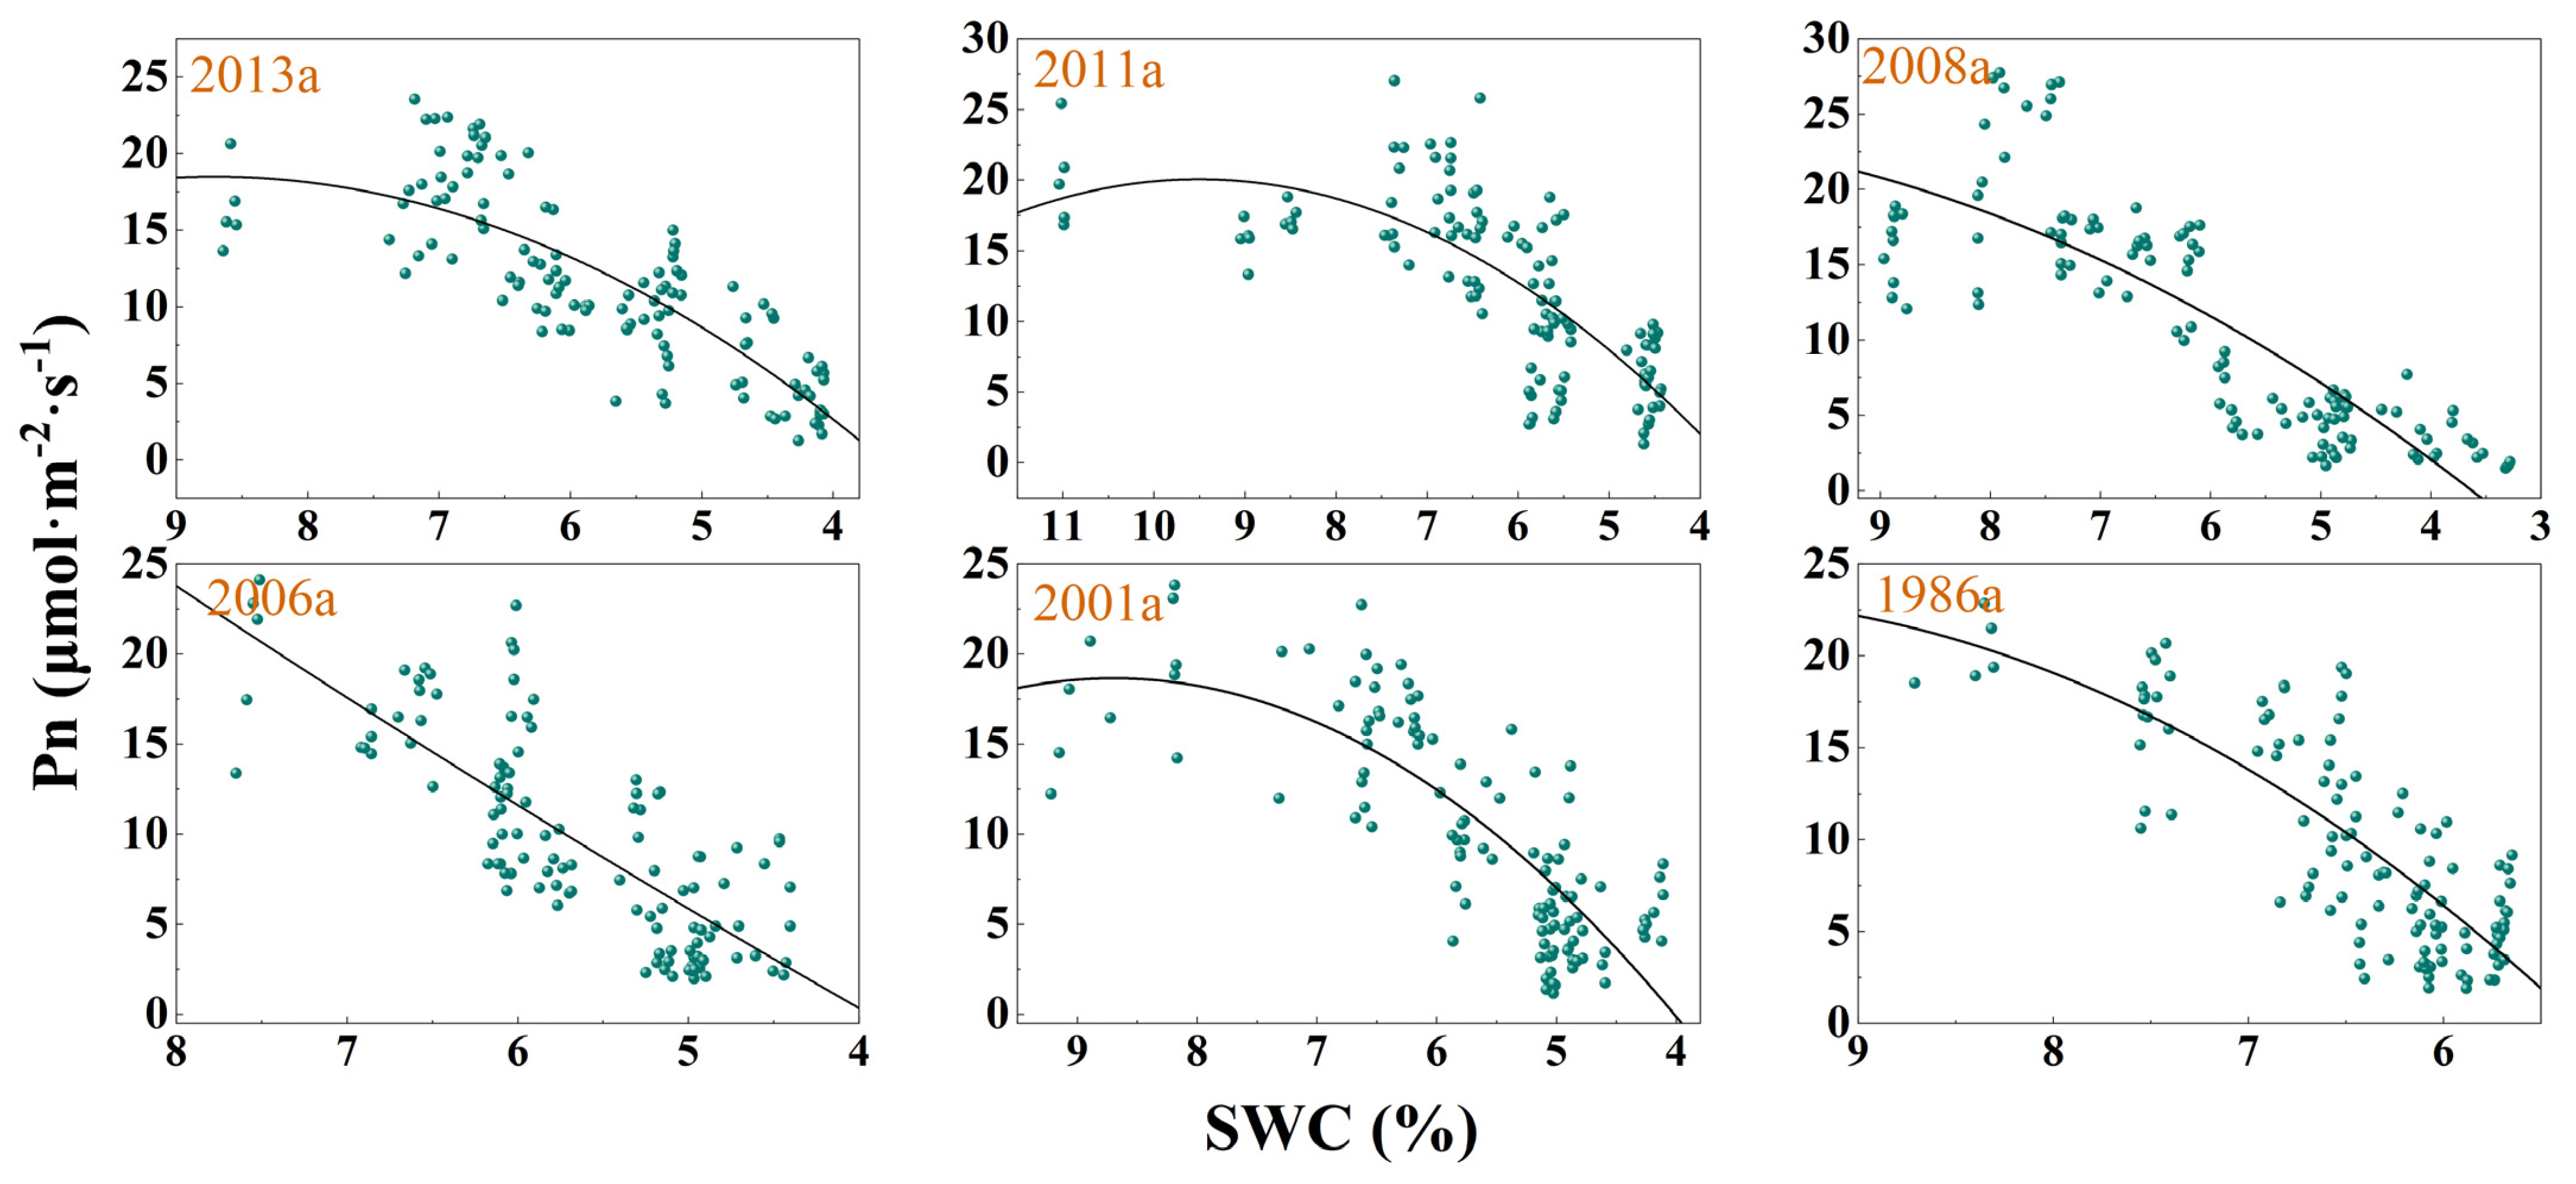
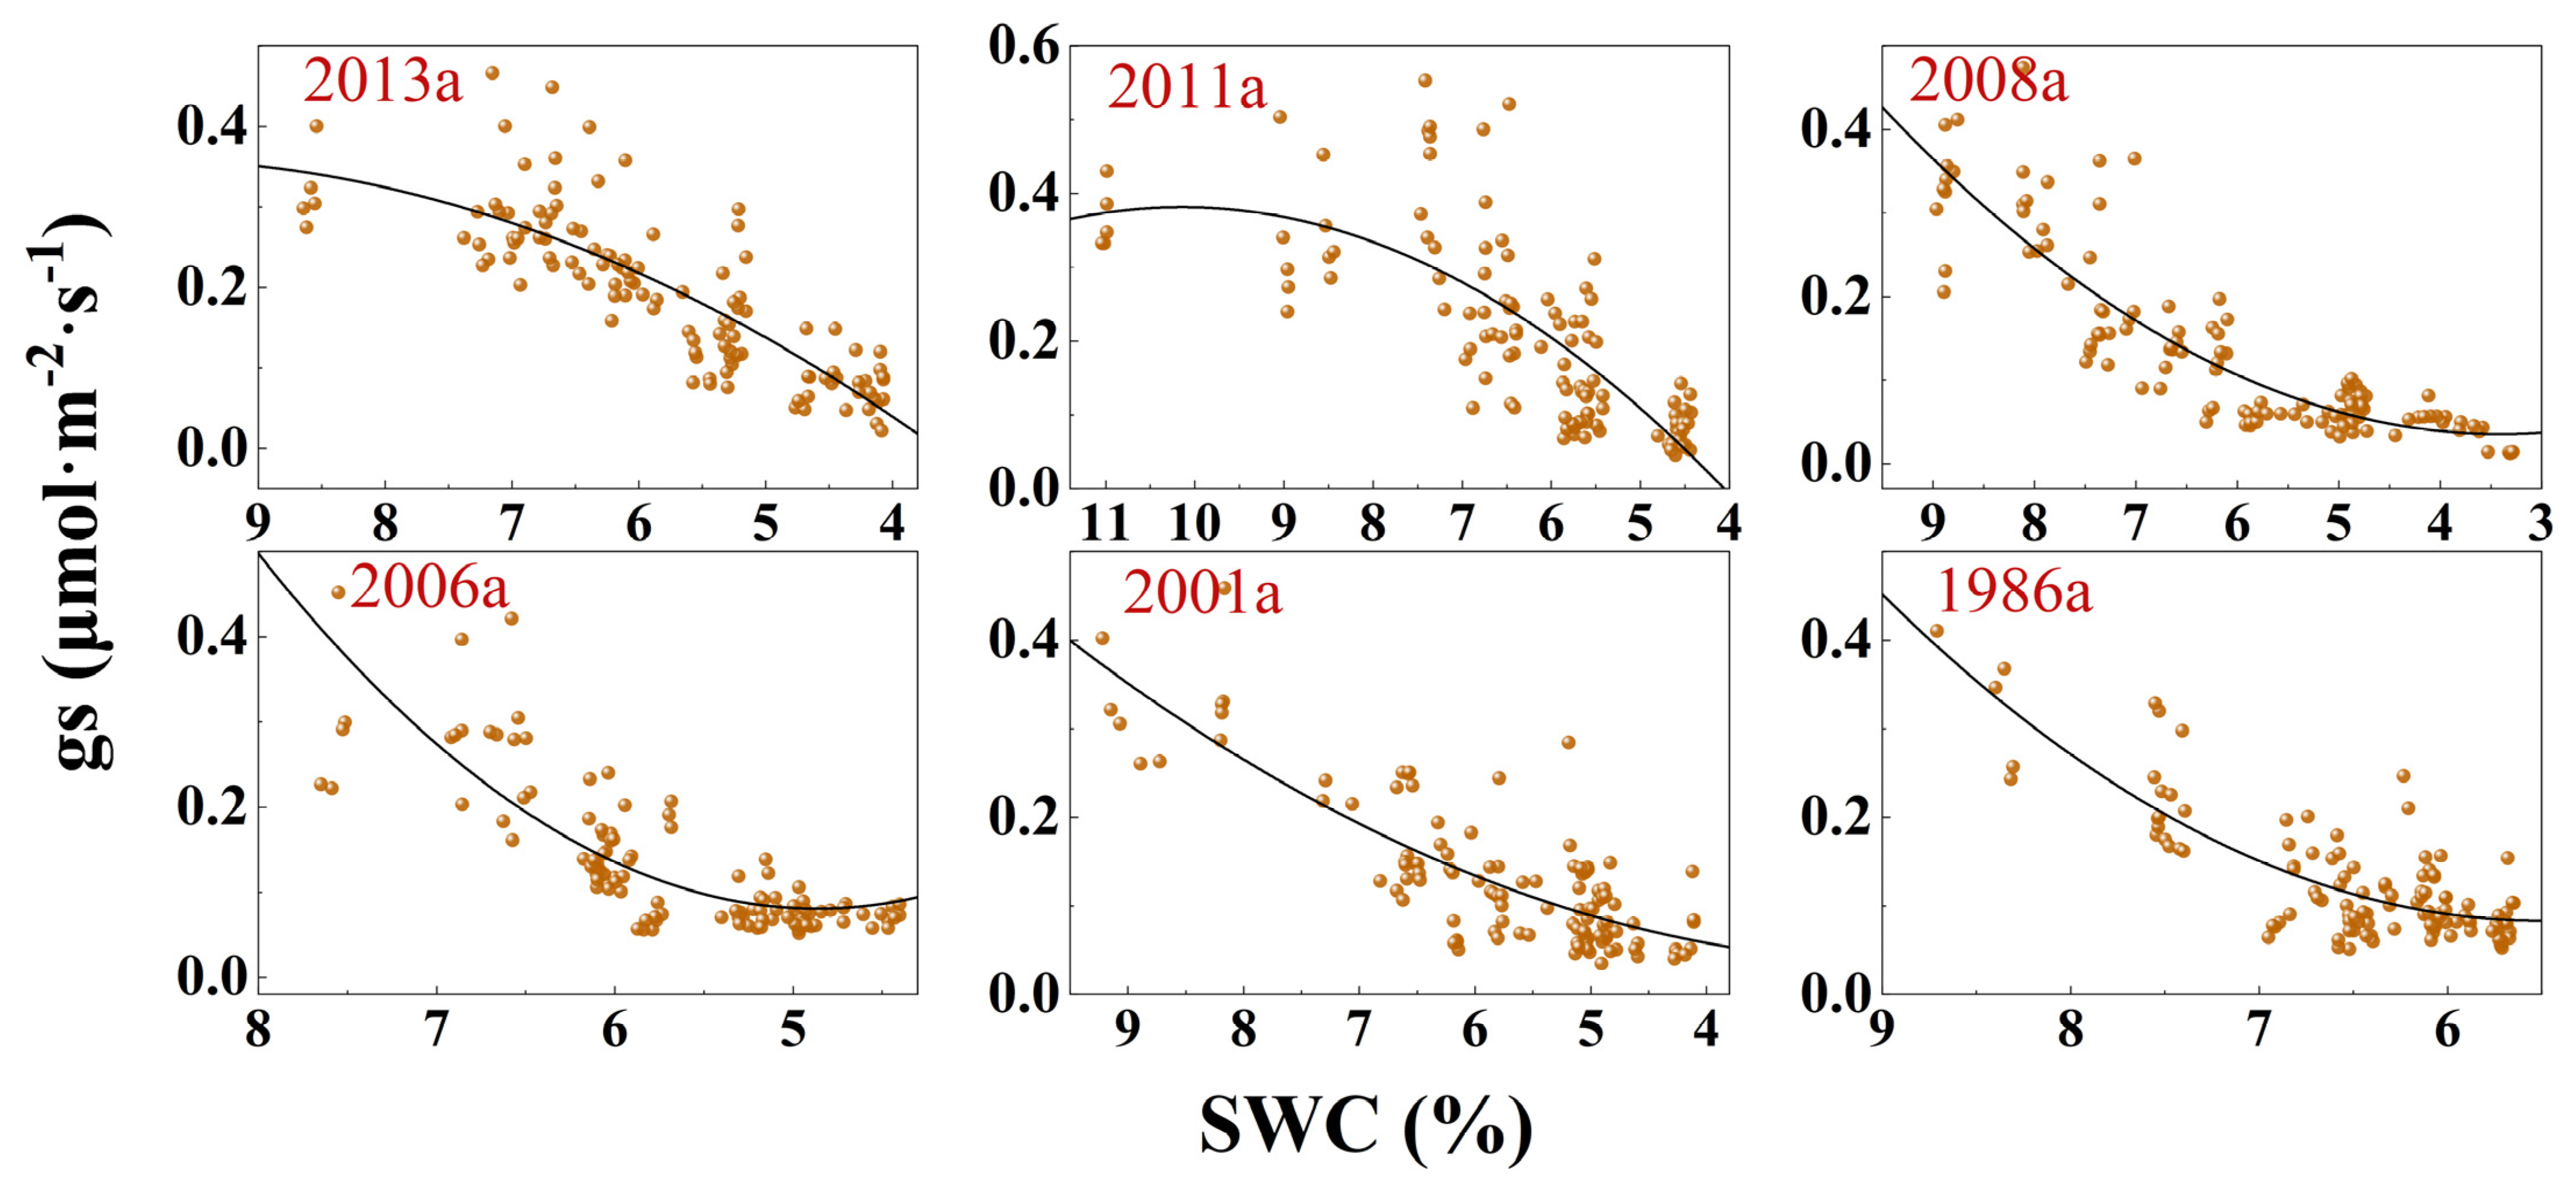
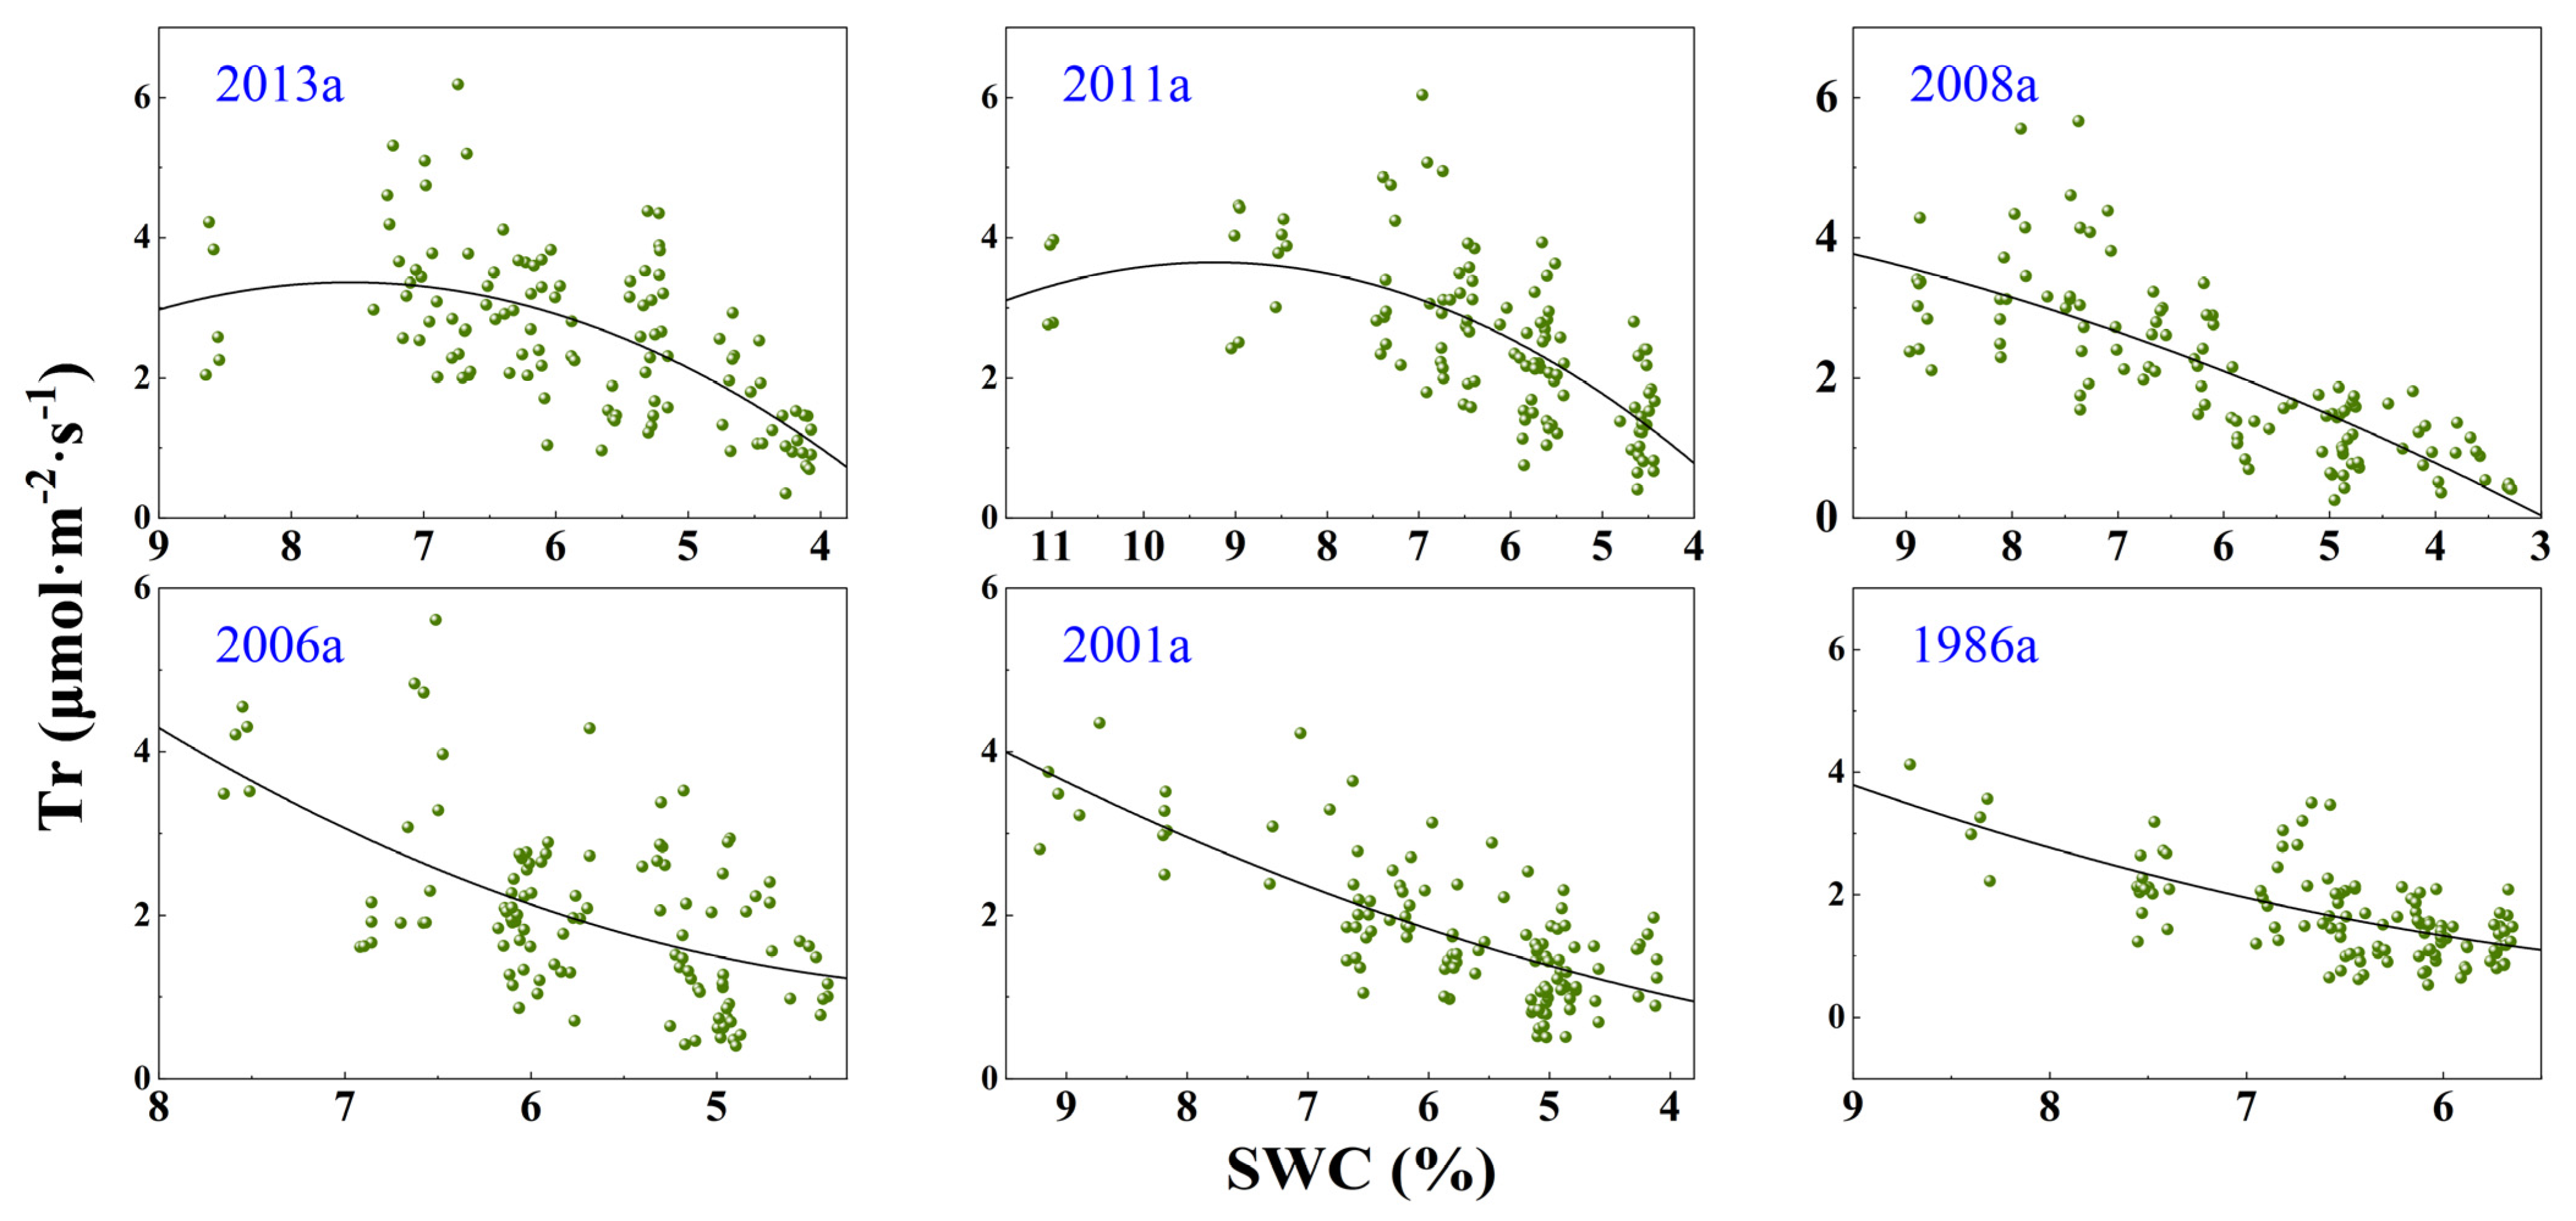
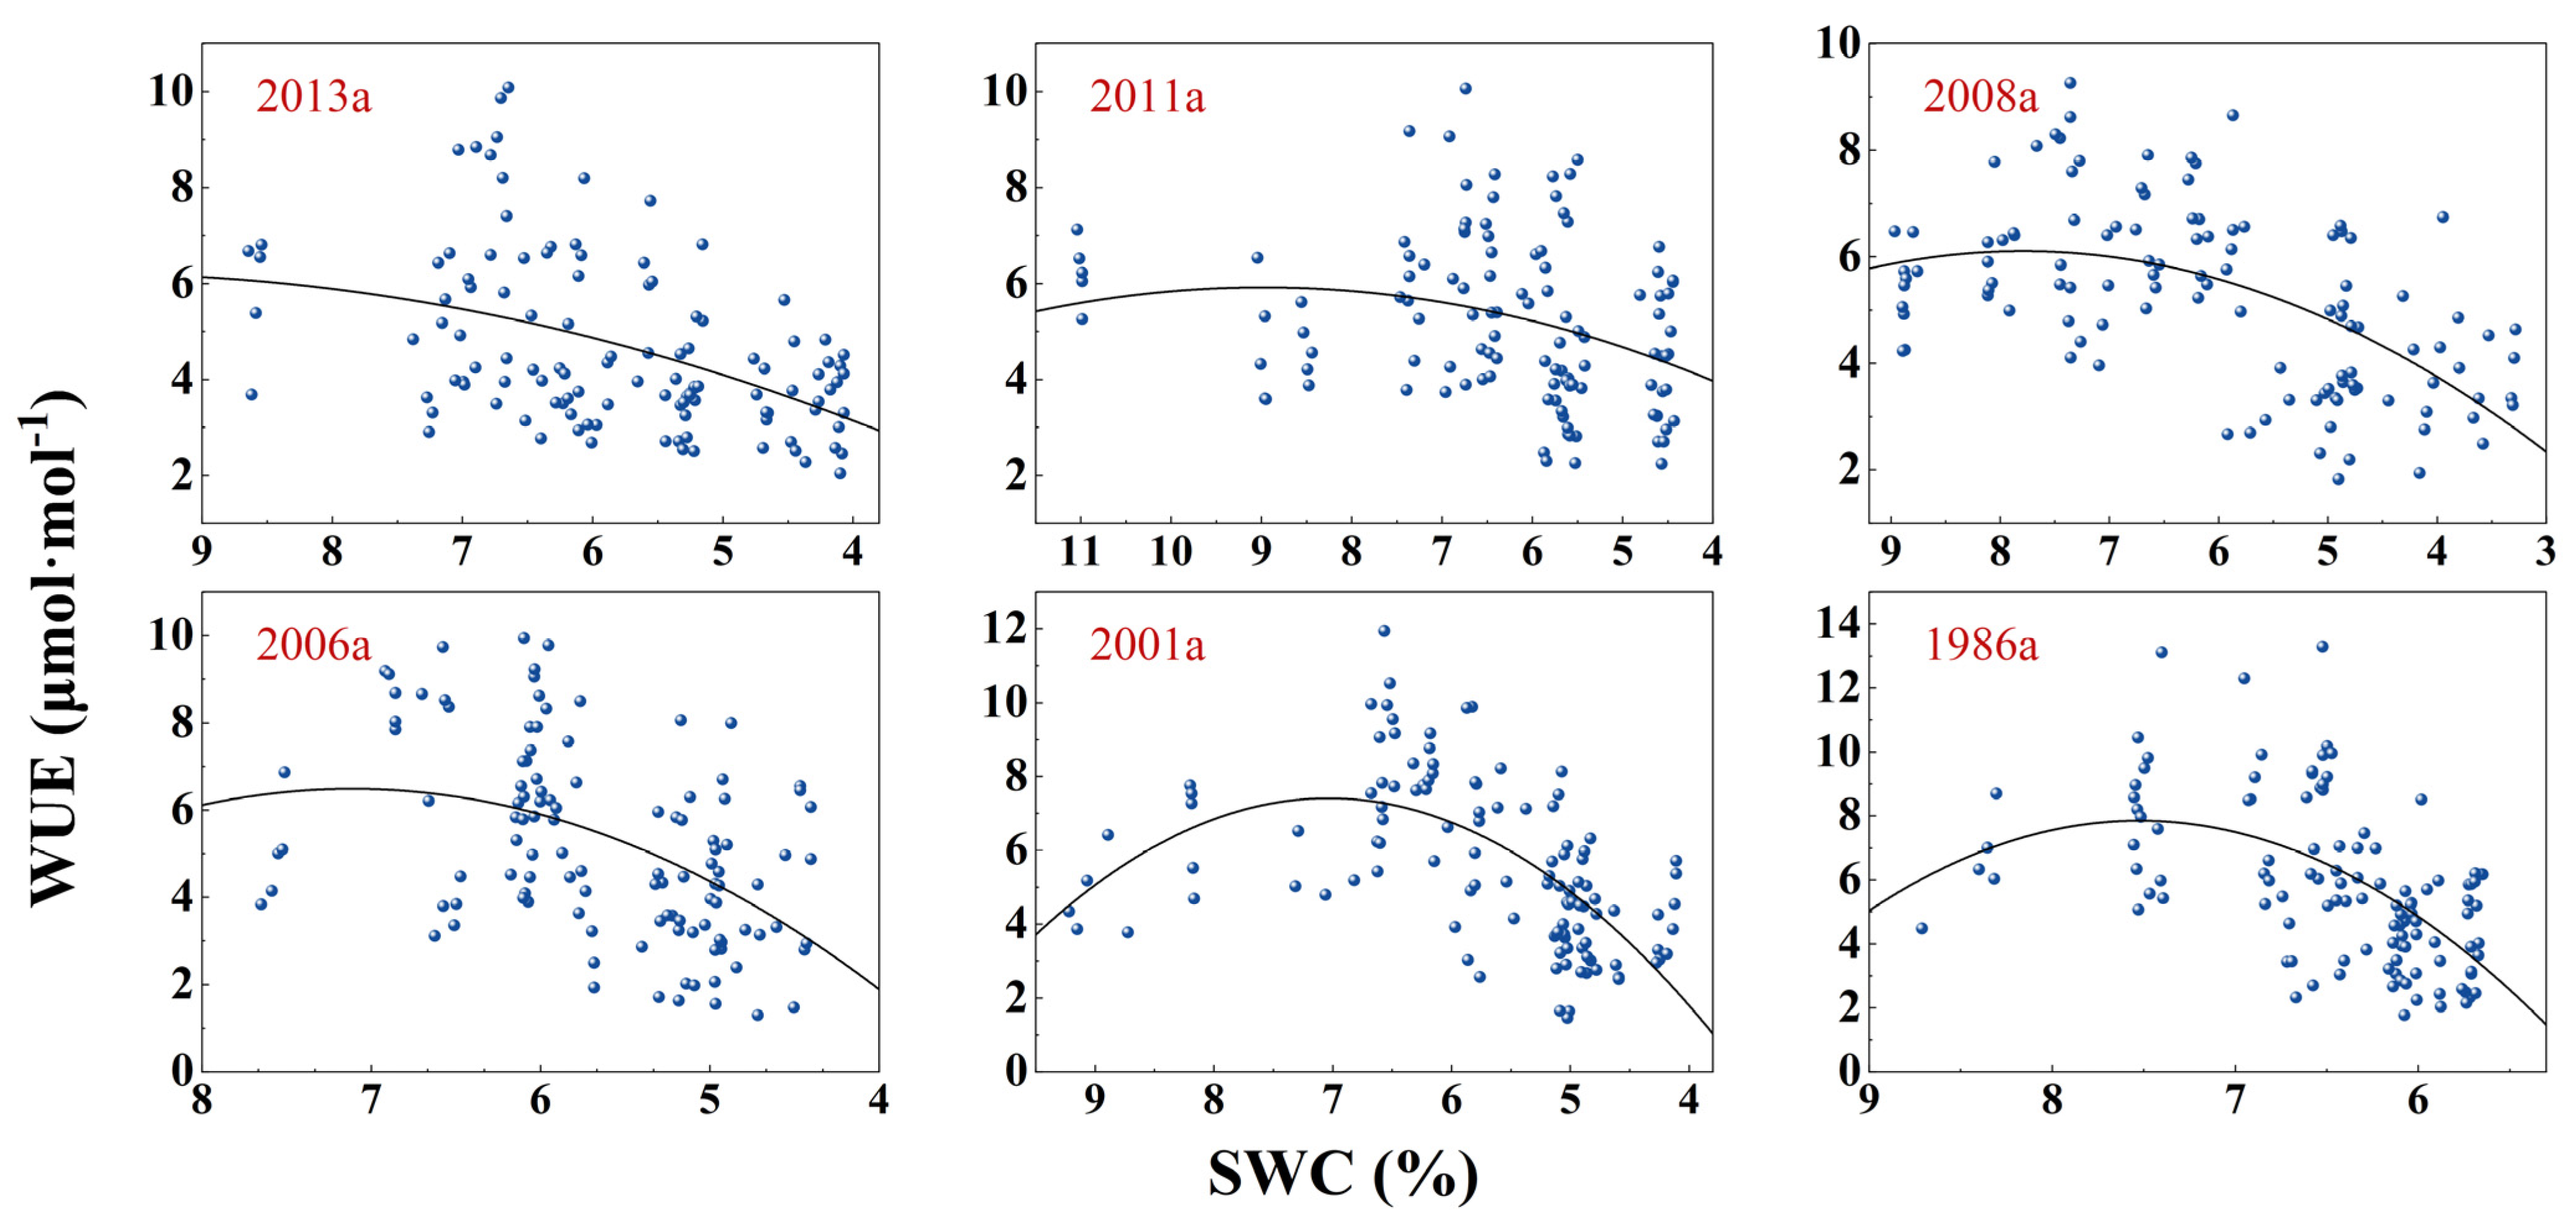
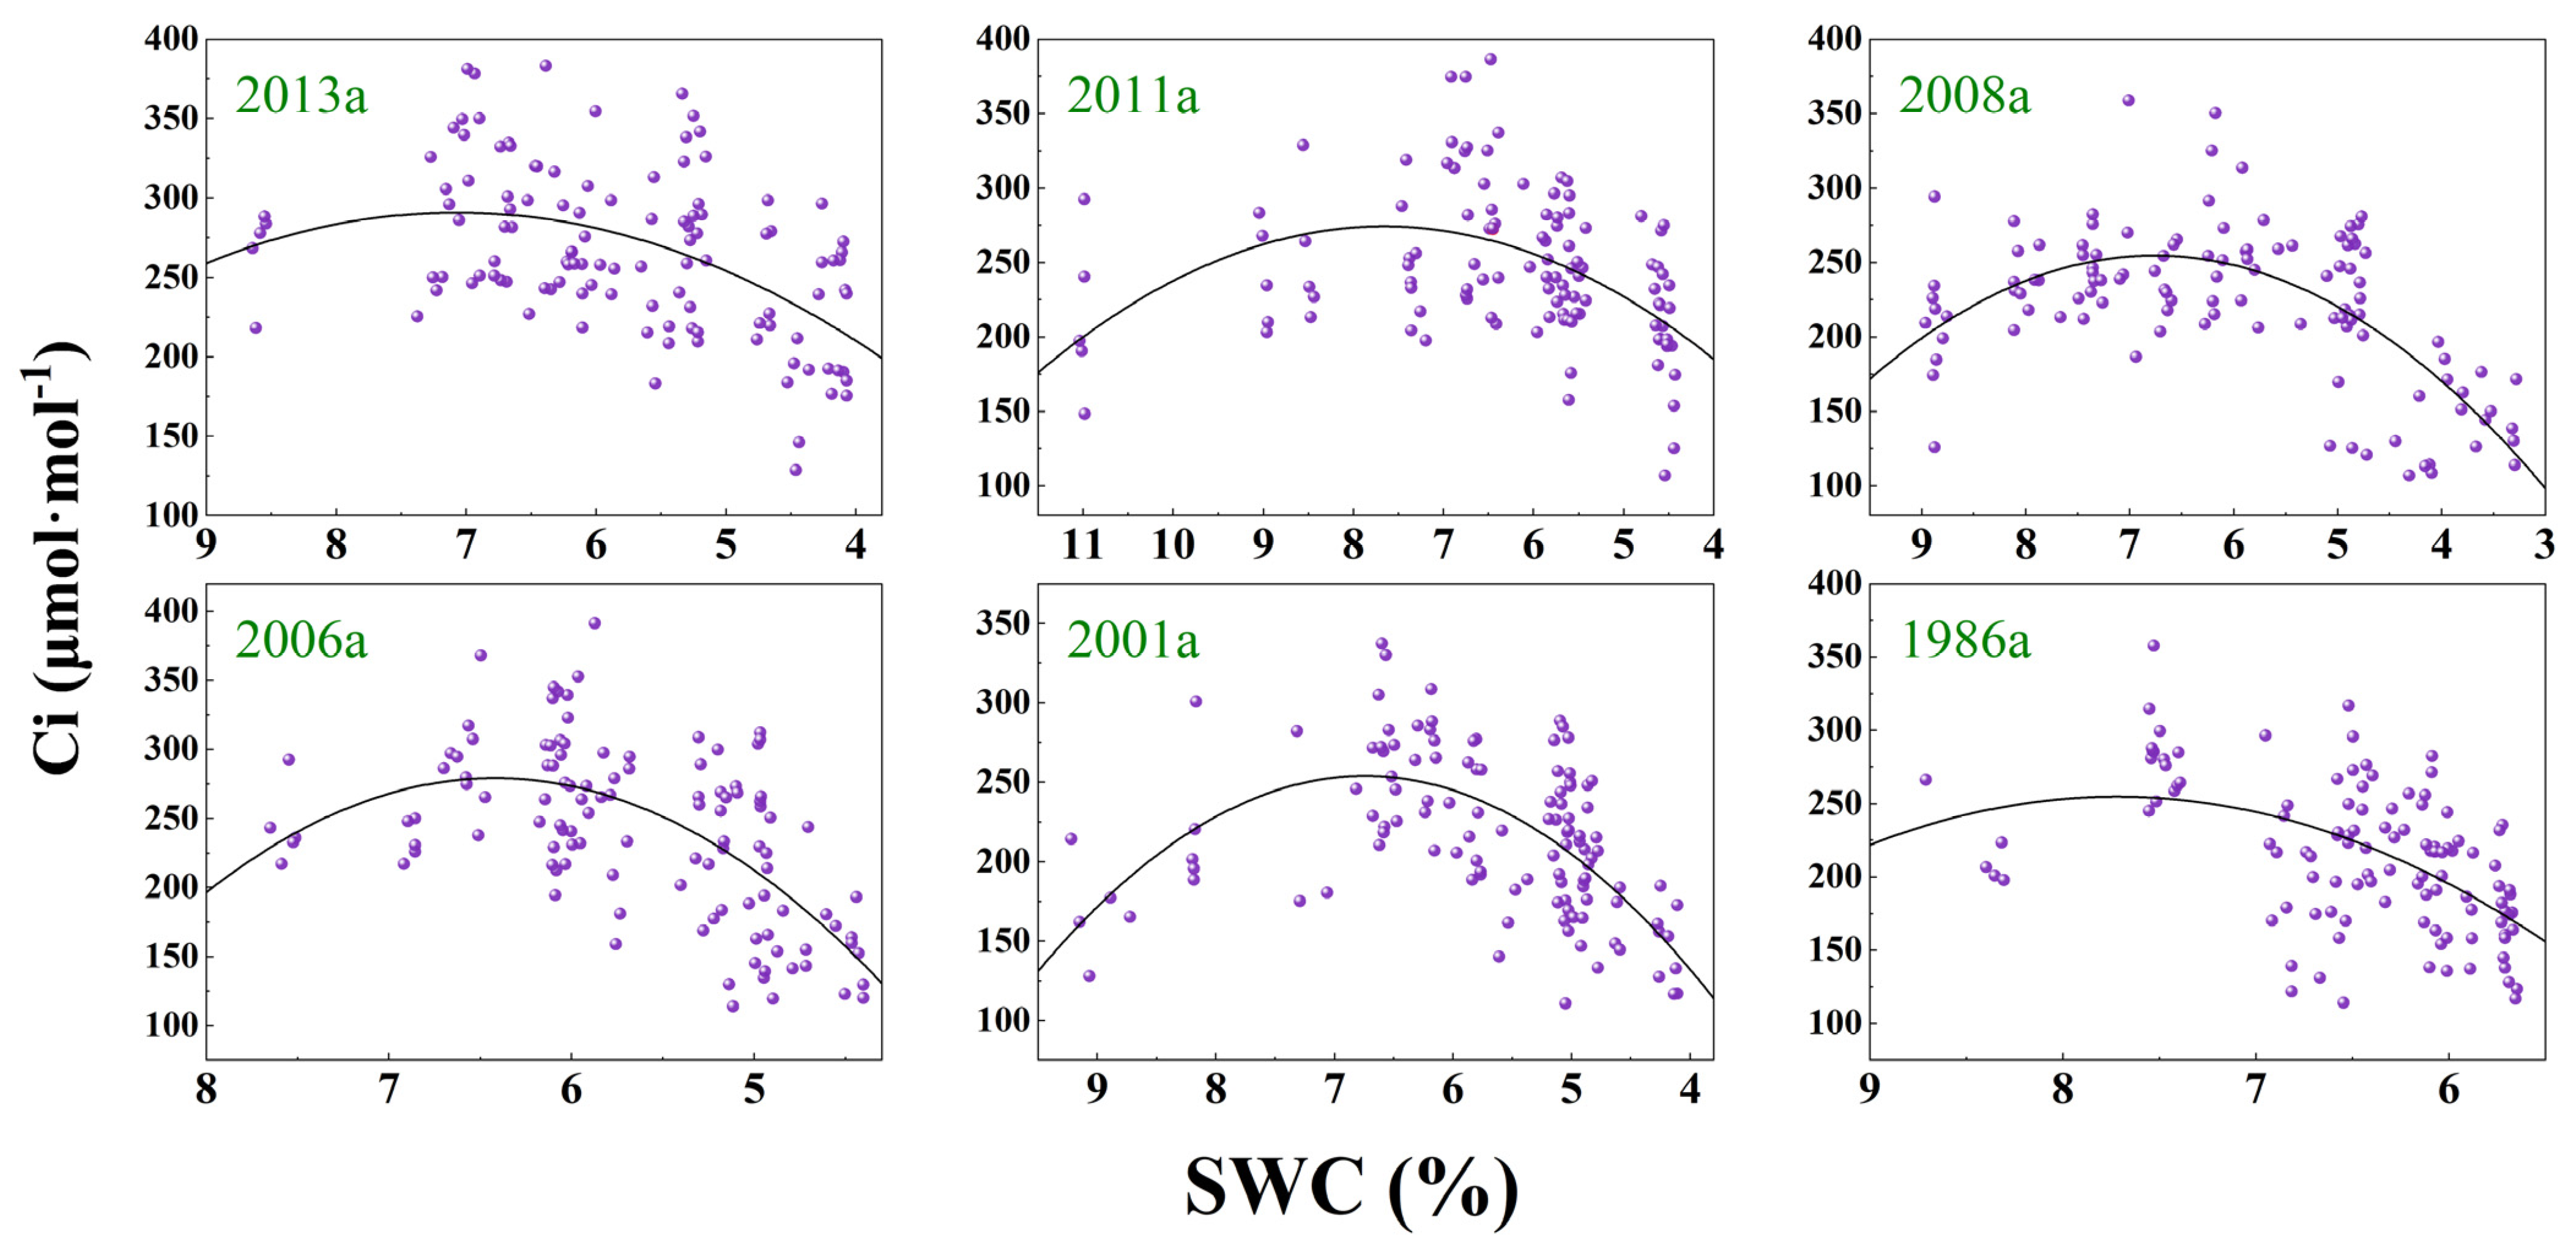
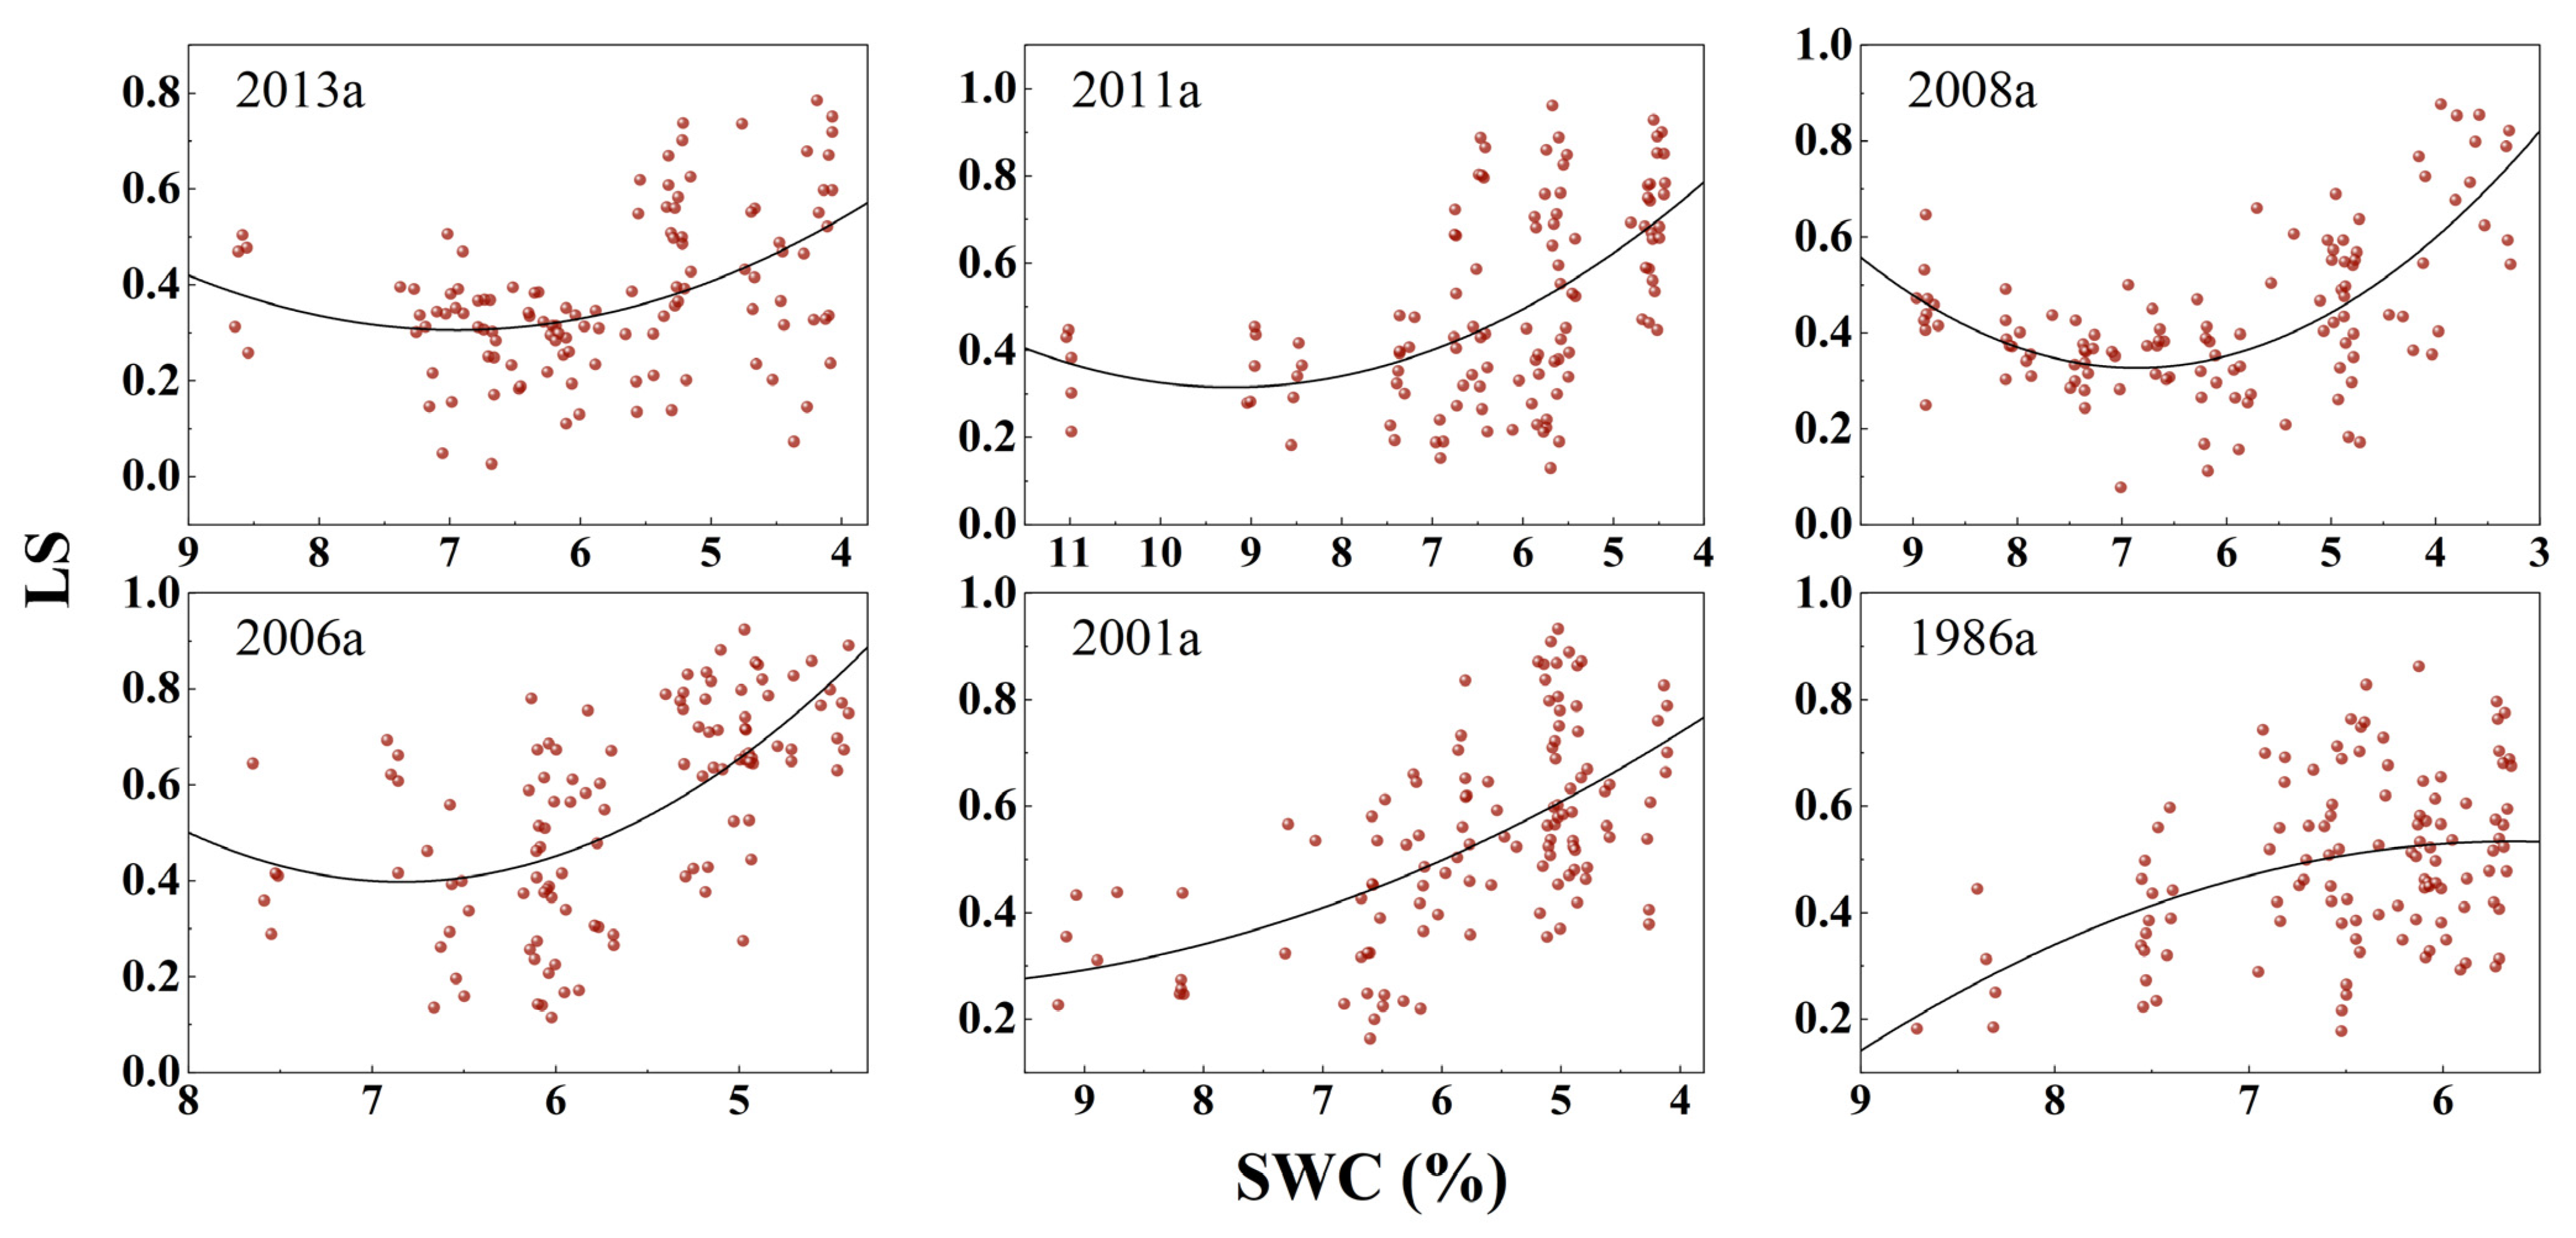
3.3. Response of Photosynthesis to SWC Changes

Gas exchange parameters: The values of gas exchange parameters of plantations in different afforestation years decreased as the SWC dried, but the decreases in individual stand plantations were different (Figure 3, Figure 4 and Figure 5) across the sampling period. Specifically, the gas exchange parameters of plantations in 2013a and 2011a sensitivities to SWC became smoother and steadier in moist soil environments, whereas the gas exchange parameters began to significantly decrease when SWC was lower than the critical value. We also observed that the earlier planted plantations were accompanied by the higher value of SWC corresponding to their gas parameter saturation, suggesting that the demands for water were higher with the growth of trees. Generally speaking, the critical value of SWC, when the gas exchange parameters approached zero, is defined as the water compensation point of photosynthesis (WCP-Pn, gs, Tr), and then the photosynthesis of plants is limited under WCP, and the no-productivity and no-efficiency water (NPNEW) values are determined by the WCP. However, the SWC of peak value in the gas exchange parameter is defined as the water saturation point of photosynthesis (WSP-Pn, gs, Tr), indicating that the photosynthetic efficiency of plants is the highest [8]. The critical SWC thresholds for the saturation points of gas exchange parameters in 2013a, 2011a, 2008a and 2006a showed the sequence of changes as gs > Pn > Tr (Table 4) and Tr > gs > Pn in 2001a and 1986a, and the SWC of peak value in Pn was close to that of gs. Similarly, the SWC of Pn approaching zero was close to that of gs, and higher than Tr in different afforestation years, which indicated that leaves reinforced stomatal closure and impaired the hydraulic transfer from soils to leaves to cope with water shortage damage under severe soil water stress.The regression analysis between gas exchange parameters (Pn, gs, tr) and SWC of C. intermedia leaves showed that there was a significant square relationship between gas exchange parameters and SWC (p < 0.0001) (Table 5 for fitting equation). The correlation coefficient R2 of SWC with Pn, gs and Tr was in the range of 0.55–0.69, 0.58–0.78 and 0.30–0.62, respectively, which indicated that the relationship between gs and SWC was closer.
Water use efficiency: The regression analysis between WUE and SWC of C. intermedia in different afforestation years showed that there was a significant square relationship in 2011a (p < 0.05) and an extremely significant square relationship in other plantations (p < 0.001) between WUE and SWC (Table 5 and Figure 6). However, the maximum correlation coefficient between WUE and SWC, which was lower than that of gas exchange parameters responding to SWC, was only 0.386. The WUE values of plantations in 2013a and 2011a were accompanied by a decrease in SWC, while that of plantations in 2008a, 2006a, 2001a and 1986a revealed an increasing trend and then a decreasing trend as the SWC decreased. The WUE water saturation point (WSP-WUE) showed an initial increasing and then decreasing trend with the increase of afforestation years (Table 6), and the WSP-WUE in 2008a was the largest. In addition, gs and Tr maintained an increasing trend while WUE decreased when SWC was higher than the critical value, which only appeared in plantations in 2001a and 1986a. This phenomenon meant that trees were more inclined to open stomata in order to adapt to the relatively humid environment.
Stomatal limitation: Ci and Ls showed an extremely significant square relationship with SWC (p < 0.0001) by the regression analysis (Table 5), but the Ci parameters responding to the changes of SWC, which at first increased and then decreased (Figure 7), was opposite to Ls as SWC decreased. Ls, on the contrary, decreased and then increased in 2013a, 2011a, 2008a and 2006a (Figure 8) and gradually increased in 2001a and 1986a. The correlation coefficient between them and SWC was close and low (Table 5).

3.4. SWC Threshold Classification of Photosynthetic Parameters of C. intermedia

The photosynthetic parameters of C. intermedia showed a significant correlation with SWC in plantations from different afforestation years (p < 0.0001) (Figure 2, Figure 3, Figure 4, Figure 5, Figure 6, Figure 7 and Figure 8 and Table 5). However, SWC thresholds related to photosynthetic parameters were different for plantations in different afforestation years. The thresholds of NPNEW with different gas exchange parameters of the plantations were 3.31–3.64%, 3.33–4.06%, 3.08–3.63%, 3.36–3.85%, 1.45–4.02%, 3.39–5.50%; highest productivity with the highest availability of water (HPHAW) was determined by the range of SWC at the peak of Pn and WUE [8], and the thresholds of HPHAW were 6.65–7.19%, 6.74–7.36%, 7.36–7.91%, 6.10–7.51%, 6.57–8.19%, 6.52–8.35%. We found that the highest SWC of the six plantation plots exceeded the HPHAW range by analyzing the characteristics of SWC in plantations of different afforestation years during the experiment time 2017a to 2021a (Table 7); the proportions of SWC in plantations of the different afforestation years were found to be 14.89%, 11.21%, 9.93%, 31.47%, 0.32% and 1.10%, respectively. However, the minimum value of SWC (Min-SWC) was higher than NPNEW in other plantations except for the 2001a and 1986a plantations, which indicated that there was a soil environment under dying stress in 2001a and 1986a. We rigorously checked the SWC from 2017a to 2021a in order to further determine the date of drying stress and found, much to our astonishment, that the SWC of the plantation in 2001a was lower than that of NPNEW for only one day, and its value of 4.00% was close to the highest value of NPNEW of 4.02%; in contrast, the SWC in 1986a was lower than that of NPNEW for 18 days concentrated in the early May and late September, which was more affected by the soil moisture in the non-growing season. Our further analysis showed that the average SWC of plantations in the past five years was higher than that of NPNEW; the modes of SWC of plantations in different stands were also higher than that of NPNEW.

4. Discussion

4.1. Effect of SWC on Plant Gas Exchange Parameters

Dryness stress, which restricts the growth and development of vegetation, is mainly manifested in low SWC and high atmospheric drought (VPD) [29], both of which have negative impacts on terrestrial gross primary production. However, we found that VPD had no significant correlation with SWC and Pn (p > 0.05), but it had significant positive correlation with gs, Ci and Tr (0.001 < p < 0.05), while R2 was extremely small (Figure 1). Meanwhile, there was little difference in temperature during the whole sampling period (Table 2), which was incapable of destroying the biological enzyme activity of photosynthesis. Therefore, the main factor affecting the photosynthesis of C. intermedia in the sandy lands of Qinghai-Tibet Plateau was SWC. Previous studies have also obtained this result, that is, compared with VPD, SWC plays a leading role in the dryness stress of ecosystem production in most terrestrial vegetation regions [29]. The impact of climate change on plant photosynthesis is more dependent on soil moisture, and the soil water deficit is in fact accompanied by a decrease of gs and saturated Pn [6]. Excessive or insufficient soil moisture poses an increasing threat to plant growth [7,11,30,31], and moderate soil moisture conditions thus significantly enhance development and leaf photosynthetic capacity. In this study, Pn, gs and Tr were less affected by SWC changes in moist soil environments, while gas exchange parameters began to decrease significantly when SWC was below the critical value in plantations of individual afforestation years (Figure 3, Figure 4 and Figure 5). A long-term physiological study on Robinia pseudoacacia, Amorpha fruticosa, Medicago sativa and Zea mays in the semi-arid Loess Plateau of China showed that gas exchange parameters showed no obvious change at the initial stage of the experiment, but they changed rapidly as SWC consistently decreased [16]. The gas exchange characteristics of plants directly related to net productivity are considered the key indicators of plant growth, and they are most sensitive to soil moisture changes [8,16]. Our analysis results also showed that there was a significant square relationship between the gas exchange parameters of C. intermedia and SWC (Figure 1 and Table 5), and gs demonstrated the highest correlation with SWC among photosynthetic parameters. Furthermore, the SWC corresponding to the saturation point and zero value point of photosynthetic parameters across the plantations in 2013a, 2011a, 2008a and 2006a was shown as gs > Pn > Tr, which indicated that gs was more sensitive to drought than the photosynthesis rate (Pn and Tr), and that the stomatal closure was the dominant driving force for the decreases in Pn and Tr. It is generally accepted that stomatal closures caused by drought are the primary determining factor in decreased photosynthesis [32]. The decrease in soil moisture leads to the increase in hydraulic resistance between the soil and the root system, and the delay of water transmission from soil to plant leaves provokes the closure of leaf stomata [33]. Moreover, controlling the flux of CO2 from stomata to leaves determines the rate of photosynthesis, which then regulates the water use efficiency [34]. Plants increase their carboxylation capacity in response to moderate soil drying, compensating for partial stomatal closure in order to maintain high rates to continue to assimilate CO2 under moist soils conditions. However, the WSP-gs of plantations in 2001a and 1986 was slightly lower than WSP-Tr, suggesting that C. intermedia gave priority to reducing transpiration and delaying the speed of stomata closure to maintain CO2 assimilation for a longer time when the soil water was reduced, which explained why the aging plantation year had the higher WUE (Figure 2). In line with the stomatal limitation theory [35,36], we also found that Ci began to decrease while Ls began to increase as the Pn decreased, showing stomatal limitation.

4.2. Difference in the SWC Threshold of C. Intermedia in Different Afforestation Years

Changes in the canopy characteristics and physiological functions of plants vary across forest stages, and the key physiological processes of photosynthesis change as the plants age [37,38]. Our research results also revealed the significant annual changes of photosynthetic physiological characteristics. Specifically, afforestation years were significantly negatively correlated with Pn and Tr, but significantly positively correlated with WUE (Table 3), which was consistent with the research of Caragana korshinskii in grassland desert areas [39]. However, environmental factors may combine with plant ages to produce differences in photosynthetic capacity [24] as water availability plays a critical role in the growth and survival of plants by affecting photosynthesis. The moisture threshold of plant physiological parameters varies with species, tree age, soil characteristics and environmental conditions [16,39,40]. For example, hydraulic restrictions increasingly lead to a decline in the photosynthetic rate [37] and a reduction of gross primary productivity [41] with the aging of pine trees in East-Central North Carolina, USA. This study found that the value of SWC corresponding to the gas parameter saturation point of plantations rises as the afforestation year becomes longer, and the aging plantations need more significant amounts of water. There was a significant correlation between the photosynthetic physiological indexes of C. intermedia and SWC (p < 0.0001) (Figure 2, Figure 3, Figure 4, Figure 5, Figure 6, Figure 7 and Figure 8 and Table 5), but the threshold of photosynthetic water varied with the years of afforestation. Generally speaking, the threshold values of NPNEW, representing the photosynthesis parameter value of zero, with different plantations in afforestation years were 3.31–3.64%; 3.33–4.06%; 3.08–3.63%; 3.36–3.85%; 1.45–4.02% and 3.39–5.50%. Thus, when the SWC of plantations in different afforestation years is lower than 3.64%, 4.06%, 3.63%, 3.85%, 4.02% and 5.50%, C. intermedia will be in the invalid state of the no-productivity and no-efficiency water, indicating that the physiological and metabolic activities of plants will be destroyed, and the trees will even die, if severe drought stresses continue without immediate cessation. This illustrative analysis of the relationship between NPNEW and afforestation years showed that the minimum soil moisture required by the plantation planted in 1986 was 5.50% higher than that of other plantations. Further analysis revealed that the minimum, average and mode of SWC in the growing season (May to September) in 2017a–2021a were higher than those in NPNEW. The SWC in the 0–40 cm layer of the plantation in 1986a was in the range of 5–8%, accounting for 88.18% of the total, while the SWC of plantation in other afforestation years were mainly in the range of 4–8%, accounting for more than 75.65% of the total. The above analysis show that we should still be alert to the occurrence of long-term drought, which may be because stomatal closure induced by soil moisture reduction will further limit the decline of plant water potential; if continued, drying is likely to lead to embolism of the vascular system and even, potentially, complete desiccation of the plant [7]. Within the range of HPHAW, plants have high photosynthetic capacity and reduce the ineffective water consumption caused by transpiration so as to ensure the effective physiological moisture of plant leaves, which is the best indicator of plant growth [8]. In this study, the thresholds of HPHAW were 6.65–7.19%; 6.74–7.36%; 7.36–7.91%; 6.10–7.51%; 6.57–8.19% and 6.52–8.35% and the proportion of SWC in plantations in the HPHAW range in different afforestation years decreased with the increase of afforestation years. This reflected that although plantations over 30 years still survive in alpine sandy areas, their productivity has commenced declining, so it is necessary to pay attention to their growth status and make timely management adjustments in the future. Quantifying the NPNEW and HPHAW values of plant species will be of service to determine the ecological adaptability of plants and clarify vegetation water management.

5. Conclusions

In situ experiments were conducted in the forest, and the main factors affecting photosynthesis of C. intermedia in the sandy lands of Qinghai-Tibet Plateau were successfully identified. The response processes of photosynthetic parameters of plantations to soil moisture in different afforestation years were revealed, and the NPNEW and HPHAW values of photosynthetic water were determined. The study showed that soil moisture, compared with VPD, played a leading role in influencing the photosynthesis of C. intermedia in the sandy lands of Qinghai-Tibet Plateau. Afforestation year was negatively correlated with Pn, gs and Tr, but positively correlated with WUE. The value of SWC corresponding to the gas parameter saturation point of plantations rises as the afforestation year lengthens, and the aging plantations need more significant amounts of water. There was a significant square relationship between photosynthetic parameters and SWC (p < 0.001), and stomatal closure under drought stress was the main determinant of photosynthesis decline. The NPNEW thresholds of photosynthetic physiology of different plantations were 3.31–3.64%; 3.33–4.06%; 3.08–3.63%; 3.36–3.85%; 1.45–4.02% and 3.39–5.50%, and the thresholds of HPHAW were 6.65–7.19%; 6.74–7.36%; 7.36–7.91%; 6.10–7.51%; 6.57–8.19% and 6.52–8.35%. Plantations in different planting years survived safely in the sandy lands of Qinghai-Tibet Plateau by analyzing the characteristics of SWC in five consecutive growing seasons (May-September). However, the longer the afforestation time, the lower the productivity of trees. Thus, we should always pay attention to their growth status and make timely management adjustments in the future.

Author Contributions

Conceptualization, Y.G. and Z.J.; methodology, Z.J.; software, Y.G., J.D. and R.W.; investigation, Y.G. and J.Z.; formal analysis, Y.G., J.Z., L.W., L.H. and Q.L.; writing—original draft preparation, Y.G.; writing—review and editing, Y.G., Z.J. and T.L.; project administration, Z.J.; funding acquisition, Z.J. All authors have read and agreed to the published version of the manuscript.

Funding

This work was supported by the Special Fund of the Key Laboratory of Forestry Cultivation of the Research Institute of Forestry, Chinese Academy of Forestry (grant number ZDRIF201903) and the Development and Research on Forest and Grassland Science and Technology Innovation of the State Forestry and Grassland Administration (grant number 2021132007) and Special fund project of the Forestry Research Institute of the Chinese Academy of Forestry (grant number LYSZX202003).

Institutional Review Board Statement

Not applicable.

Informed Consent Statement

Not applicable.

Data Availability Statement

The datasets used and/or analyzed during this study are available from the corresponding author on reasonable request.

Acknowledgments

We are very grateful to the Qinghai Gonghe Desert Ecosystem and Research Station for their support and assistance in the fieldwork.

Conflicts of Interest

The authors declare no conflict of interest.

References

  1. Burrell, A.L.; Evans, J.P.; De Kauwe, M.G. Anthropogenic climate change has driven over 5 million km2 of drylands towards desertification. Nat. Commun. 2020, 11, 3853. [Google Scholar] [CrossRef] [PubMed]
  2. Bouras, E.; Jarlan, L.; Khabba, S.; Er-Raki, S.; Dezetter, A.; Sghir, F.; Tramblay, Y. Assessing the impact of global climate changes on irrigated wheat yields and water requirements in a semi-arid environment of Morocco. Sci. Rep. 2019, 9, 19142. [Google Scholar] [CrossRef] [PubMed] [Green Version]
  3. Lin, P.; He, Z.; Du, J.; Chen, L.; Zhu, X.; Li, J. Recent changes in daily climate extremes in an arid mountain region, a case study in northwestern China’s Qilian Mountains. Sci. Rep. 2017, 7, 2245. [Google Scholar] [CrossRef] [Green Version]
  4. Franz, T.E.; Caylor, K.K.; King, E.G.; Nordbotten, J.M.; Celia, M.A.; Rodriguez-Iturbel, I. An ecohydrological approach to predicting hillslope-scale vegetation patterns in dryland ecosystems. Water Resour. Res. 2012, 48, 1515. [Google Scholar] [CrossRef] [Green Version]
  5. Manzoni, S.; Vico, G.; Katul, G.; Palmroth, S.; Jackson, R.B.; Porporato, A. Hydraulic limits on maximum plant transpiration and the emergence of the safety-efficiency trade-off. New Phytol. 2013, 198, 169–178. [Google Scholar] [CrossRef] [PubMed]
  6. Reich, P.B.; Sendall, K.M.; Stefanski, A.; Rich, R.L.; Hobbie, S.E.; Montgomery, R.A. Effects of climate warming on photosynthesis in boreal tree species depend on soil moisture. Nature 2018, 562, 263–267. [Google Scholar] [CrossRef]
  7. Fu, Z.; Ciais, P.; Prentice, I.C.; Gentine, P.; Makowski, D.; Bastos, A.; Luo, X.; Green, J.K.; Stoy, P.C.; Yang, H.; et al. Atmospheric dryness reduces photosynthesis along a large range of soil water deficits. Nat. Commun. 2022, 13, 989. [Google Scholar] [CrossRef]
  8. Huang, Z.; Liu, Y.; Tian, F.P.; Wu, G.L. Soil water availability threshold indicator was determined by using plant physiological responses under drought conditions. Ecol Indic. 2020, 118, 106740. [Google Scholar] [CrossRef]
  9. Qing, Y.; Wang, S.; Ancell, B.C.; Yang, Z.L. Accelerating flash droughts induced by the joint influence of soil moisture depletion and atmospheric aridity. Nat. Commun. 2022, 13, 1139. [Google Scholar] [CrossRef] [PubMed]
  10. Li, W.; Migliavacca, M.; Forkel, M.; Denissen, J.M.C.; Reichstein, M.; Yang, H.; Duveiller, G.; Weber, U.; Orth, R. Widespread increasing vegetation sensitivity to soil moisture. Nat. Commun. 2022, 13, 3959. [Google Scholar] [CrossRef]
  11. Hicke, J.A.; Zeppel, M.J.B. Climate-driven tree mortality: Insights from the pinon pine die-off in the United States. New Phytol. 2013, 200, 301–303. [Google Scholar] [CrossRef]
  12. Zhou, S.; Williams, A.P.; Lintner, B.R.; Berg, A.M.; Zhang, Y.; Keenan, T.F.; Cook, B.I.; Hagemann, S.; Seneviratne, S.I.; Gentine, P. Soil moisture–atmosphere feedbacks mitigate declining water availability in drylands. Nat. Clim. Change 2021, 11, 38–44. [Google Scholar] [CrossRef]
  13. Huang, Z.; Liu, Y.; Cui, Z.; Fang, Y.; He, H.; Liu, B.-R.; Wu, G.-L. Soil water storage deficit of alfalfa (Medicago sativa) grasslands along ages in arid area (China). Field Crops Res. 2018, 221, 1–6. [Google Scholar] [CrossRef]
  14. Humphrey, V.; Berg, A.; Ciais, P.; Gentine, P.; Jung, M.; Reichstein, M.; Seneviratne, S.I.; Frankenberg, C. Soil moisture–atmosphere feedback dominates land carbon uptake variability. Nature 2021, 592, 65–69. [Google Scholar] [CrossRef] [PubMed]
  15. Kumarathunge, D.P.; Drake, J.E.; Tjoelker, M.G.; Lopez, R.; Pfautsch, S.; Varhammar, A.; Medlyn, B.E. The temperature optima for tree seedling photosynthesis and growth depend on water inputs. Global. Change Biol. 2020, 26, 2544–2560. [Google Scholar] [CrossRef] [PubMed]
  16. Yan, W.; Zhong, Y.; Shangguan, Z. Responses of different physiological parameter thresholds to soil water availability in four plant species during prolonged drought. Agric. For. Meteorol. 2017, 247, 311–319. [Google Scholar] [CrossRef]
  17. Zhang, G.C.; Xia, J.B.; Shao, H.B.; Zhang, S.Y. Grading Woodland Soil Water Productivity and Soil Bioavailability in the Semi-Arid Loess Plateau of China. Clean-Soil Air Water 2012, 40, 148–153. [Google Scholar] [CrossRef]
  18. Zhang, S.Y.; Zhang, G.C.; Gu, S.Y.; Xia, J.B.; Zhao, J.K. Critical responses of photosynthetic efficiency of goldspur apple tree to soil water variation in semiarid loess hilly area. Photosynthetica 2010, 48, 589–595. [Google Scholar] [CrossRef]
  19. Li, Q.; Jia, Z.; Zhu, Y.; Wang, Y.; Li, H.; Yang, D.; Zhao, X. Spatial Heterogeneity of Soil Nutrients after the Establishment of Caragana intermedia Plantation on Sand Dunes in Alpine Sandy Land of the Tibet Plateau. PLoS ONE 2019, 14, e0218503. [Google Scholar] [CrossRef] [Green Version]
  20. Wang, G.; Wang, Y.; Li, Y.; Cheng, H. Influences of alpine ecosystem responses to climatic change on soil properties on the Qinghai-Tibet Plateau, China. Catena 2007, 70, 506–514. [Google Scholar] [CrossRef]
  21. Pretzsch, H.; Biber, P.; Schütze, G.; Uhl, E.; Rötzer, T. Forest stand growth dynamics in Central Europe have accelerated since 1870. Nat. Commun. 2014, 5, 4967. [Google Scholar] [CrossRef] [PubMed] [Green Version]
  22. Li, C.; Fu, B.; Wang, S.; Stringer, L.C.; Wang, Y.; Li, Z.; Liu, Y.; Zhou, W. Drivers and impacts of changes in China’s drylands. Nat. Rev. Earth. Environ. 2021, 2, 858–873. [Google Scholar] [CrossRef]
  23. Yan, W.; Deng, L.; Zhong, Y.; Shangguan, Z. The Characters of Dry Soil Layer on the Loess Plateau in China and Their Influencing Factors. PLoS ONE 2015, 10, e0134902. [Google Scholar] [CrossRef] [PubMed]
  24. Xu, H.; Xiao, J.; Zhang, Z.; Ollinger, S.V.; Hollinger, D.Y.; Pan, Y.; Wan, J. Canopy photosynthetic capacity drives contrasting age dynamics of resource use efficiencies between mature temperate evergreen and deciduous forests. Global. Change Biol. 2020, 26, 6156–6167. [Google Scholar] [CrossRef]
  25. Yu, Y.; Zheng, W.; Zhong, X.; Ying, B. Stoichiometric characteristics in Zanthoxylum planispinum var. dintanensis plantation of different ages. Agron. J. 2021, 113, 685–695. [Google Scholar]
  26. Au, T.F.; Maxwell, J.T.; Robeson, S.M.; Li, J.; Siani, S.M.; Novick, K.A.; Dannenberg, M.P.; Phillips, R.P.; Li, T.; Chen, Z. Younger trees in the upper canopy are more sensitive but also more resilient to drought. Nat. Clim. Change 2022, 12, 1168–1174. [Google Scholar] [CrossRef]
  27. Liu, B.; Zhao, H.; Jin, H.; Chen, F. Holocene Moisture Variation Recorded by Aeolian Sand-Palaeosol Sequences of the Gonghe Basin, Northeastern Qinghai-Tibetan Plateau, China. Acta Geol. Sin. Engl. 2020, 94, 668–681. [Google Scholar] [CrossRef]
  28. Gao, Y.; He, L.X.Z.; Jia, Z.Q.; Li, Q.X.; Dai, J. Effects of precipitation on water use characteristics of Caragana intermedia plantations with different stand ages in alpine sandy land. Chin. J. Appl. Ecol. 2021, 32, 1935–1942. (In Chinese) [Google Scholar]
  29. Liu, L.; Gudmundsson, L.; Hauser, M.; Qin, D.; Li, S.; Seneviratne, S.I. Soil moisture dominates dryness stress on ecosystem production globally. Nat. Commun. 2020, 11, 4892. [Google Scholar] [CrossRef] [PubMed]
  30. Yin, C.Y.; Pang, X.Y.; Peuke, A.D.; Wang, X.; Chen, K.; Gong, R.G. Growth and photosynthetic responses in Jatropha curcas L. seedlings of different provenances to watering regimes. Photosynthetica 2016, 54, 367–373. [Google Scholar] [CrossRef] [Green Version]
  31. Gong, C.M.; Bai, J.; Wang, J.H.; Zhou, Y.L.; Kang, T.; Wang, J.J.; Hu, C.X.; Guo, H.B.; Chen, P.L.; Xie, P.; et al. Carbon Storage Patterns of Caragana korshinskii in Areas of Reduced Environmental Moisture on the Loess Plateau, China. Sci. Rep. 2016, 6, 28883. [Google Scholar] [CrossRef] [Green Version]
  32. Yan, W.; Zhong, Y.; Shangguan, Z. A meta-analysis of leaf gas exchange and water status responses to drought. Sci. Rep. 2016, 6, 20917. [Google Scholar] [CrossRef] [PubMed] [Green Version]
  33. Fan, Y.; Miguez-Macho, G.; Jobbagy, E.G.; Jackson, R.B.; Otero-Casal, C. Hydrologic regulation of plant rooting depth. Proc. Natl. Acad. Sci. USA 2017, 114, 10572–10577. [Google Scholar] [CrossRef] [PubMed] [Green Version]
  34. Mcausland, L.; Vialet-Chabrand, S.; Davey, P.; Baker, N.R.; Brendel, O.; Lawson, T. Effects of kinetics of light-induced stomatal responses on photosynthesis and water-use efficiency. New Phytol. 2016, 211, 1209–1220. [Google Scholar] [CrossRef] [PubMed]
  35. Bertolino, L.T.; Caine, R.S.; Gray, J.E. Impact of Stomatal Density and Morphology on Water-Use Efficiency in a Changing World. Front. Plant Sci. 2019, 10, 225. [Google Scholar] [CrossRef] [PubMed] [Green Version]
  36. Miner, G.L.; Bauerle, W.L.; Baldocchi, D.D. Estimating the sensitivity of stomatal conductance to photosynthesis: A review. Plant Cell Environ. 2017, 40, 1214–1238. [Google Scholar] [CrossRef] [PubMed]
  37. Drake, J.E.; Raetz, L.; Davis, S.C.; Delucia, E.H. Hydraulic limitation not declining nitrogen availability causes the age-related photosynthetic decline in loblolly pine (Pinus taeda L.). Plant Cell Environ. 2010, 33, 1756–1766. [Google Scholar] [CrossRef] [PubMed]
  38. Steppe, K.; Niinemets, Ü.; Teskey, R.O. Tree size-and age-related changes in leaf physiology and their influence on carbon gain. In Size-and Age-Related Changes in Tree Structure and Function; Springer: Dordrecht, The Netherlands, 2011; pp. 235–253. [Google Scholar]
  39. Bao, J.T.; Wang, J.; Li, X.R.; Zhang, Z.S.; Su, J.Q. Age-related changes in photosynthesis and water relations of revegetated Caragana korshinskii in the Tengger desert, Northern China. Trees 2015, 29, 1749–1760. [Google Scholar] [CrossRef]
  40. Garg, A.; Bordoloi, S.; Ganesan, S.P.; Sekharan, S.; Sahoo, L. A relook into plant wilting: Observational evidence based on unsaturated soil–plant-photosynthesis interaction. Sci. Rep. 2020, 10, 22064. [Google Scholar] [CrossRef]
  41. Drake, J.E.; Davis, S.C.; Raetz, L.M.; DeLucia, E.H. Mechanisms of age-related changes in forest production: The influence of physiological and successional changes. Global. Change Biol. 2011, 17, 1522–1535. [Google Scholar] [CrossRef]
Figure 1. Thermographic analysis of the correlation among photosynthetic parameters, SWC and VPD of C. intermedia plantations in different afforestation years. Note: The numbers represent R2 correlation values.
Forests 14 00701 g001
Figure 2. Characteristics of photosynthetic parameters of the plantation.
Forests 14 00701 g002
Figure 3. Regression fitting diagram of Pn and SWC.
Forests 14 00701 g003
Figure 4. Regression fitting diagram of gs and SWC.
Forests 14 00701 g004
Figure 5. Regression fitting diagram of Tr and SWC.
Forests 14 00701 g005
Figure 6. Regression fitting diagram of WUE and SWC.
Forests 14 00701 g006
Figure 7. Regression fitting diagram of Ci and SWC.
Forests 14 00701 g007
Figure 8. Fitting curve between Ls value and SWC.
Forests 14 00701 g008
Table 1. Basic overview of the sample plot.
Afforestation YearsHabitatSoil TypeAltitud/mPlant Height/cmBase Diameter/cmCrown Width/%Vegetation Coverage/%Row Spacing/m
2013aSemi-fixed duneAeolian soil287384.27 ± 31.060.51 ± 0.0192.15 ± 20.38331
2011aSemi-fixed duneAeolian soil287795.33 + 12.450.71 + 0.02120.51 ± 7.29502
2008aFixed duneAeolian soil2886135.20 ± 10.040.74 ± 0.01124.28 ± 11.93622
2006aFixed duneAeolian soil2884145.00 + 5.771.46 + 0.03132.17 + 6.83702
2001aFixed duneAeolian soil2882165.60 ± 12.651.27 ± 0.01153.67 ± 24.30832
1986aFixed duneAeolian soil2883180.67 ± 42.431.50 ± 0.03178.33 ± 59.28712
Table 2. Meteorological indicators during the sampling period.
T (°C)RH (%)SR (mv/km·m−2)VPD (kPa)WS (m/s)
Mean17.8952.580.571.062.12
Stdev.p3.8017.220.230.570.73
CV21.2632.7640.3053.9334.20
Table 3. Correlation between photosynthetic parameters and afforestation years.
PnGsCiTrWueLs
Afforestation year−0.836 *−0.709−0.805−0.871 *0.820 *0.477
Note: significance levels: * p < 0.05, numbers represent R2 correlation values.
Table 4. SWC corresponding to extreme points of gas exchange parameters.
WCP-PnWCP-gsWCP-TrWSP-PnWSP-gsWSP-Tr
2013a3.623.643.317.197.166.74
2011a3.704.063.337.367.426.96
2008a3.633.383.087.918.117.37
2006a3.853.903.367.517.556.51
2001a4.022.131.458.198.178.72
1986a5.315.503.398.358.718.71
Table 5. Regression equation between photosynthetic parameters and SWC.
Afforestation YearModelFitting EquationFDFpR2
2013ay(Pn)~x(SWC)y = −0.713x2 + 12.423x − 35.640115.8115<0.00010.6624
y(gs)~x(SWC)y = −0.009x2 + 0.179x − 0.532119.9113<0.00010.6741
y(Ci)~x(SWC)y = −8.554x2 + 120.979x − 136.96917.87113<0.00010.2269
y(Tr)~x(SWC)y = −0.187x2 + 2.825x − 7.310437.94113<0.00010.3911
y(WUE)~x(SWC)y = −0.088x2 + 1.743x − 2.41814.31113<0.00010.1879
y(Ls)~x(SWC)y = 0.027x2 − 0.375x + 1.60713.9113<0.00010.1832
2011ay(Pn)~x(SWC)y = −0.594x2 + 11.289x − 33.62671.52113<0.00010.5509
y(gs)~x(SWC)y = −0.103x2 + 0.209x − 0.67777.85109<0.00010.5806
y(Ci)~x(SWC)y = −6.646x2 + 101.823x − 115.84416.76109<0.00010.2228
y(Tr)~x(SWC)y = −0.105x2 + 1.936x − 5.28442.28109<0.00010.4266
y(WUE)~x(SWC)y = −0.078x2 + 1.408x − 0.4105.07109<0.050.0684
y(Ls)~x(SWC)y = 0.017x2 − 0.316x + 1.77622.66109<0.00010.2807
2008ay(Pn)~x(SWC)y = −0.329x2 + 7.9913x − 24.493132.7114<0.00010.6943
y(gs)~x(SWC)y = 0.011x2 − 0.071x + 0.156200.7114<0.00010.775
y(Ci)~x(SWC)y = −11.052x2 + 149.467x − 250.61144.83110<0.00010.439
y(Tr)~x(SWC)y = −0.037x2 + 1.052x − 2.88591.53110<0.00010.6178
y(WUE)~x(SWC)y = −0.149x2 + 2.360x − 3.23823.07110<0.00010.2827
y(Ls)~x(SWC)y = 0.033x2 − 0.455x + 1.88647.36110<0.00010.4529
2001ay(Pn)~x(SWC)y = 0.142x2 + 4.030x − 17.64787.04111<0.00010.6036
y(gs)~x(SWC)y = 0.022x2 − 0.1735x + 0.3873114.7111<0.00010.6681
y(Ci)~x(SWC)y = −33.09x2 + 424.76x − 1084.0635.5111<0.00010.3791
y(Tr)~x(SWC)y = 0.148x2 − 0.997x + 2.77325.13111<0.00010.2992
y(WUE)~x(SWC)y = −0.475x2 + 6.753x − 17.52715.23111<0.00010.2012
y(Ls)~x(SWC)y = 0.076x2 − 1.040x + 3.96334.36111<0.00010.3712
2006ay(Pn)~x(SWC)y = −0.851x2 + 14.802x − 45.729100.3111<0.00010.6373
y(gs)~x(SWC)y = 0.007x2 − 0.029x + 0.065114.4111<0.00010.6675
y(Ci)~x(SWC)y = −16.178x2 + 218.225x − 481.93136.96111<0.00010.389
y(Tr)~x(SWC)y = 0.0215x2 + 0.2539x − 0.411767.69111<0.00010.5708
y(WUE)~x(SWC)y = −0.609x2 + 8.570x − 22.74636.48111<0.00010.3857
y(Ls)~x(SWC)y = 0.012x2 − 0.245x + 1.46728.51111<0.00010.3275
1986ay(Pn)~x(SWC)y = −1.077x2 + 21.437x − 83.468101.4112<0.00010.6379
y(gs)~x(SWC)y = 0.030x2 − 0.332x + 0.996116.5112<0.00010.6696
y(Ci)~x(SWC)y = −20.116x2 + 310.891x − 946.40422.82112<0.00010.2769
y(Tr)~x(SWC)y = 0.101x2 − 0.681x + 1.79042.63112<0.00010.4221
y(WUE)~x(SWC)y = −1.289x2 + 19.379x − 64.99825.12112<0.00010.2974
y(Ls)~x(SWC)y = −0.035x2 + 0.3965x − 0.5939.94112<0.00010.1356
Table 6. SWC threshold classification of photosynthetic parameters of C. intermedia.
Afforestation YearNPNEWWSP-PnWSP-WUEHPHAW
2013a3.31–3.64%7.19%6.65%6.65–7.19%
2011a3.33–4.06%7.36%6.74%6.74–7.36%
2008a3.08–3.63%7.91%7.36%7.36–7.91%
2006a3.36–3.85%7.51%6.10%6.10–7.51%
2001a1.45–4.02%8.19%6.57%6.57–8.19%
1986a3.39–5.50%8.35%6.52%6.52–8.35%
Table 7. Characteristics of SWC.
Afforestation YearMin-SWC (%)Max-SWC (%)Mean-SWC (%)Mode-SWC (%)
2013a4.059.76.014–5
2011a4.412.356.875–7
2008a3.12510.35.914–5
2006a3.9510.55.884–5
2001a3.4512.66.074–5
1986a5.1510.556.756–7
Disclaimer/Publisher’s Note: The statements, opinions and data contained in all publications are solely those of the individual author(s) and contributor(s) and not of MDPI and/or the editor(s). MDPI and/or the editor(s) disclaim responsibility for any injury to people or property resulting from any ideas, methods, instructions or products referred to in the content.

